Article

Investigation of Dynamic Coupling Coordination between Urbanization and the Eco-Environment—A Case Study in the Pearl River Delta Area

1
School of Geography, South China Normal University, Guangzhou 510631, China
2
Key Laboratory for Environmental and Urban Science, School of Urban Planning and Design, Shenzhen Graduate School, Peking University, Shenzhen 518055, China
3
Key Laboratory of Guangdong for Utilization of Remote Sensing and Geographical Information System, Guangdong Open Laboratory of Geospatial Information Technology and Application, Guangzhou Institute of Geography, Guangdong Academy of Sciences, Guangzhou 510070, China
4
Southern Marine Science and Engineering Guangdong Laboratory (Guangzhou), Guangzhou 511458, China
5
Joint Laboratory of Plateau Surface Remote Sensing, Tibet University, Lhasa 850000, China
*
Author to whom correspondence should be addressed.
Land 2021, 10(2), 190; https://doi.org/10.3390/land10020190
Submission received: 7 January 2021 / Revised: 5 February 2021 / Accepted: 10 February 2021 / Published: 13 February 2021
(This article belongs to the Special Issue Dynamic of Natural Ecosystems under Anthropogenic Disturbances)

Abstract

:
The interaction between urbanization and the eco-environment is usually viewed as an effect–feedback framework. Its coupling system is composed of urbanization and eco-environment subsystems. In this paper, the coupling degree (CD) and the coupling coordinated degree (CCD) are used to reflect the coupling interaction and coupling coordination between the urbanization subsystem and the eco-environment subsystem. Based on the dynamic relative quantities of urbanization and eco-environment data in the Pearl River Delta, CD and CCD values were calculated, and the spatiotemporal evolution trend of coordination was analyzed. The results show that (1) from 2000 to 2015, the nine cities in the Pearl River Delta had high CD values and CCD values. Though they had different performances in different periods, they were all in a coordinated class, including good coordination (GC), moderate coordination (MC), and bare coordination (BC). (2) In terms of temporal evolution, the coupling coordination between urbanization and the eco-environment in the entire Pearl River Delta greatly improved. (3) From the perspective of spatial distribution, the coupling coordination of the central region was higher than that of the peripheral regions, and that of the west bank of the Pearl River was higher than that of the east bank of the Pearl River. These results can help local policy makers enact appropriate measures for sustainable development.

1. Introduction

Rapid urbanization, one of the most important socioeconomic phenomena in the contemporary world, has profoundly impacted the eco-environment. Urbanization is a process of social and economic transformation. It includes not only the decrease in the agricultural population, the continuous expansion of the urban population, and the expansion of urban land to the suburbs, but also the process of urban social, economic, and technological changes entering the countryside [1,2]. The eco-environment refers to the integration of natural factors that affect human survival and development, including the integration of other environmental factors, such as water, soil, atmosphere, resources, energy, and other organisms [3]. While urbanization has brought developmental momentum, it has also brought many problems. Urbanization has led to rapid population growth and rapid economic development, resulting in the exhaustion of resources and the consumption of large amounts of energy. This has led to unreasonable land use and overburdened land. The eco-environment is being severely damaged; at the same time, the destruction of the eco-environment has also led to constraints on urban development. Therefore, the coupling relationship between urbanization and the eco-environment becomes a prominent topic faced by human society and regional economic development.
The interactive coupling relationship between urbanization and the eco-environment exists objectively. Rapid urbanization has greatly improved life and society. On the other hand, it has also produced eco-environmental effects and incipient crises in food, water and energy availability, from air pollution to declining public health standards [4,5]. This phenomenon will put the future achievement of "sustainable development" in jeopardy. To cope with the challenges faced in achieving sustainable development, the Sustainable Development Goals (SDGs) were set as Global Goals by 2030, which were adopted by all United Nations Member States in 2015 [6]. Quantification of the coupling coordination between urbanization and the eco-environment is a critical step to reaching these goals. It is hoped that our findings will accurately identify the spatial distribution pattern of the coupling coordination between urbanization and the eco-environment, which will assist policymakers to promote the coordination of these two factors and, ultimately, to realize future sustainable development.
Many studies have focused on the topic of the coupling relationship between urbanization and the eco-environment from qualitative and quantitative perspectives. Several methods have been used, including the coupling coordination model [7], the gravity model [8], the ecological footprint and comprehensive development index [9], and so forth. For example, Li, et al. [7] evaluated sustainability among economic, social and environmental subsystems using the coupling coordination model. Wu et al. [8] adopted the gravity center model to analyze the overall coupling situation between urbanization and changes in the eco-environment. The coupling coordinated model is the most popular method for its simplicity and objectivity. It has been applied at different scales, such as to cities [1,7,10], urban agglomerations [8,11], regions [12,13], countries [14], and the world [5]. For example, Fan et al. [10] examined the coupling coordinated development situation among vital urban areas; in China’s 31 provincial capital cities, they found Beijing, Hangzhou, etc., showed the best coupling coordinated degrees, presenting a harmonious relationship between advanced social economy and sound eco-environment. Wang et al. [11] focused on the interactive coercing relationship and coupling coordination degree between urbanization and the eco-environment in the Beijing–Tianjin–Hebei region by using an interactive coercing model followed by a dynamic coupling coordination degree model to estimate the relationship. Zhao et al. [5] established an integrated evaluation index system and a dynamic coupling coordination degree model in order to investigate the global coupling relationship between urbanization and the environment system based on the data collected from the World Bank for 209 countries and regions all over the world.
In previous studies, the Pearl River Delta is a region which gained much attention. As a rapidly urbanizing area, the Pearl River Delta faces a contradiction between urbanization and the eco-environment, which is manifested by the decline in the quantity and quality of natural resources, the increase in urban environmental pollution, and the deterioration of the natural eco-environment, which has severely restricted the sustainable development of the region [15,16,17,18].Thus, some studies have addressed the spatial differentiation characteristics of the coordination between urbanization and the eco-environment in the Pearl River Delta [8,13]. However, coordination is generally calculated based on the status quo data, and not on incremental data. The status quo data reflect the attributes of a certain time, while incremental data reflect the attributes of a process. Since urbanization and eco-environmental change are both dynamic processes, research that considers incremental data can better demonstrate the coordination of these changes. In view of this fact, an evaluation of the coupling coordination between urbanization and the eco-environment based on incremental data will be produced. Specifically, the Pearl River Delta is the area under investigation. Our objectives were multifold as follows: (1) to establish the indicators of the urbanization subsystem and the eco-environment subsystem based on incremental data; (2) to quantify the coupling degree (CD) and the coupling coordinated degree (CCD) between urbanization and the eco-environment in the different periods of 2000–2005, 2005–2010, 2010–2015; (3) to analyze the spatiotemporal evolution trend of coupling coordination in the Pearl River Delta, and compare this with the results of previous studies.
The rest of this paper is organized as follows. Section 2 describes the materials used in this paper and the methodology, including the selection and the weights of indicators under the subsystems and the implementation of CD and CDD models. Section 3 presents the results of the coupling coordination based on the models proposed in Section 2. Discussions are then presented in Section 4 and the main conclusions of this paper are summarized in Section 5.

2. Materials and Methods

2.1. Study Area

The Pearl River Delta area, located in south China, is a humid, subtropical region. It was studied as an example area due to its dramatic urbanization over the past three decades. The concept of the Pearl River Delta was first proposed on 8 October 1994, and the Guangdong Provincial Party Committee proposed the construction of the Pearl River Delta Economic Zone at the Third Plenary Session of the Seventh Central Committee. The Pearl River Delta has 9 cities, including Guangzhou, Shenzhen, Zhuhai, Foshan, Zhaoqing, Huizhou, Jiangmen, Dongguan, and Zhongshan, with a total area of 56,000 km2, as shown in Figure 1. As of 2019, the GDP of the Pearl River Delta reached 8.68 trillion yuan. It is one of the regions with the highest economic vitality and openness in China and has an important strategic position in the overall development of the country. On 18 February 2019, the Central Committee of the Communist Party of China and the State Council issued the “Outline of the Guangdong–Hong Kong–Macao Greater Bay Area Development Plan”. According to the outline, 9 cities in the Pearl River Delta, the Hong Kong Special Administrative Region, and the Macao Special Administrative Region have jointly established the Guangdong–Hong Kong–Macao Greater Bay Area.

2.2. Methods

In order to evaluate the coupling coordination between urbanization and the eco-environment, the coupling degree (CD) and coupling coordinated degree (CDD) models have been used. Before these two models are applied, a comprehensive index system must be established. Here, we established the urbanization subsystem and the eco-environment subsystem based on incremental data.

2.2.1. Data Acquisition and Preprocessing

The data on urbanization and the eco-environment selected in 2000, 2005, 2010 and 2015 come from the statistical yearbooks of the nine local cities in the Pearl River Delta area. A total of 36 statistical yearbooks were used. Eleven indicators in the four aspects of population urbanization, economic urbanization, land urbanization, and social urbanization constitute the urbanization subsystem, and the five indicators selected in the eco-environment system focus on green space and environmental pollution. In this study, a total of 16 representative indicators were selected as the basic indicators for evaluation.
The dynamic relative quantity, a dynamic comparison of two values of the same index in different time periods, was used to demonstrate the incremental degree of the index. The calculation formula is:
Q = V b V a × 100 %
where Q is the dynamic relative quantity, which is usually expressed as a percentage (%) or multiple, and V a and V b are the values of a specific index at the beginning of the time period and the end of the time period respectively. In this study, the dynamic relative quantities of 2000–2005, 2005–2010, 2010–2015 were calculated based on the original data (See Table A1, Table A2, Table A3, Table A4, Table A5, Table A6, Table A7, Table A8 and Table A9 in Appendix A).
The original data and the dynamic relative quantities had different dimensions and orders of magnitude. In order to exclude the influence of these factors, the data needed to be standardized. The smaller the environmental pollution index, the higher the eco-environment level. Compared with other indicators, this was a "negative index" and required special treatment. In this study, the dispersion normalization method was used to normalize the original data to the range of [0, 1], and the calculation formula is [1]:
x ^ ij = { x ij     m i n ( x j ) m a x ( x j )     m i n ( x j )           Positive   indicator m i n ( x j )     x ij m a x ( x j )     m i n ( x j )             Negative   indicator
where x ^ ij is the value after standardization, x ij is the value of index j in year I, and m i n ( x j ) and m a x ( x j )   are respectively the minimum and maximum values of index j in all years.

2.2.2. Implementation of Methodology

The implementation method of this study includes two parts.
Part 1: Selection of indicators under the subsystems, giving weights.
Correct selection of evaluation indicators and reasonable measurements were the basis of systematic analysis and evaluation. With reference to the indicators used more frequently in previous studies, the evaluation index system for the coordination of urbanization and eco-environment was divided into the urbanization subsystem and the eco-environment subsystem. The urbanization subsystem, was divided into four aspects: population urbanization, economic urbanization, land urbanization, and social urbanization. The eco-environment subsystem was divided into two aspects: state of the eco-environment and environmental pollution level. Several representative indicators were selected as the basic indicators for evaluation. Here, the analytic hierarchy process [19] was used to calculate the weights of the indicators. The indicator system is shown in Table 1.
Part 2: Implementation of CD and CDD models.
The urbanization level and eco-environment improvement level were first calculated according to the normalized value and the weight of each index:
u ( x ) = i = 1 n a i x i
e ( y ) = i = 1 n b i y i
where u(x) and e ( y ) are the urbanization level and eco-environment improvement level, respectively, x i and y i represent the normalized index values of the urbanization subsystem and the eco-environment subsystem based on the dynamic relative quantities, and a i   and b i represent the corresponding weights. According to the analysis of the concept of coordination, it is hoped that the smaller the difference between u(x) and e(y), the better. Here, coordination degree (CD) was introduced to measure the coordination degree of urbanization and the eco-environment [1,20,21]:
C D = { u ( x ) e ( y ) [ u ( x ) + e ( y ) 2 ] 2 } k
where k is the adjustment coefficient, k ≥ 2. Since we evaluated the coordination relationship between the urbanization system and the eco-environment system, k = 2. The value range of CD is [0, 1]; the larger the value, the higher the level of the coupling between urbanization and the eco-environment. When the maximum value of 1 is reached, this indicates the best coupling state; otherwise, it is less coupled. On the basis of the coupling degree, a coupling coordinated degree model was introduced to further reflect the coordination of urbanization and the eco-environment [10,12,22,23]:
C D D = C D × T
T = α u ( x ) + β e ( y )
where CDD is the coupling coordinated degree, and T is the evaluation index of the comprehensive level of urbanization and the eco-environment. CCD can be used to quantitatively evaluate and compare the coupling coordination of urbanization and the eco-environment in different spatial units or different periods of the same unit; α and β are undetermined weights. Referring to previous related research, the urbanization of the cities in the Pearl River Delta was found to be consistent with the eco-environment. Thus, α =   β = 0.5 in this paper.
In order to make a quantitative assessment of the coupling coordination of urbanization and the eco-environment, we divided the coupling coordination level of urbanization and the eco-environment into eight classes and 24 specific types according to the CDD value and the difference between u(x) and e(y). When the CDD value is above 0.5, it belongs to the class of coordinated development; otherwise, it belongs to the class of imbalanced development. If u ( x ) e ( y ) > 0.1 , the development of the eco-environment subsystem is lagging behind the urbanization subsystem; while if e ( y ) u ( x ) > 0.1 , the development of the urbanization sub-system is lagging behind the eco-environment subsystem; when the difference between u(x) and e(y) is less than 0.1, this means that the urbanization subsystem and the eco-environment subsystem develop synchronously. The specific classification criteria are shown in Table 2.

3. Results

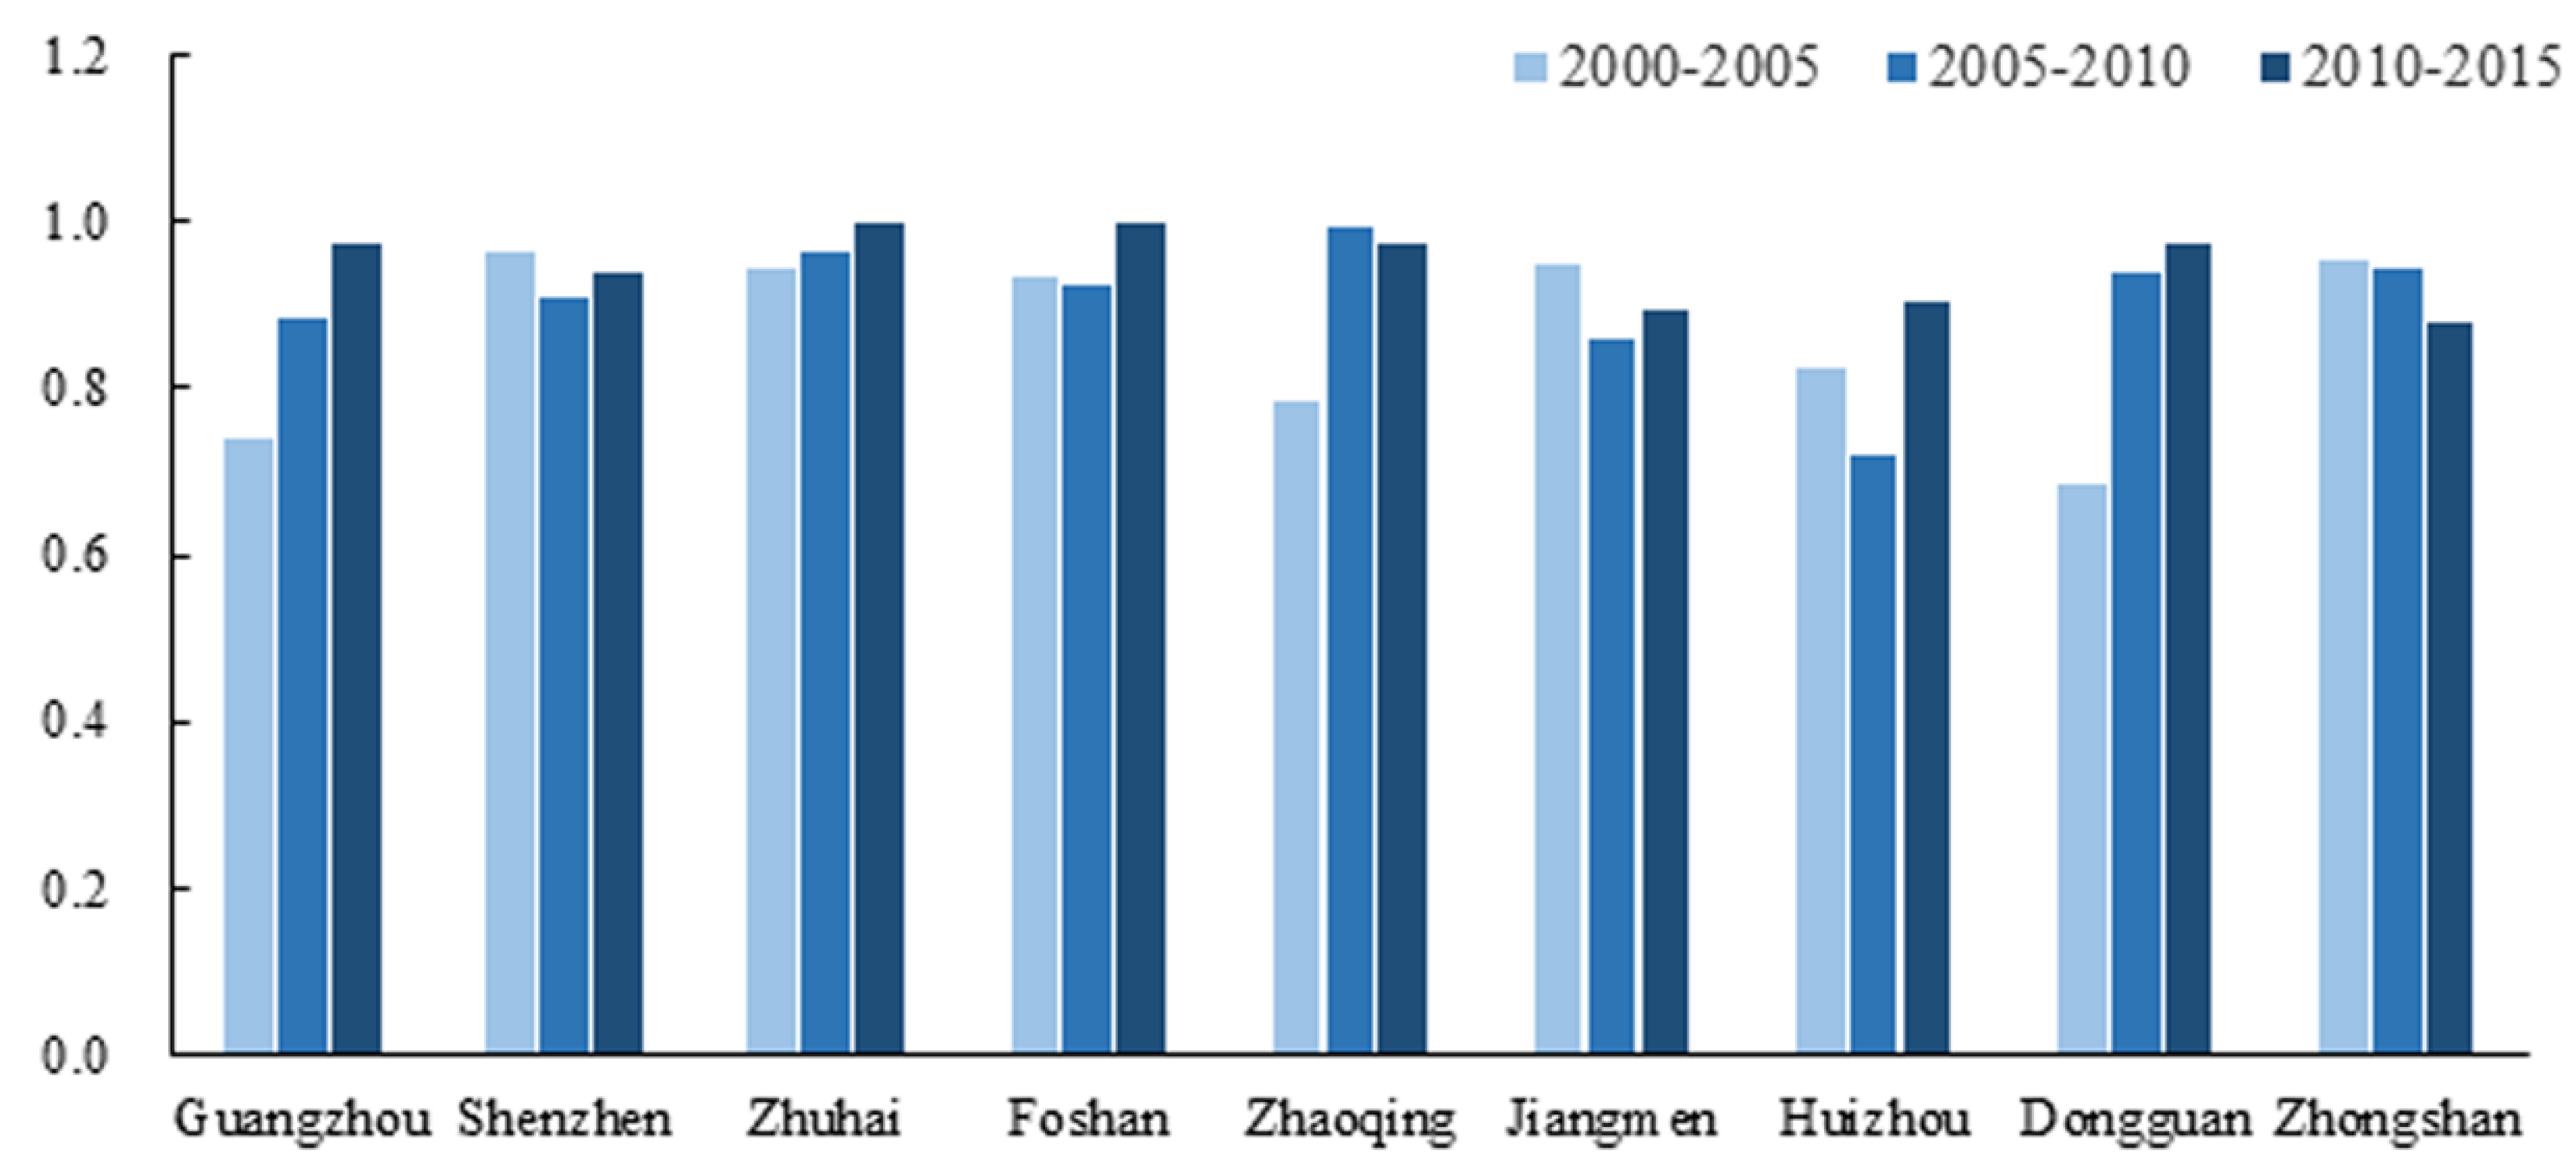
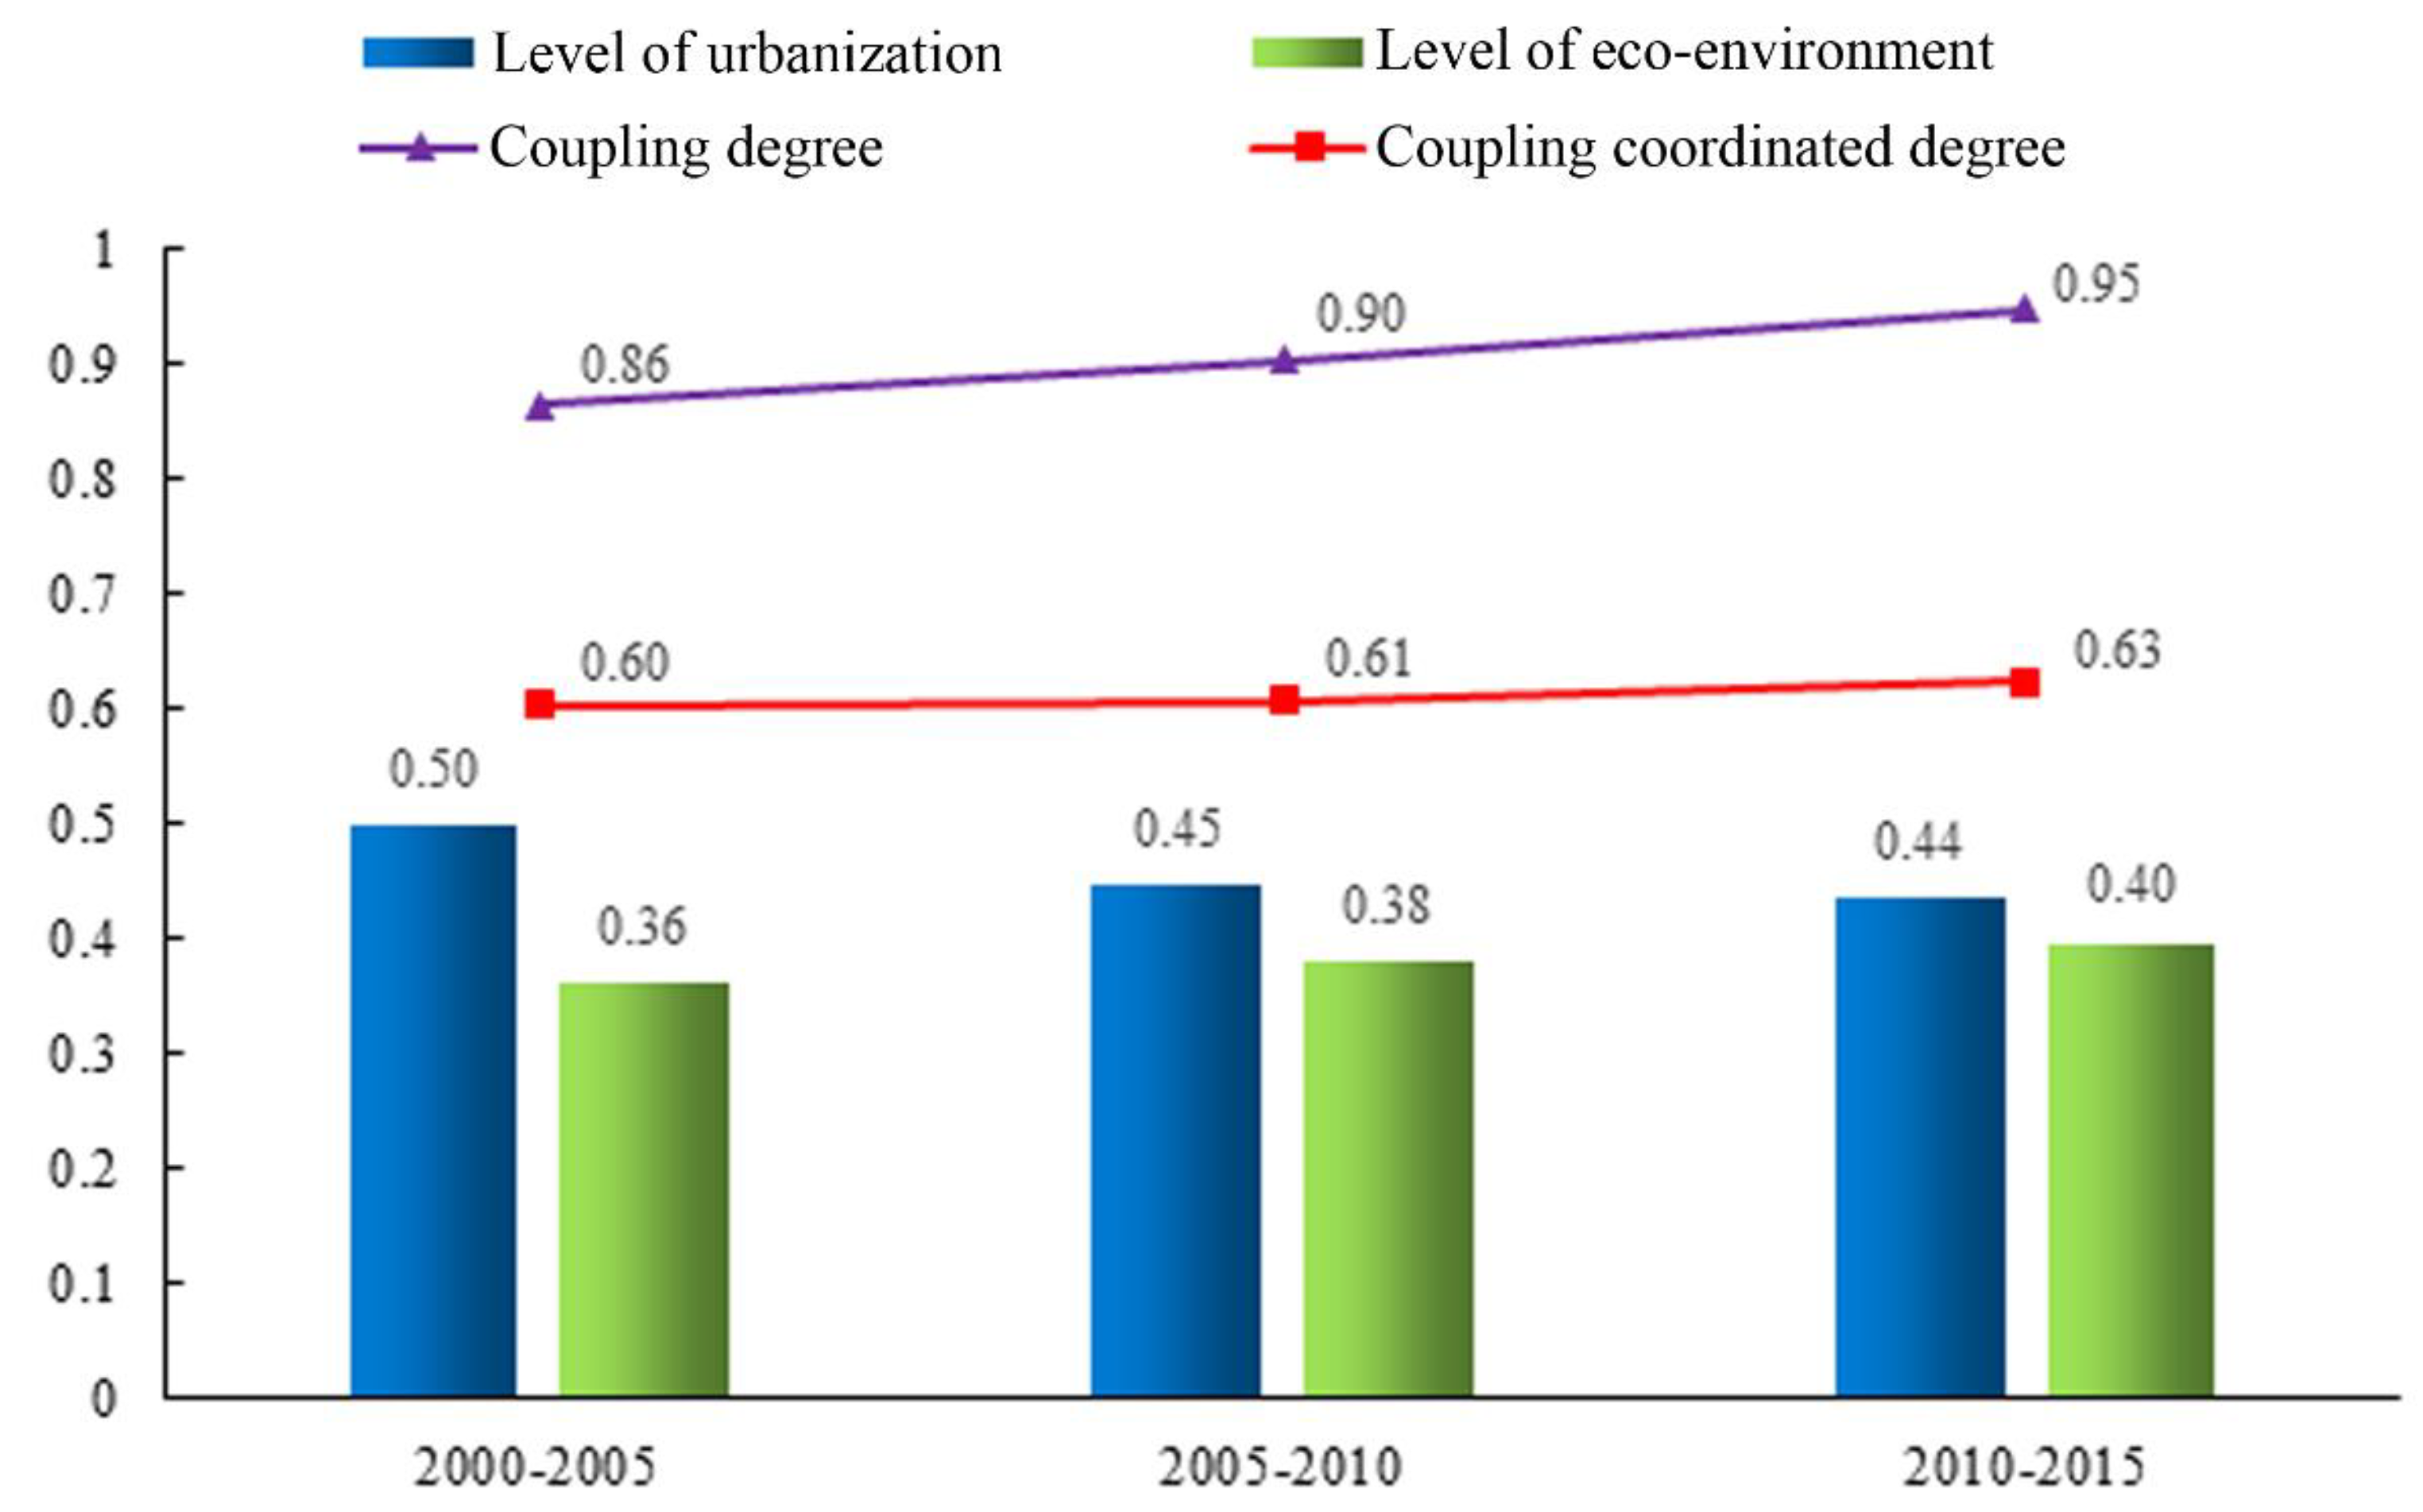
3.1. CD of Urbanization and the Eco-Environment

According to the model of urbanization level and eco-environment development level, separate comprehensive evaluation results of the urbanization level and eco-environment development level were obtained. Further, the CD values of urbanization and the eco-environment of nine cities in the Pearl River Delta from 2000 to 2005, 2005 to 2010, and 2010 to 2015 were calculated, as shown in Table 3. The change trend is shown in Figure 2.
In terms of ranking, the cities in the Pearl River Delta rank from high to low as Zhuhai, Foshan, Shenzhen, Zhongshan, Zhaoqing, Jiangmen, Dongguan, Guangzhou, and Huizhou. The cities with an upward trend include Guangzhou, Zhuhai, Foshan, and Dongguan.
From the numerical point of view, the overall coupling degree of all cities in the Pearl River Delta was relatively high. Among them, the CD values of Shenzhen, Zhuhai, and Foshan were above 0.9. while Guangzhou, Zhaoqing, Huizhou, and Dongguan had a low coupling degree during 2000–2005. With the continuous development of the eco-environment, they exceeded 0.9 during 2010–2015. The coupling degree between Jiangmen and Zhongshan was high in 2000–2005 but later fell below 0.9.
From the perspective of spatial distribution (Figure 3), the number of cities with a CD value greater than 0.9 gradually increased, and almost full coverage was achieved in 2010–2015. Overall, from 2000 to 2005, the coupling degree of the west bank of the Pearl River was better than that of the east bank of the Pearl River. The four cities on the west bank of Foshan, Zhongshan, Zhuhai, and Jiangmen were the first to achieve coupling results with a CD value greater than 0.9, compared with only Shenzhen on the east bank of the Lower Pearl River, which was slightly inferior. From 2005 to 2010, cities with a CD value above 0.9 on the east bank of the Pearl River gradually improved to two, and the gap with the west bank was narrowing. By 2015, the coupling degree of all cities on the east bank was greater than 0.9, while the CD values of Zhongshan and Jiangmen on the west bank were slightly behind. On the whole, the CD value of urbanization and the eco-environment of most cities in the Pearl River Delta was greater than 0.9, and the coupling degree was very high.

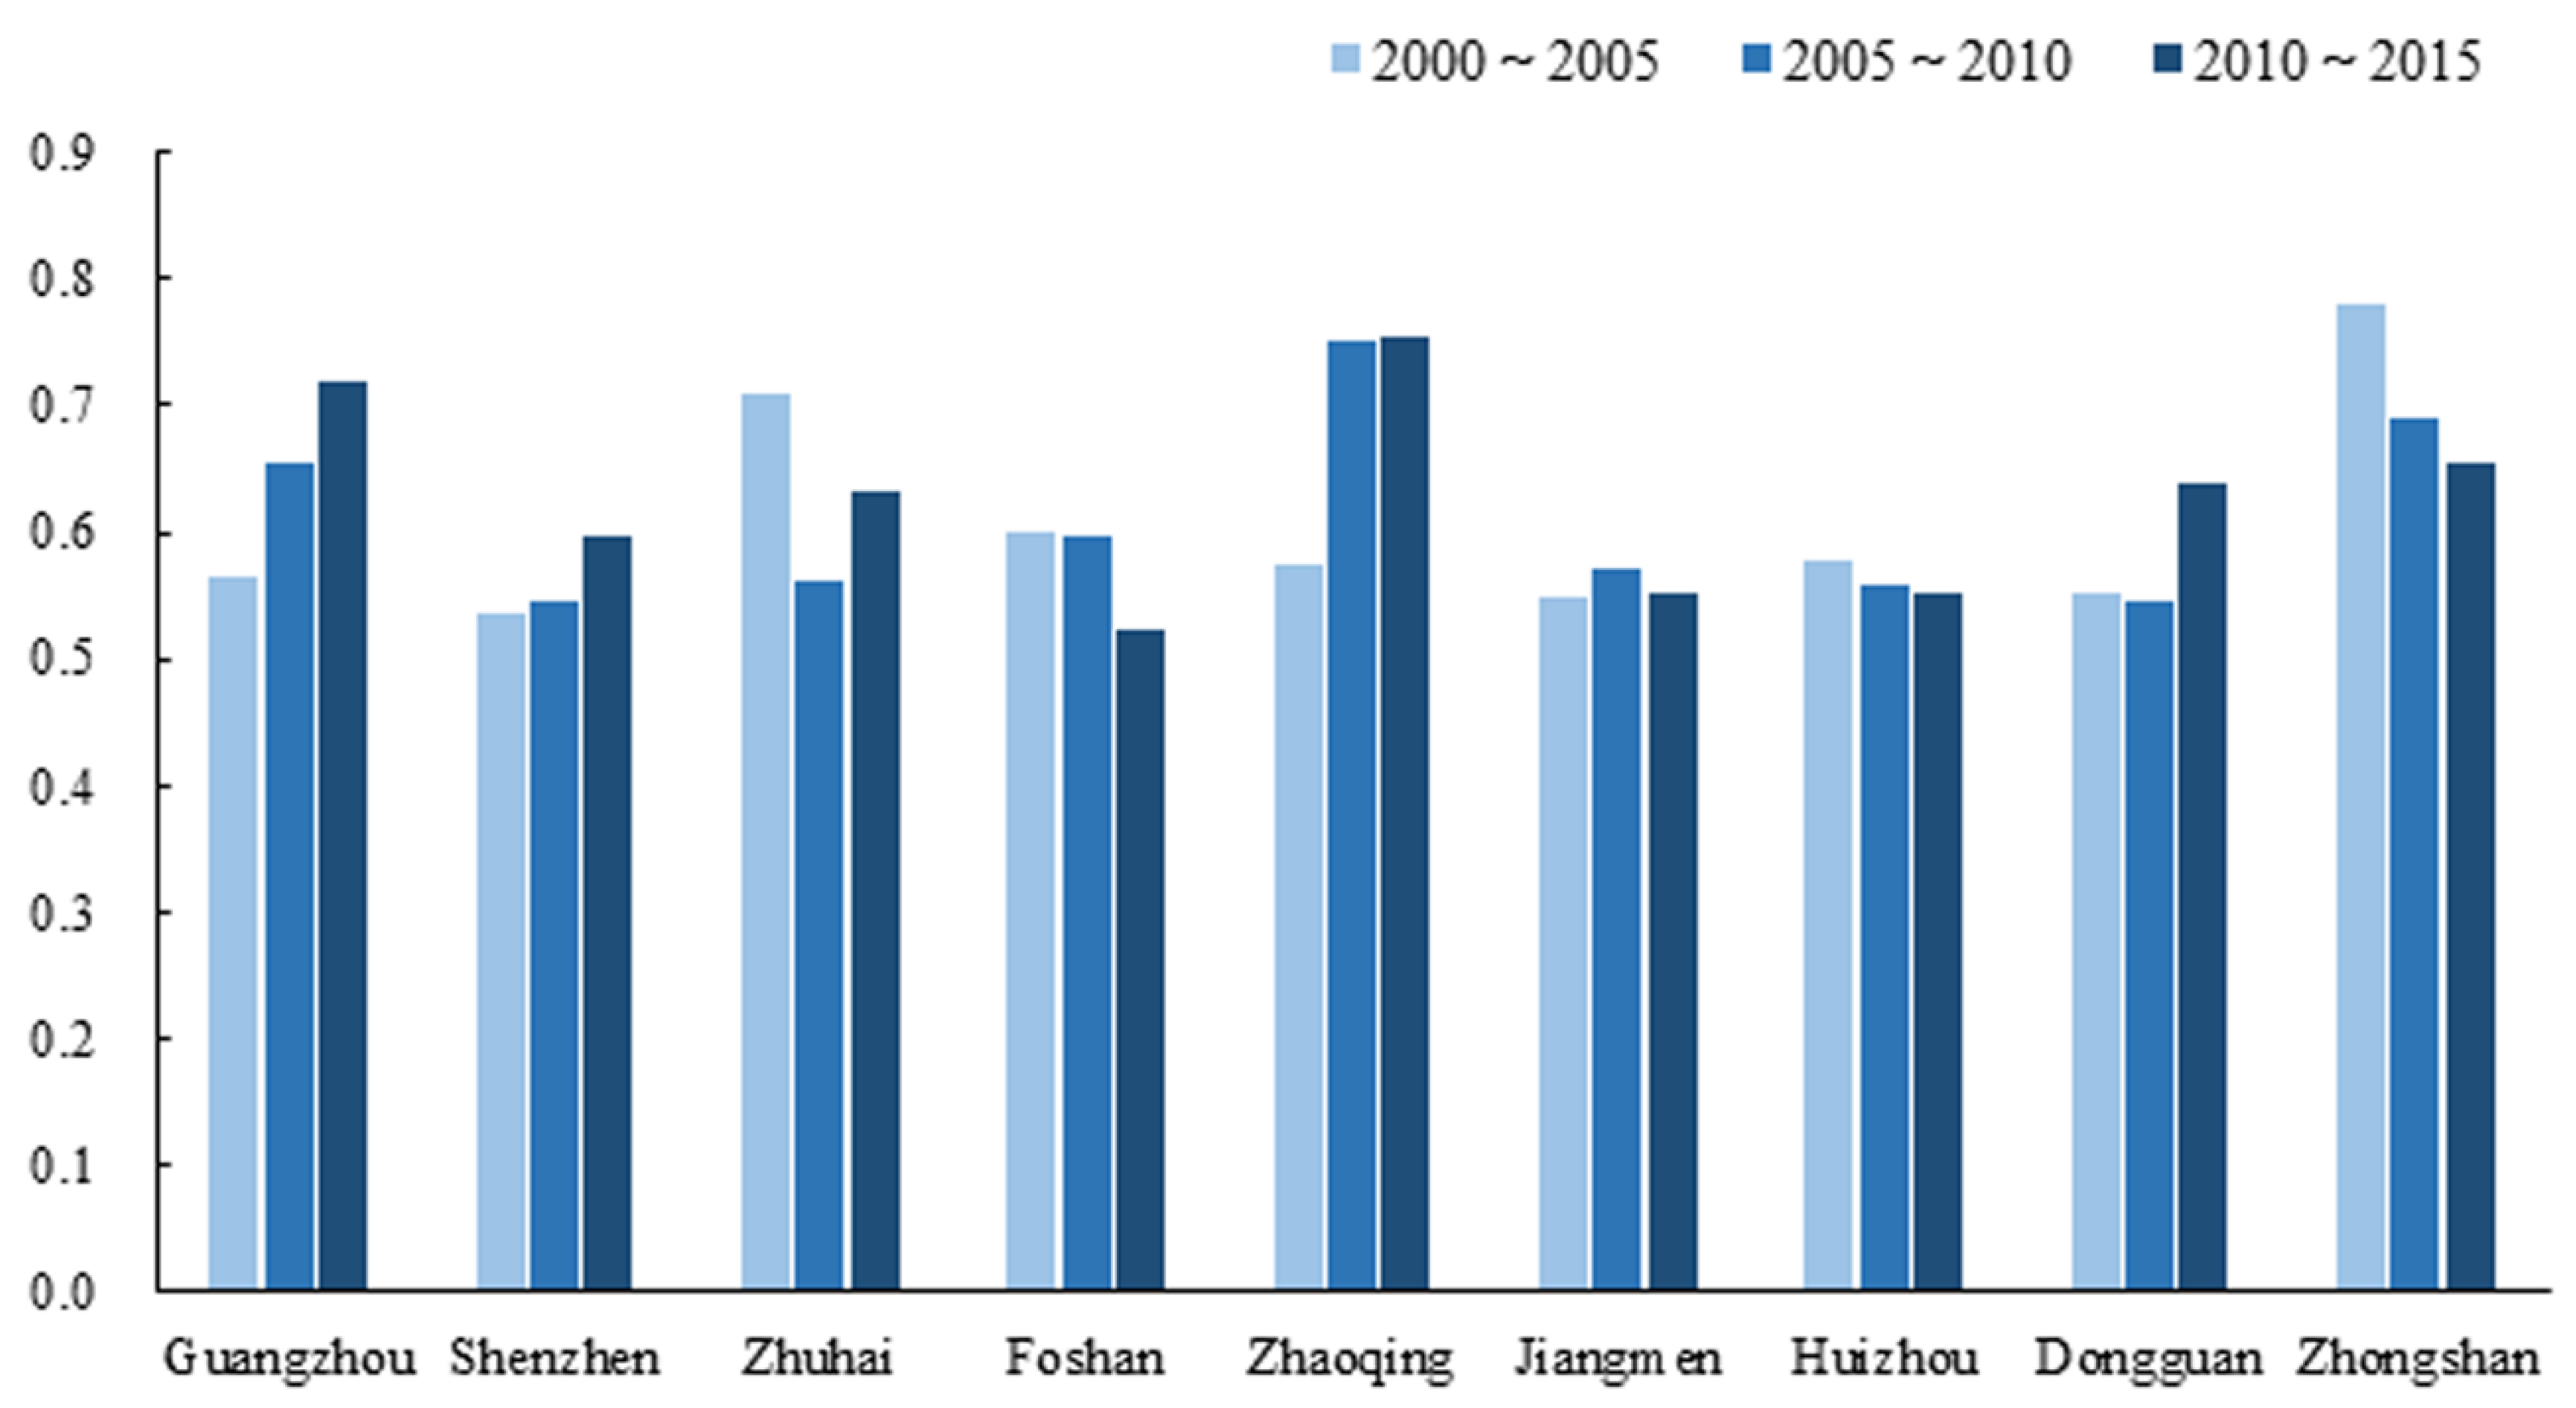
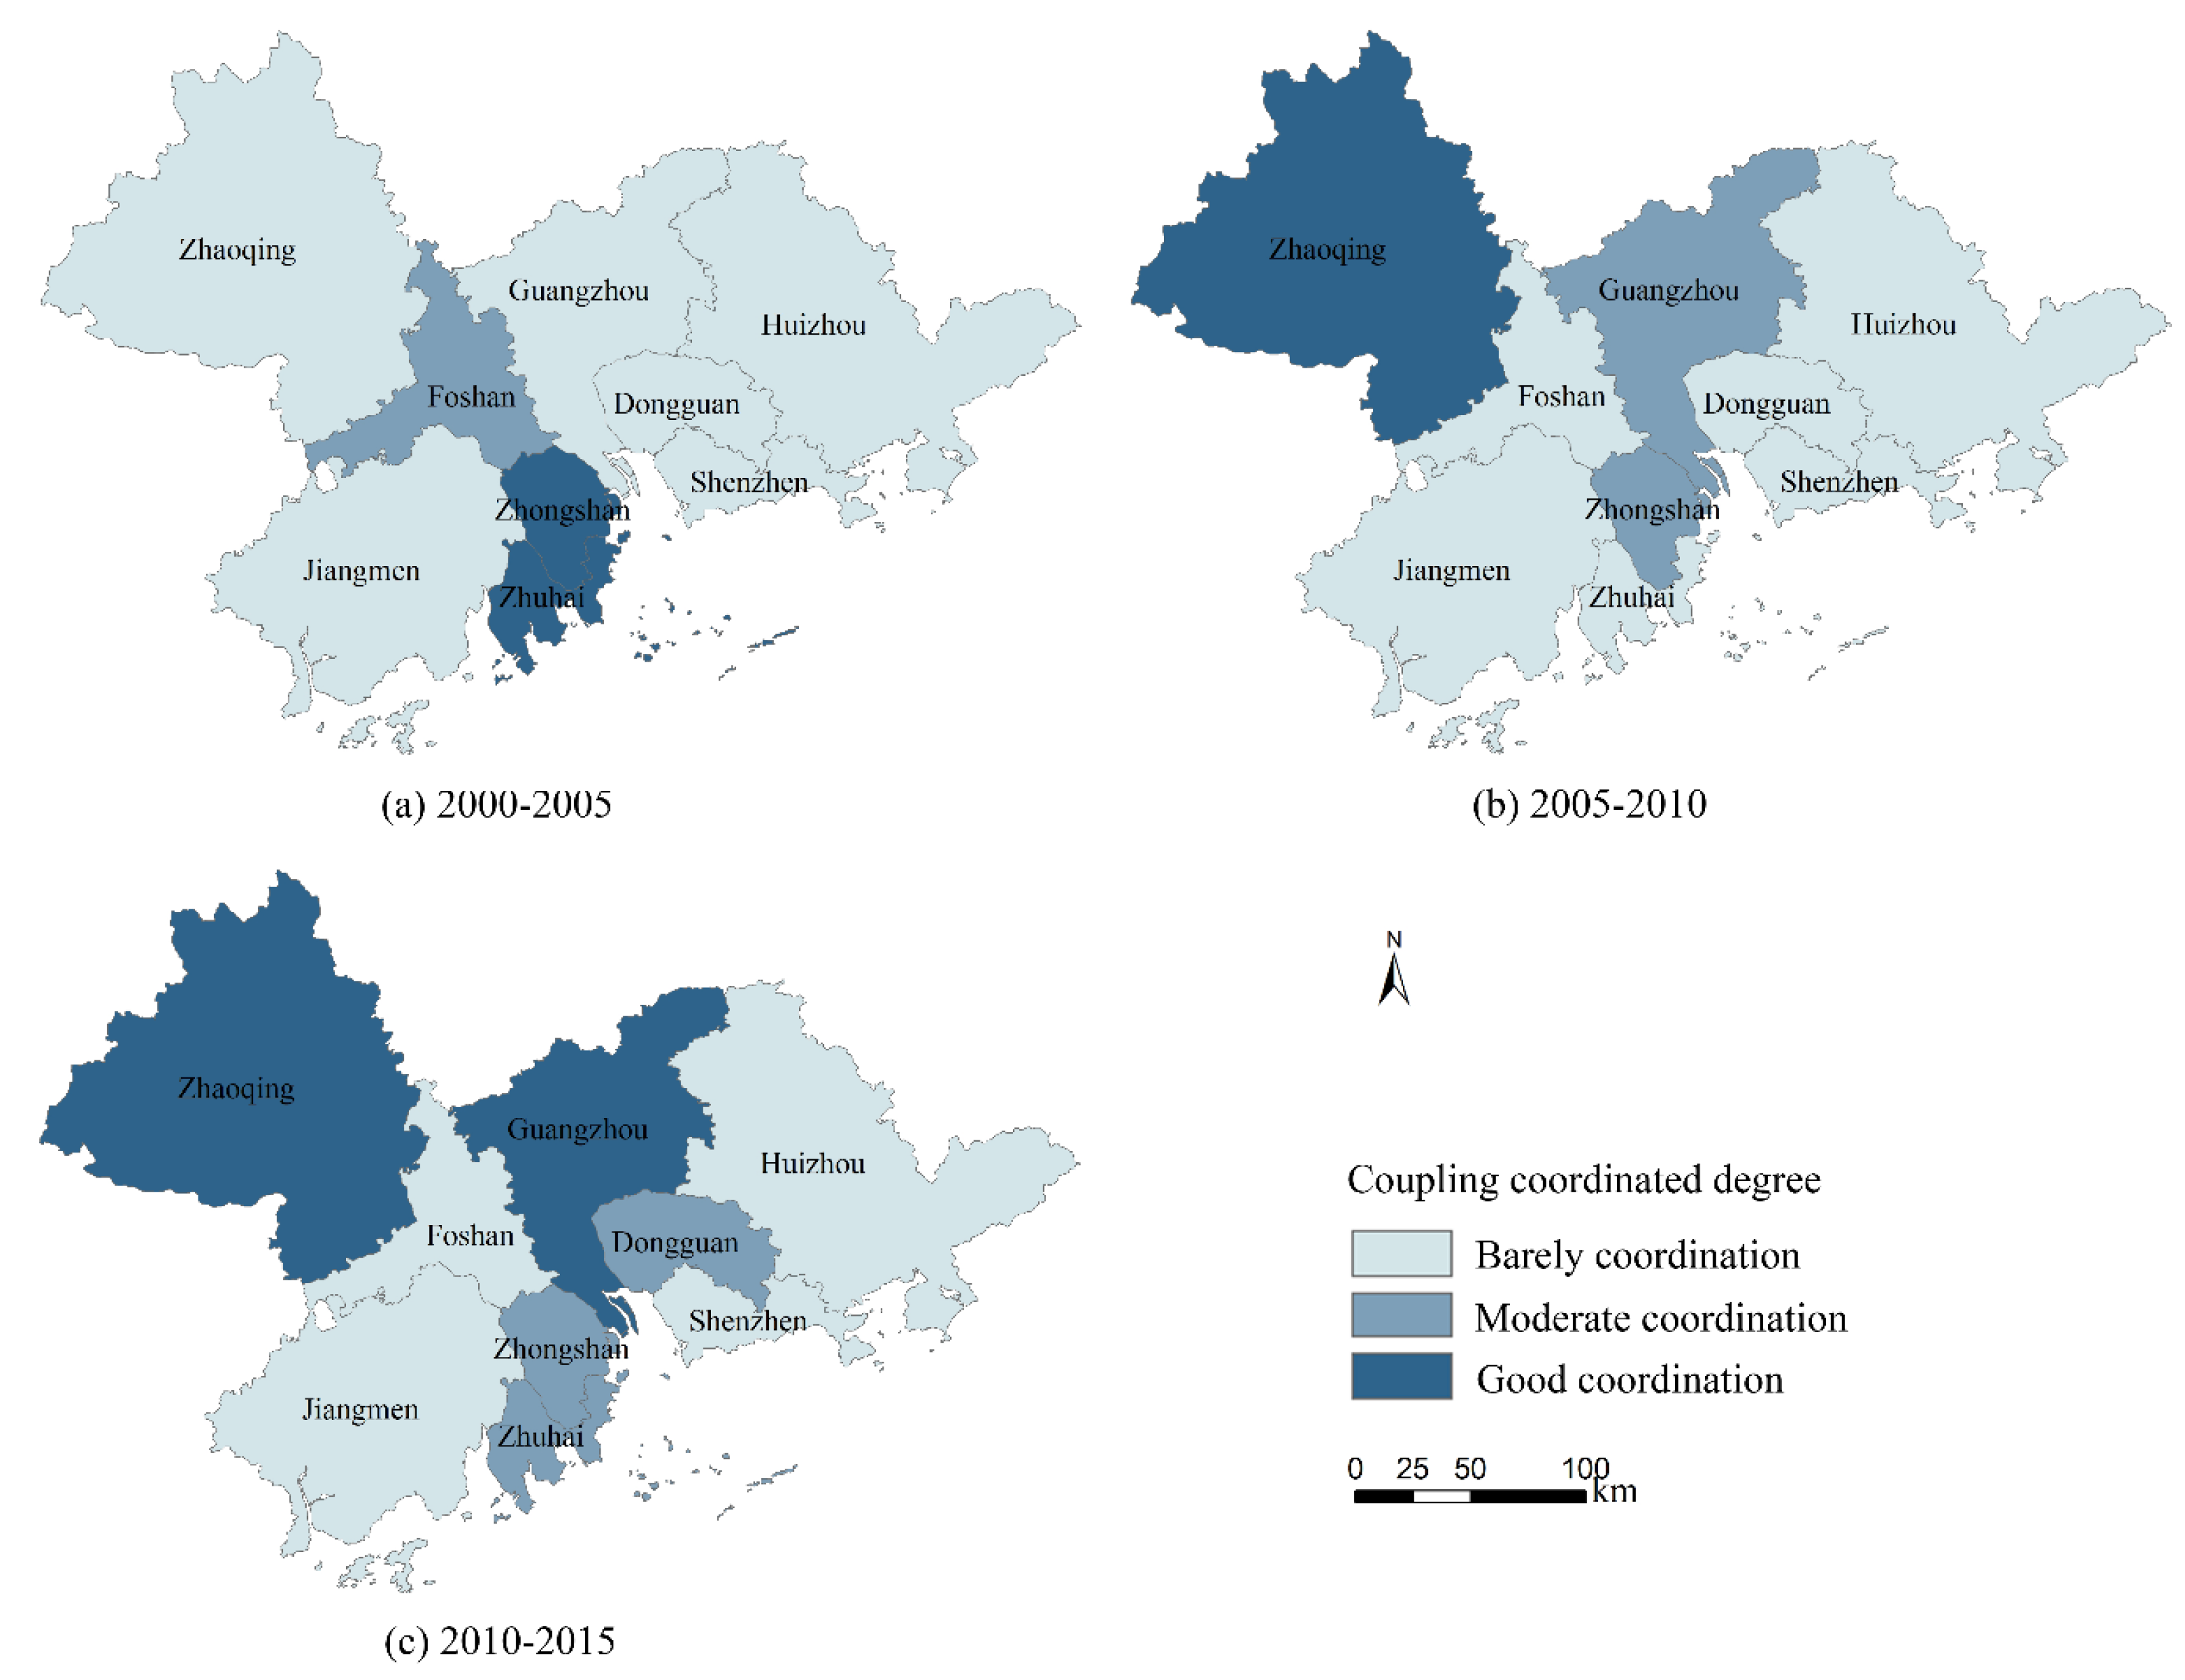
3.2. CDD of Urbanization and the Eco-Environment

According to the CDD formula and the classification criterion, the CDD values and the types of coupling coordination of nine cities in the Pearl River Delta in different periods were obtained, as shown in Table 4, and the changes are shown in Figure 4.
Judging from the rankings, the cities in the Pearl River Delta rank from high to low as Zhongshan, Zhaoqing, Guangzhou, Zhuhai, Dongguan, Foshan, Huizhou, Shenzhen, and Jiangmen. All of the CDD values of the nine cities in the Pearl River Delta are above 0.5; that is, they all belong to the class of coordinated development.
Guangzhou: the CCD rank of Guangzhou rose from sixth place during 2000–2005 to third and second places, with CCD values of 0.57, 0.65, and 0.72, respectively. The initial specific type of the coupling coordination was ‘barely coordination’ for eco-environment lagging type (BC-EL), which progressed to ‘moderate coordination’ for urbanization lagging type (MC-UL) and ‘good coordination’ for urbanization lagging type (GC-UL).
Shenzhen: the class of the coupling coordination of Shenzhen continued to be ‘barely coordination’ (BC), with CCD values of 0.54, 0.55, and 0.59 in different times, respectively, while the type converted from synchronous development (SD) to eco-environment lagging type (EL).
Zhuhai: the CDD value of Zhuhai was relatively high, but it had regressed slightly over time, changing from good coordination (GC) to moderate coordination (MC), but the development of the eco-environment had become synchronous with urbanization since 2005.
Foshan: Although Foshan dropped from third to ninth place, and from MC to BC, its urbanization and eco-environment development tended to be synchronized.
Zhaoqing: this was the city with the largest increase in the coupling coordination, rising initially from fifth place to the top of the list, from BC to GC, and the development of the eco-environment changed considerably, from lagging behind urbanization to synchronizing with urbanization and finally surpassing urbanization.
Huizhou and Jiangmen: the coupling coordination of these two cities has always been in the stage of BC, with the eco-environment development gradually lagging behind urbanization.
Dongguan: this rose from seventh place to fourth place, from BC to MC, and the eco-environment evolved from lagging behind urbanization to synchronizing with urbanization.
Zhongshan: the average ranking of Zhongshan was the highest in the nine cities, and the coupling coordination was always above 0.65.
From a spatial perspective (Figure 5), the coupling coordination between urbanization and the eco-environment of cities in the Pearl River Delta is not spatially balanced. In general, the central region is higher than the peripheral regions, and the west bank of the Pearl River is higher than the east bank of the Pearl River. Guangzhou in the central region and Zhongshan and Zhuhai on the west bank of the Pearl River are higher, while Shenzhen and Dongguan on the east bank of the Pearl River are lower. Jiangmen and Huizhou in the outer regions have always been in a ‘barely’ coordination class, while Zhaoqing has a higher coupling coordination degree.
From 2000 to 2005, only the two west coast cities of Zhuhai and Zhongshan in the Pearl River Delta belonged to the GC class, Foshan belonged to the MC class, and others belonged to the BC class. From 2005 to 2010, only Zhaoqing belonged to the GC class, Guangzhou and Zhongshan were MC class, and other cities were BC class. From 2010 to 2015, the cities in the GC class were Guangzhou and Zhaoqing, and the number of MC-class cities had risen to three: Zhuhai, Zhongshan, and Dongguan. It can be seen that although the east bank has made great progress overall, there is still a gap between the coupling coordination degree of the east bank and the west bank.
Taking the Pearl River Delta as a whole, the average coupling coordination between urbanization and the eco-environment is shown in Figure 6. As time went on, the extent of difference between the level of urbanization and the eco-environment level gradually narrowed; as the former was decreasing, the latter was increasing. The CD value was 0.86, increasing to 0.90 and finally 0.95; the CCD values were 0.60, 0.61, and 0.63, respectively. Both the coupling interaction and the coupling coordination between urbanization and the eco-environment in the Pearl River Delta have greatly improved.

4. Discussion

The results of the current study show some similarities and differences with those in the literature. Mei et al. analyzed the temporal and spatial evolution of the coordinated development between the economy and the environment from 2000 to 2010 in the Pearl River Delta area [13]. Their results show that Shenzhen, Dongguan, and Guangzhou belong to the first level in the measurement of CD, while in this research, Zhuhai, Foshan, and Shenzhen are the cities with the highest CD values. In the measurement of CDD, the overall levels of Shenzhen, Guangzhou, Zhuhai, and Foshan are relatively high. According to the results of this paper, Zhongshan, Zhaoqing, Guangzhou, and Zhuhai have the highest CDD values. Obviously, these two results are not quite the same. On the one hand, the evaluation period is different; on the other hand, the two studies adopted different index systems. However, the central region of the Pearl River Delta has a higher level of coordinated development than the peripheral regions, which could be considered as a "center–periphery" structure in both studies.
Wu et al. also used the coordination index to determine the spatial differentiation characteristics of the coupling of urbanization and ecological environment changes in the Guangdong–Hong Kong–Macao Greater Bay Area from 2000 to 2018 [8]. According to their research, 620 township (street) units were divided into five categories: superiorly coupled, barely coupled, slightly uncoupled, moderately uncoupled, and seriously uncoupled. Although the evaluation scales of the two papers are different, there are many similarities in the results. Both studies proved that the overall coordination of the Pearl River Delta area showed an improving trend from 2000 to 2015. However, a decreasing number of coupled units in the entire region may occur when studying the coordination at a finer scale. This is because data obtained at a finer scale (such as remote sensing images) have greater spatial heterogeneity, while using statistical data treats the region as a whole and simply reflects the average coordination during a specific period.
According to the current findings, both Zhuhai and Shenzhen have high CD values, but it is obvious that the CCD value of Zhuhai is higher than that of Shenzhen. These two cities are both special economic zones and adjacent to Hong Kong and Macao. They have a high level of economic development and attract population migration and economic activities. However, Zhuhai seems to outperform Shenzhen in terms of eco-environment improvement [3,24]. The specific type of coupling coordination from synchronous development type (SD) to eco-environment lagging type (EL) indicated that Shenzhen has gradually failed to keep up with the speed of urbanization regarding its eco-environment improvement [24,25,26]. Although the CDD value of Zhuhai has regressed slightly, the development of the eco-environment was synchronized with urbanization. This could be attributed to the sustainable development strategy implemented across Zhuhai’s economy, society, population, resources, and environment [27,28]. As the provincial capital city, Guangzhou has made an enormous achievement in eco-environmental protection as well as construction, converting the class of coupling coordination from ‘barely’ coordination (BC) to good coordination (GC), and from eco-environment lagging type (EL) to urbanization lagging type (UL). On the whole, both the coupling interaction and the coupling coordination between urbanization and the eco-environment in the Pearl River Delta have been greatly improved. The greatest contribution to the continuous improvement of the coordination of the Pearl River Delta area is regional planning in the past, such as industrial park planning, greenway planning, high-quality life circle planning, and so on. The purpose of such planning is to effectively guide and reshape sustainable development and improve the quality of the eco-environment [29]. However, the eco-environment level is still lower than the level of urbanization, and the type of coupling coordination has always stayed at the MC stage, which could be continuously improved. During the implementation of planning, cities could change their development modes and follow the concept of scientific development. For example, they could adjust the overall urban planning and industrial layout in a timely manner, adhering to the unity of economic, social, and ecological benefits to achieve sustainable development. They could rationally adjust their industrial structure and focus on developing high-tech industries with high economic benefits and less pollution. They could rely on scientific and technological progress and pay close attention to the prevention and control of industrial pollution. They could continue to plant trees, return farmland to forests and grasslands, expand green areas, and ensure harmony between man and nature.
From the perspective of incremental indicators, this study quantitatively examined the coupling coordination of urbanization and the eco-environment. The selected indicators may be imperfect and need to be further explored; however, the study is a new attempt applied to the Pearl River Delta, which is a sensitive area of urbanization. This study analyzed the spatial pattern differentiation of the coupling coordination between urbanization and the eco-environment. However, the underlying reasons and driving forces of this differentiation remain to be further examined.

5. Conclusions

This study comprehensively used the coupling degree and coupling coordinated degree models to quantitatively evaluate the coupling coordination between urbanization and the eco-environment. It is different from most previous studies in that it innovatively used all incremental indicators in the indicator system, which is different from the current status quo values used in the past.
The main results of this study are as follows: (1) During the study period, the coupling interaction of nine cities in the Pearl River Delta showed different performances. The average coupling interaction of the entire Pearl River Delta was constantly rising. (2) There were no cities in an imbalanced state. The nine cities in the Pearl River Delta were all in a coordinated class, including GC, MC, and BC. The average coupling coordination of the entire Pearl River Delta has greatly improved, but most types belonged to EL, indicating that eco-environment improvement still lags behind the urbanization. (3) The coupling interaction on the west bank of the Pearl River was generally higher than that on the east bank in the early part of the study period. However, in the later period, the coupling interaction of the east bank surpassed that of the west bank. The spatial pattern of the coupling coordination in the Pearl River Delta is that the central region is higher than the peripheral regions, and the west bank of the Pearl River is higher than the east bank of the Pearl River.
In this study, the indicator system for evaluating the coupling coordination between urbanization and the eco-environment was built based on incremental data. The Pearl River Delta was taken as an example to quantify the coupling degree (CD) and the coupling coordinated degree (CCD) between urbanization and the eco-environment from 2000 to 2005, 2005 to 2010, and 2010 to 2015. In addition, their spatial and temporal characteristics and evolution law were analyzed. The results will help local policy makers enact appropriate measures for sustainable development. The balance between urbanization and the eco-environment should be created and maintained, especially at the high-speed stage of urbanization.

Author Contributions

Conceptualization, S.Z. and F.F.; methodology, C.S. (Caige Sun); investigation and resources, C.S. (Chuncheng Song); data curation, S.Z.; writing—original draft preparation, C.S. (Caige Sun) and S.Z.; writing—review and editing, J.X. and F.F.; visualization, C.S. (Chuncheng Song); supervision, F.F.; project administration and funding acquisition, C.S. (Caige Sun)and J.X. All authors have read and agreed to the published version of the manuscript.

Funding

This research was funded by the Youth Foundation of Social Science and Humanity, China Ministry of Education (Grant No. 19YJCZH142), the National Nature Science Foundation of China (Grant No. 41901347), the China Postdoctoral Science Foundation (Grant No. 2018M643109), and the Key Special Project for Introduced Talents Team of Southern Marine Science and Engineering Guangdong Laboratory (Guangzhou) (Grant No. GML2019ZD0301).

Data Availability Statement

The original data was obtained from the statistical yearbooks. The data of Guangzhou was available at http://112.94.72.17/portal/queryInfo/statisticsYearbook/index (accessed on 7 January 2021). The data of Shenzhen was available at http://www.sz.gov.cn/cn/xxgk/zfxxgj/tjsj/tjnj (accessed on 7 January 2021). The data of Zhuhai was available at http://tjj.zhuhai.gov.cn/tjsj/tjnj/ (accessed on 7 January 2021). The data of Foshan was available at http://www.foshan.gov.cn/gzjg/stjj/tjnj_1110962 (accessed on 7 January 2021). The data of Zhaoqing was available at http://www.zhaoqing.gov.cn/xxgk/tjxx/tjnj/ (accessed on 7 January 2021). The data of Huizhou was available at http://www.huizhou.gov.cn/bmpd/hzstjj/tjnj (accessed on 7 January 2021). The data of Jiangmen was available at http://www.jiangmen.gov.cn/bmpd/jmstjj/tjsj/tjnj (accessed on 7 January 2021). The data of Dongguan was available at http://tjj.dg.gov.cn/tjnj (accessed on 7 January 2021). The data of Zhongshan was available at http://stats.zs.gov.cn/zwgk/tjxx/tjnj (accessed on 7 January 2021).

Acknowledgments

We sincerely thank the reviewers for their helpful comments and suggestions about our manuscript.

Conflicts of Interest

The authors declare no conflict of interest.

Appendix A

Table A1. Original data of the indicators of Guangzhou.
Specific Index 2000200520102015
Population of permanent residents (10,000 person)994.80949.681270.961350.11
Registered population (10,000 person)700.69750.53806.14854.19
Practitioners (10,000 person)496.26574.46711.07810.99
Gross Domestic Product (GDP) (billion yuan)250.56518.791085.931831.38
GDP per capita (million yuan)3.436.938.7513.62
Tertiary industry output (billion yuan)137.68655.75655.751214.75
Built-up area (km2)430.70734.99952.031237.25
Road mileage (km)5179.005493.008975.009320.00
Total retail sales of consumer goods (trillion yuan)1121.131905.844476.387987.96
Amount of medical staffs (10,000 person)7.267.9411.7315.39
Amount of teachers (10,000 person)8.2211.9614.6116.41
Green coverage area (km2)1104.051306.261407.681529.42
Green area (km2)1051.581232.191308.251410.41
Park area (km2)29.8045.3048.7051.93
Industrial wastewater discharge (100,000 tons)1732.12024.92358.62244.4
Industrial sulfur dioxide emissions (10,000 tons)17.8714.5012.489.90
Table A2. Original data of the indicators of Shenzhen.
Specific Index2000200520102015
Population of permanent residents (10,000 person)701.24827.751037.21137.87
Registered population (10,000 person)124.92181.93259.87354.99
Practitioners (10,000 person)474.97576.26758.14906.14
Gross Domestic Product (GDP) (billion yuan)221.92503.581000.221801.41
GDP per capita (million yuan)3.286.809.6215.80
Tertiary industry output (billion yuan)108.58229.86524.631028.83
Built-up area (km2)136.45713.00830.01900.00
Road mileage (km)1356.501579.901617.401643.70
Total retail sales of consumer goods (trillion yuan)735.021441.613000.765017.84
Amount of medical staffs (10,000 person)1.973.166.779.27
Amount of teachers (10,000 person)3.817.7011.2916.03
Green coverage area (km2)999.85976.05975.92998.41
Green area (km2)990.05963.80963.68978.50
Park area (km2)68.51159.86205.41219.55
Industrial wastewater discharge (100,000 tons)536.20644.40830.801193.70
Industrial sulfur dioxide emissions (10,000 tons)4.084.353.393.67
Table A3. Original data of the indicators of Zhuhai.
Specific Index2000200520102015
Population of permanent residents (10,000 person)123.65141.57156.16163.41
Registered population (10,000 person)73.9189.60104.74112.45
Practitioners (10,000 person)78.8894.01103.02108.92
Gross Domestic Product (GDP) (billion yuan)33.5964.05122.59206.64
GDP per capita (million yuan)2.784.537.8012.47
Tertiary industry output (billion yuan)14.4327.3651.6497.30
Built-up area (km2)58.50105.55123.64123.64
Road mileage (km)877.601074.31394.761446.71
Total retail sales of consumer goods (trillion yuan)121.17220.19486.03913.20
Amount of medical staffs (10,000 person)0.500.881.451.76
Amount of teachers (10,000 person)1.341.652.092.61
Green coverage area (km2)273.51308.65324.56336.62
Green area (km2)40.4051.0357.72102.38
Park area (km2)0.100.110.250.28
Industrial wastewater discharge (100,000 tons)252.70282.40544.60552.40
Industrial sulfur dioxide emissions (10,000 tons)3.243.033.219.03
Table A4. Original data of the indicators of Foshan.
Specific Index2000200520102015
Population of permanent residents (10,000 person)534.05580.03719.91743.06
Registered population (10,000 person)332.46354.48370.89388.97
Practitioners (10,000 person)193.50348.69443.46438.41
Gross Domestic Product (GDP) (billion yuan)105.04245.07568.54813.37
GDP per capita (million yuan)1.061.181.091.08
Tertiary industry output (billion yuan)43.5086.80199.54302.80
Built-up area (km2)36.91171.69151.53158.05
Road mileage (km)3528.53928.14914.234885.00
Total retail sales of consumer goods (trillion yuan)337.55647.731687.132705.22
Amount of medical staffs (10,000 person)1.701.933.354.36
Amount of teachers (10,000 person)3.634.494.925.48
Green coverage area (km2)50.2683.09117.3797.33
Green area (km2)44.7651.18109.7393.44
Park area (km2)6.2013.2515.0820.33
Industrial wastewater discharge (100,000 tons)1102.002493.702904.202039.60
Industrial sulfur dioxide emissions (10,000 tons)11.8214.8913.2619.19
Table A5. Original data of the indicators of Zhaoqing.
Specific Index2000200520102015
Population of permanent residents (10,000 person)337.69367.60392.22405.96
Registered population (10,000 person)386.60396.48422.41438.27
Practitioners (10,000 person)202.63215.05213.05218.44
Gross Domestic Product (GDP) (billion yuan)24.9843.60109.41198.40
GDP per capita (million yuan)0.741.192.814.87
Tertiary industry output (billion yuan)10.4920.0444.0669.15
Built-up area (km2)34.5255.979.95117.45
Road mileage (km)7457.708296.0011,26114,128.01
Total retail sales of consumer goods (trillion yuan)77.31142.29326.69632.36
Amount of medical staffs (10,000 person)1.451.451.892.62
Amount of teachers (10,000 person)3.403.764.945.15
Green coverage area (km2)50.6283.5678.34119.20
Green area (km2)31.6949.1449.4897.70
Park area (km2)10.4537.4637.552.97
Industrial wastewater discharge (100,000 tons)664.00723.101040.201259.30
Industrial sulfur dioxide emissions (10,000 tons)2.272.332.923.27
Table A6. Original data of the indicators of Jiangmen.
Specific Index2000200520102015
Population of permanent residents (10,000 person)395.24410.29445.08451.95
Registered population (10,000 person)380.85386.24392.28391.41
Practitioners (10,000 person)208.68214.53248.29242.92
Gross Domestic Product (GDP) (billion yuan)50.4780.17158.15226.42
GDP per capita (million yuan)1.291.953.564.96
Tertiary industry output (billion yuan)19.9730.3758.1498.08
Built-up area (km2)34.96100.35128.66150.00
Road mileage (km)6000.008000.009971.7010,018.20
Total retail sales of consumer goods (trillion yuan)177.11309.82650.741034.31
Amount of medical staffs (10,000 person)1.411.421.732.58
Amount of teachers (10,000 person)3.303.603.924.00
Green coverage area (km2)84.6088.2995.37123.40
Green area (km2)81.5884.3192.33120.08
Park area (km2)4.847.5010.1120.04
Industrial wastewater discharge (100,000 tons)1088.201199.301438.401441.30
Industrial sulfur dioxide emissions (10,000 tons)2.403.716.7110.31
Table A7. Original data of the indicators of Huizhou.
Specific Index2000200520102015
Population of permanent residents (10,000 person)321.8370.69460.11475.55
Registered population (10,000 person)277.80297.58337.28357.07
Practitioners (10,000 person)186.7222.62260.14281.51
Gross Domestic Product (GDP) (billion yuan)43.9280.51174.19317.87
GDP per capita (million yuan)1.392.193.876.62
Tertiary industry output (billion yuan)12.1727.3161.34126.24
Built-up area (km2)43.9595.66214.96238.89
Road mileage (km)6986.007538.0010,826.0013,476.00
Total retail sales of consumer goods (trillion yuan)126.48252.01582.531070.72
Amount of medical staffs (10,000 person)1.061.201.822.81
Amount of teachers (10,000 person)2.613.304.234.95
Green coverage area (km2)16.9141.5365.2892.99
Green area (km2)15.0637.2558.3583.58
Park area (km2)1.875.069.5920.78
Industrial wastewater discharge (100,000 tons)343.20435.90872.70830.00
Industrial sulfur dioxide emissions (10,000 ton)0.790.741.659.69
Table A8. Original data of the indicators of Dongguan.
Specific Index2000200520102015
Population of permanent residents (10,000 person)644.84656.07822.48825.41
Registered population (10,000 person)152.61165.65181.77195.01
Practitioners (10,000 person)164.08188.58226.27226.78
Gross Domestic Product (GDP) (billion yuan)82.11218.82430.89637.43
GDP per capita (million yuan)1.373.335.327.56
Tertiary industry output (billion yuan)34.3693.48206.99333.20
Built-up area (km2)281.3652.79820.26932.05
Road mileage (km)2519.002871.004751.005165.00
Total retail sales of consumer goods (trillion yuan)235.16506.291223.342184.70
Amount of medical staffs (10,000 person)0.811.883.754.52
Amount of teachers (10,000 person)1.903.685.687.82
Green coverage area (km2)679.50730.88794.46966.06
Green area (km2)639.04680.67741.85827.50
Park area (km2)18.4759.19111.30144.93
Industrial wastewater discharge (100,000 tons)2338.902192.209126.002690.90
Industrial sulfur dioxide emissions (10,000 tons)18.2017.5211.9727.84
Table A9. Original data of the indicators of Zhongshan.
Specific Index2000200520102015
Population of permanent residents (10,000 person)236.47243.46312.27320.96
Registered population (10,000 person)133.75140.82149.18158.68
Practitioners (10,000 person)64.64130.37174.15158.22
Gross Domestic Product (GDP) (billion yuan)34.5489.46187.79305.28
GDP per capita (million yuan)1.513.646.099.40
Tertiary industry output (billion yuan)14.1131.5672.76131.09
Built-up area (km2)27.6735.687.3138.89
Road mileage (km)948.801332.601917.102610.00
Total retail sales of consumer goods (trillion yuan)106.77276.6648.11079.7
Amount of medical staffs (10,000 person)0.680.681.512.00
Amount of teachers (10,000 person)1.141.802.442.86
Green coverage area (km2)12.2430.6842.3444.67
Green area (km2)11.1728.1533.3542.55
Park area (km2)1.953.295.449.76
Industrial wastewater discharge (100,000 tons)699.90841.101447.70862.20
Industrial sulfur dioxide emissions (10,000 ton)2.223.173.503.15

References

  1. You, H. Quantifying the coordinated degree of urbanization in Shanghai, China. Qual. Quant. 2015, 50, 1273–1283. [Google Scholar] [CrossRef]
  2. Guo, Y.; Wang, H.; Nijkamp, P.; Xu, J. Space-time indicators in interdependent urban-environmental systems: A study on the Huai River Basin in China. Habitat Int. 2015, 45, 135–146. [Google Scholar] [CrossRef]
  3. Chen, X.; Li, F.; Li, X.; Hu, Y.; Wang, Y. Mapping ecological space quality changes for ecological management: A case study in the Pearl River Delta urban agglomeration, China. J. Environ. Manag. 2020, 267, 110658. [Google Scholar] [CrossRef] [PubMed]
  4. A Bettencourt, L.M.; West, G.B. A unified theory of urban living. Nat. Cell Biol. 2010, 467, 912–913. [Google Scholar] [CrossRef]
  5. Zhao, Y.; Wang, S.; Ge, Y.; Liu, Q.; Liu, X. The spatial differentiation of the coupling relationship between urbanization and the eco-environment in countries globally: A comprehensive assessment. Ecol. Model. 2017, 360, 313–327. [Google Scholar] [CrossRef]
  6. United Nations. Transforming Our World: The 2030 Agenda for Sustainable Development, New York. 2015. Available online: https://sustainabledevelopment.un.org/post2015/transformingourworld/publication (accessed on 12 February 2021).
  7. Li, W.; Yi, P. Assessment of city sustainability—Coupling coordinated development among economy, society and environment. J. Clean. Prod. 2020, 256, 120453. [Google Scholar] [CrossRef]
  8. Wu, Z.; Li, Z.; Zeng, H. Using Remote Sensing Data to Study the Coupling Relationship between Urbanization and Eco-Environment Change: A Case Study in the Guangdong-Hong Kong-Macao Greater Bay Area. Sustainability 2020, 12, 7875. [Google Scholar] [CrossRef]
  9. Ding, Y.; De Vries, B.; Han, Q. Measuring Regional Sustainability by a Coordinated Development Model of Economy, Society, and Environment: A Case Study of Hubei Province. Procedia Environ. Sci. 2014, 22, 131–137. [Google Scholar] [CrossRef] [Green Version]
  10. Fan, Y.; Fang, C.; Zhang, Q. Coupling coordinated development between social economy and ecological environment in Chinese provincial capital cities-assessment and policy implications. J. Clean. Prod. 2019, 229, 289–298. [Google Scholar] [CrossRef]
  11. Wang, S.; Ma, H.; Zhao, Y. Exploring the relationship between urbanization and the eco-environment—A case study of Beijing–Tianjin–Hebei region. Ecol. Indic. 2014, 45, 171–183. [Google Scholar] [CrossRef]
  12. Long, Y.; Yang, Y.; Lei, X.; Tian, Y.; Li, Y. Integrated Assessment Method of Emergency Plan for Sudden Water Pollution Accidents Based on Improved TOPSIS, Shannon Entropy and a Coordinated Development Degree Model. Sustainability 2019, 11, 510. [Google Scholar] [CrossRef] [Green Version]
  13. Zhixiong, M.; Shiyun, L.I.; Shufang, Z.; Junhui, L.U. Spatio-Temporal Evolvement of Coordinated Relationship between Urban Economy and Environment in the Pearl River Delta. J. South China Norm. Univ. Nat. Sci. Ed. 2016, 5, 74–81. [Google Scholar]
  14. Liu, N.; Liu, C.; Xia, Y.; Da, B. Examining the coordination between urbanization and eco-environment using coupling and spatial analyses: A case study in China. Ecol. Indic. 2018, 93, 1163–1175. [Google Scholar] [CrossRef]
  15. Dai, E.; Wu, Z.; Du, X. A gradient analysis on urban sprawl and urban landscape pattern between 1985 and 2000 in the Pearl River Delta, China. Front. Earth Sci. 2017, 12, 791–807. [Google Scholar] [CrossRef]
  16. Liu, Y.; Cao, X.; Li, T. Identifying Driving Forces of Built-Up Land Expansion Based on the Geographical Detector: A Case Study of Pearl River Delta Urban Agglomeration. Int. J. Environ. Res. Public Health 2020, 17, 1759. [Google Scholar] [CrossRef] [Green Version]
  17. Yan, Y.; Ju, H.; Zhang, S.; Jiang, W. Spatiotemporal Patterns and Driving Forces of Urban Expansion in Coastal Areas: A Study on Urban Agglomeration in the Pearl River Delta, China. Sustainability 2019, 12, 191. [Google Scholar] [CrossRef] [Green Version]
  18. Li, Z.-T.; Li, M.; Xia, B.-C. Spatio-temporal dynamics of ecological security pattern of the Pearl River Delta urban agglomeration based on LUCC simulation. Ecol. Indic. 2020, 114, 106319. [Google Scholar] [CrossRef]
  19. Long, Y.; Xu, G.; Ma, C.; Chen, L. Emergency control system based on the analytical hierarchy process and coordinated development degree model for sudden water pollution accidents in the Middle Route of the South-to-North Water Transfer Project in China. Environ. Sci. Pollut. Res. 2016, 23, 12332–12342. [Google Scholar] [CrossRef]
  20. Wang, X.; Dong, Z.; Xu, W.; Luo, Y.; Zhou, T.; Wang, W. Study on Spatial and Temporal Distribution Characteristics of Coordinated Development Degree among Regional Water Resources, Social Economy, and Ecological Environment Systems. Int. J. Environ. Res. Public Health 2019, 16, 4213. [Google Scholar] [CrossRef] [Green Version]
  21. Ma, L.; Cheng, W.; Qi, J. Coordinated evaluation and development model of oasis urbanization from the perspective of new urbanization: A case study in Shandan County of Hexi Corridor, China. Sustain. Cities Soc. 2018, 39, 78–92. [Google Scholar] [CrossRef]
  22. Ariken, M.; Zhang, F.; Liu, K.; Fang, C.; Kung, H.-T. Coupling coordination analysis of urbanization and eco-environment in Yanqi Basin based on multi-source remote sensing data. Ecol. Indic. 2020, 114, 106331. [Google Scholar] [CrossRef]
  23. Lv, T.; Wang, L.; Zhang, X.; Xie, H.; Lu, H.; Li, H.; Liu, W.; Zhang, Y. Coupling Coordinated Development and Exploring Its Influencing Factors in Nanchang, China: From the Perspectives of Land Urbanization and Population Urbanization. Land 2019, 8, 178. [Google Scholar] [CrossRef] [Green Version]
  24. Güneralp, B.; Seto, K.C. Environmental impacts of urban growth from an integrated dynamic perspective: A case study of Shenzhen, South China. Glob. Environ. Chang. 2008, 18, 720–735. [Google Scholar] [CrossRef]
  25. Yang, H.; Sui, Y.; Liu, X.; Ji, J. Coordinated develorment of urbanisation and ecological environment system—A case of Shenzhen. J. Environ. Prot. Ecol. 2020, 21, 1156–1165. [Google Scholar]
  26. Meng, L.; Sun, Y.; Zhao, S. Comparing the spatial and temporal dynamics of urban expansion in Guangzhou and Shenzhen from 1975 to 2015: A case study of pioneer cities in China’s rapid urbanization. Land Use Policy 2020, 97, 104753. [Google Scholar] [CrossRef]
  27. Gao, Y.; Wu, Z.; Lou, Q.; Huang, H.; Cheng, J.; Chen, Z. Landscape ecological security assessment based on projection pursuit in Pearl River Delta. Environ. Monit. Assess. 2011, 184, 2307–2319. [Google Scholar] [CrossRef] [PubMed]
  28. Cui, N.; Feng, C.-C.; Wang, D.; Li, J.; Guo, L. The Effects of Rapid Urbanization on Forest Landscape Connectivity in Zhuhai City, China. Sustainability 2018, 10, 3381. [Google Scholar] [CrossRef] [Green Version]
  29. Liang, Y.; Zhou, Z.; Li, X. Dynamic of Regional Planning and Sustainable Development in the Pearl River Delta, China. Sustainability 2019, 11, 6074. [Google Scholar] [CrossRef] [Green Version]
Figure 1. Location of the Pearl River Delta in Guangdong Province.
Land 10 00190 g001
Figure 2. Changes in the coupling degree of urbanization and the eco-environment in the nine cities of the Pearl River Delta.
Land 10 00190 g002
Figure 3. Spatial pattern of coupling degree of urbanization and the eco-environment in cities in the Pearl River Delta during (a) 2000–2005; (b) 2005–2010; (c) 2010–2015.
Land 10 00190 g003
Figure 4. Coupling coordinated degree changes of the nine cities in the Pearl River Delta.
Land 10 00190 g004
Figure 5. Spatial pattern of coupling coordinated degree between urbanization and the eco-environment in cities in the Pearl River Delta during (a) 2000–2005; (b) 2005–2010; (c) 2010–2015.
Land 10 00190 g005
Figure 6. Coupling degree and coupling coordinated degree in the Pearl River Delta from 2000 to 2015.
Land 10 00190 g006
Table 1. Evaluation indicator system for coupling coordination of urbanization and the eco-environment.
Target LayerDomain LevelCriterion LayerIndex LayerWeight
Urbanization and Eco-environment Coupling CoordinationUrbanization subsystemPopulation urbanizationPopulation of permanent residents 0.1521
Registered population0.0368
Practitioners0.0488
Economic urbanizationGross Domestic Product (GDP)0.1641
GDP per capita0.2108
Tertiary industry output 0.0704
land urbanizationBuilt-up area 0.2124
Road mileage 0.0206
Social urbanizationTotal retail sales of consumer goods0.0492
Medical staffs 0.0171
Teachers 0.0177
Eco-environment subsystemEco-environment stateGreen coverage area0.2227
Green area0.1469
Park area0.0844
Environmental pollutionIndustrial wastewater discharge 0.2840
Industrial sulfur dioxide emissions 0.2619
Table 2. Classification criteria for coupling coordination of urbanization and the eco-environment.
ClassCDDType u ( x ) e ( y ) Specific Type
Superior coordination 0.9 C D D 1 Eco-environment lagging   u ( x ) e ( y ) > 0.1 SC-EL
Synchronous development   0 | u ( x ) e ( y ) | 0.1 SC-SD
Urbanization lagging e ( y ) u ( x ) > 0.1 SC-UL
Good coordination 0.7 C D D < 0.9   Eco-environment lagging   u ( x ) e ( y ) > 0.1 GC-EL
Synchronous development 0 | u ( x ) e ( y ) | 0.1 GC-SD
Urbanization lagging e ( y ) u ( x ) > 0.1 GC-UL
Moderate coordination 0.6 C D D < 0.7   Eco-environment lagging   u ( x ) e ( y ) > 0.1 MC-EL
Synchronous development 0 | u ( x ) e ( y ) | 0.1 MC-SD
Urbanization lagging   e ( y ) u ( x ) > 0.1 MC-UL
Barely coordination 0.5 C D D < 0.6   Eco-environment lagging   u ( x ) e ( y ) > 0.1 BC-EL
Synchronous development   0 | u ( x ) e ( y ) | 0.1 BC-SD
Urbanization lagging   e ( y ) u ( x ) > 0.1 BC-UL
Close to imbalance 0.4 C D D < 0.5   Eco-environment lagging   u ( x ) e ( y ) > 0.1 CI-EL
Synchronous development   0 | u ( x ) e ( y ) | 0.1 CI-SD
Urbanization lagging   e ( y ) u ( x ) > 0.1 CI-UL
Slight imbalance 0.3 C D D < 0.4 Eco-environment lagging   u ( x ) e ( y ) > 0.1 SlI-EL
Synchronous development 0 | u ( x ) e ( y ) | 0.1 SlI-SD
Urbanization lagging   e ( y ) u ( x ) > 0.1 SlI-UL
Moderate imbalance 0.1 C D D < 0.3 Eco-environment lagging   u ( x ) e ( y ) > 0.1 MI-EL
Synchronous development   0 | u ( x ) e ( y ) | 0.1 MI-SD
Urbanization lagging e ( y ) u ( x ) > 0.1 MI-UL
Severe imbalance 0 C D D < 0.1 Eco-environment lagging u ( x ) e ( y ) > 0.1 SeI-EL
Synchronous development 0 | u ( x ) e ( y ) | 0.1 SeI-SD
Urbanization lagging   e ( y ) u ( x ) > 0.1 SeI-UL
u(x) and e(y) are the urbanization level and eco-environment improvement level. CCD is the coupling coordination degree. SC-EL, SC-SD and SC-UL represent superior coordination for eco-environment lagging type, synchronous development type and urbanization lagging type, respectively. GC, MC and BC represent good coordination, moderate coordination and bare coordination, respectively. CI, SlI, MI and SeI represent close to imbalance, slight imbalance, moderate imbalance and severe imbalance, respectively. EL, SD and UL represent eco-environment lagging type, synchronous development type and urbanization lagging type, respectively.
Table 3. Coupling degree of urbanization and the eco-environment of cities in the Pearl River Delta.
Cities2000–20052005–20102010–2015Average CD
u(x)e(y)CDu(x)e(y)CDu(x)e(y)CD
Guangzhou0.590.270.74 (8)0.370.600.88 (7)0.470.590.97 (5)0.87 (8)
Shenzhen0.340.260.96 (1)0.400.260.91 (6)0.450.310.94 (6)0.90 (3)
Zhuhai0.620.440.95 (4)0.370.280.96 (2)0.410.391.00 (2)0.97 (1)
Foshan0.320.460.93 (5)0.310.460.93 (5)0.280.271.00 (1)0.95 (2)
Zhaoqing0.560.280.78 (7)0.540.600.99 (1)0.520.650.97 (4)0.92 (5)
Jiangmen0.370.270.94 (3)0.490.280.86 (8)0.420.260.89 (8)0.90 (6)
Huizhou0.530.280.83 (6)0.600.260.72 (9)0.410.260.91 (7)0.82 (9)
Dongguan0.630.260.69 (9)0.370.260.94 (4)0.370.470.97 (3)0.87 (7)
Zhongshan0.540.740.95 (2)0.590.420.94 (3)0.610.360.88 (9)0.93 (4)
u(x) and e(y) are the urbanization level and eco-environment improvement level. CD is the coordination degree. The numbers in parentheses are the rankings of the CD values.
Table 4. Coupling coordination types of nine cities in the Pearl River Delta from 2000 to 2015.
City2000–20052005–20102010–2015Average CDD
CDDSpecific TypeCDDSpecific TypeCDDSpecific Type
Guangzhou0.57 (6)BC-EL0.65 (3)MC-UL0.72 (2)GC-UL0.65 (3)
Shenzhen0.54 (9)BC-SD0.55 (8)BC-EL0.59 (6)BC-EL0.56 (8)
Zhuhai0.71 (2)GC-EL0.56 (6)BC-SD0.63 (5)MC-SD0.63 (4)
Foshan0.60 (3)MC-UL0.60 (4)BC-UL0.52 (9)BC-SD0.57 (6)
Zhaoqing0.57 (5)BC-EL0.75 (1)GC-SD0.75 (1)GC-UL0.69 (2)
Jiangmen0.55 (8)BC-SD0.57 (5)BC-EL0.55 (7)BC-EL0.56 (9)
Huizhou0.58 (4)BC-EL0.56 (7)BC-EL0.55 (8)BC-EL0.56 (7)
Dongguan0.55 (7)BC-EL0.54 (9)BC-EL0.64 (4)MC-SD0.58 (5)
Zhongshan0.78 (1)GC-EL0.69 (2)MC-EL0.65 (3)MC-EL0.71 (1)
CCD is the coupling coordination degree. GC, MC and BC represent good coordination, moderate coordination and barely coordination, respectively. EL, SD and UL represent eco-environment lagging type, synchronous development type and urbanization lagging type, respectively. The numbers in parentheses are the rankings of the CCD values.
Publisher’s Note: MDPI stays neutral with regard to jurisdictional claims in published maps and institutional affiliations.

