Article

Mapping Abandoned Cropland Changes in the Hilly and Gully Region of the Loess Plateau in China

1
Key Laboratory of Land Surface Pattern and Simulation, Institute of Geographic Sciences and Natural Resources Research, Chinese Academy of Sciences, Beijing 100101, China
2
School of Geosciences, Yangtze University, Wuhan 430100, China
*
Author to whom correspondence should be addressed.
Land 2021, 10(12), 1341; https://doi.org/10.3390/land10121341
Submission received: 4 November 2021 / Revised: 1 December 2021 / Accepted: 2 December 2021 / Published: 5 December 2021
(This article belongs to the Special Issue Land Degradation and Sustainable Land Management)

Abstract

:
As a form of land marginalization, abandoned cropland has an important impact on food security and the effective supply of agricultural products. With rapid urbanization across the world, large areas of cropland are abandoned in some regions, especially in mountainous and hilly areas with poor terrain. Due to the fine fragmentation and scattered distribution of abandoned cropland, and considering differences in the abandoned and fallow time of cropland, it is difficult to extract information using remote sensing technology. Therefore, this paper proposes a change in the detection method for extracting abandoned cropland information based on identifying the annual land use trajectory. Based on Landsat satellite data, annual land use was mapped from 2011 to 2020 in Gaolan County, which is located in the hilly and gully region of the Loess Plateau of China, using the random forest classification method. Subsequently, abandoned cropland information in Gaolan County was extracted, based on the land use change trajectory and analysis of the influencing factors of abandoned land. The results showed that: (1) The overall accuracy of land use interpretation in Gaolan County ranged from 86.44% to 95.45%, from 2011 to 2020, with a kappa coefficient of up to 0.93, and the classification results were ideal. (2) The recall of extracted abandoned cropland was 81%, the extraction accuracy of which was relatively high. (3) From 2013 to 2020, the cropland abandonment rate in Gaolan County ranged from 8.41% to 19.65%, with an average of 14.55%, which increased and then decreased. The abandonment rate was highest in 2015 but it then decreased year by year. The average period of abandoned cropland was 4.2 years. (4) The influence factors of the plot scale explain the difference in the spatial distribution of cultivated land abandonment. The higher the slope condition, the lower the soil nutrient content and the greater the possibility of abandonment.

1. Introduction

Since the second half of the 20th century, cropland abandonment has occurred widely all over the world [1,2,3,4]. National governments and the European Union (EU) have introduced relevant policies to slow the growth trend of abandoned cropland, such as the EU’s Common Agricultural Policy (CAP) [1] and Japan’s direct subsidy policy regarding mountainous and semi-mountainous regions [3]. Among them, the structural policy in the CAP reduces the scale of cropland abandonment by giving financial subsidies to marginal agricultural areas with unfavorable cropland conditions. Abandoned cropland has become an important area of study regarding land use and land cover change [5]. Cropland abandonment has significant effects on food security, biological and landscape diversity, and soil [6,7,8]; the effects are dynamic throughout abandonment. In this context, effective identification of abandonment has practical significance for researching the driving force of abandonment and policymaking. Cropland abandonment is a complex process of land use change. The spatial distribution of abandoned cropland is comprehensively affected by various factors such as location characteristics, labor status, social and economic factors, natural conditions and agricultural policy [9]. It has been shown that cropland abandonment is particularly common in semi-arid areas, such as Southern Europe [9], and mountainous areas (in Europe [1], Latin America [10] and western Ukraine [11]). In China, the phenomenon of cropland abandonment is relatively common due to factors such as complex terrain, diverse climate types and vast mountainous areas [3,12]. China is a major grain producer and exporter, but its per capita cropland share is small and cropland protection is very important to the country. The phenomenon of abandoned cropland has aroused the attention of the Chinese government [13,14].
At present, remote sensing technology is a more efficient method for obtaining spatiotemporal information regarding abandoned cropland on a large scale. Compared with traditional methods, such as farmer surveys, remote sensing technology can better reflect the spatiotemporal distribution of abandoned cropland [15,16,17,18]. Abandoned cropland in China is mostly distributed in mountainous and hilly areas and is affected by terrain and climate. Such areas are scattered and fragmented. For the moment, the acquisition of abandoned cropland information continues to depend on farmer surveys [19,20], with remote sensing extraction limited by the low quality and spatial resolution of the data. Therefore, it is necessary to study effective remote sensing methods, to extract abandoned land in mountainous areas.
Cultivated land abandonment is a land use process. Abandoned land can be regarded as a special land use type or land cover change process. Therefore, there are two ways to extract abandoned land. One is to treat abandoned land as a special land cover type and directly map fallow areas where grassland and woodland grow. For example, Alcantara et al. [21] mapped abandoned agricultural land in Eastern Europe from 2003 to 2008, using MODIS NDVI time series data and support vector machine classification, and calculated phenology metrics from the time series data. Estel et al. [15] used a MODIS NDVI time series to extract abandonment information from the European region, from 2001 to 2012. The second type is land use change detection. The basic principle is to use remote sensing data from different periods to map abandoned land by analyzing the transformation of cultivated land, originally used for agricultural purposes, to grassland, woodland or shrubland. This usually requires obtaining long-term image data [11]. For example, Shi et al. [22] used the overlapped cropland layers in 2002 and 2011 to remove the extent of grain for green project, thereby obtaining the overall distribution of abandonment in Chongqing over 10 years. Due to the difference in the time of abandonment of cultivated land and fallow, by only analyzing the changes of cultivated land in two different years, it is impossible to continuously detect the changes of abandoned land. Using MODIS NDVI and phenological metrics, Han and Song [23] obtained the land use trajectories from 2001 to 2015 in Guangxi and used them (with local crop rotation cycles) to map abandoned cropland. These methods can obtain the spatial distribution and duration of abandoned cropland with a relatively high degree of accuracy. However, when abandoned cropland is scattered and fragmented, it is difficult to extract abandoned cropland accurately using medium resolution images. Landsat time series data has a high spatial resolution (30 m), which has a great advantage in identifying finely fragmented abandoned land in mountainous areas. For example, Song [24] mapped the trajectory of land use change based on Landsat and HJ-1 satellite images, and mapped different types of cropland abandoned in the town of Zhongduo, Chongqing from 2012 to 2017. However, due to the remote sensing image acquisition time and cloud influence, the acquisition of long time series data was limited. Big data cloud computing platforms, such as Google Earth Engine (GEE) [25,26] can effectively process medium and high-resolution satellite data and improve the efficiency of obtaining long time series data.
Currently, the use of remote sensing technology to extract abandoned land has made more in-depth progress. From the point of view of data sources, MODIS data is usually used to draw abandoned land in a large area. However, in hilly and mountainous areas, terrain is fragmented and remote sensing image pixels have serious inaccuracies. Coarse resolution data may affect the accuracy of drawing abandoned land. The resolution of Landsat images is better, but the return period is 16 days and cloud coverage limits the acquisition of long-term series data. This paper solves this problem based on the processing of the data obtained on the GEE platform. From the perspective of extraction methods, the research task of this paper is to propose a land use trajectory change detection method to map abandoned land. In summary, our research provides the possibility of using medium-resolution data to map small or highly fragmented plots to map abandoned land. In fact, large areas are also applicable, improving the efficiency of extracting abandoned land during a long research period.

2. Study Area and Data Sources

2.1. Overview of the Study Area

Gaolan County, which is a part of Lanzhou City, Gansu Province, China, is a hilly and gully area of the Loess Plateau, located at 103°32′–104°14′ east longitude and 36°05′–36°50′ north latitude, with a total area of 2556 square kilometers (Figure 1). The county has jurisdiction of seven townships and one town, with relatively rich land resources. The terrain is high in the northwest and low in the southeast, with an average elevation of 1600 m and ranging from 1441 to 2445 m overall. It has a temperate, semi-arid climate, with an annual temperature of 7.2 °C and annual precipitation of 266 mm. Crops ripen once a year [27].
In the past ten years, the society and the economy of Gaolan County have developed rapidly, its gross domestic product (GDP) increasing from 2597 billion yuan in 2010 to 7577 billion yuan in 2019 [28]. In this period, the industrial structure was constantly optimized, and the industrial structure of ‘Tertiary-Secondary-Primary’ was formed (Figure 2A), while the rural population decreased from 150,800 to 78,500 (Figure 2B).

2.2. Data Sources and Preprocessing

(1)
Landsat Images. The main data source used in this study were Landsat images, which were all downloaded from the GEE platform [29]. The satellite images included Landsat TM (2011), Landsat ETM+ (2012), and Landsat OLI (2013–2020), in which the Landsat ETM+ images were repaired. We use GEE’s Filter series of functions to filter the images. The standard for image filtering is from January to December of each year, and the cloud cover is less than 10%. After cloud removal, mosaic, and clipping, the usable remote sensing images are generated. The specific data sources are shown in Table 1.
(2)
Other Data. The 30 m resolution land classification product from the Resource and the Environment Science and Data Center was used to obtain land use data [30] (2010). Digital Elevation Model (DEM) data with 30 m resolution of geospatial data cloud platform [31] were used as auxiliary classification data. Google historical image data (2011–2020) from 91 Weitu Assistant were used [32], with a resolution of 0.52 m.
The soil type data was obtained from the Food and Agriculture Organization of the United Nations [33] and the soil fertility data (1 km grid soil content map) was obtained from the Soil SubCenter, National Earth System Science Data Center, National Science & Technology Infrastructure of China [34].

3. Methods

3.1. Identification Process of Abandoned Cropland

Cropland abandonment may be a complex and gradual process, so it is difficult to define abandonment. According to specific circumstances, scholars in different countries and regions have different definitions of abandonment. If the cultivated land has not been produced by agriculture for at least 2 to 4 years, it is usually considered to be abandoned land. However, there are areas with fallow periods of up to 5 years or longer, such as marginal areas or those affected by the CAP [15,35]. In China, the 2011 International Symposium on Land Consolidation and Land Reserve defined abandoned land as “farmland that has not been cultivated for 2 or more years”. Some scholars have carried out research on this definition [23,24,36]. Based on the basic national conditions of China as a large agricultural country, combined with the actual situation of the study area, we define abandoned land as cultivated land that has not been used by agriculture for at least 3 years and is completely abandoned. Our research did not consider seasonal or perennial abandonment.
The following identification rules for abandoned cropland were established. The cropland in the T-th year converted into forestland and grassland in the following three consecutive years, meaning that the cropland abandoned in the T + 3-th years. The identification of abandoned cropland was divided into the following four steps (Figure 3): (1) the boundary of cropland in 2010 in Gaolan County was extracted according to the land classification products. (2) Landsat images were preprocessed as data inputs of random forest classification. (3) Training and validation samples selected for each image using Google Earth images, and the classification method used the random forest method, while the classification results were assessed for accuracy. (4) Identification rules for abandoned cropland were established and abandoned cropland was extracted, based on the land use trajectory.

3.2. Classification of Land Use

Considering that the change detection method is prone to being disturbed by non-cropland changes, an accurate boundary of the cropland vector in Gaolan County in 2010 was obtained from the national land use classification products of the Chinese Academy of Sciences, and the land use image was mapped year by year based on the cropland boundary. Landsat image data from 2011 to 2020 were downloaded after preprocessing Landsat images using the GEE online editor. Among them, Landsat TM image data, Landsat ETM+ image data and Landsat OLI image data were used in 2011, 2012, and 2013–2020, respectively. The addition of the NDVI and the normalized difference building index (NDBI) can improve the classification accuracy of vegetation and buildings [37,38]. The NDVI value was calculated from the crop growth period in the study area (screening time from July to September). The NDVI and NDBI indexes were calculated as follows [37]:
NDVI = ( NIR Red ) / ( NIR + Red )
NDBI = ( SWIR NIR ) / ( SWIR + NIR )
where ‘ NIR ’, ‘ Red ’ and ‘ SWIR ’ are the surface reflectance of near infrared, red band and short-wave infrared, respectively.
The bands were split and the B2, B3, B4, B5, B6 and B7 bands of Landsat OLI images were selected (six bands corresponding to Landsat TM/ETM+ images). Moreover, nine auxiliary NDVI, NDBI and DEM bands were used to generate new Landsat image data for the test variables of the random forest classification algorithm. Training samples were drawn by visual interpretation with Google historical images. According to the land use classification system of the Chinese Academy of Sciences, the land use types of the study area were divided into five categories: cropland (1514 sample rectangles), forest (503 sample rectangles), grassland (367 sample rectangles), built-up land (288 sample rectangles), and water (207 sample rectangles). The classification accuracy was verified using Google historical images.
A random forest classifier was selected to map annual land use. Random Forest (RF), an integrated classifier trained and predicted by Breiman, based on multiple decision trees, is widely used in land cover classification due to its high classification accuracy, fast prediction speed and excellent processing of multi-source remote sensing data [23,39,40]. The random forest classification tool of the ENVI5.3 software was used to classify land use in the study area, using 70% of the data as training samples and 30% as verification samples, for accuracy after classification. Two parameters were set in the random forest classification: the number of decision trees was set to 100 and the number of characteristic variables was the square root of the total number of characteristic variables.

3.3. Abandoned Cropland Identification from 2011 to 2020

To evaluate the time series of land use from 2011 to 2020, the land use trajectory of each pixel was calculated and abandoned land was extracted by change detection. From the perspective of the natural succession process of vegetation cover after the abandonment of cultivated land, the cultivated land originally used for agriculture later evolved into continuous grassland, woodland or shrubs [21]. Therefore, we traced back to the land use image before abandonment, and identified the cultivated land that was originally used for agricultural purposes but later succeeded to be grassland, woodland or shrubs, and then mapped the abandonment. In our research, the time of this succession is at least 3 years.
The calculation method for land use trajectory is shown in Figure 4 [24]. Taking the period 2011–2016 as an example, according to the abandoned cropland identification rules, pixels a, b and e were not abandoned during this research period. The cropland of pixel e was converted into built-up land in 2012 and 2014. The cropland of pixel f was converted into built-up land in 2015, so the total time of abandonment was three years. The cropland with pixels c and h had the same duration of abandonment. The cropland of pixel i comprised forest and grassland from 2011 to 2016, and its total time of abandonment was 6 years (since 2011). Based on the calculation rules, the total time of abandonment of cropland for pixels d and g was four and five years, respectively, and the start date of the abandonment was 2012. Thus, a map of abandonment from 2011 to 2020 in Gaolan County was drawn and the total abandonment time was calculated.
The abandonment rate was calculated according to the proportion of abandoned cropland area in 2010, as follows [41]:
  P a = A T A 0   ×   100 %
where ‘ A T ’ represents the abandoned area in T years and ‘ A 0 ’ represents the cropland area of the benchmark year, 2010.

3.4. Accuracy Evaluation of Abandoned Cropland

In this paper, recall was used to verify the accuracy of abandoned cropland extraction. We downloaded the Google Earth Image 2020 from 91 Weitu Assistant with a resolution of 0.52 m. The image had a clear texture and could be used to verify whether the plot had been abandoned. We used ArcGIS software to create 100 random sampling points and then searched Google Images for images corresponding to these points, in order to determine whether each plot had been abandoned. Recall was calculated as follows [42]:
Recall = TP TP + FN
where ‘ TP ’ indicates that the positive prediction is positive, i.e., correctly extracted abandoned cropland, and ‘ FN ’ indicates that the positive prediction is negative, i.e., incorrectly extracted abandoned cropland.

3.5. Spatiotemporal Distribution Characteristics of Abandoned Cropland

The study used kernel density methods to analyze the spatial distribution characteristics of abandoned cropland. Kernel density estimation (KDE) is a conventional statistical method using non-parametric density estimation that can efficiently detect and identify the cold and hot regions of a study area [43]. The principle is to calculate the weights of the elements within the size of the search area according to discrete point or line data, and then determine the density change in abandoned cropland based on the distance decay function [44]. The higher the kernel density value, the higher the spatial distribution density of abandoned cropland, while the lower the kernel density, the smaller the spatial distribution density of abandoned cropland. Abandoned cropland data were transformed into point data in ArcGIS software, and the data’s kernel density was estimated using the Kernel Density tool. Repeated verifications confirmed that the results of kernel density zoning for the search radius of 2500 m were good and the data features were smooth. The calculation formula was as follows [43]:
  f n = 1 nh i = 1 n k ( x x i h )
where ‘ f n ’ represents the kernel density value of the spatial distribution of abandoned land in the study area, ‘ n ’ represents the number of abandoned points, ‘ k ’ represents the function of the kernel density measurement, ‘ x x i ’ represents the distance between abandoned land parcels, and ‘ h ’ represents the search radius.

4. Results and Discussion

4.1. Results of Land Use Classification

4.1.1. Classification Accuracy of Annual Land Use

In our study, the classification accuracy was as high as 95.45% and the kappa coefficient was 0.93 (Figure 5), with an average accuracy of 91.35%. The classification accuracy of various land types was relatively stable and the results of the mean producer’s accuracy (PA) and user’s accuracy (UA) of different land use types showed the highest classification accuracy of water: mean PA and UA values were 95.04% and 100%, respectively. The forest PA and UA were 93.36% and 95.44%, respectively, while the average values for cropland were 96.04% and 89.61%, respectively. The classification results for forest and cropland were good. By contrast, the mean PA and UA values for grassland were low: 82.47% and 89.21%, respectively (Table 2).

4.1.2. Land Use Changes

By classifying Landsat images from 2011 to 2020, an annual land use classification was obtained (Figure 6). Within the range of cropland in Gaolan County, grassland was the second-largest land use type. The change in cropland was not stable and transformed into grassland and forest. With the development of the economy (especially in recent years) and as the built-up area expanded year by year, the increased area was mainly distributed in the northwestern and western parts of the study area.

4.2. Extraction Results of Abandoned Cropland

4.2.1. Spatial Distribution of Abandoned Cropland

After the validation, the recall of cropland abandonment in 2020 was 81%, demonstrating this method’s accuracy in extracting mountainous abandoned cropland. According to the land use classification, the cropland area of Gaolan County in 2010 was 61,704 ha. From 2011 to 2020, abandoned cropland occurred in much of the west of the study area (Figure 7). Table 3 presents statistics for the abandonment area and the annual abandonment rate of cropland. Over the past 10 years, the abandonment rate in Gaolan County ranged from 8.41% to as high as 19.65%, and the area of abandonment ranged from 5189.32 ha to 12,124.88 ha. Abandonment was most serious in 2015 and 2016, representing an area of more than 11,000 ha and rates of 19.65% and 19.42%, respectively. After 2015, the abandonment trend was under control.

4.2.2. Spatiotemporal Distribution of Abandoned Cropland

The annual spatial distribution density was obtained from abandoned cropland using the kernel density estimation (Figure 8). The annual abandoned cropland kernel density estimates were divided into five categories by natural breakpoints. Statistical analysis of the kernel density grading results determined the proximity range of each value in multiple years; the kernel density range was manually divided, to unify the kernel density classification year by year. The range of kernel density of abandoned cropland change in Gaolan County was 0–478 points/km2, from 2011 to 2020. The maximum kernel density fluctuated around 360 points/km2 over multiple years, reaching a maximum value of 478 points/km2 in 2015. From the distribution of kernel density levels over various years, low-density regions spread throughout the period, while medium and low-density areas were mainly concentrated in the years 2012 and 2013. Medium-density regions mainly were distributed in the years 2015, 2016 and 2017. The increases in abandoned areas were mainly manifested in the increased distribution of medium and high-density regions.
Overall, the kernel density value of abandoned cropland in Gaolan County initially increased, and then decreased after 2015. It can be seen that abandoned cropland in Gaolan County increased over the previous years, mainly in the western and northwestern parts of the study area. However, the trend slowed after 2015 and the trend of abandoned land was controlled.

4.3. Total Length of Abandonment

Figure 9 shows the spatial distribution of the different total abandoned time span. The total abandonment length varied from three to 10 years, with an average of 4.2 years. Long-abandoned cropland was mainly distributed in the western and northwestern parts of the study area. The total abandonment length of cropland in the east was relatively short and the total abandonment length of three years was widely distributed in the study area.
Table 4 presents the areas that were abandoned for different lengths of time. The total abandoned area was 15,259.04 ha. The area of cropland abandoned for three years was the largest, at 5016.53 ha, accounting for 32.9% of the total abandoned area. The area of cropland abandoned for nine years was the smallest, at 425.75 ha, accounting for 2.82% of the total abandonment area. Cropland with a total abandonment time of four years and six years was mostly distributed in the study area, and the abandoned areas were 2969.07 and 1716.64 ha, respectively, accounting for 19.45% and 11.25% of the total abandoned area.

4.4. Analysis of Influencing Factors on Abandoned Land

The influencing factors of plot scale have extremely high explanatory power for the spatial distribution of abandonment of cultivated land [12]. Therefore, we selected slope, soil type and soil fertility influencing factors to study their effects on the abandonment rate.

4.4.1. Slope Factor

We calculated the slope from the DEM and divided the slope into 6 categories, namely 0–2, 2–6, 6–15, 15–25, 25–45, and >45°. Then, based on all the points that were abandoned during the research period, the slope value of each pixel was calculated using the tool to extract multiple values to points, and the abandonment rate under each grade of slope was counted (Table 5). It can be seen that as the slope increases the abandonment rate also increases. Higher slope conditions largely lead to abandonment, so policy makers can encourage farmers to increase vegetation coverage in areas with steep slopes and encourage them to stop farming in those areas.

4.4.2. Soil Type and Soil Fertility Factor

Similarly, all of the soil types, soil nitrogen, phosphorus and potassium content of all abandonment points were extracted, and the proportion of the abandonment rate calculated (Table 6). It can be seen that about 65% of all the farmland that was abandoned was situated on Calcisols, and Anthrosols have the smallest proportion. On the other hand, the soil potassium content of abandoned land is 0–1.81 g/kg; the total soil nitrogen content is 0–0.097 g/kg; the soil phosphorus content is 0–0.073 g/kg, and its soil nutrient content is extremely lacking.
The natural soil in most areas of Gaolan County is calcareous soil. It is possible to consider turning the plots with water sources into irrigated agriculture. At the same time, increasing the proportion of forage and legume crops should also be considered, as well as rational rotation and fertilization, intensive cultivation, and continuous improvement of the soil fertility and crop yield.

4.5. Discussions

In our research, the data source used to map abandoned land was medi-um-resolution image data. In previous work, the acquisition of high-resolution, long-term sequence data has always been a major challenge for abandoned land mapping. We processed the data with the help of Google Earth Engine (GEE) cloud computing and obtained Landsat image data with 30 m resolution time series. NDVI, NDBI and elevation was used to assist the accuracy of classification, and then a change detection method based on annual land use trajectory was used to draw an abandonment map of the hilly and gully area of China’s Loess Plateau. However, there may still be some issues that need to be discussed.
(1) There is no uniform definition of abandoned land, and the definition will greatly affect the results. This study defines abandoned land as cultivated land that has not been cultivated for at least 3 years. In order to provide a wide range of references for various studies, we studied the abandonment rates of two situations: where the land had been abandoned for at least 5 years and 10 years of unused cultivation. This was then plotted, see Figure 10. In Figure 10a, the average abandonment rate from 2013 to 2020 is 8.35%, and the average abandonment rate in Figure 10b is 2.4%. It can be seen that the defined time of abandonment is very important to accurately map abandoned land, and the average abandonment rate in our research was 14.55%, which accords with the actual results [20].
(2) The result of land use classification will affect the mapping of abandoned land. First, we created a time-series land use map, and then used the land use change detection method to identify abandonment according to the succession process of vegetation after the abandonment of cultivated land. Therefore, the error of land use classification will be transferred to the extraction of abandoned land, which is inevitable from a methodological point of view. Although the accuracy of land use classification is high, future research will improve the accuracy of classification to map abandoned land more accurately.

5. Conclusions

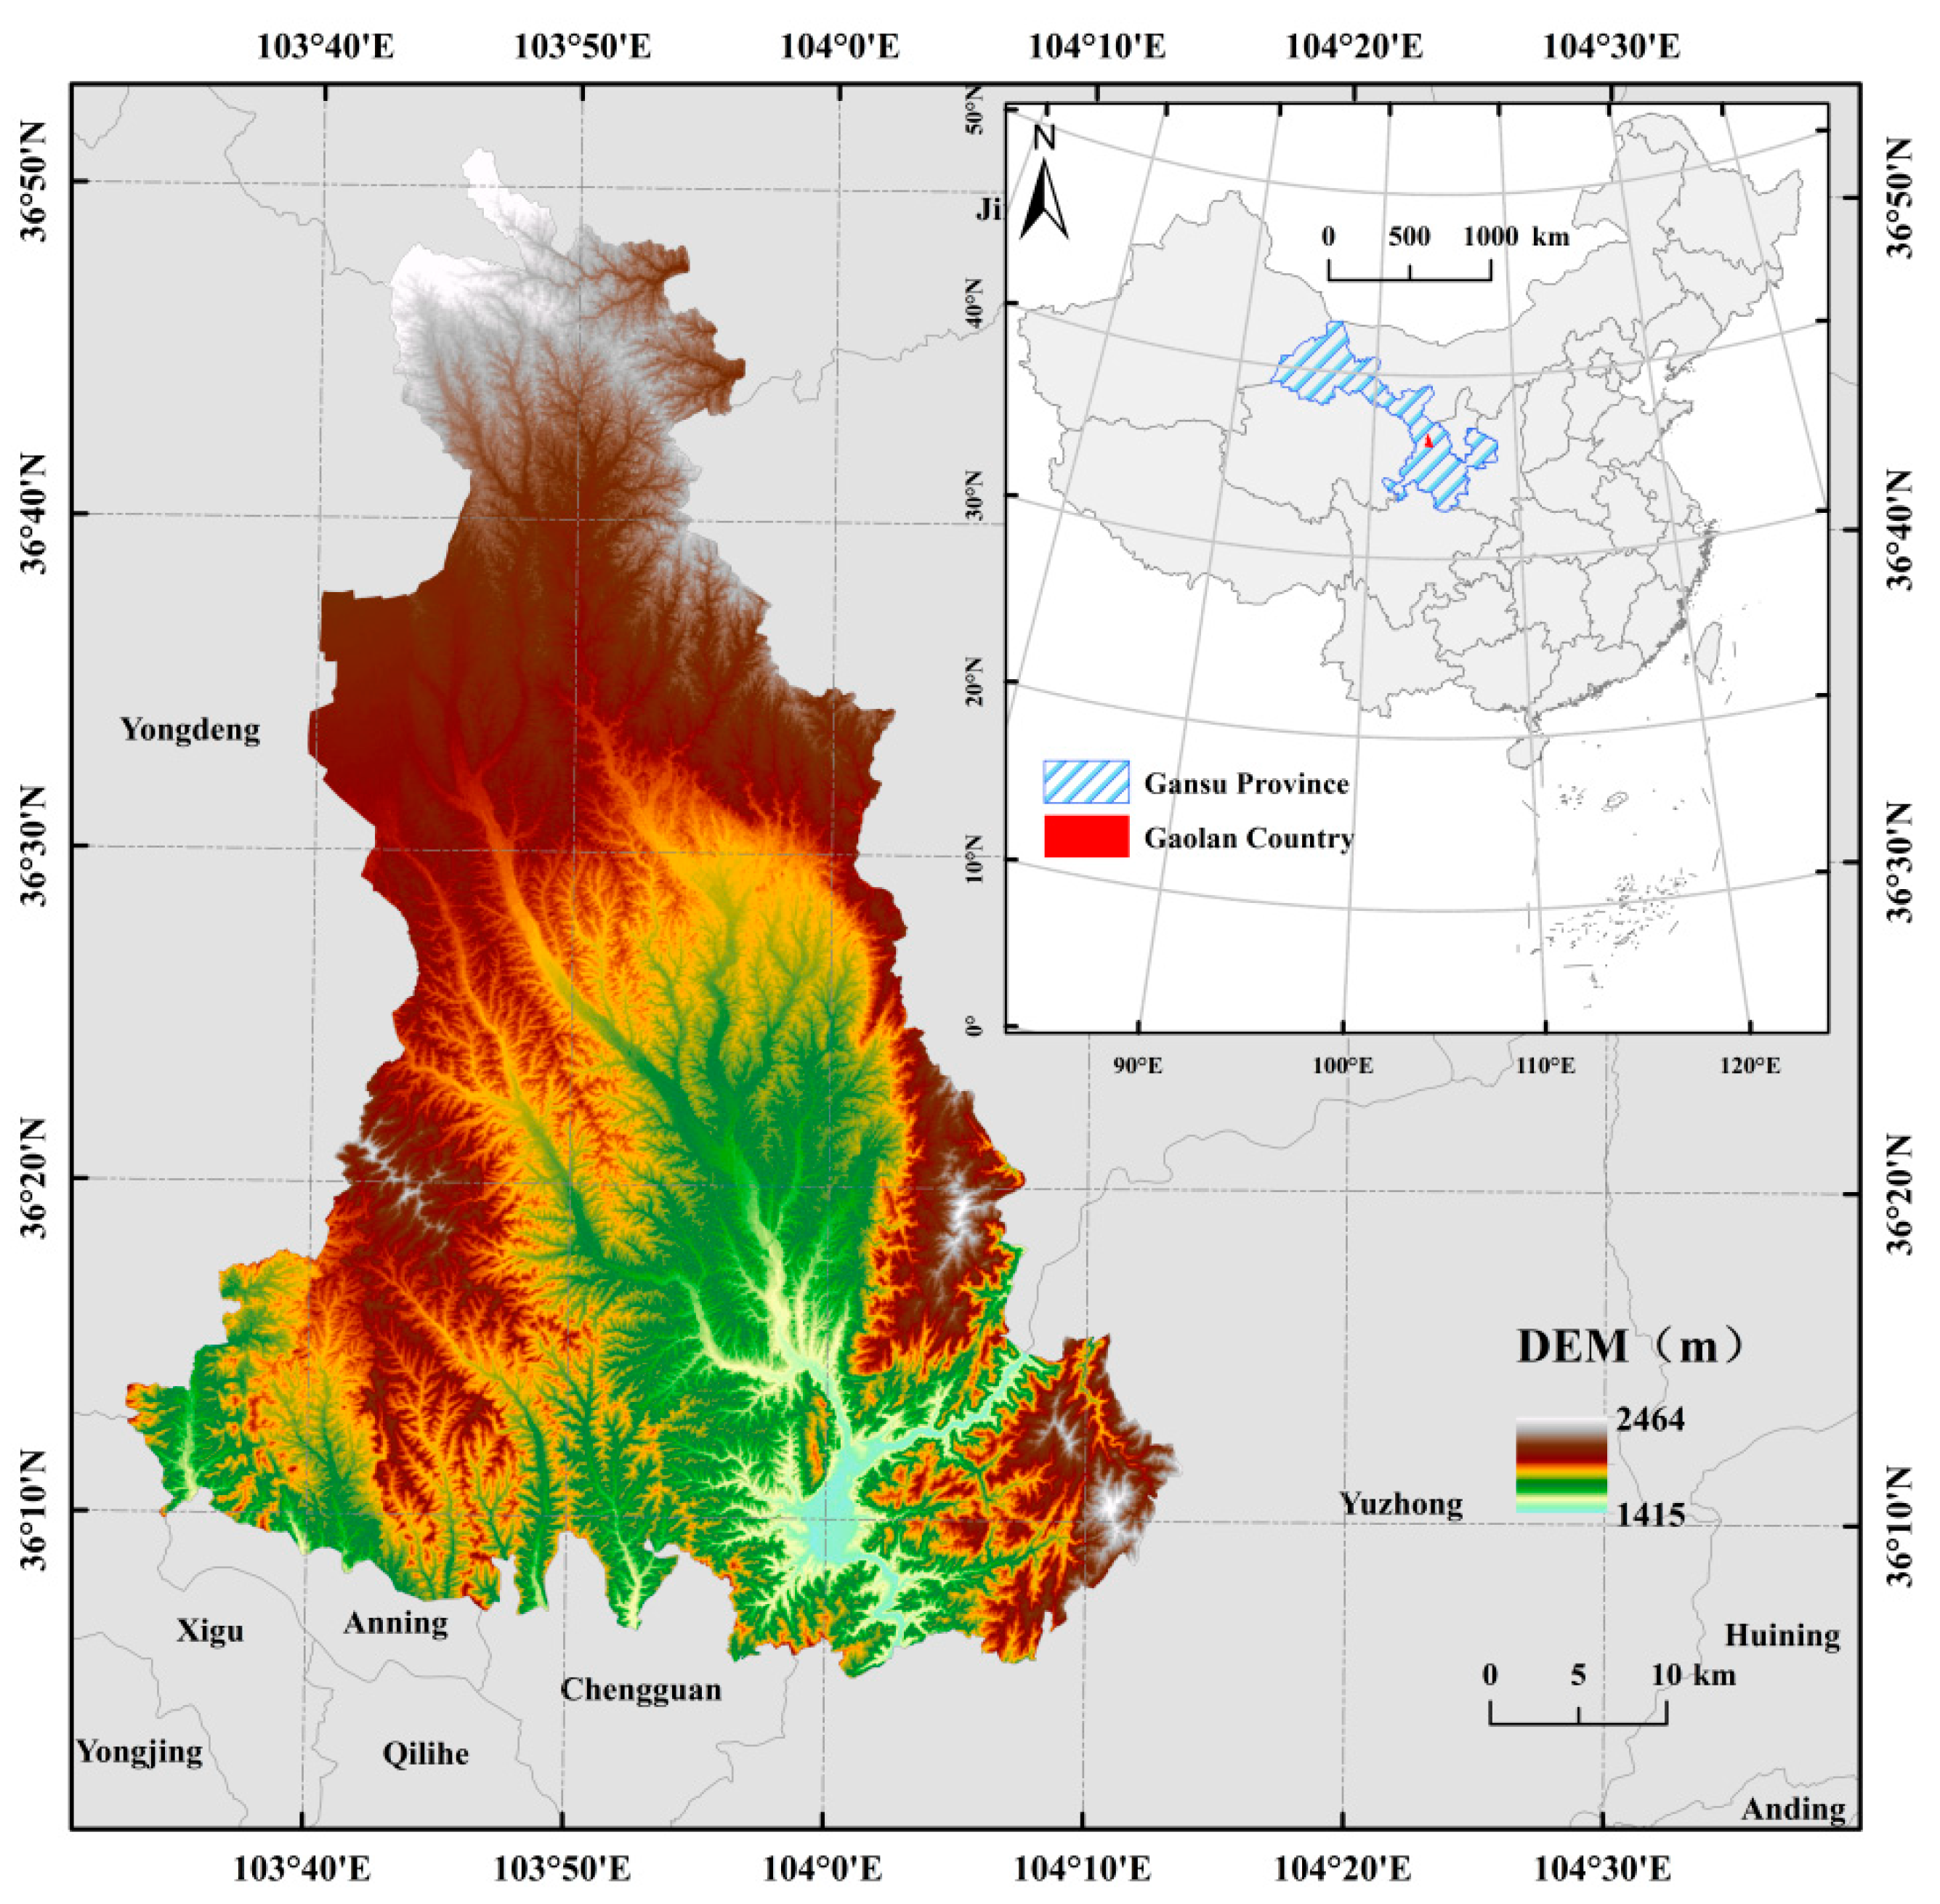
Based on Landsat’s time series image data, this paper uses the random forest classification method to draw abandoned land in the hilly and gully area of China’s Loess Plateau (from 2011 to 2020) by tracking land use trajectories, which provides a reference for drawing abandoned land in other hilly regions in the world. It also analyzes the influencing factors of the difference in the spatial distribution of cultivated land abandonment from the plot scale, in order to provide policy recommendations for decision makers.
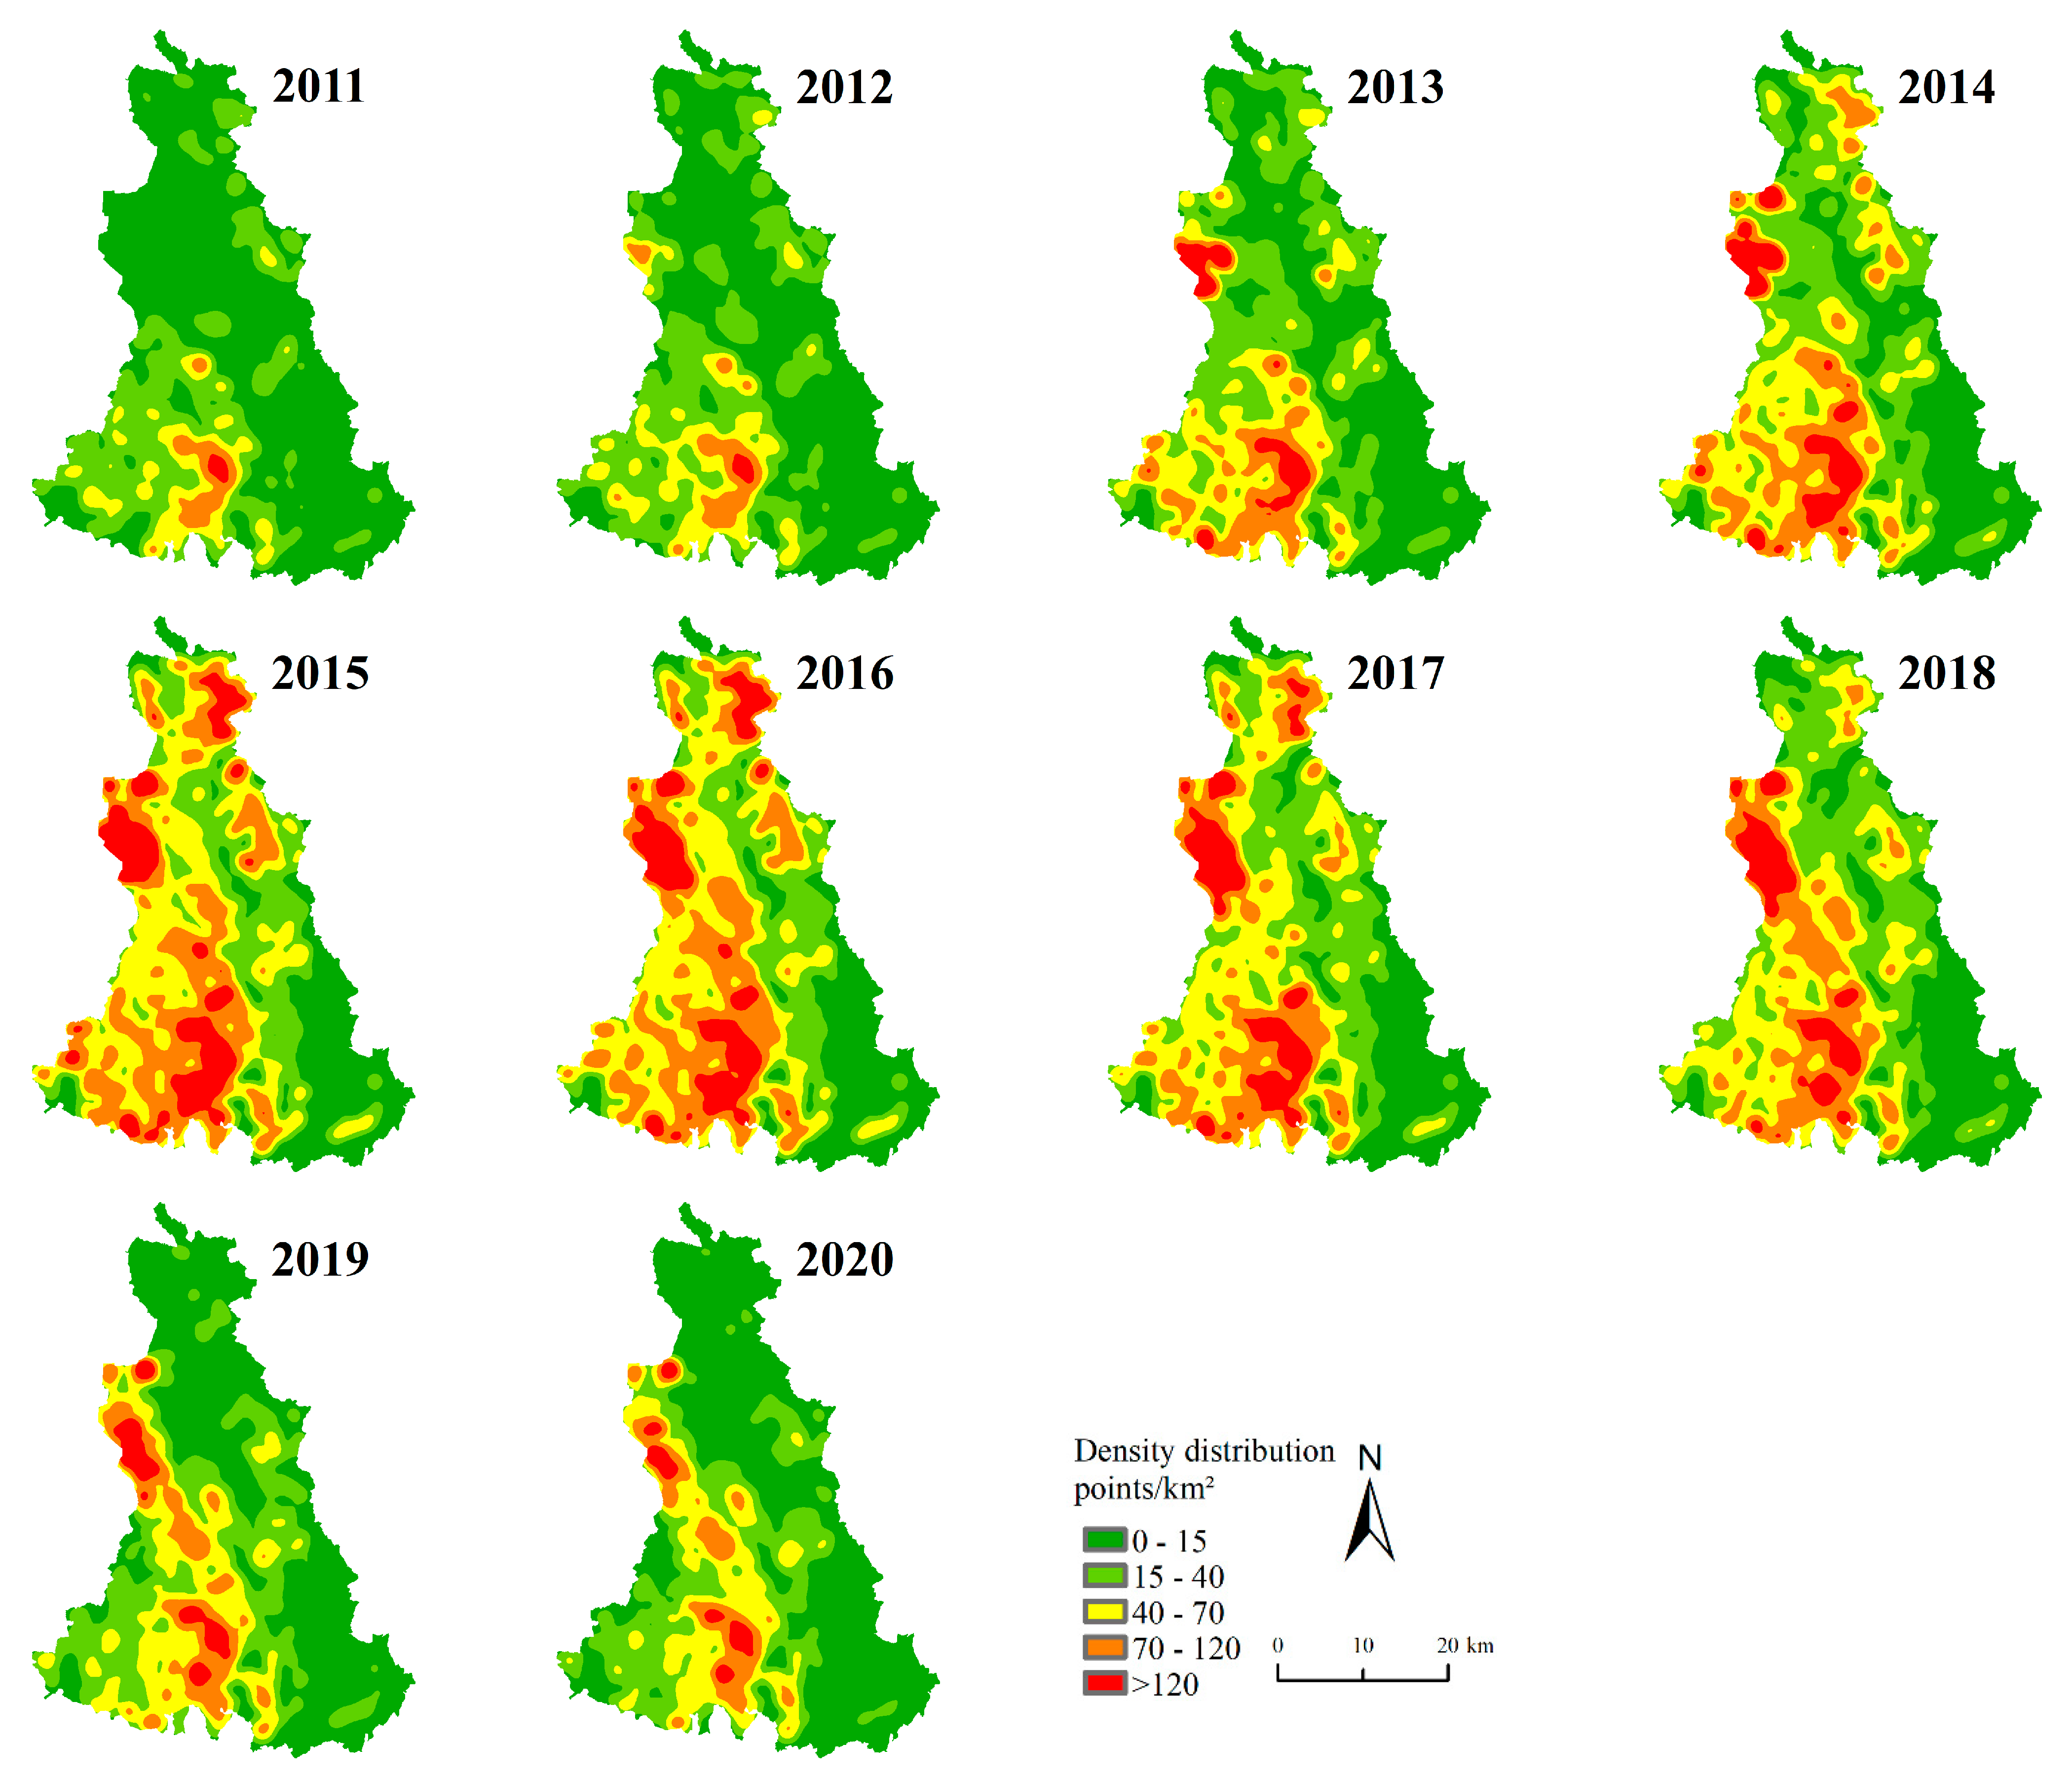
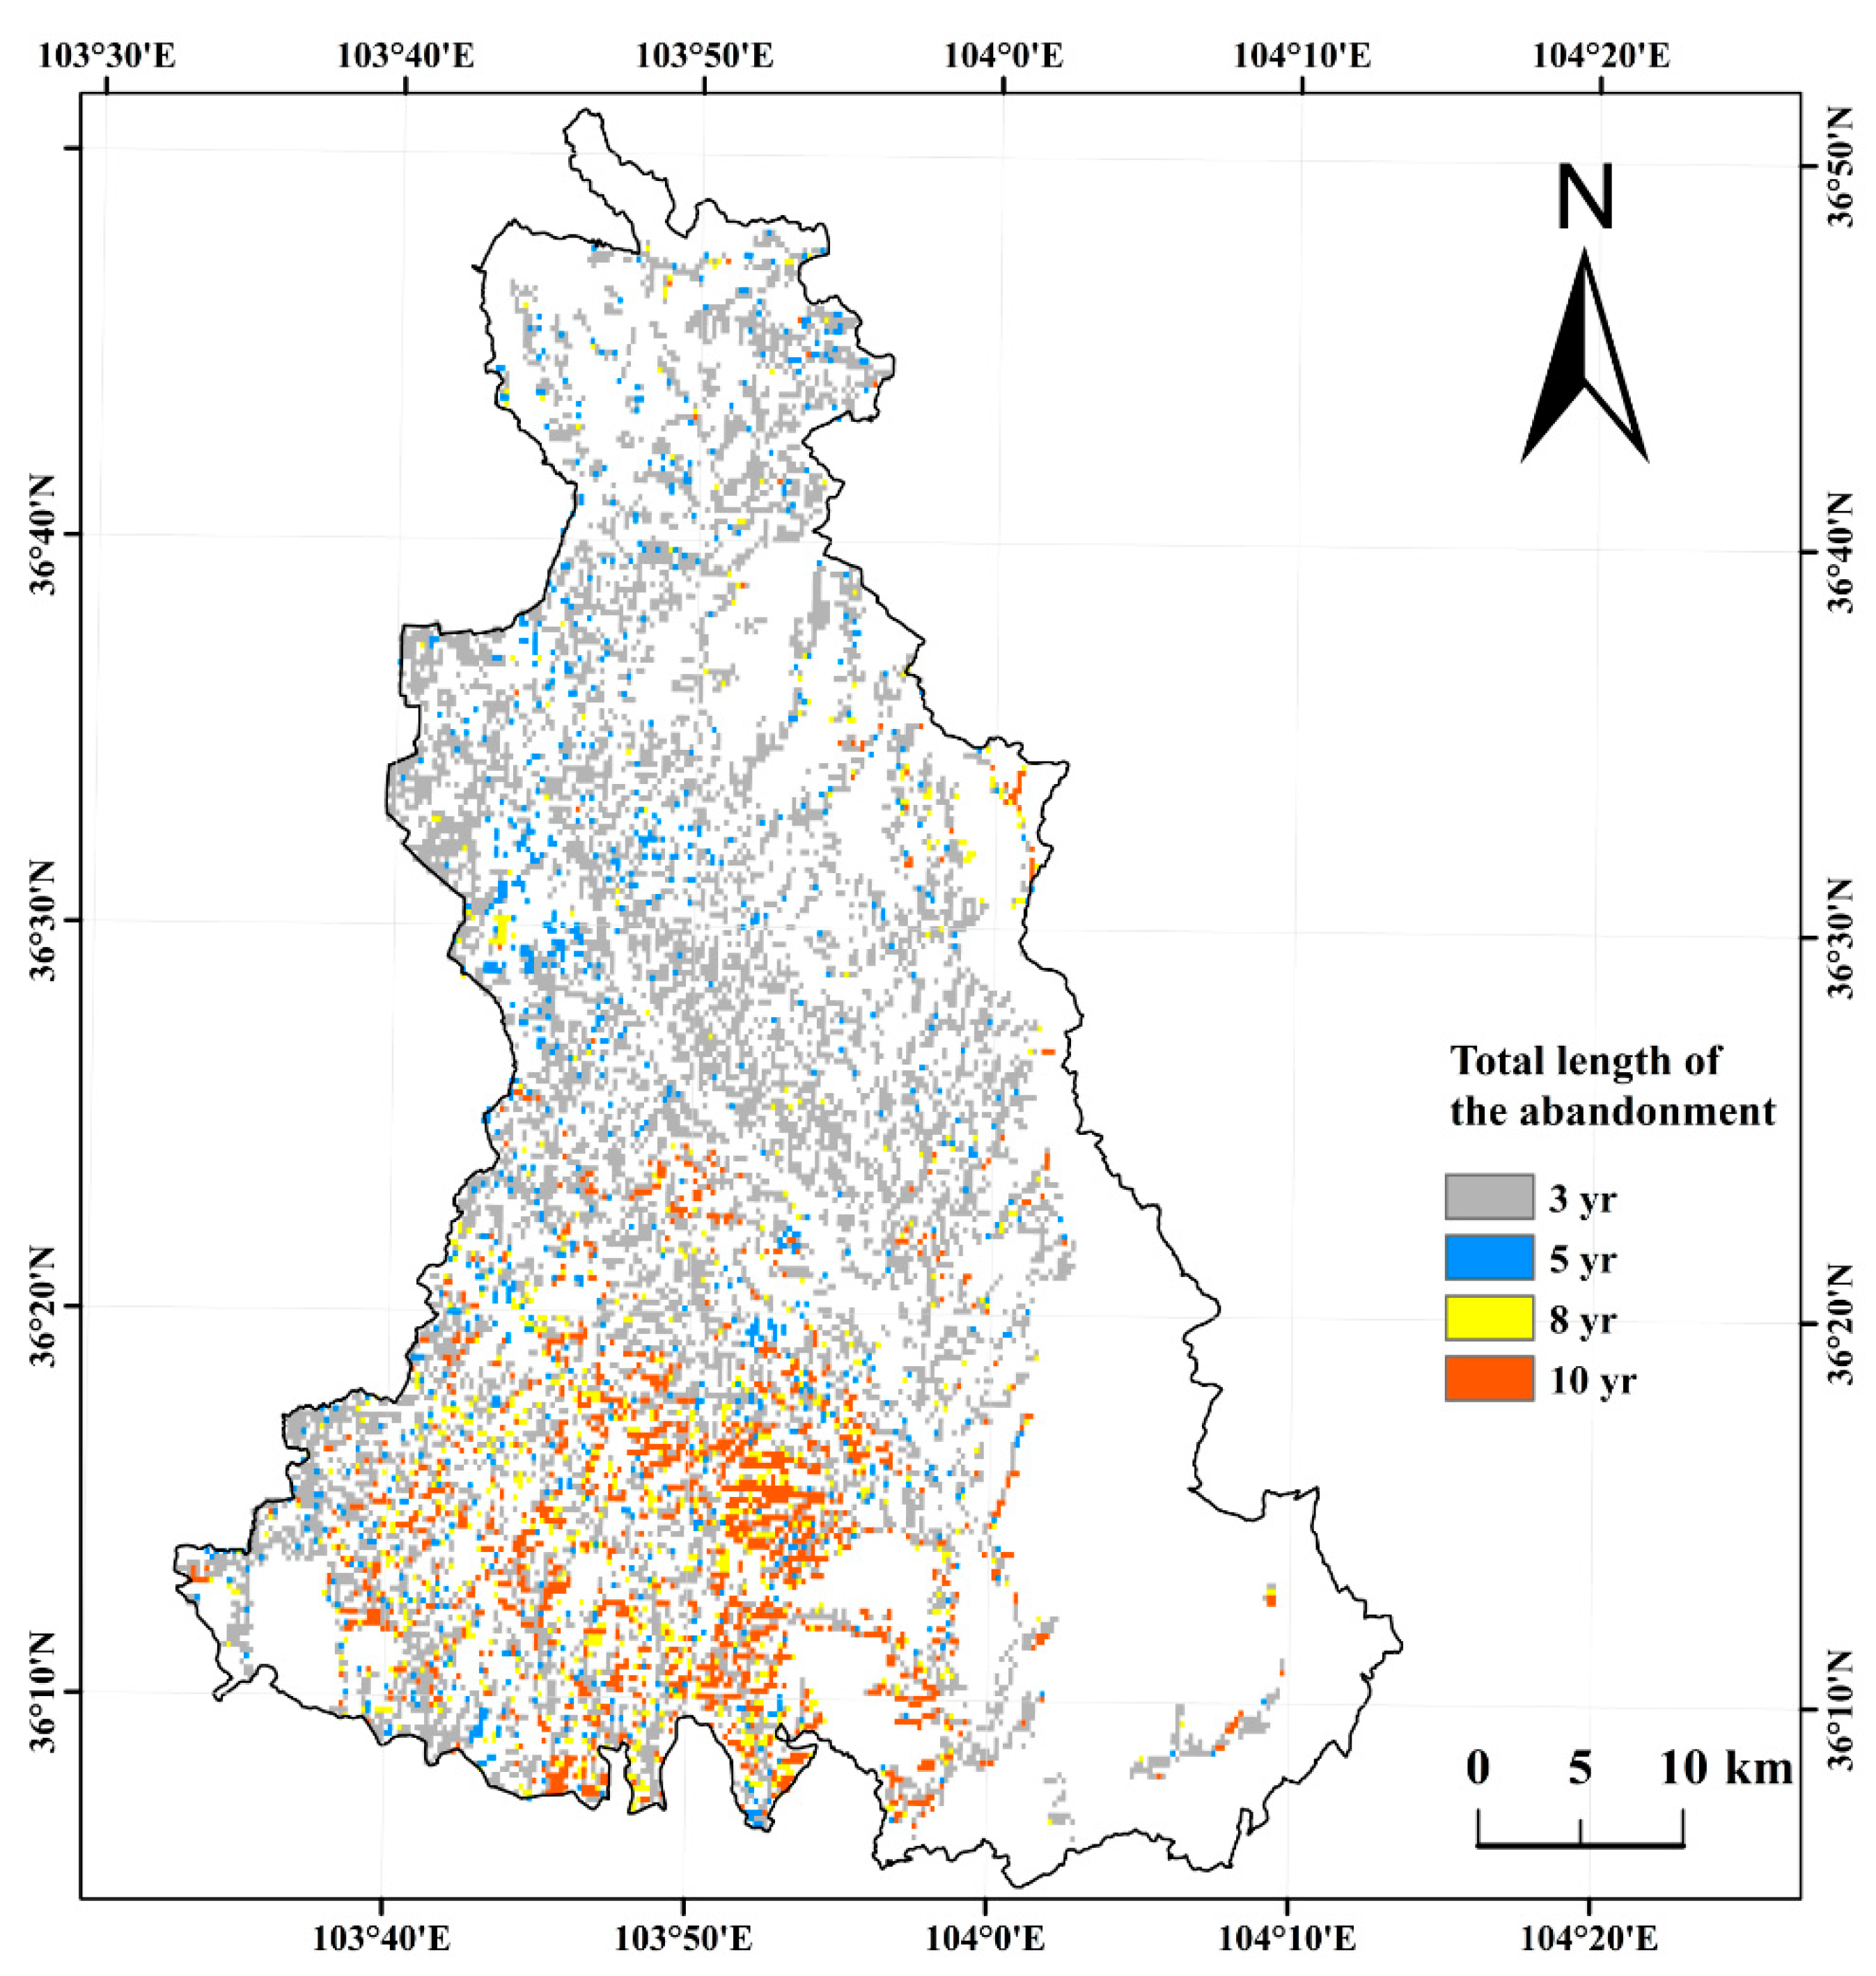
The average accuracy and kappa coefficient of land use classification are 91.35% and 0.88, respectively. The research revealed that the average abandonment rate in Gaolan County was 14.55% from 2013 to 2020, which was serious, and the total area of abandoned cropland was 15,259.04 ha. The abandonment rate first increased and then decreased. In 2015, the abandonment rate was highest; it then decreased year by year. The longest time of abandonment was 10 years and the total time was less than four years for most of the abandoned cropland. The kernel density ranged from 0 to 480 points/km2 and the increase in abandoned areas was mainly manifested in the increased distribution of medium and high-density regions. The People’s Government of Gaolan County has achieved increasingly remarkable results in remediating uncultivated land.
The influencing factors of plot scale can explain the difference in the spatial distribution of abandonment of cultivated land. The slope, soil type and soil fertility factors were selected to analyze their relationship with the abandonment rate. The higher the slope, the less conducive is the land to farming, and the greater the possibility of abandonment. The natural soil, in most areas of Gaolan County, is calcareous soil. Therefore, decision-makers in the hilly and gully areas of the Loess Plateau can encourage farmers to increase vegetation coverage in steep slope areas and consider returning farmland to pasture. On the other hand, we can consider opening up water sources for irrigated farmland to increase crop yields and, at the same time, consider increasing the proportion of leguminous crops, rational crop rotation and fertilization to improve soil fertility.

Author Contributions

Conceptualization, W.S.; methodology, Y.W. and W.S.; formal analysis, Y.W. and W.S.; investigation, W.S. and Y.W.; resources, W.S.; writing—original draft preparation, Y.W. and W.S.; writing—review and editing, W.S.; supervision, W.S. All authors have read and agreed to the published version of the manuscript.

Funding

This research was funded by the Projects of National Natural Science Foundation of China (grant number 42071233), the Second Tibetan Plateau Scientific Expedition and Research (grant number 2019QZKK0603), and the Strategic Priority Research of the Chinese Academy of Sciences (grant number XDA20040201).

Institutional Review Board Statement

Not applicable.

Informed Consent Statement

Not applicable.

Data Availability Statement

All relevant data sets in this study are described in the manuscript.

Conflicts of Interest

The authors declare no conflict of interest. The funders played no role in the design of the study, the collection, analyses, or interpretation of data, in the writing of the manuscript, or in the decision to publish the results.

References

  1. MacDonald, D.; Crabtree, J.R.; Wiesinger, G.; Dax, T.; Stamou, N.; Fleury, P.; Gutierrez Lazpita, J.; Gibon, A. Agricultural abandonment in mountain areas of Europe: Environmental consequences and policy response. J. Environ. Manag. 2000, 59, 47–69. [Google Scholar] [CrossRef]
  2. Cramer, V.A.; Hobbs, R.J.; Standish, R.J. What’s new about old fields? Land abandonment and ecosystem assembly. Trends Ecol. Evol. 2008, 23, 104–112. [Google Scholar] [CrossRef]
  3. Li, S.; Li, X. Global understanding of farmland abandonment: A review and prospects. J. Geogr. Sci. 2017, 27, 1123–1150. [Google Scholar] [CrossRef]
  4. Kuntz, K.A.; Beaudry, F.; Porter, K.L. Farmers’ Perceptions of Agricultural Land Abandonment in Rural Western New York State. Land 2018, 7, 128. [Google Scholar] [CrossRef] [Green Version]
  5. Shi, T.; Li, X.; Xin, L.; Xu, X. The spatial distribution of farmland abandonment and its influential factors at the township level: A case study in the mountainous area of China. Land Use Policy Int. J. Cover. All Asp. Land Use 2018, 70, 510–520. [Google Scholar] [CrossRef]
  6. Yu, Z.L.; Liu, L.; Zhang, H.; Liang, J.S. Exploring the Factors Driving Seasonal Farmland Abandonment: A Case Study at the Regional Level in Hunan Province, Central China. Sustainability 2017, 9, 187. [Google Scholar] [CrossRef] [Green Version]
  7. Romero-Díaz, A.; Ruiz-Sinoga, J.D.; Robledano-Aymerich, F.; Brevik, E.C.; Cerdà, A. Ecosystem responses to land abandonment in Western Mediterranean Mountains. CATENA 2017, 149, 824–835. [Google Scholar] [CrossRef] [Green Version]
  8. Raj Khanal, N.; Watanabe, T. Abandonment of Agricultural Land and Its Consequences. Mt. Res. Dev. 2006, 26, 32–40. [Google Scholar] [CrossRef] [Green Version]
  9. Lasanta, T.; Arnáez, J.; Pascual, N.; Ruiz-Flaño, P.; Errea, M.P.; Lana-Renault, N. Space–time process and drivers of land abandonment in Europe. CATENA 2017, 149, 810–823. [Google Scholar] [CrossRef]
  10. Aide, T.M.; Grau, H.R. Globalization, migration, and Latin American ecosystems. Science 2004, 305, 1915–1916. [Google Scholar] [CrossRef] [PubMed]
  11. Baumann, M.; Kuemmerle, T.; Elbakidze, M.; Ozdogan, M.; Radeloff, V.C.; Keuler, N.S.; Prishchepov, A.V.; Kruhlov, I.; Hostert, P. Patterns and drivers of post-socialist farmland abandonment in Western Ukraine. Land Use Policy 2011, 28, 552–562. [Google Scholar] [CrossRef]
  12. Zhang, Y.; Li, X.; Song, W. Determinants of cropland abandonment at the parcel, household and village levels in mountain areas of China: A multi-level analysis. Land Use Policy 2014, 41, 186–192. [Google Scholar] [CrossRef]
  13. Song, W.; Pijanowski, B.C. The effects of China’s cultivated land balance program on potential land productivity at a national scale. Appl. Geogr. 2014, 46, 158–170. [Google Scholar] [CrossRef]
  14. Gale, F.; Lohmar, B.; Tuan, F. China’s New Farm Subsidies. Electronic Outlook Report from the Economic Research Service. US Dep. Agric. 2005. [Google Scholar] [CrossRef]
  15. Estel, S.; Kuemmerle, T.; Alcántara, C.; Levers, C.; Prishchepov, A.; Hostert, P. Mapping farmland abandonment and recultivation across Europe using MODIS NDVI time series. Remote Sens. Environ. 2015, 163, 312–325. [Google Scholar] [CrossRef]
  16. Alcantara, C.; Kuemmerle, T.; Baumann, M.; Bragina, E.V.; Griffiths, P.; Hostert, P.; Knorn, J.; Müller, D.; Prishchepov, A.V.; Schierhorn, F.; et al. Mapping the extent of abandoned farmland in Central and Eastern Europe using MODIS time series satellite data. Environ. Res. Lett. 2013, 8, 035035. [Google Scholar] [CrossRef]
  17. Dara, A.; Baumann, M.; Kuemmerle, T.; Pflugmacher, D.; Rabe, A.; Griffiths, P.; Hölzel, N.; Kamp, J.; Freitag, M.; Hostert, P. Mapping the timing of cropland abandonment and recultivation in northern Kazakhstan using annual Landsat time series. Remote Sens. Environ. 2018, 213, 49–60. [Google Scholar] [CrossRef]
  18. Yin, H.; Prishchepov, A.V.; Kuemmerle, T.; Bleyhl, B.; Buchner, J.; Radeloff, V.C. Mapping agricultural land abandonment from spatial and temporal segmentation of Landsat time series. Remote Sens. Environ. 2018, 210, 12–24. [Google Scholar] [CrossRef]
  19. Yan, J.Z.; Yang, Z.Y.; Li, Z.H.; Li, X.B.; Xing, L.J.; Sun, L.X. Drivers of cropland abandonment in mountainous areas: A household decision model on farming scale in Southwest China. Land Use Policy 2016, 57, 459–469. [Google Scholar] [CrossRef] [Green Version]
  20. Li, S.; Li, X.; Xin, L.; Tan, M.; Wang, X.; Wang, R.; Jiang, M.; Wang, Y. Extent and distribution of cropland abandonment in Chinese mountainous areas. Resour. Sci. 2017, 39, 1801–1811. [Google Scholar] [CrossRef]
  21. Alcantara, C.; Kuemmerle, T.; Prishchepov, A.V.; Radeloff, V.C. Mapping abandoned agriculture with multi-temporal MODIS satellite data. Remote Sens. Environ. 2012, 124, 334–347. [Google Scholar] [CrossRef]
  22. Shi, T.; Li, X.; Xin, L.; Xu, X. Analysis of Farmland Abandonment at Parcel Level: A Case Study in the Mountainous Area of China. Sustainability 2016, 8, 988. [Google Scholar] [CrossRef] [Green Version]
  23. Han, Z.; Song, W. Spatiotemporal variations in cropland abandonment in the Guizhou–Guangxi karst mountain area, China. J. Clean. Prod. 2019, 238, 117888. [Google Scholar] [CrossRef]
  24. Song, W. Mapping cropland abandonment in mountainous areas using an annual land-use trajectory approach. Sustainability 2019, 11, 5951. [Google Scholar] [CrossRef] [Green Version]
  25. Gorelick, N.; Hancher, M.; Dixon, M.; Ilyushchenko, S.; Thau, D.; Moore, R. Google Earth Engine: Planetary-scale geospatial analysis for everyone. Remote Sens. Environ. 2017, 202, 18–27. [Google Scholar] [CrossRef]
  26. Rao, Y.; Zhang, J.; Wang, K.; Jepsen, M.R. Understanding land use volatility and agglomeration in northern Southeast Asia. J. Environ. Manag. 2021, 278, 111536. [Google Scholar] [CrossRef] [PubMed]
  27. Liu, L.; Xu, X.L.; Zhuang, D.F.; Chen, X.; Li, S. Changes in the Potential Multiple Cropping System in Response to Climate Change in China from 1960–2010. PLoS ONE 2013, 8, e80990. [Google Scholar] [CrossRef]
  28. 2010–2019 Statistics Bulletin of the National Economic and Social Development of Gaolan County. Available online: http://www.gaolan.gov.cn/ (accessed on 3 February 2021).
  29. Google Earth Engine. Available online: https://code.earthengine.google.com/ (accessed on 20 September 2020).
  30. Resource and Environment Science and Data Center. Available online: https://www.resdc.cn/ (accessed on 25 September 2020).
  31. Geospatial Data Cloud. Available online: https://www.gscloud.cn/ (accessed on 20 October 2020).
  32. Beijing Qianfan Shijing Technology Co., L. Available online: http://www.91weitu.com/ (accessed on 20 December 2020).
  33. Food and Agriculture Organization of the United Nations. Available online: https://www.fao.org/soils-portal/soil-survey/soil-maps-and-databases/harmonized-world-soil-database-v12/en/ (accessed on 18 November 2021).
  34. Soil SubCenter, National Earth System Science Data Center, National Science & Technology Infrastructure of China. Available online: http://soil.geodata.cn (accessed on 18 November 2021).
  35. Nunes, A.; Coelho, C.D.O.A.; De Almeida, A.; Figueiredo, A. Soil erosion and hydrological response to land abandonment in a central inland area of Portugal. Land Degrad. Dev. 2010, 21, 260–273. [Google Scholar] [CrossRef]
  36. Xiao, G.; Zhu, X.; Hou, C.; Xia, X. Extraction and analysis of abandoned farmland: A case study of Qingyun and Wudi counties in Shandong Province. J. Geogr. Sci. 2019, 29, 581–597. [Google Scholar] [CrossRef] [Green Version]
  37. Zha, Y.; Gao, J.; Ni, S. Use of normalized difference built-up index in automatically mapping urban areas from TM imagery. Int. J. Remote Sens. 2003, 24, 583. [Google Scholar] [CrossRef]
  38. Araujo Picoli, M.C.; Camara, G.; Sanches, I.; Simoes, R.; Carvalho, A.; Maciel, A.; Coutinho, A.; Esquerdo, J.; Antunes, J.; Begotti, R.A. Big earth observation time series analysis for monitoring Brazilian agriculture. ISPRS J. Photogramm. Remote Sens. 2018, 145, 328–339. [Google Scholar] [CrossRef]
  39. Gislason, P.O.; Benediktsson, J.A.; Sveinsson, J.R. Random Forests for land cover classification. Pattern Recognit. Lett. 2006, 27, 294–300. [Google Scholar] [CrossRef]
  40. Breiman, L. Random forests. Mach. Learn. 2001, 45, 5–32. [Google Scholar] [CrossRef] [Green Version]
  41. Guo, Y.; Song, W. Spatial Distribution and Simulation of Cropland Abandonment in Wushan County, Chongqing, China. Sustainability 2019, 11, 1367. [Google Scholar] [CrossRef] [Green Version]
  42. Khurshid, H.; Khan, M.F. Segmentation and Classification Using Logistic Regression in Remote Sensing Imagery. IEEE J. Sel. Top. Appl. Earth Obs. Remote Sens. 2014, 8, 224–232. [Google Scholar] [CrossRef]
  43. Zhang, X.; Zhang, M.; He, J.; Wang, Q.; Li, D. The Spatial-Temporal Characteristics of Cultivated Land and Its Influential Factors in The Low Hilly Region: A Case Study of Lishan Town, Hubei Province, China. Sustainability 2019, 11, 3810. [Google Scholar] [CrossRef] [Green Version]
  44. Cai, X.J.; Zhi-Feng, W.U.; Cheng, J. Analysis of road network pattern and landscape fragmentation based on kernel density estimation. Chin. J. Ecol. 2012, 31, 158–164. [Google Scholar] [CrossRef]
Figure 1. Geographic location of the study area.
Land 10 01341 g001
Figure 2. Changes in the industrial structure of Gaolan county from 2010 to 2019 (A); Rural population and percentage of the total population over the same period (B).
Land 10 01341 g002
Figure 3. Technical route for abandoned cropland identification.
Land 10 01341 g003
Figure 4. Extraction of abandoned croplands with land use trajectory (note: modified from Song [24]).
Land 10 01341 g004
Figure 5. Overall accuracy and kappa coefficients for 2011–2020.
Land 10 01341 g005
Figure 6. Results of land use classification in Gaolan County.
Land 10 01341 g006
Figure 7. Spatial distribution of abandoned cropland in Gaolan County.
Land 10 01341 g007
Figure 8. Spatial distribution of kernel density for abandoned cropland in Gaolan County from 2011 to 2020.
Land 10 01341 g008
Figure 9. Distribution of total length of the abandonment (years) in Gaolan County.
Land 10 01341 g009
Figure 10. Abandoned land is the distribution of the total abandonment period for cultivated land that has not been used for at least 5 years (a) and the cultivated land that has not been used for at least 10 years (b).
Land 10 01341 g010
Table 1. Landsat image information.
Data SourceImage Set IDYearNumbers (Scene)
Landsat 5LANDSAT/LT05/C01/T1_TOA201128
Landsat 7LANDSAT/LE07/C01/T1_TOA201218
Landsat 8LANDSAT/LC08/C01/T1_TOA2013–2020224
Table 2. Mean PA and UA for different land use types from 2011 to 2020.
Land Use TypeProducer’s AccuracyUser’s Accuracy
Cropland96.04%89.61%
Forest93.36%95.44%
Grassland82.47%89.21%
Built-up Land81.99%98.32%
Water95.04%100%
Table 3. Statistical results regarding abandoned cropland in Gaolan County from 2013 to 2020.
YearAbandonment Area (ha)Abandonment Rate (%)
20136873.8511.14
20149089.0314.73
201512,124.8819.65
201611,982.9619.42
201710,656.3217.27
20189644.3715.63
20196256.8110.14
20205189.328.41
Table 4. Abandoned areas of different total length of abandonment in Gaolan County.
Total Length of the Abandonment (Year)Abandonment Area (ha)
35020.24
42969.07
51533.54
61716.64
71055.79
81066.09
9430.81
101466.75
Table 5. Abandonment rate of different slope ranges in Gaolan County.
Slope (°)0–22–66–1515–2525–4545–62
Abandonment area (ha)60530236466364012968.6
Cropland (ha)329816,80727,37611,260294516
Abandonment rate (%)18.3417.9923.6232.334453.75
Table 6. Percentage of abandonment rate of different soil types.
Soil TypeCalcisolsCambisolsAnthrosolsArenosols
Percentage of abandonment rate (%)65.8214.639.0510.5
Publisher’s Note: MDPI stays neutral with regard to jurisdictional claims in published maps and institutional affiliations.

