Article

Research on the Influencing Factors of Urban Ecological Carrying Capacity Based on a Multiscale Geographic Weighted Regression Model: Evidence from China

1
School of Economics and Management, Zhengzhou University of Light Industry, Science Avenue 136, Zhengzhou 450001, China
2
Economics School, Zhongnan University of Economics and Law, Nanhu Avenue 182, Wuhan 430073, China
*
Author to whom correspondence should be addressed.
Land 2021, 10(12), 1313; https://doi.org/10.3390/land10121313
Submission received: 8 November 2021 / Revised: 23 November 2021 / Accepted: 26 November 2021 / Published: 28 November 2021
(This article belongs to the Special Issue Land Use Futures for a Sustainable Anthropocene)

Abstract

:
Based on the comprehensive evaluation method, a comprehensive urban ecological carrying capacity (UECC) evaluation system is established. It includes ecological support, ecological resilience, and ecological pressure. Multiscale geographically weighted regression (MGWR) was used to conduct a thorough examination of the spatial and temporal patterns, and the factors that influenced the UECC of 286 prefecture-level cities in China from 2010 to 2019. The results show that (1) China’s UECC index ranges from 0.0233 to 0.2811 in 2019, which is still at a low level. (2) The spatial distribution is relatively stable: high-value agglomerations of UECC are distributed primarily in the Yangtze River Delta and Pearl River Delta, while low-value agglomerations are primarily distributed in the regions in the Central Plains. (3) All influencing factors have a positive effect on the improvement of UECC and are heterogeneous in spatial distribution. Lastly, this paper gives corresponding suggestions, so that governments can formulate differentiated policies and effectively improve UECC.

1. Introduction

Since 2019, China has deployed several ecosystem restoration actions, such as the high-quality development of the Yellow River Basin, and the “ten-year ban on fishing” in critical areas of the Yangtze River Basin, demonstrating China’s environmental protection and pollution-reduction efforts. Ecosystem restoration involves the economy, society, population, energy, and other aspects. It requires the coordination of energy security, economic development, social livelihood, cost input, and many other factors. These put forward higher requirements for human economic activities and the natural ecological environment. The ecological environment is related to the high-quality development of central cities and urban agglomerations and increase in urban ecological carrying capacity (UECC). As one of the three elements of ecosystem science, UECC is the limit of social and economic activities undertaken by human beings based on the protection of the ecological environment and maintaining ecologically sustainable development [1]. Rapid economic growth and increased industrialization have led to the destruction of the ecological environment. At present, China’s environment demand per capita has exceeded twice the productivity of the ecosystem [2]. However, the supply of an ecosystem is usually determined by the natural capacity. Neither technological innovation nor industrial development can change the raw capacity. Calculating the level of UECC, determining influencing factors and their spatial heterogeneity, coordinating the relationship between UECC and sustainable urban development, improving UECC of low-level areas, implementing new development concepts, and realizing sustainable economic development will have a bearing on urban destiny in the future.
Based on spatial panel data of China’s 286 prefecture-level cities from 2010 to 2019, we built a comprehensive evaluation system to evaluate UECC based on multidimensional indicators, established multiscale geographic weighted regression model (MGWR) that can reflect geographic spatial characteristics, and to better understand the development law of UECC and realize the coexistence of humans and nature in harmony, analyzed the influencing factors of ECC as a spatial change system. The innovations are as follows: (1) Construction of new evaluation system of UECC: The existing literature mostly constructs a system of ECC evaluation indexes from two aspects: ecological support capacity and ecological pressure. Based on the self-regulation and self-repair of UECC, this paper introduces ecological resilience to evaluate UECC from the three subsystems of ecological support capacity, ecological resilience and ecological pressure, making the evaluation system more comprehensive and the evaluation results more accurate. (2) Research method: This article uses MGWR to analyze the influence mechanism of UECC. Compared with traditional geographically weighted regression (GWR), MGWR is a spatial model that is more practical and closer to actual conditions. It takes into account the various impact scales of other variables to avoid too much noise. It allows each variable to own spatial smoothing themselves, thereby solving the GWR model. (3) Study area: Most of the existing areas use MGWR to analyze the UECC of a specific region, this article choose 286 cities in China, more samples can highlight its advantages, obtain more accurate results.
The following is the remainder of this paper: Section 1.1 offers a literature review. Section 2 introduces the data sources and research methods. Section 3 demonstrates the spatial correlation of UECC, and Section 4 examines the driving forces of UECC. Section 5 gives conclusions and suggestions.

1.1. Literature Review

Carrying capacity was applied in ecological fields at the beginning and was defined as the largest quantity of individuals that can be accommodated without damaging the pasture [3]. Its development has roughly relied on four fields: population [4], resources [5,6], environment [7,8], and UECC [9,10]. For humans, carrying capacity is the maximum extent of resource consumption and pollution emissions that can occur without compromising the basic functions of relevant ecosystems in a certain area [9]. Generally, the supply capacity of the ecosystem determines the carrying capacity threshold. The research on UECC mostly concentrates on the following aspects: (1) the connotation of UECC. UECC is viewed as a comprehensive concept based on resources and environmental carrying capacity. From the standpoint of the natural resource supply, UECC is the resource supply capacity of ecosystems that supports human survival and development [11], the renewal capacity of ecosystems, and the ability to absorb pollution from human emissions [12]. As an important part of sustainable ecological development, UECC reflects the harmonious and symbiotic relationship between humans and ecosystem. However, due to the complexity of social-economic-ecological systems, the academic community has not yet defined the concept of UECC. Scholars generally believe that it objectively reflects the self-regulation ability of the ecosystem and the ability to maintain ecological balance [13], and the endurance of an external disturbance, especially human activities [14]. It is seen as a comprehensive reflection of the material composition and structure of the ecological environment system [15]. In urban artificial ecosystems, there are energy sources, resource inputs, and waste discharges, which require urban ecosystems to provide support and adjust to urban development services. This ability is called UECC [16]. The study of UECC is conducted to examine the regional ecological environment that affects human activities, thereby aiming to regulate those activities and promote the sustainable development of the economy and society in some regions [17]. (2) Research methods and research areas of UECC. Measuring and comparing UECC quantitatively is important to formulate economic growth policies and ecological construction scientifically. The existing studies divide UECC evaluation methods into three categories: ① Under the index system evaluation method, UECC is evaluated by constructing various indicators. These include the “drive-state-response” system established by the United Nations Commission on Sustainable Development (UNCSD) [18], the comprehensive evaluation method of UECC [15], the ecological footprint method [19], and the state space method [20]. ② The product cycle evaluation method emphasizes the relationship between various processes in the element life cycle process, including energy theory [21,22], life cycle theory [23], and material flow theory [24,25,26]. ③ Under the comprehensive evaluation method, the connection of various elements is established through the construction of a model. Included in these approaches are natural vegetation net primary productivity estimation method, system dynamics [27], remote sensing (RS), and geographic information system (GIS) analysis [24,28]. Combined with GIS, an approach using methods, such as the entropy method [29], the principal component analysis method [30], gives weights to indicators that can utilize to analyze the evolutionary characteristics of UECC, the degree of coupling and coordination between UECC, human capital as well as the economy, and to examine the influence path of a certain factor on UECC from space and time dimensions to a certain country, urban agglomerations [31,32,33], provinces and cities [34,35,36], and a specific area [37]. There is a certain reference significance for scientific decision-making and proper policy implementation. (3) The influencing factors of UECC also represent a research focus. UECC is a dynamic change process within a certain time and space and the resource consumption, the degree of social and economic growth, and the number of people at a certain scale of consumption that the ecosystem can support under self-regulation and human action. It will be influenced by the natural environment, industrial layout, population size, and development level. First, the natural environment will be severely damaged when economic development exceeds the limit of UECC, leading to problems with UECC [38]. Slowing down the speed of economic development appropriately and increasing funds in environmental investment is important so that economic development can re-adapt the level of UECC [16] and weaken the pressure of environmental pollution [39]. Meanwhile, an increase in human capital investment brought about by economic growth has improved the quality of human capital, thereby improving the ecological environment. On the one hand, higher levels of education and environmental awareness enable humans to restrict their behavior and actively promote the consumption of green products. More consumption of environmentally friendly products can reduce carbon emissions and reduce environmental degradation [40], improving UECC. On the other hand, the scale, quality, and structure of talent, the concentration of talent resources, and the establishment of technical resource sharing platforms are closely related to the quality of resources and environment [41]. Second, the natural resource endowment of a certain area determines the appropriate type of industry in the area. When the industrial structure of some key ecological function areas is different from the positioning of functional areas, UECC will be overloaded [42], and technological innovation is the internal driving force that promotes manufacturing structure transformation and upgrading. Innovative development is conducive to reducing factor input, lowering costs, improving enterprise production efficiency, accelerating industrial structure optimization, and reducing the problem of resource-based cities’ poor sustainability [43] brought about by resource-based industries and labor simplification [44], resolving the dilemma of environmental pollution and economic growth and promoting the enhancement of UECC. Moreover, the role of technological innovation is critical in effectively using traditional energy and producing new renewable energy, increasing the overall supply of renewable energy [45]. Through the green transition, renewable energy will grow faster than nonrenewable energy. This transition results in a decrease in total energy consumption, enhances economic sustainability [46], and maintains the safety of the ecological environment. Third, urbanization, as an internal manifestation of human social progress, will bring about the industry and population agglomeration, technological upgrading, and changes in human lifestyles, which will have different effects on ecological efficiency. Therefore, urbanization is the key factor in regional ecological efficiency [47]. Finally, the pollution paradise hypothesis states that foreign investment by developed countries will transfer polluting industries or products to developing countries with relatively loose environmental regulations. Under this assumption, foreign direct investment (FDI) will directly increase local carbon dioxide emissions and exacerbate the host country’s environmental pollution [48,49]. However, as the level of local marketization increases, carbon dioxide emissions of FDI will decrease [50]. There are different views on whether introducing cleaner technology and stricter industry supervision by FDI will cause positive technology and industrial upgrade spillover effects in the host country [51].
In summary, the existing literature’s research methods on UECC have gradually changed from static to dynamic and from time to space, and the research areas have ranged from a particular region to a province and from a city to a country and a continent, laying a theoretical and practical base for subsequent study. Existing studies have seldom considered the spatial heterogeneity of the impact of various factors on different regions, and deviations may occur when implementing policies, which will not only increase decision-making costs but also increase decision-making risks. Compared to this, this paper formulates differentiated policies for different regions, distinguishes between the effects of various factors on UECC at the very beginning.

2. Materials and Methods

2.1. Research Methods

2.1.1. Comprehensive Evaluation Method

The weights and comprehensive scores of various indicators were calculated through the entropy method, and the ECC level of 286 cities in China was measured. Then, the comprehensive evaluation method was applied to evaluate ECC. The expression of the ECC index is as follows:
UECC = aESC + bEP + cERC.
In Formula (1), UECC is the urban ecological carrying capacity index; ESC is the ecological support capacity index; EP is the ecological pressure index; ERC is the ecological resilience index; and a, b, and c indicate contribution coefficients of the ecological support capacity, the ecological pressure, and the ecological resilience. a + b + c = 1, and after weighing the three indices, the values of a, b, and c are obtained. The higher the UECC value is, the stronger the urban ecological carrying capacity.

2.1.2. Exploratory Spatial Data Analysis

Exploratory spatial data analysis (ESDA) takes spatial relevance as the core, uses GIS platform technology to describe and visualize the spatial distribution pattern of things, and quantitatively explores the spatial distribution pattern of UECC in a particular area, which can reveal its spatial aggregation effect and spatial action mechanisms more intuitively, including the global autocorrelation and local autocorrelation.
Global Spatial Autocorrelation Analysis
Global spatial autocorrelation examines the overall correlation in space and the differences of UECC among 286 cities in China. The global Moran’s I index measures its correlation characteristics in space and analyzes its spatial agglomeration situation. The formula is
I = i = 1 n j = 1 n w ij x i   x ¯   x j   x ¯ S 2 i = 1 n j = i n w ij .
In Formula (2), I is global Moran’s I, x ¯ is 1 n i = 1 n x i , n represents the number of cities, xi and xj are UECC of city i and city j, and Wij is the space weight matrix. Moran’s I usually ranges from −1 to 1. If the value is considered positive, it means that a positive spatial correlation exists; that is, UECC has high-high or low-low accumulation in space. If the value is less than 0, it denotes a significant spatial difference between the area, and its surrounding area.
Local Spatial Autocorrelation Analysis
The degree and significance of regional spatial differences are measured by local spatial autocorrelation in the UECC of 286 cities in China. This index can be used to find out where the UECC hot spots and cold spots are located. The calculation formula is
G i * = j = 1 n W ij x j j = 1 n x j .
To facilitate comparison, standardize G i * :
Z G i * = G i * E G i * V a r G i * .
In Formulas (3) and (4), Wij is the space weight defined by the distance rule, the same space range is adjacent to 1 and non-adjacent to 0, and E G i * and V a r G i * are the mathematical expectation and variance of G i * . If Z ( G i * ) is positive and significant, indicating that UECC around location i is greater than the average value and belongs to high-value spatial clusters (hot spots); otherwise, it belongs to low-value spatial clusters (cold spots).

2.1.3. Multiscale Geographically Weighted Regression Model

Each variable in the model can have a different spatial smoothing level and bandwidth with MGWR, which overcomes the traditional GWR limitation of only fitting a single optimal bandwidth [52], making the space process model more realistic and valuable [53]. MGWR requires large size of samples, this paper has 286 prefecture-level cities in China which meets the requirements. The formula is
y i = j = 1 k β bij u i ,   v i x ij + ε i .
In the Formula (5), β bij represents the regression coefficient of the local variable, b i j represents the bandwidth used by the regression coefficient of the j-th variable, u i ,   v i represents the spatial coordinates of the i-th sample point, x ij is the j-th variable’s observed value at the i-th point, and ε i is the random disturbance term.

2.2. Variable Selection

A city is a highly complex integrated system. UECC will show complex differences because of initial conditions and boundary conditions. According to the definition of UECC, this paper divides the support layer into ecological resilience and ecological support capacity. The pressure layer is defined as ecological pressure to build an evaluation index system for UECC, as shown in Table 1. The narrative is as follows:
The ability of an ecosystem to maintain its original state in the face of external disturbance is known as ecological resilience [54] and it is mainly divided into resilient intensity and resilient limit [55]. Among them, resilient intensity is the nature of an ecosystem determined by its conditions, including hydrology, climate, vegetation conditions, etc. The resilient limit represents the size of the ecosystem’s ability to recover itself after the maximum disturbance range, so the annual precipitation, annual average temperature, sunshine hours, surface water resources, groundwater resources, per capita garden green area, and land productivity are used to evaluate ecological resilience.
Ecological support capacity reflects the “upward support” effect of the natural environment and social development when the ecosystem provides material resources for human activities and other ecological service functions. From the three dimensions of environmental protection, social progress, and policy support, this article selects the comprehensive utilization rate of solid waste, the number of doctors per 10,000 people, and the expenditure of urban maintenance and construction funds to evaluate the ecological support power, which characterizes the ability of ecosystems to resist external resistance when they are in a homeostatic state [56].
The term “ecological pressure” refers to the potential for social and economic activities to have an impact on the natural environment. It is mainly divided into population pressure and environmental damage caused by human economic activities. It includes indicators, such as industrial sulfur dioxide emissions, population density, and natural population growth rate.
It should be noted that land productivity is the ratio of the gross output value of the primary industry to the area of arable land, and the ratio of arable land area to total resident population at the end of the year is known as per capita land area.

2.3. Data Sources

Based on data availability, this study excludes Turpan and Hami in the Xinjiang Uygur Autonomous Region, Bijie and Tongren in Guizhou Province, and Changdu and Xigaze in the Tibet Autonomous Region. Data selected are from 2010 to 2019 and are obtained from the China City Statistical Yearbook, the China City Construction Statistical Yearbook, provincial and municipal statistical yearbooks, water resources bulletins, and national economic and social development statistical bulletins. An interpolation method is used to fill in missing data to ensure that the data are consistent and complete. Others are raw data. To eliminate outliers, all data are filtered. The final sample of the study area covers 286 prefecture-level cities across the country.

3. Spatial Correlation Analysis of UECC

3.1. Global Autocorrelation

The overall trend of the spatial correlation of adjacent spaces can be tested using global spatial autocorrelation in the entire research area, which employs the global Moran’s I index. From 2010 to 2019, the global Moran’s I index was 0.0940, 0.0802, 0.1120, 0.0954, 0.1179, 0.1350, 0.1390, 0.0980, 0.0498, and 0.0979. At a 95% confidence level, all of these values passed the significance test, indicating a significant positive spatial autocorrelation of UECC. It reveals that there is a strong spatial dependence of UECC in China; that is, UECC is positively correlated with that of its neighbors and surrounding cities, showing a spatial cluster phenomenon. Obvious spatial differences are shown in the evaluation of UECC among cities, which provides a model basis for the following research, conducted by using MGWR, on the factors affecting UECC from the spatial dimension.
As seen from the evolution process diagram of Moran’s I Index of UECC in Figure 1, Moran’s I Index fluctuated significantly from 2010 to 2019. Moran’ s I index from 2010 to 2016 showed an upwards trend of fluctuation and reached its maximum value is 2016, indicating that the spatial convergence and agglomeration trend of UECC got its most potent this year. Due to the five development concepts, local governments actively respond to national policies about the ecological environment, continuously enhancing the spatial correlation. For the reason of owing to significant disparities in natural endowments and economic development between regions, the spatial agglomeration trend of UECC in various provinces and cities moderate under the effect of polarization, and Moran’s I index showed a considerable decline from 2016 to 2018. From 2018 to 2019, the accumulation of UECC began to recover gradually, mainly due to the active implementation of the “two mountains” theory and active measures taken by local governments to strengthen ecological protection. The environmental conditions gradually improved, the trickle-down effect slowly emerged, and the level of UECC in all regions improved.

3.2. Local Autocorrelation

The spatial correlation of UECC of 286 cities in China can be determined using global autocorrelation. However, it is unable to distinguish between different cities’ spatial autocorrelation. To better reflect the clustering of UECC, a Getis-Ord G i * index analysis will be divided into four categories, namely, hot spots, sub-hot spots, sub-cold spots, and cold spots, to generate the hotspot evolution diagram of the spatial pattern of UECC, the result of which is displayed in Figure 2.
As Figure 2a showing, in 2010, the spatial distribution of different spots showed a gradient pattern from a coastal to inland direction as “hot spots, sub-hot spots, sub-cold spots.” The hotspots were primarily found in Guangzhou, Huizhou, Dongguan, Zhongshan, and Shenzhen in the Pearl River Delta and in Nantong, Suzhou, Jiaxing, and Shanghai in the Yangtze River Delta. The sub-hot spots were mostly found in Fujian Province, the Yangtze River Delta urban agglomeration, and the Beijing-Tianjin-Hebei region. The sub-cold spots were scattered and mainly distributed around cold spots, including Guangxi and other South China cities, Hunan and other cities in the south of central China, Jilin and other Northeast China cities, and Hohhot and other North China cities. The cold spots are distributed from northwest to northeast, mainly Northwest Gansu Province, Northeast Heilongjiang Province, and North Central China.
As Figure 2b showing, in 2013, the spatial distribution of cold and hot spots was generally scattered. Compared with 2010, hot spots expanded from Nantong and Shanghai to towns in the Yangtze River Delta such as Yangzhou, Zhenjiang, Changzhou, Ma’ Anshan, and Xuancheng. Sub-hot spots expanded from Zhaoqing, Jiangmen, and other cities in the Pearl River Delta to surrounding cities. Daqing, Qiqihar, Hulunbuir, Heihe, and Yichun changed from cold points to sub-cold points after 2010. The cold and hot spots remained roughly the same, while the sub-cold and sub-hot spots expanded.
As Figure 2c showing, in 2019, compared with 2010, the spatial distribution pattern of cold and hot spots did not change, and the number of sub-hot areas decreased, while they were still concentrated in eastern coastal cities. The northeastern region, such as Hegang and Jiamusi, and the northwestern region, such as Jiuquan, changed from cold to sub-cold points. Northeast coastal cities such as Dalian and Dandong and southwest cities such as Lincang and Pu’ er changed from sub-cold to cold points.
The results showed that the range of high-value areas changed little from 2010 to 2019. Among them, the Yangtze River Delta and the Pearl River Delta are located in coastal areas. They not only own good climate conditions and complete infrastructure, but also are more advanced in economic development and have a solid ability to support research and development in science and technology. These aspects support the region’s sustainable development ability and make a more understanding contribute to ecological environment protection, thus creating a high standard of UECC value clusters. The primary causes of cold spots forming in Northwest China are sparse precipitation, low vegetation coverage, scattered distribution of ecological source area, and low overall level of environmental security. Although the cold spots in northeast China are rich in land and forest resources, the development of the industrial economy has been at the expense of the environment for a long time, and it owes a historical debt in the ecological environment; thus, this area has become a low UECC cluster.

4. Analysis of Influencing Factors

4.1. Determination of Influencing Factors

The structure and function of a city’s ecosystem are not permanently fixed in a period. Its ability to prevent ecological problems and ensure regional ecological security is its UECC. Most research on the comprehensive level of UECC starts from the perspective of support and restriction. This paper selects eight variables to build the evaluation system (Table 2), namely, land endowment, water supply, industrial structure, economic development, urbanization level, technological innovation, foreign capital utilization, and environmental governance. It discusses the factors affecting UECC of China’s 286 prefecture-level cities.
The variables for the factors affecting the level of UECC mainly selected based on the following considerations:
  • Land endowment. Land resources are one of the living conditions of humankind and a fundamental element of urban development. In addition to maintaining the sustainable development of social, economy, and humankind, the land also produces biological resources for survival and maintains the normal operation of its functions [57]. However, land resources are not renewable. A massive contradiction between humans and land has produced a series of problems affecting ecological security; thus, the impact of land endowment on UECC cannot be ignored. This paper selects the administrative land area to measure land endowment;
  • Water supply. Water is essential to natural resources necessary for human production, life, and the ecological environment and it is a fundamental resource and a strategic economic resource that supports the economy and society to be sustainable. Good hydrological conditions will create an environment conducive to vegetation growth [58], then increasing UECC. However, the lack of local water resources has gradually turned to be a major factor restricting the region’s sustainable development. As a consequence, the total amount of water resources per capita is selected to represent the level of water supply;
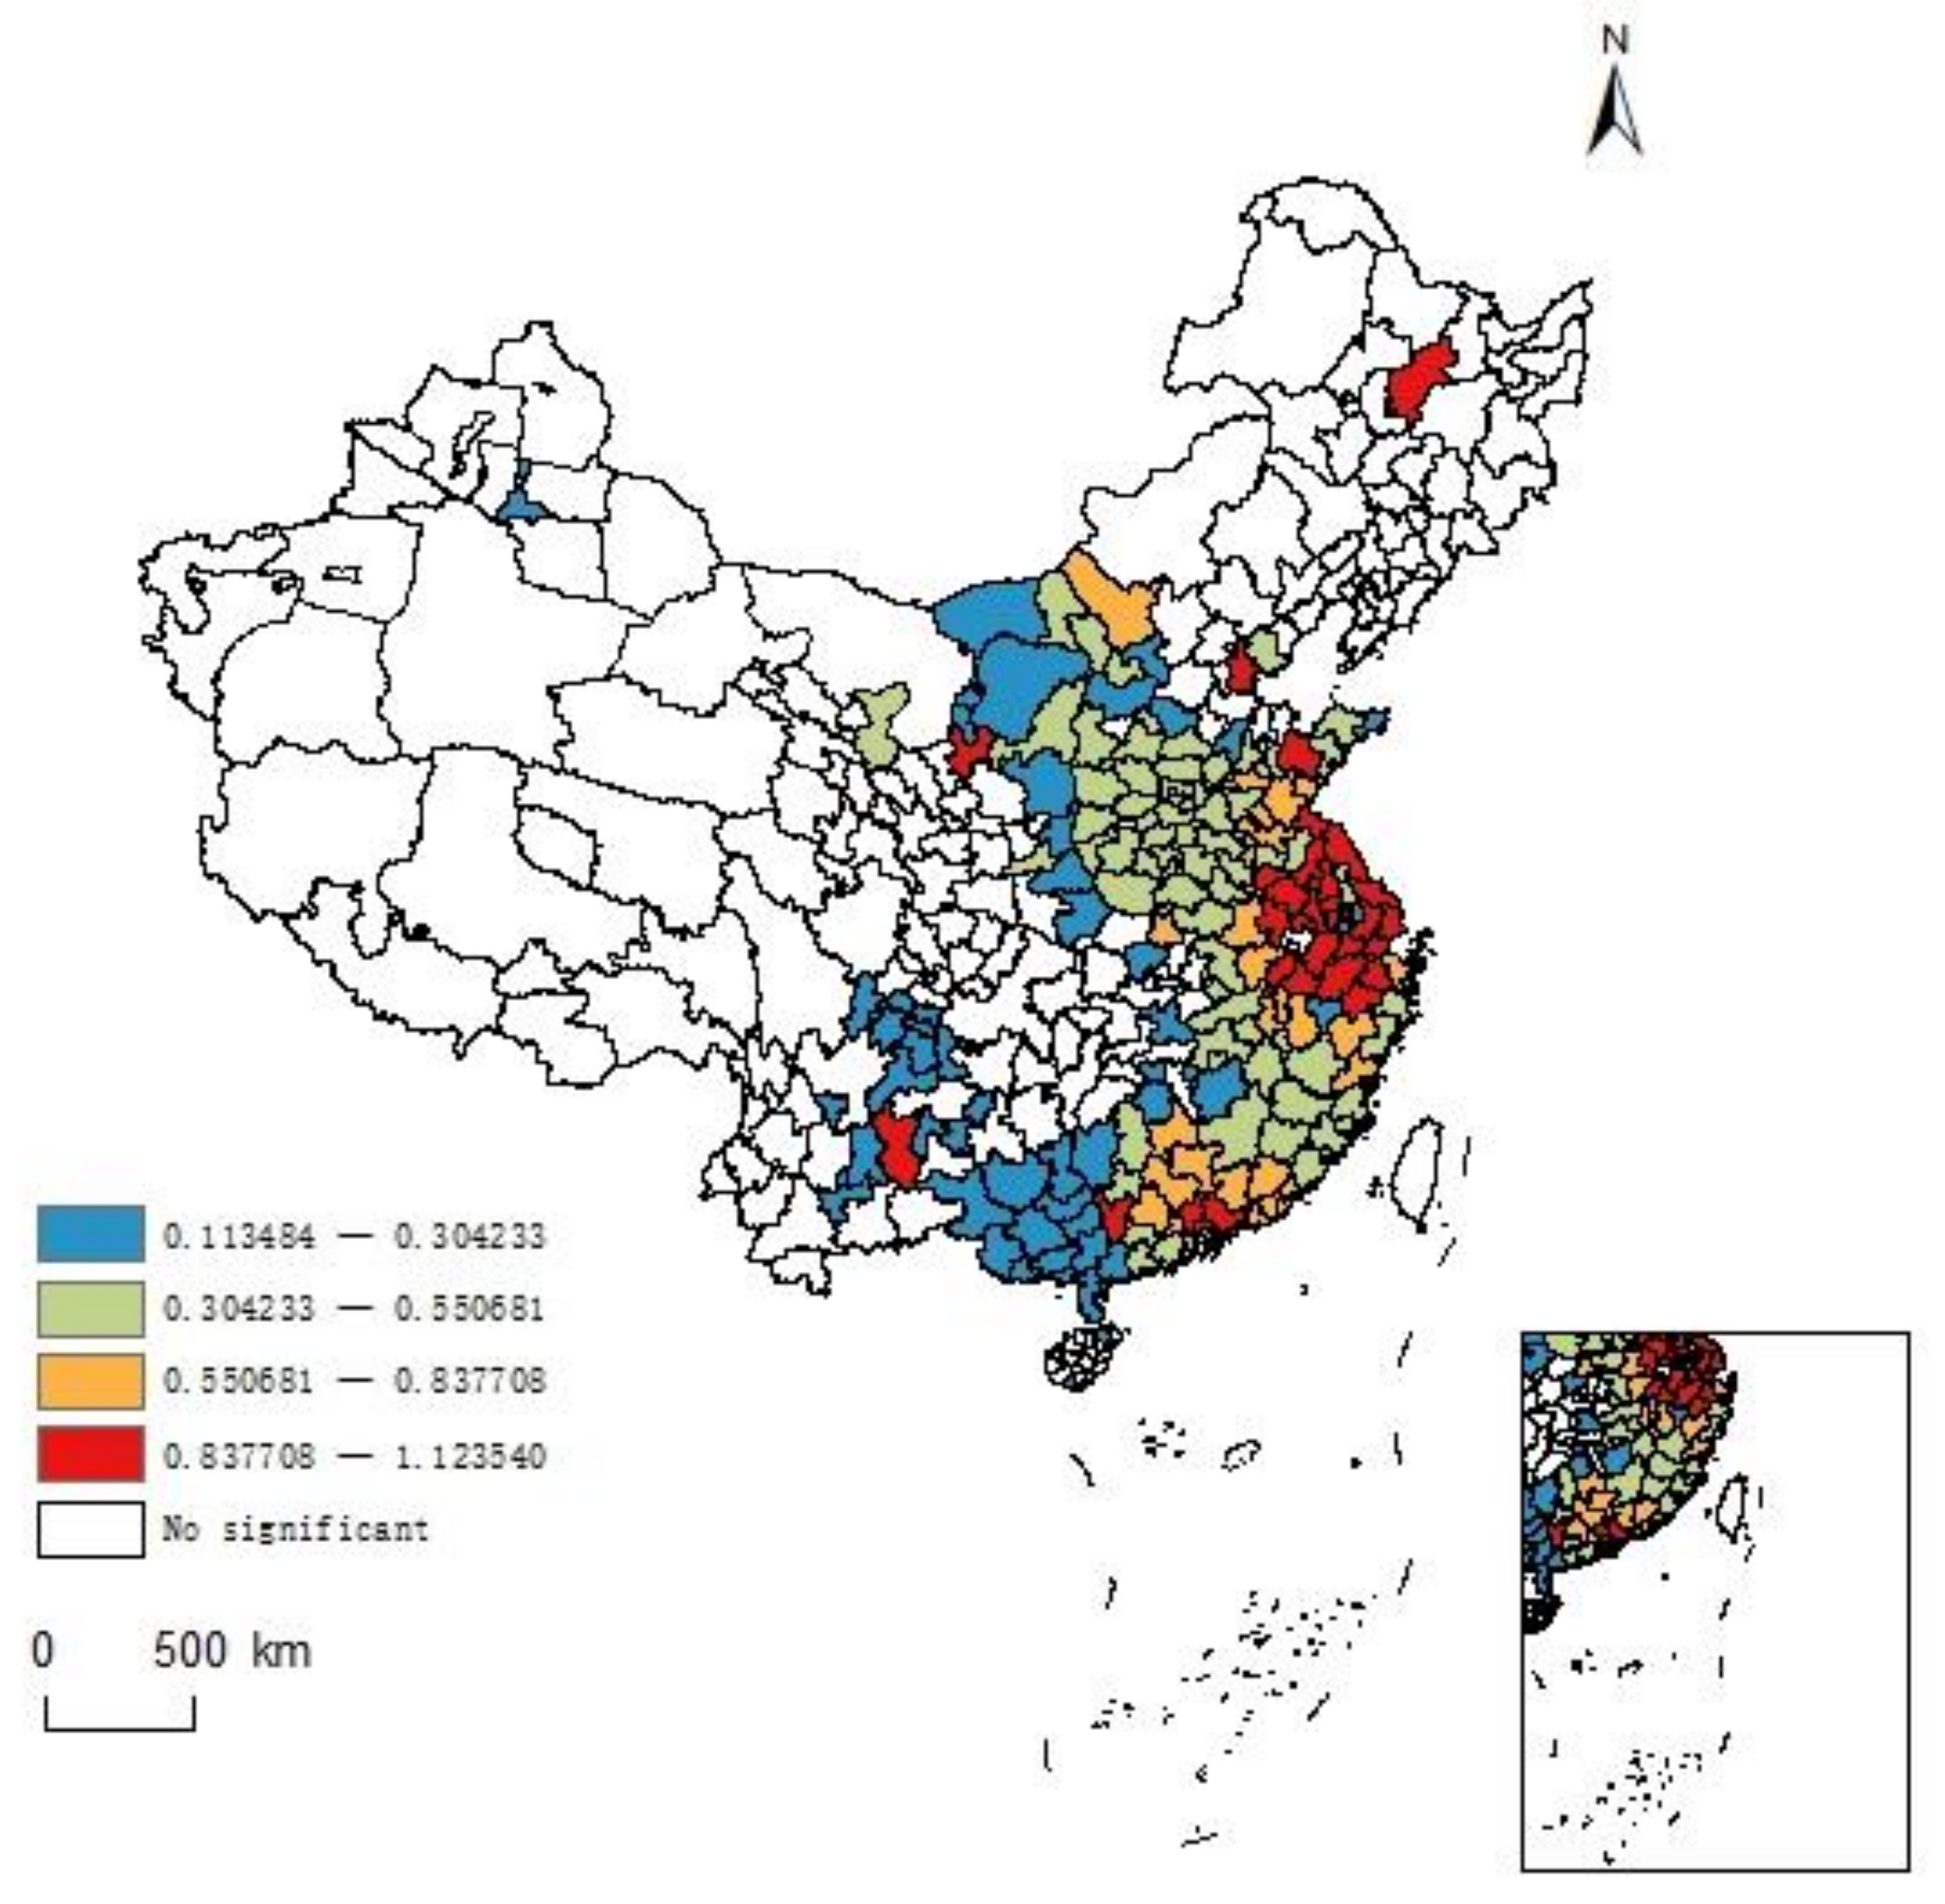
  • Industrial structure. The material inputs required for production in different industries are different [59], and the intensity of the resource consumption of an economy is influenced by industrial composition. The level of industrial advancement determines the size of the environmental cost and the scale of pollution emissions to be paid for economic growth; only the realization of the transformation and the upgrade of the industrial structure to an advanced structure can effectively curb the adverse effects of economic growth and achieve the harmonious result between the economy and environment. For this reason, the industrial advancement index, which is, the ratio of the tertiary industry and the secondary sector, can measure the industrial structure;
  • Economic development. When it comes to the advancement of the economy and society, human beings are transforming and using natural resources at an unprecedented speed and scale. While gaining much wealth, they also exert tremendous pressure on the ecosystem. As pressure increases, UECC will correspondingly weaken. When the pressure reaches the maximum, the carrying capacity will decrease by 30% [17]. Economic density can reflect the efficiency of economic activities and the intensity of land use to a certain extent. The higher the economic density in a region is, the more conducive the area is to development. The study of economic density is essential to encourage the establishment of a high-quality regional economy. Consequently, economic density is chosen to measure economic development;
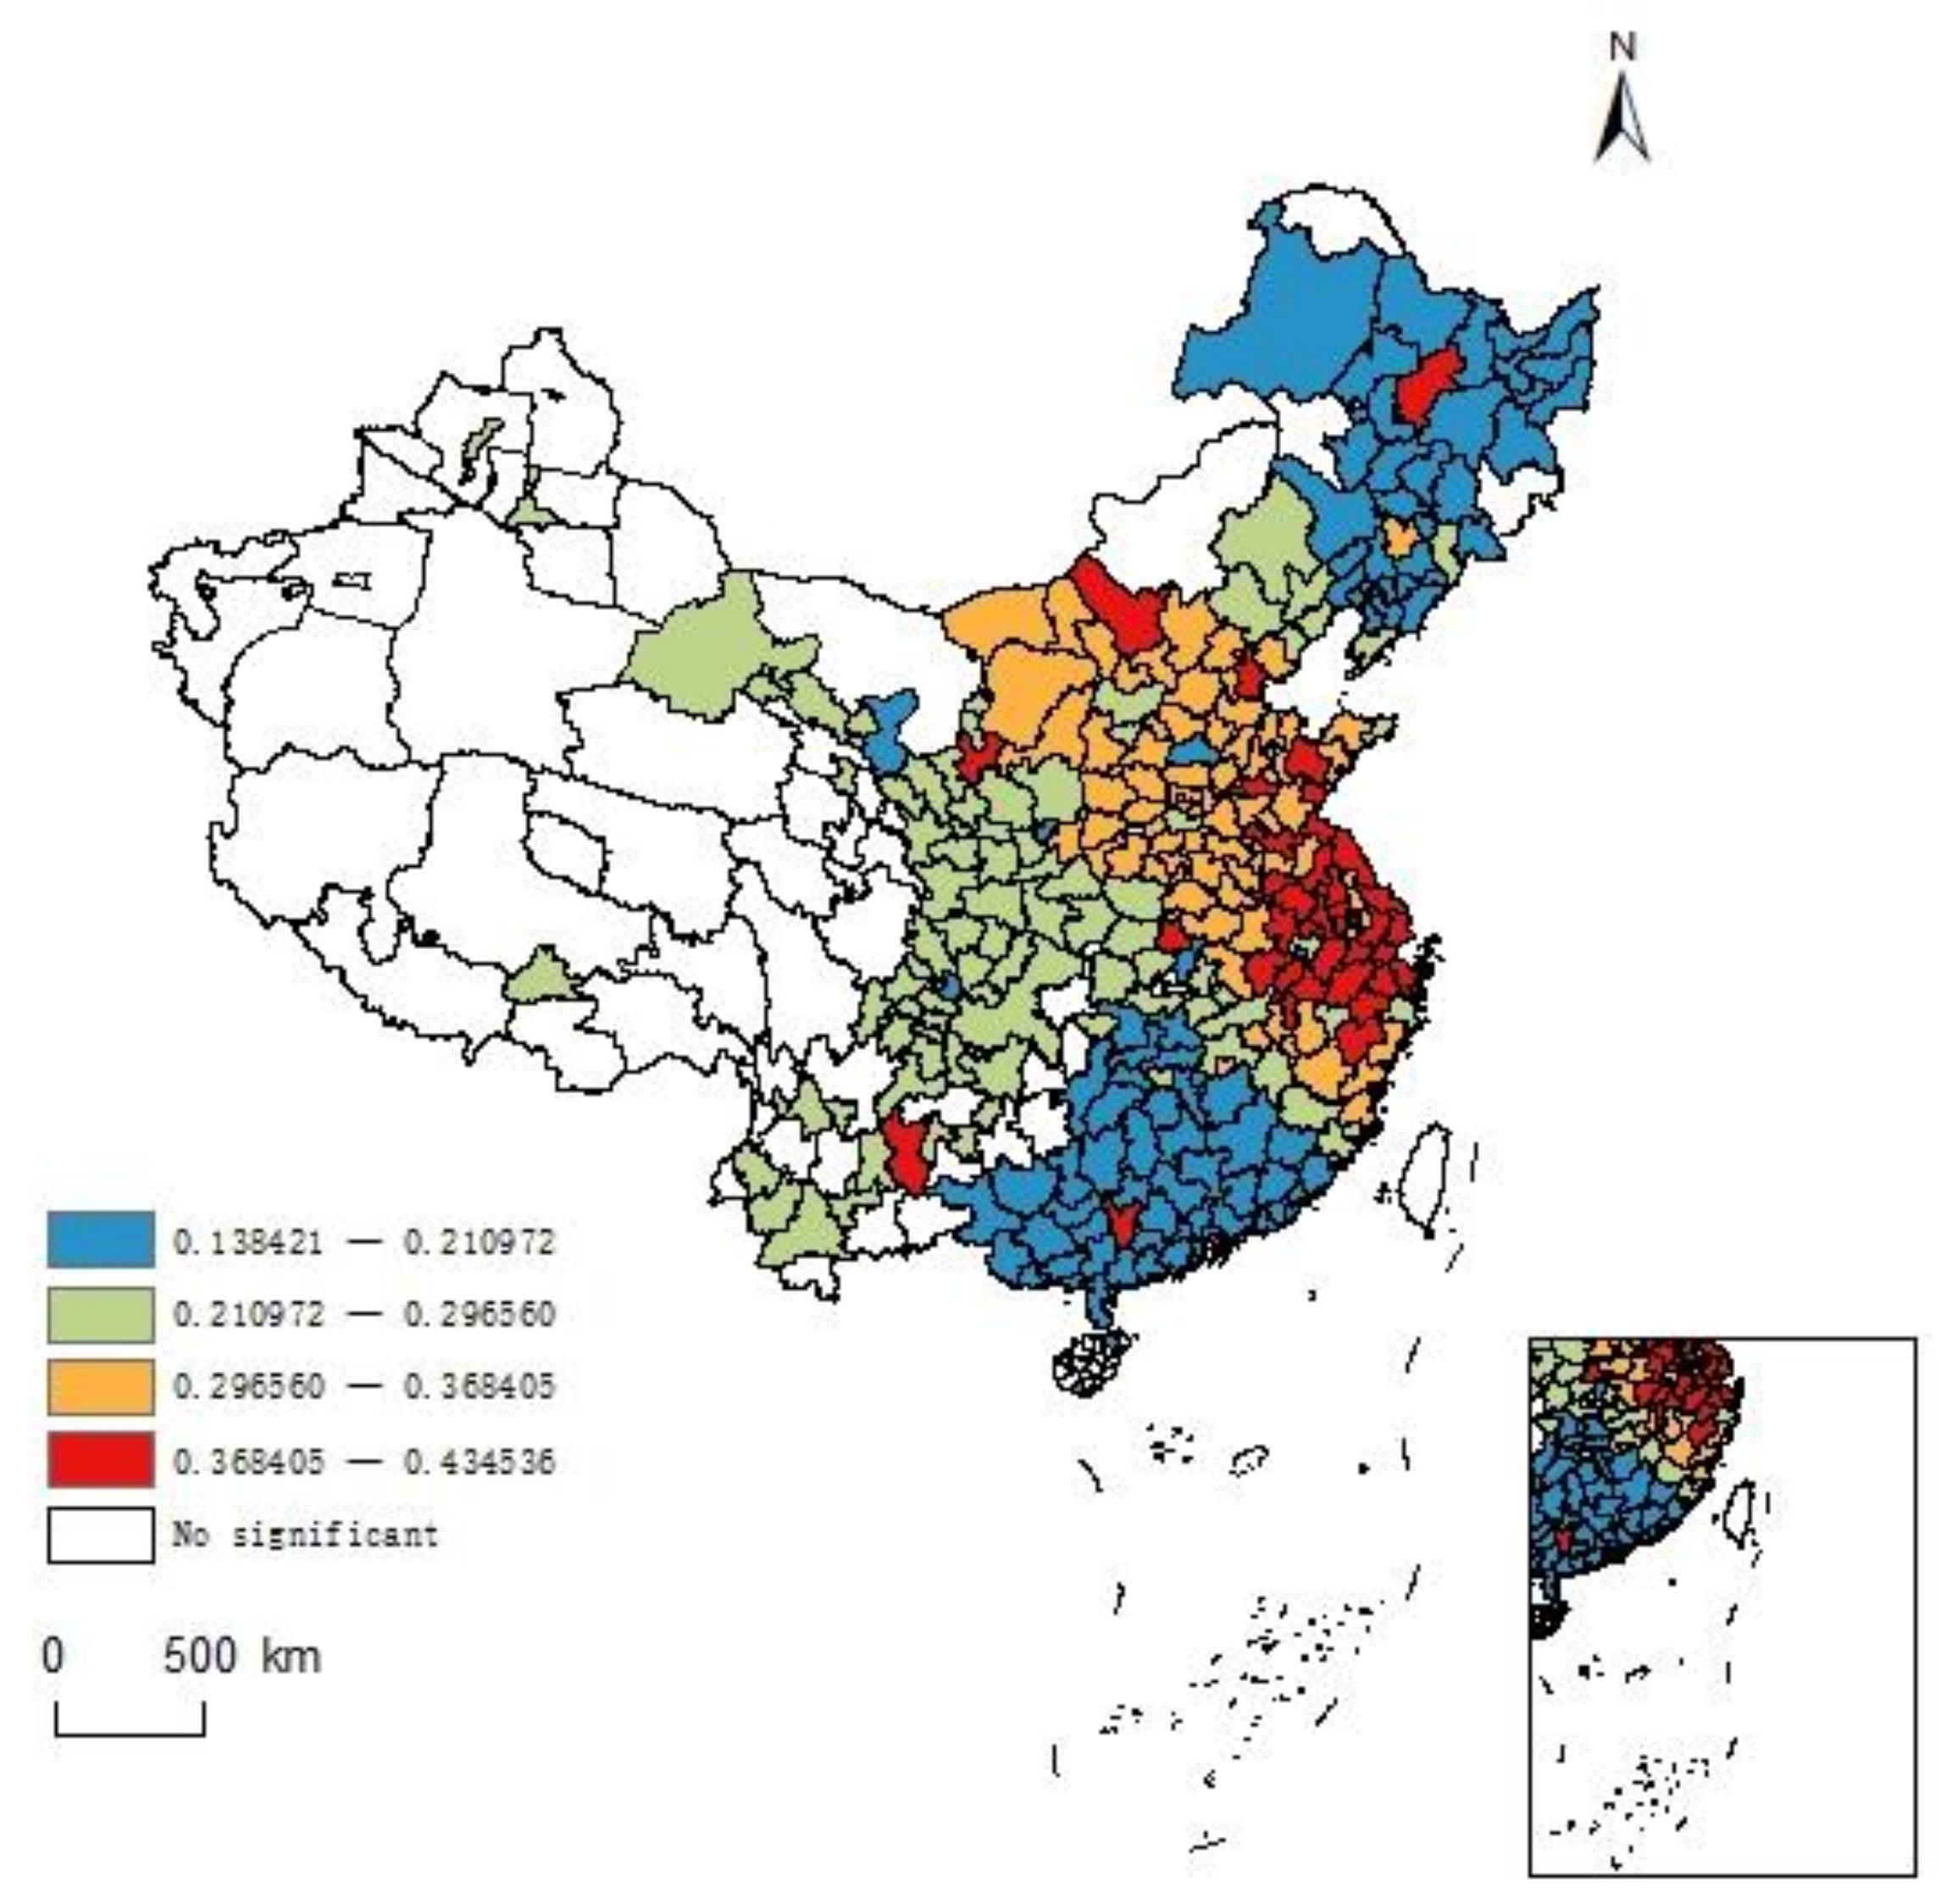
  • Urbanization level. The level of urbanization and the ecological security system is inextricably linked. With rapid urbanization and rapid economic growth, there will be a shortage of resources and insufficient ability to withstand the pressure of ecosystems, which will therefore cause a series of ecological problems [60]. New-type urbanization emphasizes the quality connotation of urbanization, and resources and the environment are also increasingly valued. The urbanization rate can reflect the process and degree of population agglomeration in cities and can also reflect the comprehensive process of the transformation of a rural society into a modern city. Accordingly, this article uses the urbanization rate to measure the level of urbanization;
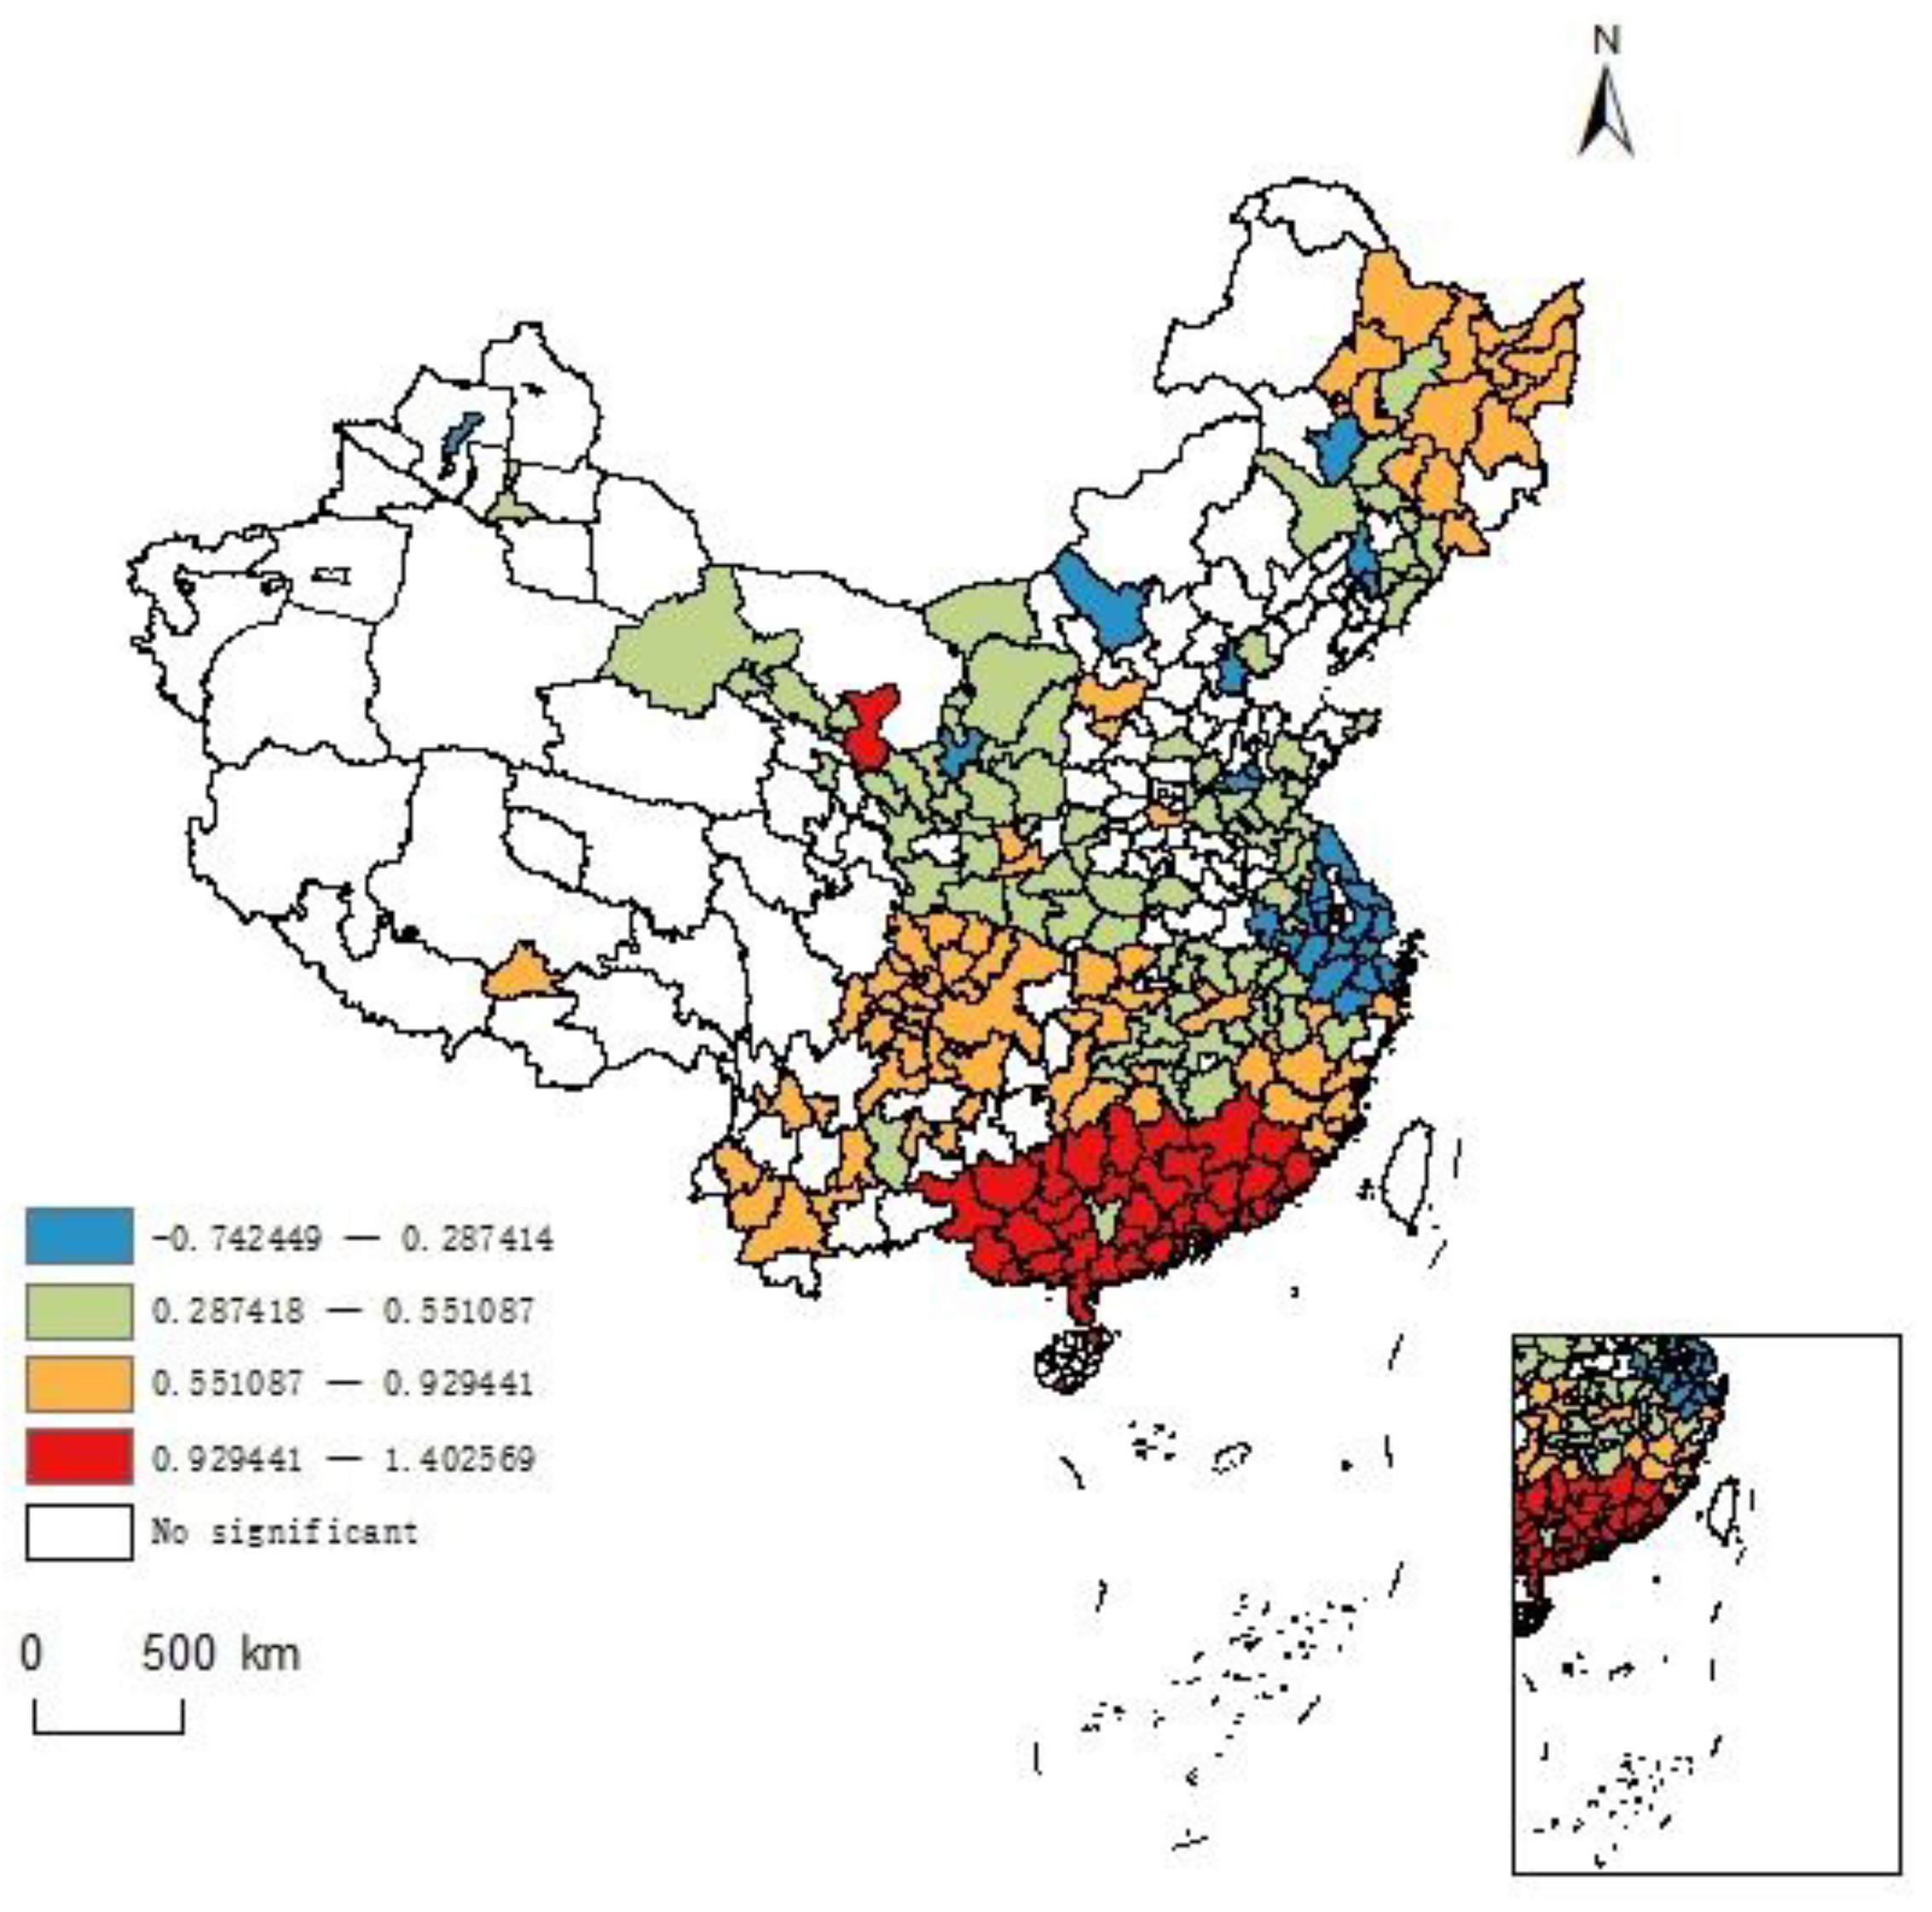
  • Technological innovation. Technological innovation is not only the fundamental driving force for industrial upgrading and structural optimization but also can solve the problem of excessive consumption of resources and improve the efficiency of resource use. Green technology can improve the green performance of the external environment of the enterprise and promote the high-quality and sustainable development of the region [61], finally enabling the realization of the linkage of economic, social, and natural ecological system entities. The internal expenditure of research and experimental development (R&D) funds is the actual expenditure of enterprises and institutions for internal R&D activities. It includes both fundamental research spending and applied research and practical development expenditures. Overall, the internal expenditures of R&D funds are used to assess the innovation level;
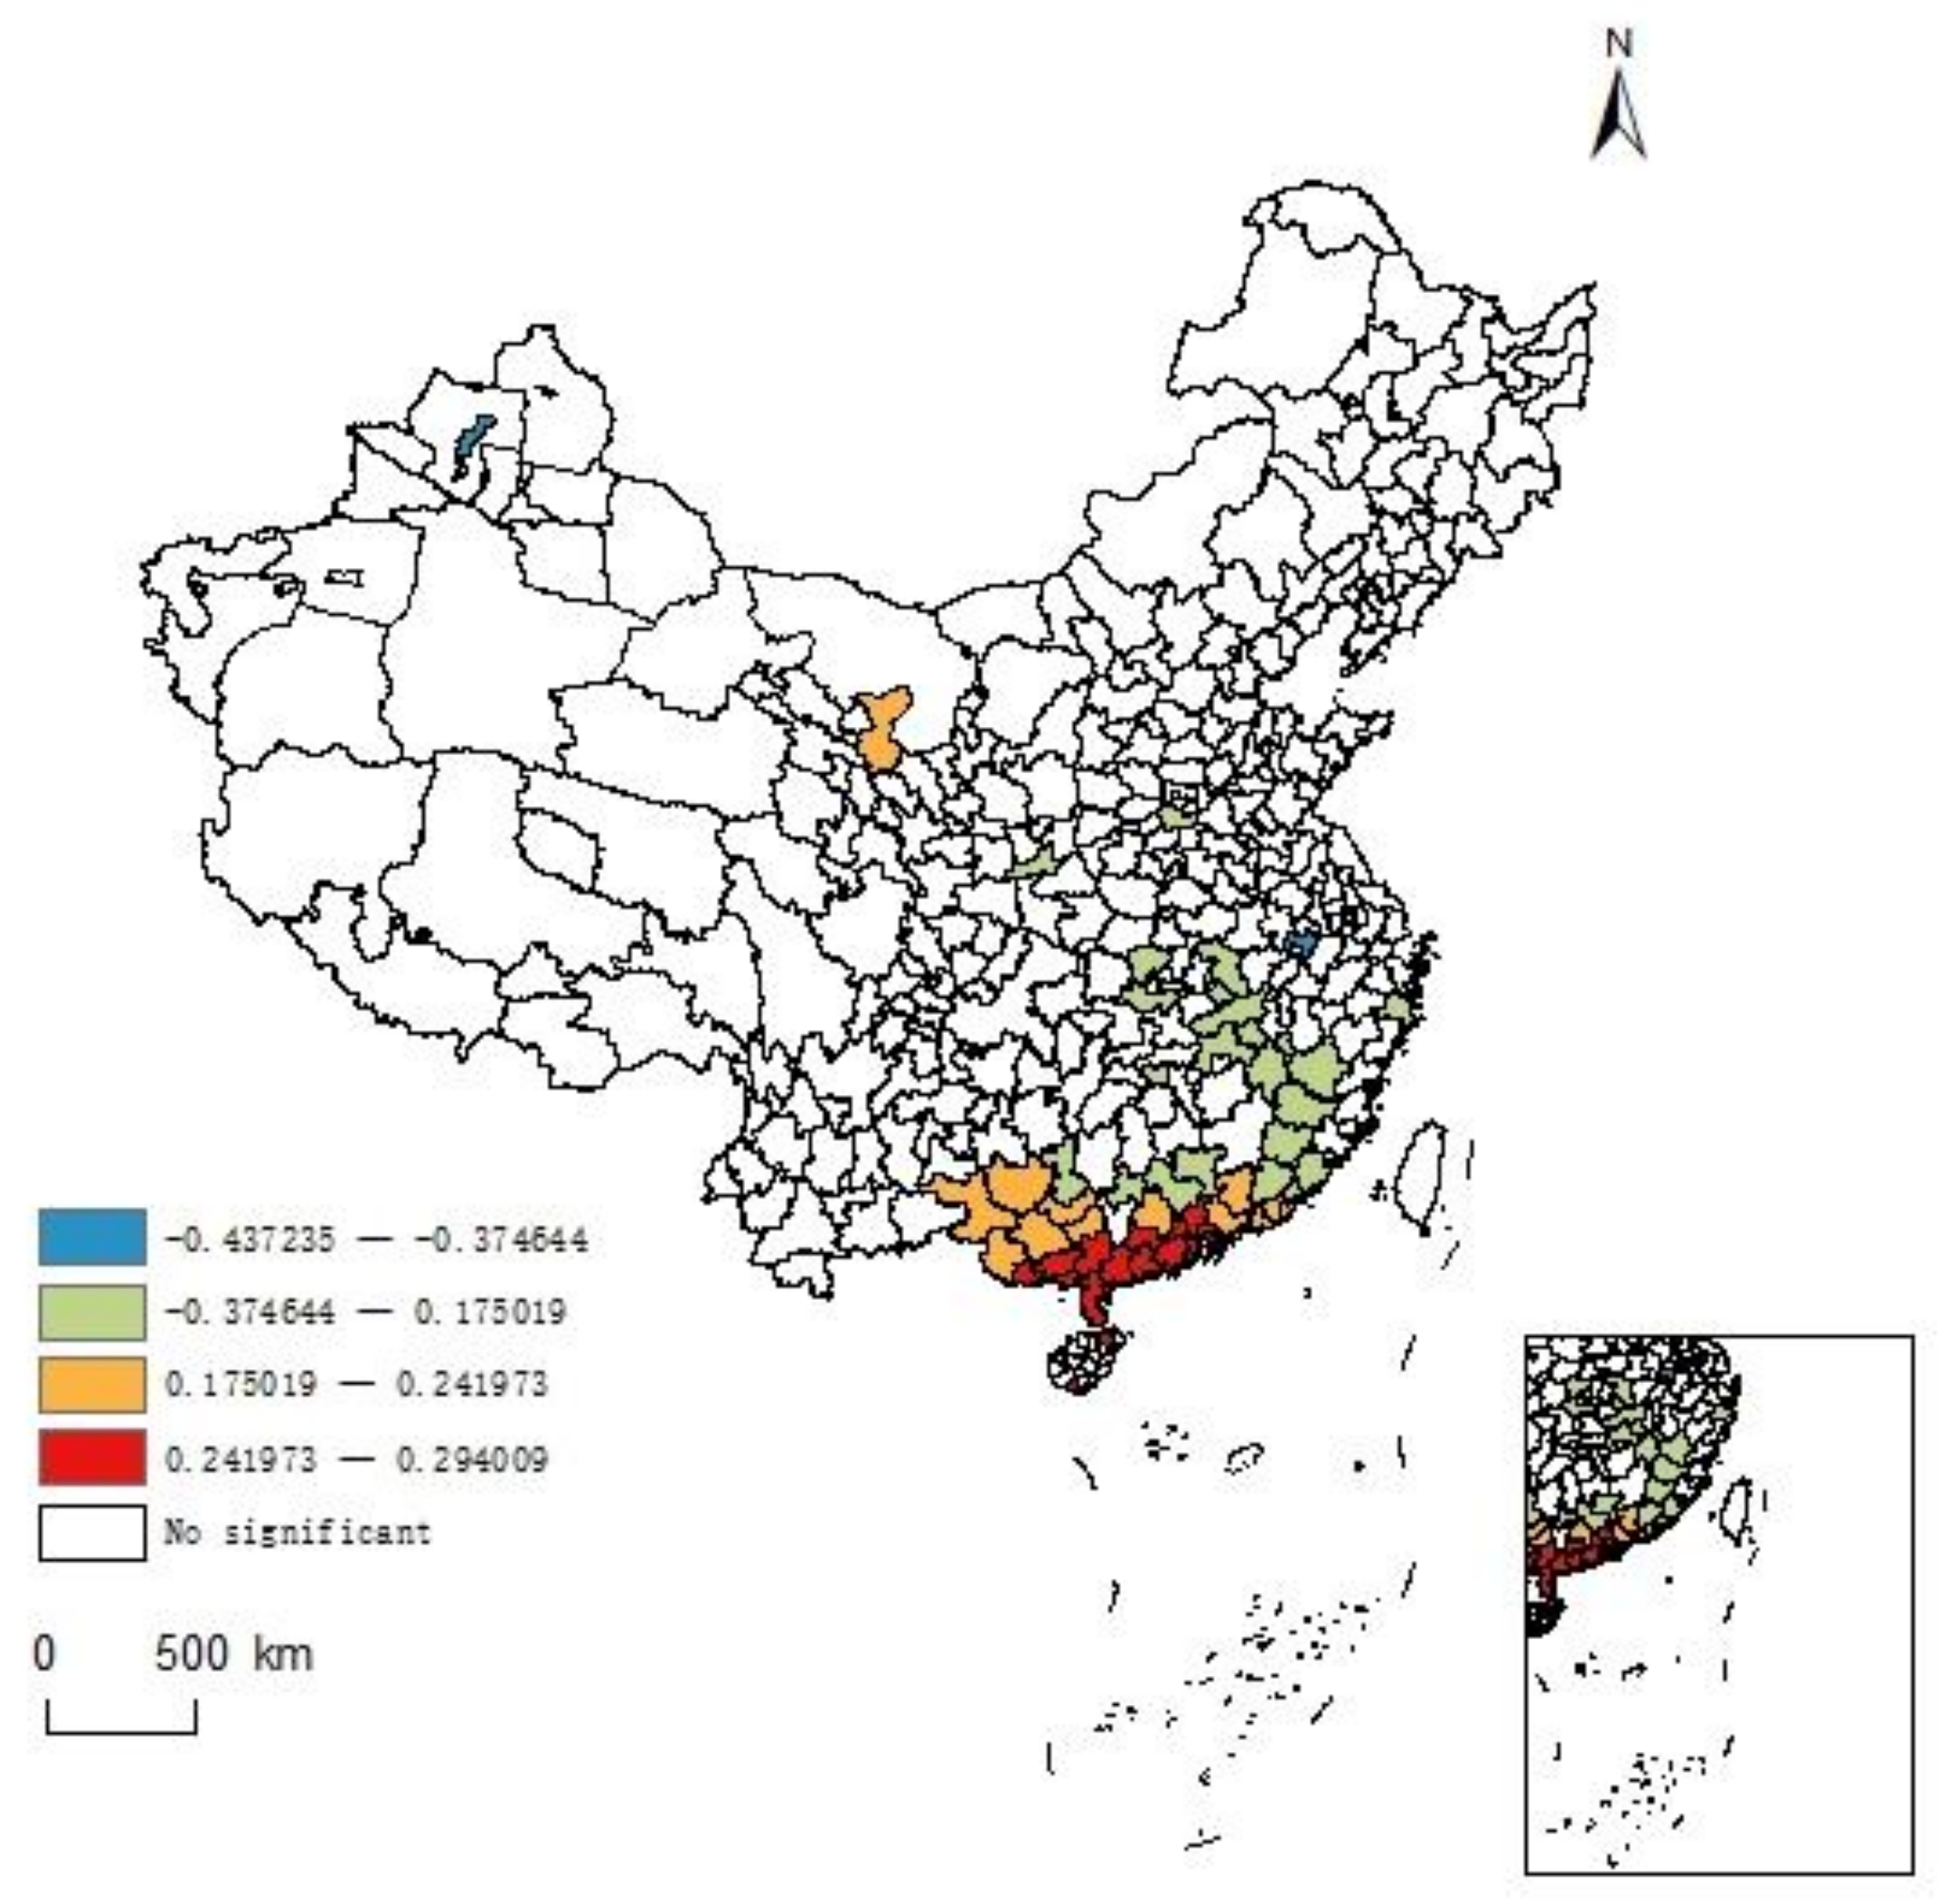
  • Foreign capital utilization. Foreign capital provides power and support for regional development from outside. Although it makes a particular contribution to economic growth, it may also cause environmental pollution [62]. The actual utilization of foreign investment/gross domestic product can be used to measure the degree of dependence of a country or region’s economy on the international market. It can also reflect a certain extent a country’s economic development level and participation in the global financial division of labor. Compared with directly measuring the level of foreign capital utilization by the amount of foreign investment utilized, measuring this utilization by the actual use of foreign investment/gross domestic product can observe the impact of foreign investment on regional economic development more comprehensively. This article chooses to use the actual use of foreign investment/gross domestic product to measure the level of foreign investment utilization;
  • Environmental governance. Improving a government’s environmental governance capacity can alleviate the trend of ecological environment damage [63] and increase UECC to some extent. The expenditure structure of energy conservation and environmental protection roughly includes ecological protection, energy conservation, utilization, and natural ecological protection. These categories can reflect the amount of government energy conservation and environmental protection expenditures, work priorities, and work implementation status, which is all critical for ensuring the coordinated development of environmental protection and economic society. Energy conservation and environmental protection expenditures are employed in the assessment of measure environmental governance.

4.2. Model Comparison

This paper takes UECC as the dependent variable, taking administrative land area, per capita water resources, industrial advancement index, economic density, urbanization rate, R&D internal expenditures, actual utilization of foreign investment/gross domestic product, and energy conservation and environmental protection expenditures as independent variables. The spatial heterogeneity of the influencing factors is measured using the MGWR2.2 software. Table 3 summarizes the findings. In comparison to GWR, MGWR has a better goodness of fit R2 of 0.929, but the value of AICc is significantly lower than that of the GWR model, demonstrating that it is a better metric for UECC. MGWR’s residual sum of squares is more minor, meaning that the regression result is closer to the actual value. As a result, the MGWR is chosen.

4.3. Scale Analysis

The bandwidth here represents the distance range over which factors affect UECC. Compared with the classic GWR, which uses a fixed scale, MGWR makes each variable have a unique bandwidth. According to Table 4, the bandwidth of GWR is 65, but the MGWR results show a significant difference in the bandwidth of each variable. In the regression results of MGWR, the regression coefficients of the eight variables are overall significant. Specifically, the scale of administrative land area, and energy conservation and environmental protection expenditures are 227 and 232, accounting for more than 80% of the total sample, and the spatial heterogeneity is relatively small; that is, UECC of each region is affected basically in the same way by the above factors. Per capita water resources, urbanization rate, and economic density account for approximately 30% of the total sample. The coefficients vary spatially, but they are generally stable. However, the scale of the industrial advancement index, FDI/GDP, and R&D internal expenditures is small, with a bandwidth of only 43. There is a big difference in space; exceeding this scale will cause drastic changes.
Using MGWR to perform the regression, Table 5 displays the statistical description. The regression coefficients of the influencing factors of UECC are mostly positive, and the gap is large. Based on the average coefficient’s value, the strongest driver is economic development, followed by technological innovation and industrial structure, and the utilization of foreign capital is the weakest.

4.4. Spatial Distribution of Driving Factors

4.4.1. Administrative Land Area

The MGWR 2.2 software is used to choose the cities that pass the significant test at a 95% confident level, employ ArcGIS 10.2 to demonstrate the distribution of variables, results are shown in Figure 3, Figure 4, Figure 5, Figure 6, Figure 7, Figure 8, Figure 9 and Figure 10. According to Figure 3, the regression coefficient of land endowment ranges from 0.055 to 0.331, with a mean of 0.197. It demonstrates a positive impact of land endowment on the improvement of UECC and shows a gradual decrease in space from south to north. Land use reflects the urban spatial evolution and resource allocation patterns, and the orderly development of land has a close relationship with the sustainable development of cities [57]. Governments at all levels implement scientific land reclamation and return farmland to forests and grasses, turning the agricultural economy from extensional expansion to intentional development and promoting the restoration and enhancement of ecosystem functions. Through the evolution of the administrative land area, UECC will be improved to a certain extent. The most influential southern coastal cities are densely populated and have excellent land conditions. Construction land in urban and rural areas has expanded rapidly, and urban agglomerations have a high land utilization rate. The expansion of administrative land areas will help gather technology, talent, and resources. With the joint support of a technology foundation, talent, and development, UECC can be improved rapidly. In the Northeast region, which has had the most negligible impact, on the one hand, rapid growth requires many resources, but unreasonable use of resources will lead to ecological imbalance and hinder the virtuous cycle of ecosystems; on the other hand, areas with low levels of economic development have some limits on land development, and ecological function will be more prominent; leading to small positive impact on the ecology.

4.4.2. Total Water Resources per Capita

The regression coefficient of the water resource supply ranges from 0.106 to 0.405, with a mean of 0.126, and the water supply is beneficial for the improvement of UECC. As seen from Figure 4, the degree of influence is weakened gradually from east to west and from the coast to inward. The main reason may be that an increase in the total amount of water resources can improve the land erosion caused by reducing water volume and the drying up of rivers and alleviate the degradation of surface vegetation. Specifically, the most influential areas are mainly distributed along the gold coast of northern China, which is the Bohai Rim area. In this area, the total water resources per capita was below the internationally recognized severe water shortage line. Data show that in 2020, water consumption in northern China was 46.13%, of which agricultural water accounted for 71.9%, industrial water accounted for 8.51%, domestic water accounted for 10.94%, and ecological water accounted for 8.64%. There is a significant gap in the water structure of different industries. Although there are many high-tech enterprises, the demand for water resources is still growing. Increasing the number of water resources can reconcile the conflict between limited water resources and demand for water, promote the rational allocation of water resources, and develop and enhance UECC. The areas that have been least affected are mostly in the west. Although the southwest region has good water resource conditions, because of the high reliance on water resources for social and economic development, relevant water conservancy projects have not been able to match the demand. It has been challenging to deploy regional water resources effectively. Increasing the number of water resources will have a small contribution to UECC. The northwestern region is relatively arid. It is a typical low-value area of UECC in China. The ecosystem is generally degraded; however, the site covers a wide range and has noticeable regional differences. Increasing the number of water resources on the improvement of UECC may not be pronounced.

4.4.3. Industrial Advancement Index

The regression coefficient of the industrial structure ranges from 0.113 to 1.123, with a mean of 0.348. The industrial system has a strong positive impact on UECC, and this impact gradually increases from west to east (Figure 5). It may be because the ecological industry is based on the inherent requirements of high-quality economic development and aims to change the industrial structure and adjust the disordered state of the ecosystem. The resulting large-scale accumulation and growth of strategic emerging industries will improve urban ecological efficiency [64]. Among the cities, Guangxi Province, which is less influential, is connected to the Pearl River Delta in East and Southeast Asia to the south, which gives the city a suitable location advantage. The data show that in 2019, 33.3% of GDP was accounted for by the secondary industry, in Guangxi Province and that the tertiary sector accounted for 50.7%. The pillar industries in the region include the aluminum-based nonferrous metal industry, construction machinery-based machinery industry, and the food industry, which is dominated by sugar, and are primarily secondary sector. It is difficult to increase the proportion of the tertiary sector and make a considerable contribution to UECC in the short term. Economic development and innovation are both active in the Yangtze River Delta region. In the overall economic transformation, upgrading the industrial structure has taken a leading and exemplary role. Shanghai has an excellent industrial foundation, which is ideal for the introduction of capital and cutting-edge technology, the vigorous development of high-tech industries and high-end industries, and increasing industrial efficiency. For this reason, actively promoting the development of industry in a coordinated manner and ecology will show higher results.

4.4.4. Economic Density

The regression coefficient of economic development ranges from 0.091 to 1.124, with an average value of 0.633. Economic development has a positive effect on UECC, showing a gradual increase from south to north in space (Figure 6). There are two main ways for economic development to affect UECC: technological effects and technological progress; can make better use of resources and reduce pollutant discharge; the industrial structure shifts from heavy industry to technology-intensive industry or the service industry. At that time, environmental quality will improve to a certain extent [65]. In North China, where the positive impact is significant, the Beijing-Tianjin-Hebei integration strategy was put forward in 2014 to strengthen the economic synergy among the three places. The Beijing-Tianjin region’s industry transferred to Hebei, which promoted economic growth and improved technologies for energy conservation and emission reduction. It is the primary driver of resource and environmental development in the Beijing-Tianjin-Hebei region; other areas in North China have a unique ecological environment and resource characteristics, shouldering the critical responsibility of being the capital’s environment barrier and focusing on the development of particular industries. As the tertiary sector contributes significantly to economic growth, increasing economic density will help establish an excellent ecological environment. Fujian Province, which demonstrates the most negligible impact, is not only the starting point of the Maritime Silk Road but also a central environment province on China’s southeast coast. It is undertaking important tasks for comprehensive reforms, such as establishing the free trade pilot zone and the environment civilization pilot zone. As the province with the highest forest coverage in China, under the accumulation of original economic and environmental conditions, Fujian has an excellent ecological advantage. Its marginal effect of economic growth on UECC is relatively low, and the impact is smaller than that in other regions.

4.4.5. Urbanization Rate

The regression coefficient of the urbanization rate ranges from 0.138 to 0.435, with a mean value of 0.27. The urbanization rate has a positive effect on UECC, showing a gradual increase and then a decrease in space from west to east (Figure 7). There are several reasons for the positive impact: first, new-type urbanization has given birth to the green economy and clean energy industries [66]; second, the economies of scale and positive externality effects formed by new-type urbanization have enabled urban areas to produce with fewer resources and higher efficiency, homogeneous products; third, new urbanization can allow an environmentally friendly infrastructure and public services to be constructed, maintained and operated in a more economical manner [67]. For the less influential northeast region, an urban agglomeration development system actively promoted after 2015. The pace and quality of urbanization have entered a rapid growth stage, and its mining scale and intensity are weaker than those in the previous period. The relationship between the northeast’s resource-based cities’ urbanization and the ecological risks of land use is relatively stable, and urbanization does not have too much impact on UECC. In Guangxi, the urbanization level of the urban belt along the border is low, the population outflow is large, urbanization is still in its infancy, and the scale of towns is small and weakly growing, which not only has a small driving effect on regional growth but also has difficulty contributing to the ecological environment. Although Guangdong is an economically developed coastal area, different economic development stages show other environmental demands. The effect of industrialization on the green development of the industry and ecological protection is still not apparent. The most influential regions are mainly located in the eastern coastal cities. This region has excellent location conditions, has an urbanization growth rate that is faster than in the western and central parts of the country, has laid the foundation for green development, and continues to provide an impetus for the improvement of UECC.

4.4.6. Internal R&D Expenditure

The regression coefficient of technological innovation ranges from −0.742 to 1.403, with a mean value of 0.528. In technological innovation, only Wuhu and Karamay harm UECC, and the rest of the regions have a positive effect, showing a spatial trend of gradually weakening and then increasing from west to east (Figure 8). The main reason could be the increase in R&D spending has accelerated the industrialization of technological achievements and resolved the contradiction between supply and demand within the regional social system. As a result, the regional environment has developed in a positive direction. Specifically, the most influential Pearl River Delta region has muscular economic strength, representing a region in which innovative entities gather. It has a complete industrial system, laying a realistic foundation for building a good ecosystem. Under the effect of spatial solid correlation, technological innovation in other cities in Guangdong and Guangxi Provinces drive to achieve new leaps, and the ecological effects became increasingly apparent. Shanghai, which has the most negligible impact, started early in development and has laid a good foundation for innovation, possibly producing a “siphon effect” that has restricted industrial ecology in surrounding cities and caused R&D investment to have a small marginal effect on the ecological environment. However, Wuhu, which has a negative impact, is located in the Pan-Yangtze River Delta. Its resource endowment, the level of economic development and technological innovation is relatively high, which is difficult to explain. Karamay, another city that has a negative impact, is relatively backward in development. An extended period is required to move from R&D investment to ecological product output, which directly affects the accumulation and diffusion of environment elements and the use of eco-technological funds, and reduces eco-efficiency.

4.4.7. FDI/GDP

The regression coefficient of foreign capital utilization ranges from −0.437 to 0.294, with an average value of 0.036. Most of the significant impact areas are coastal regions and show different effects (Figure 9). The influence channels of FDI on industrial eco-efficiency are mainly divided into three categories: industrial structure, economic development, and environmental regulation [68]. The areas that have a positive effect on UECC are located primarily in the Pearl River Delta region and its neighboring cities. The Pearl River Delta region has an excellent foreign trade foundation and abundant resources. However, its east and west wings and mountainous areas are in a passive and inferior position in foreign trade due to historical, policy, location, and other factors. Absorbing and using foreign capital is conducive to broadening the field of foreign investment and compensating for the shortage of construction funds in the east and west wings and mountainous areas. Promoting the growth of effective investment by adjusting investments and investment orientation can improve the quality and level of foreign investment, gradually reduce corporate pollution emissions, and improve corporate ecological efficiency. Karamay, which has a negative effect, is located in the underdeveloped western region and is faced with a shortage of funds, technology and, talent. The development of foreign trade has been slower, and the degree of economic externalization is lower in Karamay than in the eastern coastal cities. Karamay is a resource-based city born and prospered by oil. If the development strategy is to build an oil center, it will inevitably increase oil demand. The process of oil extraction will damage vegetation, especially wind power. Under the action of erosion, large areas of deserted land in the mining area will cause damage to the ecology and will not have a positive impact on UECC.

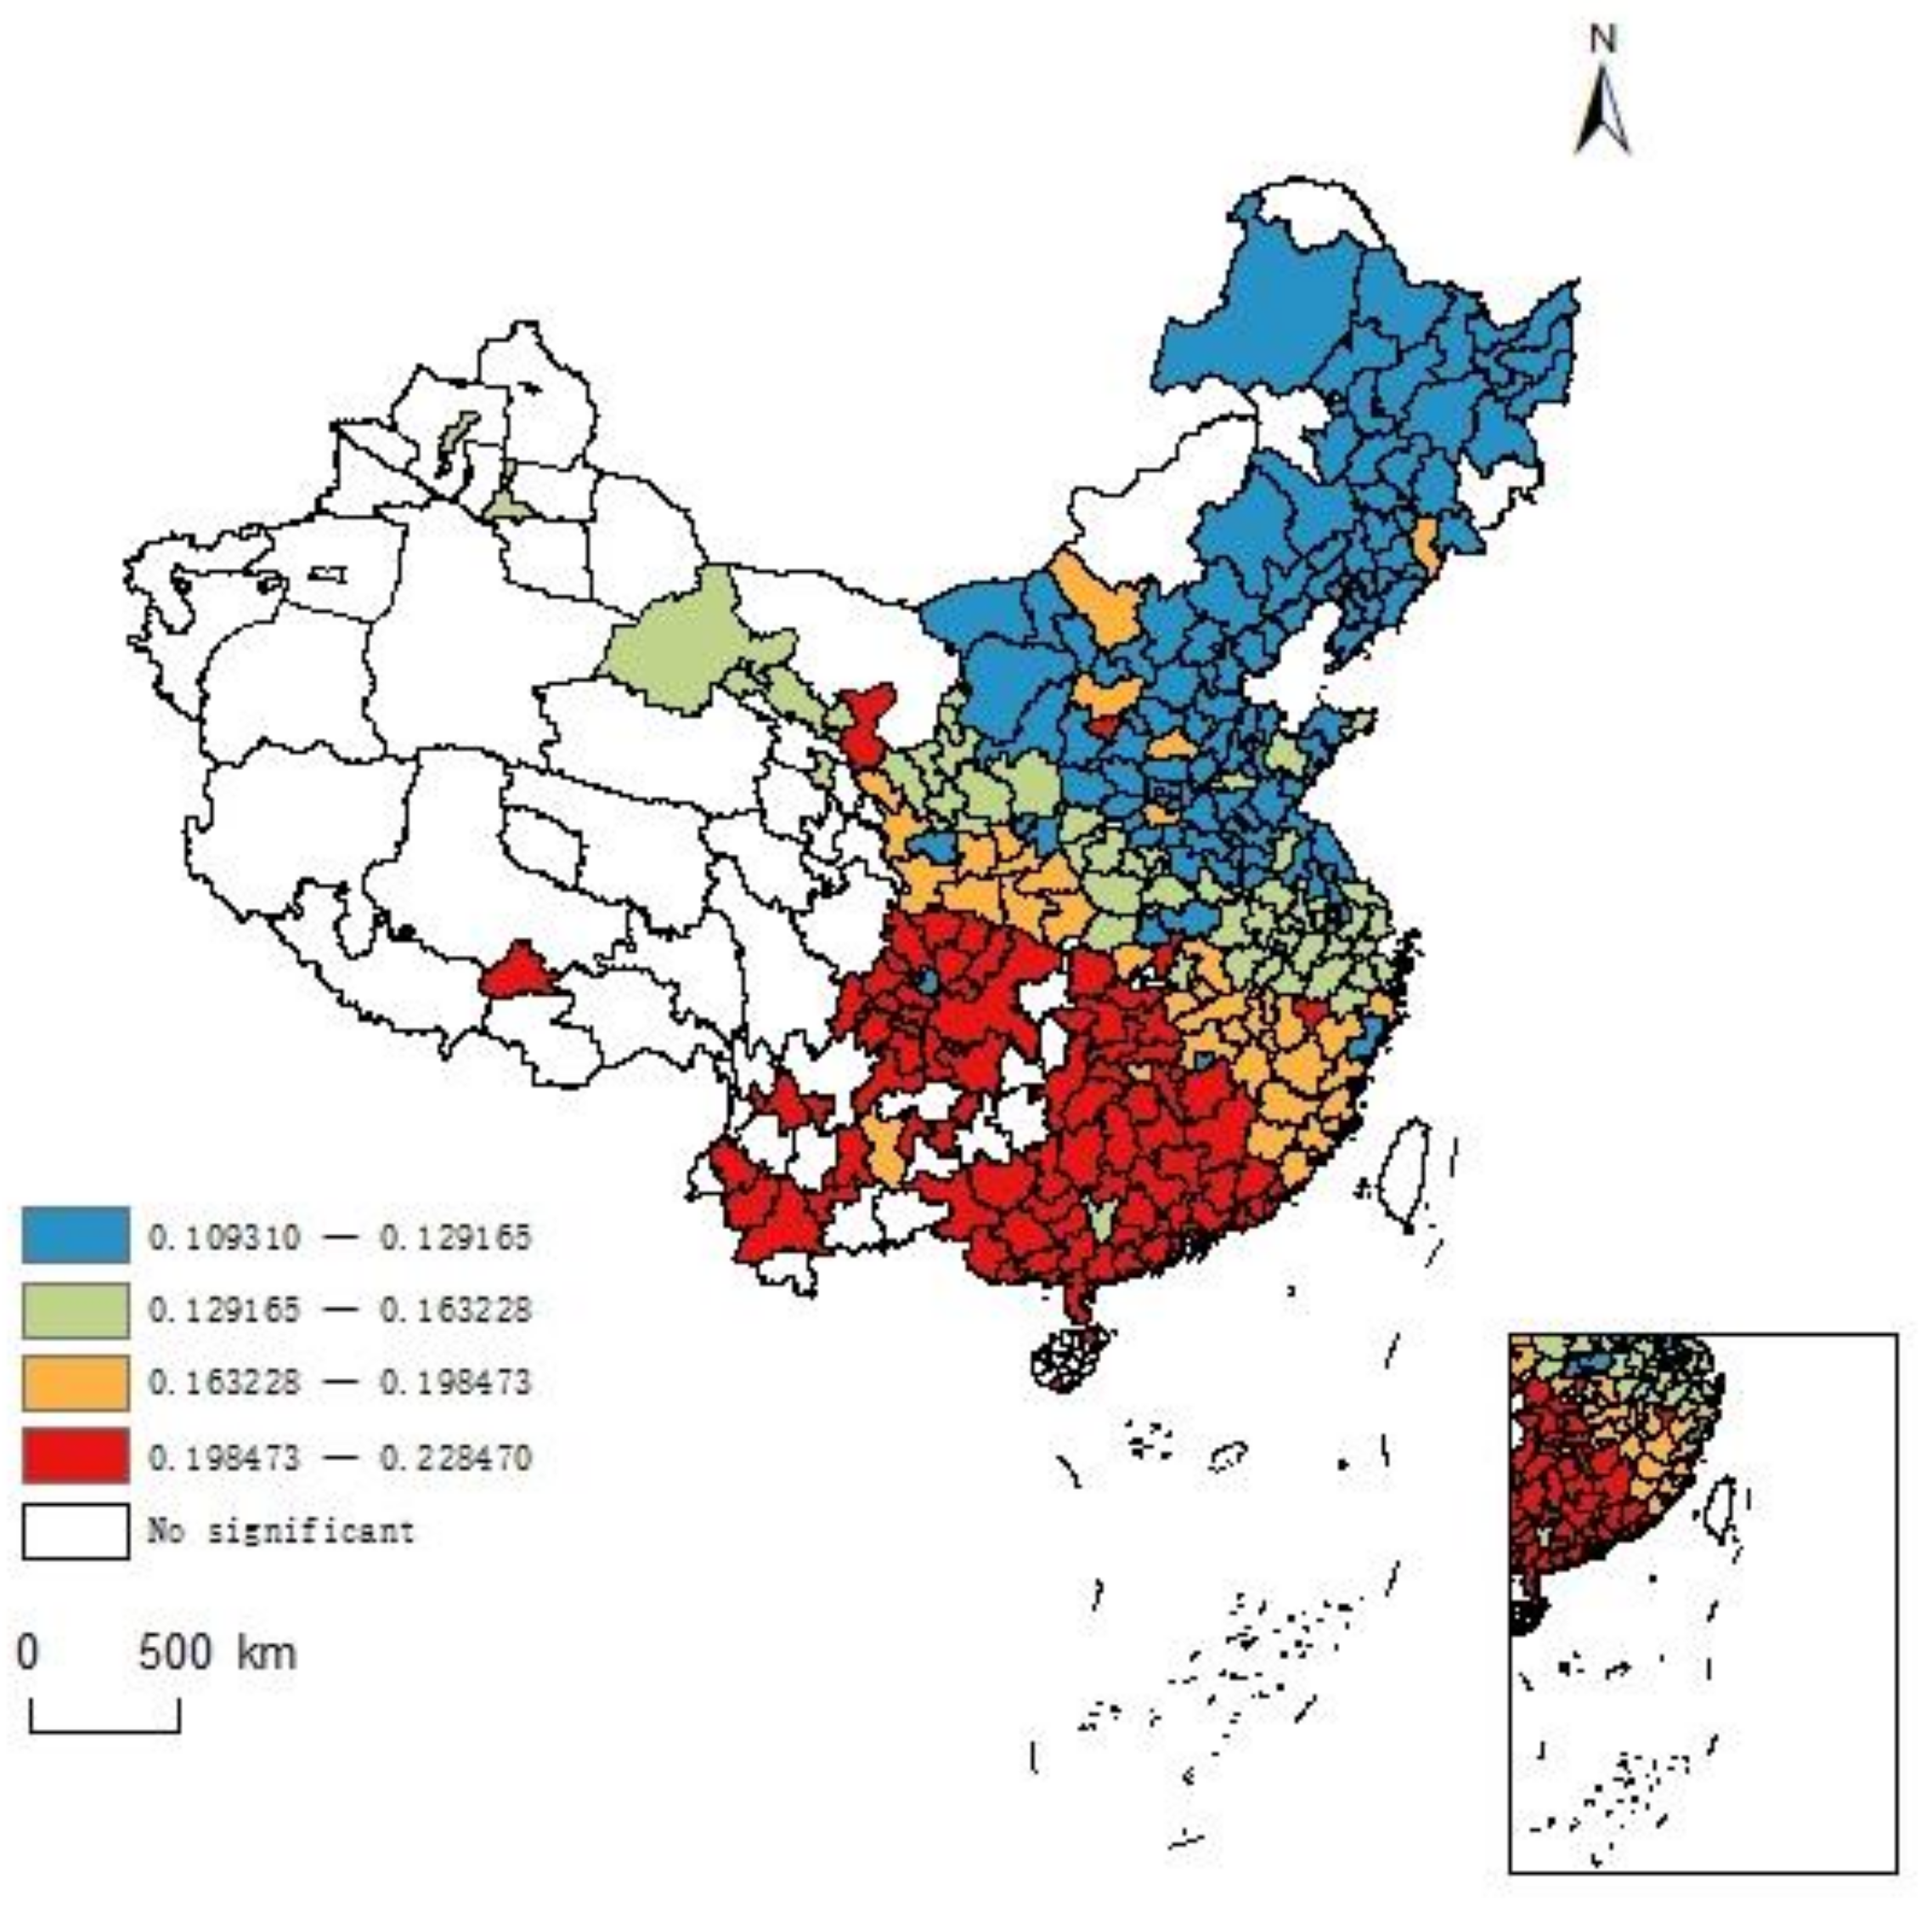
4.4.8. Energy Conservation and Environmental Protection Expenditure

The regression coefficient of energy conservation and environmental protection ranges from 0.109 to 0.228, with an average value of 0.162. Energy conservation and environmental protection have a positive impact on UECC and show a gradual weakening trend from the southwest to the northeast in space (Figure 10). The reason may be that energy conservation and environmental protection expenditures can support the advancement of energy-saving projects in the form of financial subsidies and incentives, prompting enterprises to use energy-saving and environmental protection technologies and products and restraining enterprises from consuming excessive amounts of resources and the environment. The effects of energy conservation and environmental protection expenditures vary significantly among regions. The most affected areas are concentrated in South China and Southwest China. In most of these cities, heavy chemical industries are their pillar industries, not only causing environmental pollution but also affecting the sustainable development of cities and creating a bottleneck in environmental management. With investments in energy conservation and environmental protection and the continuous advancement of urbanization, the marginal cost of environmental governance has been reduced, and pollution emissions have also been reduced. It has improved not only economic efficiency but also allowed environmental management to operate at a lower cost, taking a proactive approach to the problem of “blue sky.” In the northeast, where energy conservation and environmental protection expenditures have contributed less to UECC than other spending, the impact is relatively insignificant. There is a traditional old industrial base; for a long time, the industrial economy has developed at the expense of the environment. The improvement of ecological efficiency depends more on technological progress. Significant investments in science and technology have been made in the area, as well as the active development of the tertiary industry and high-tech industries, rather than investment in environment management.

5. Conclusions and Suggestions

5.1. Conclusions

Based on panel data from 286 Chinese prefecture-level cities from 2010 to 2019, UECC of each municipality was estimated by the comprehensive evaluation method after weighing variables with the entropy method. Moran’ s I index analyzes the measurement results, and the spatial and temporal differentiation characteristics of the GIS platform are investigated. The driving mechanism of UECC was analyzed through the MGWR model. The results show that
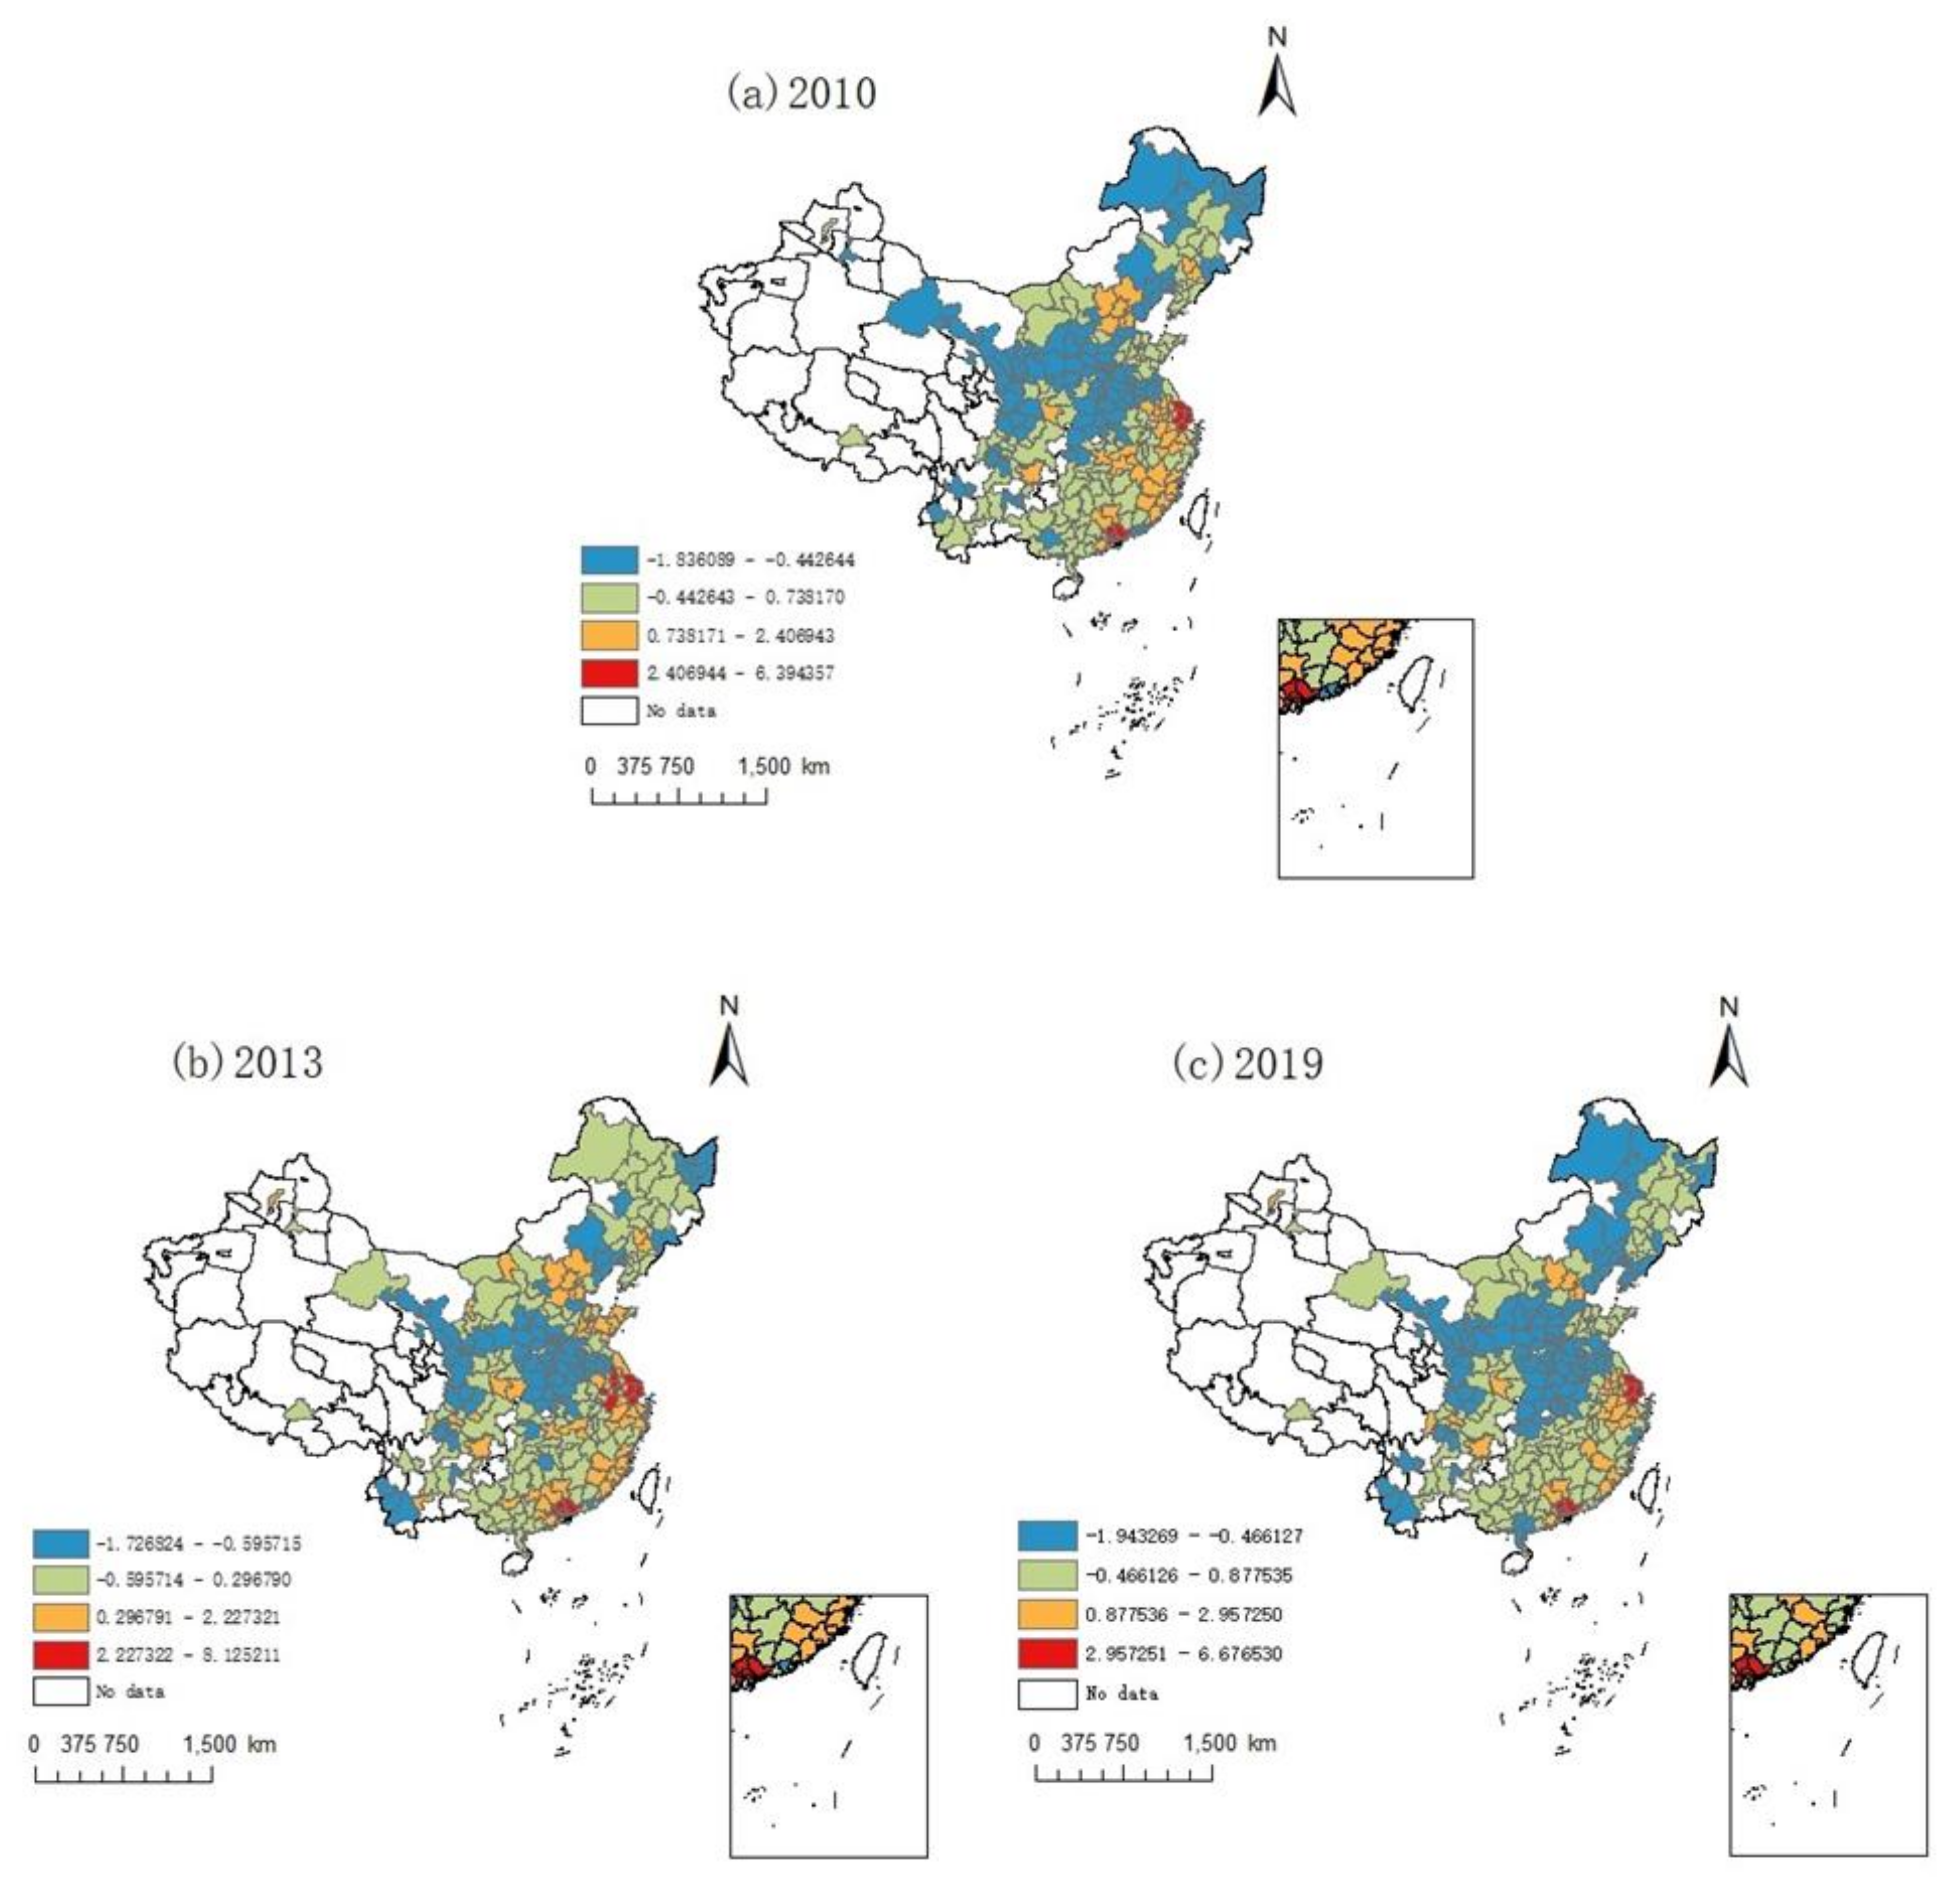
  • From a regional perspective, the China’s UECC index ranges from 0.0233 to 0.2811 in 2019, which is still low. From 2010 to 2019, there was no noticeable difference in UECC in any region except Northeast China. The local Moran’s I index showed that hot-hot agglomeration is primarily found in the Yangtze River Delta cities and the Pearl River Delta cities, with a relatively stable spatial distribution. Low-low agglomeration is primarily distributed in Linfen, Yuncheng, Sanmenxia, and Shangluo in the Central Plains and has trend of spatial expansion to surrounding cities;
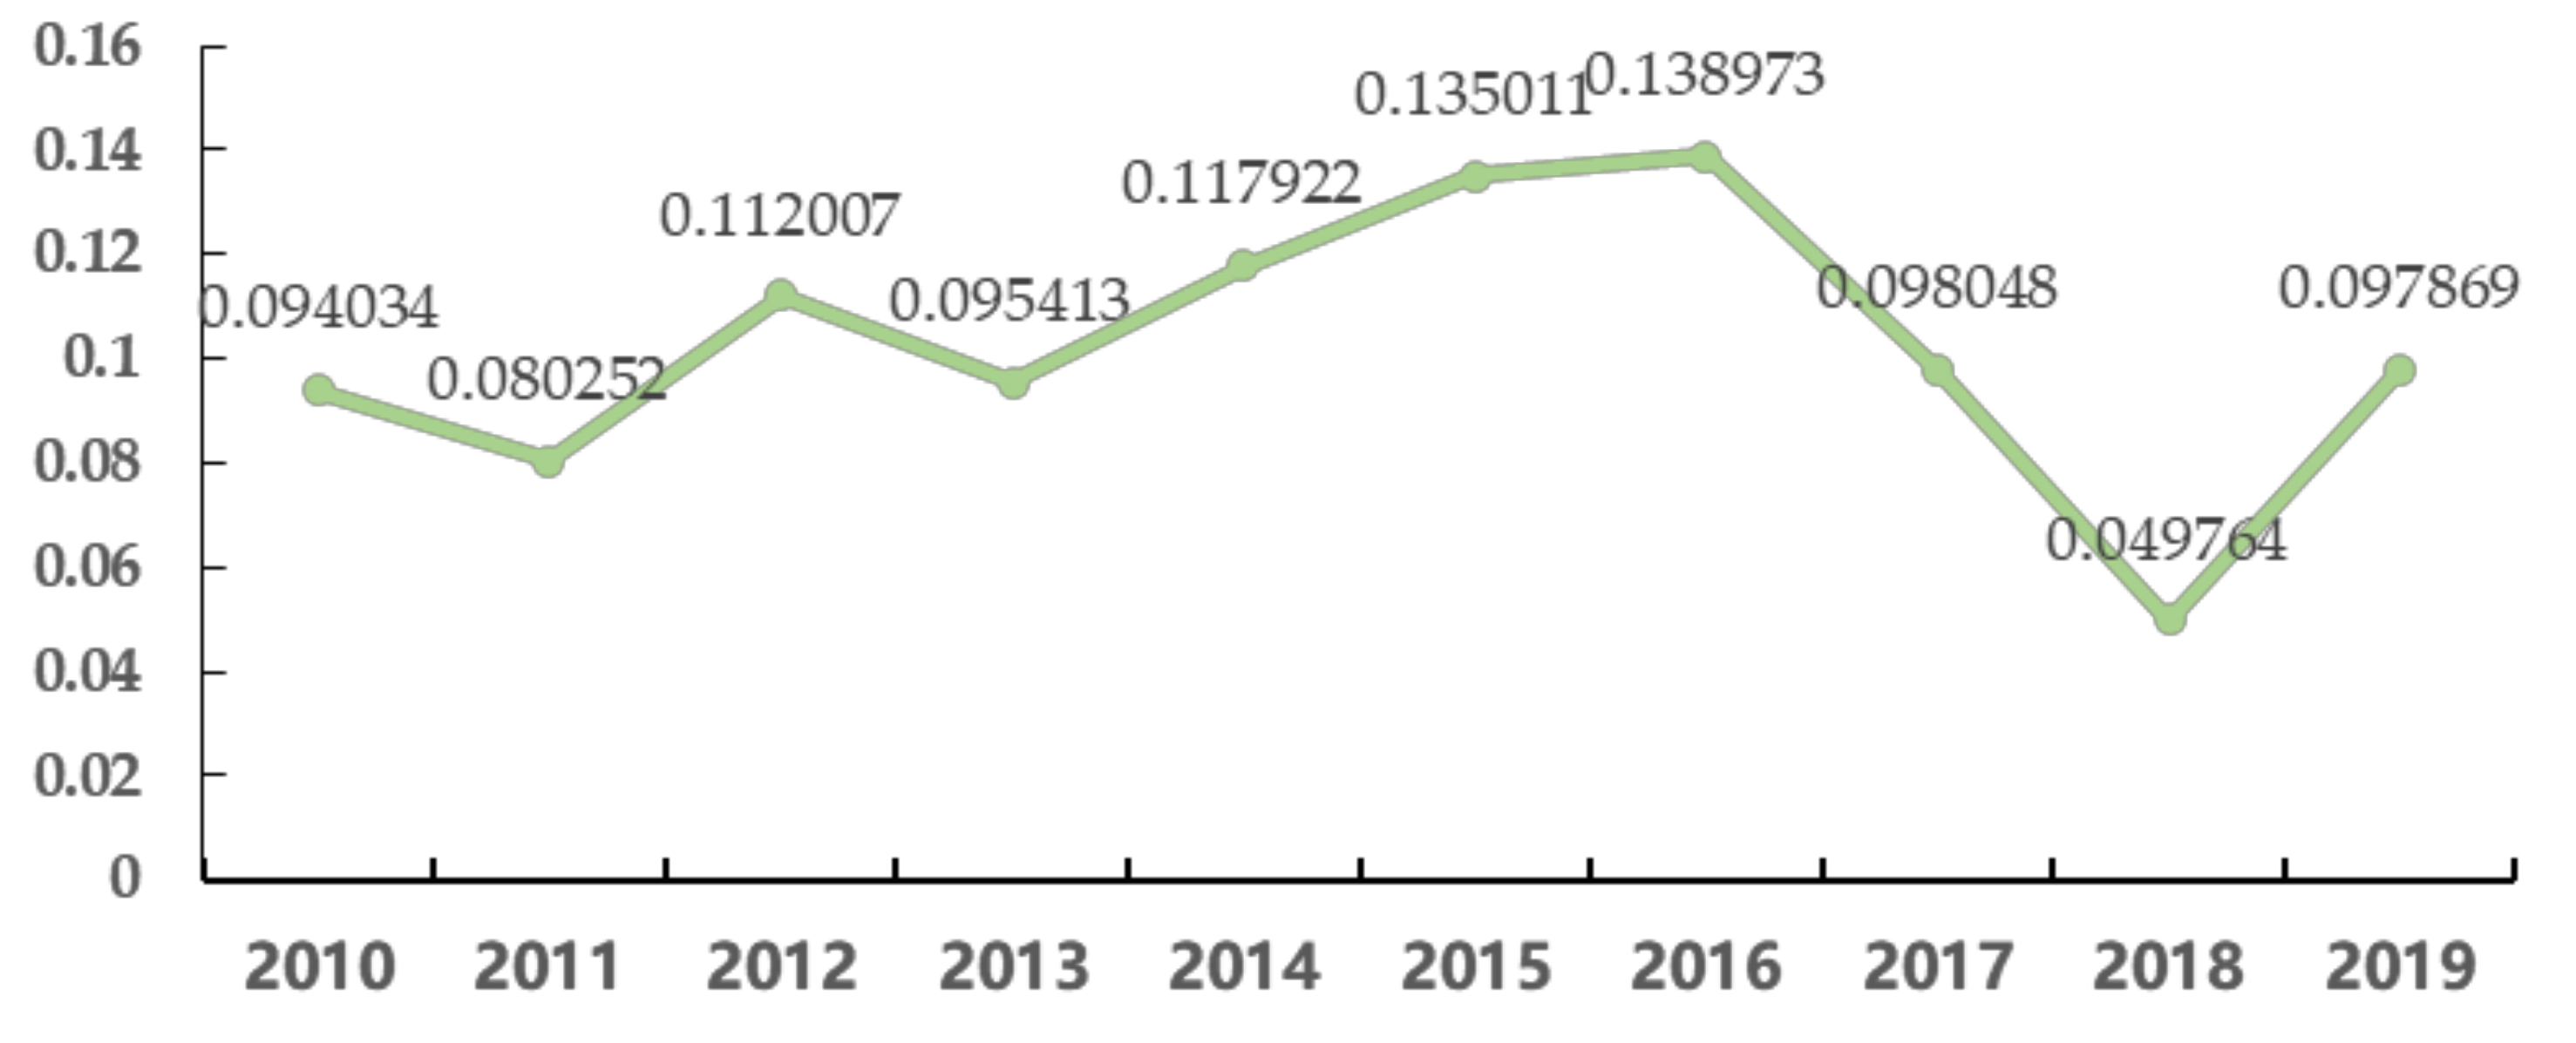
  • UECC’s Moran’s I index ranges from 0.0498 to 0.1390, showed a significant positive spatial correlation with a trend of fluctuation. The regression coefficients of the eight variables were generally substantial in the MGWR regression results, and the effects of each driving factor were different to some extent in spatial distribution, reflecting that other variable had different levels of spatial heterogeneity. Among them, land endowment and environmental governance are close to global scale variables, their bandwidths are 227 and 232. Economic development, water resource supply, foreign investment, urbanization level, technological innovation, and industrial structure are micro variables with bandwidths of 84, 77, 43, 104, 43, 43;
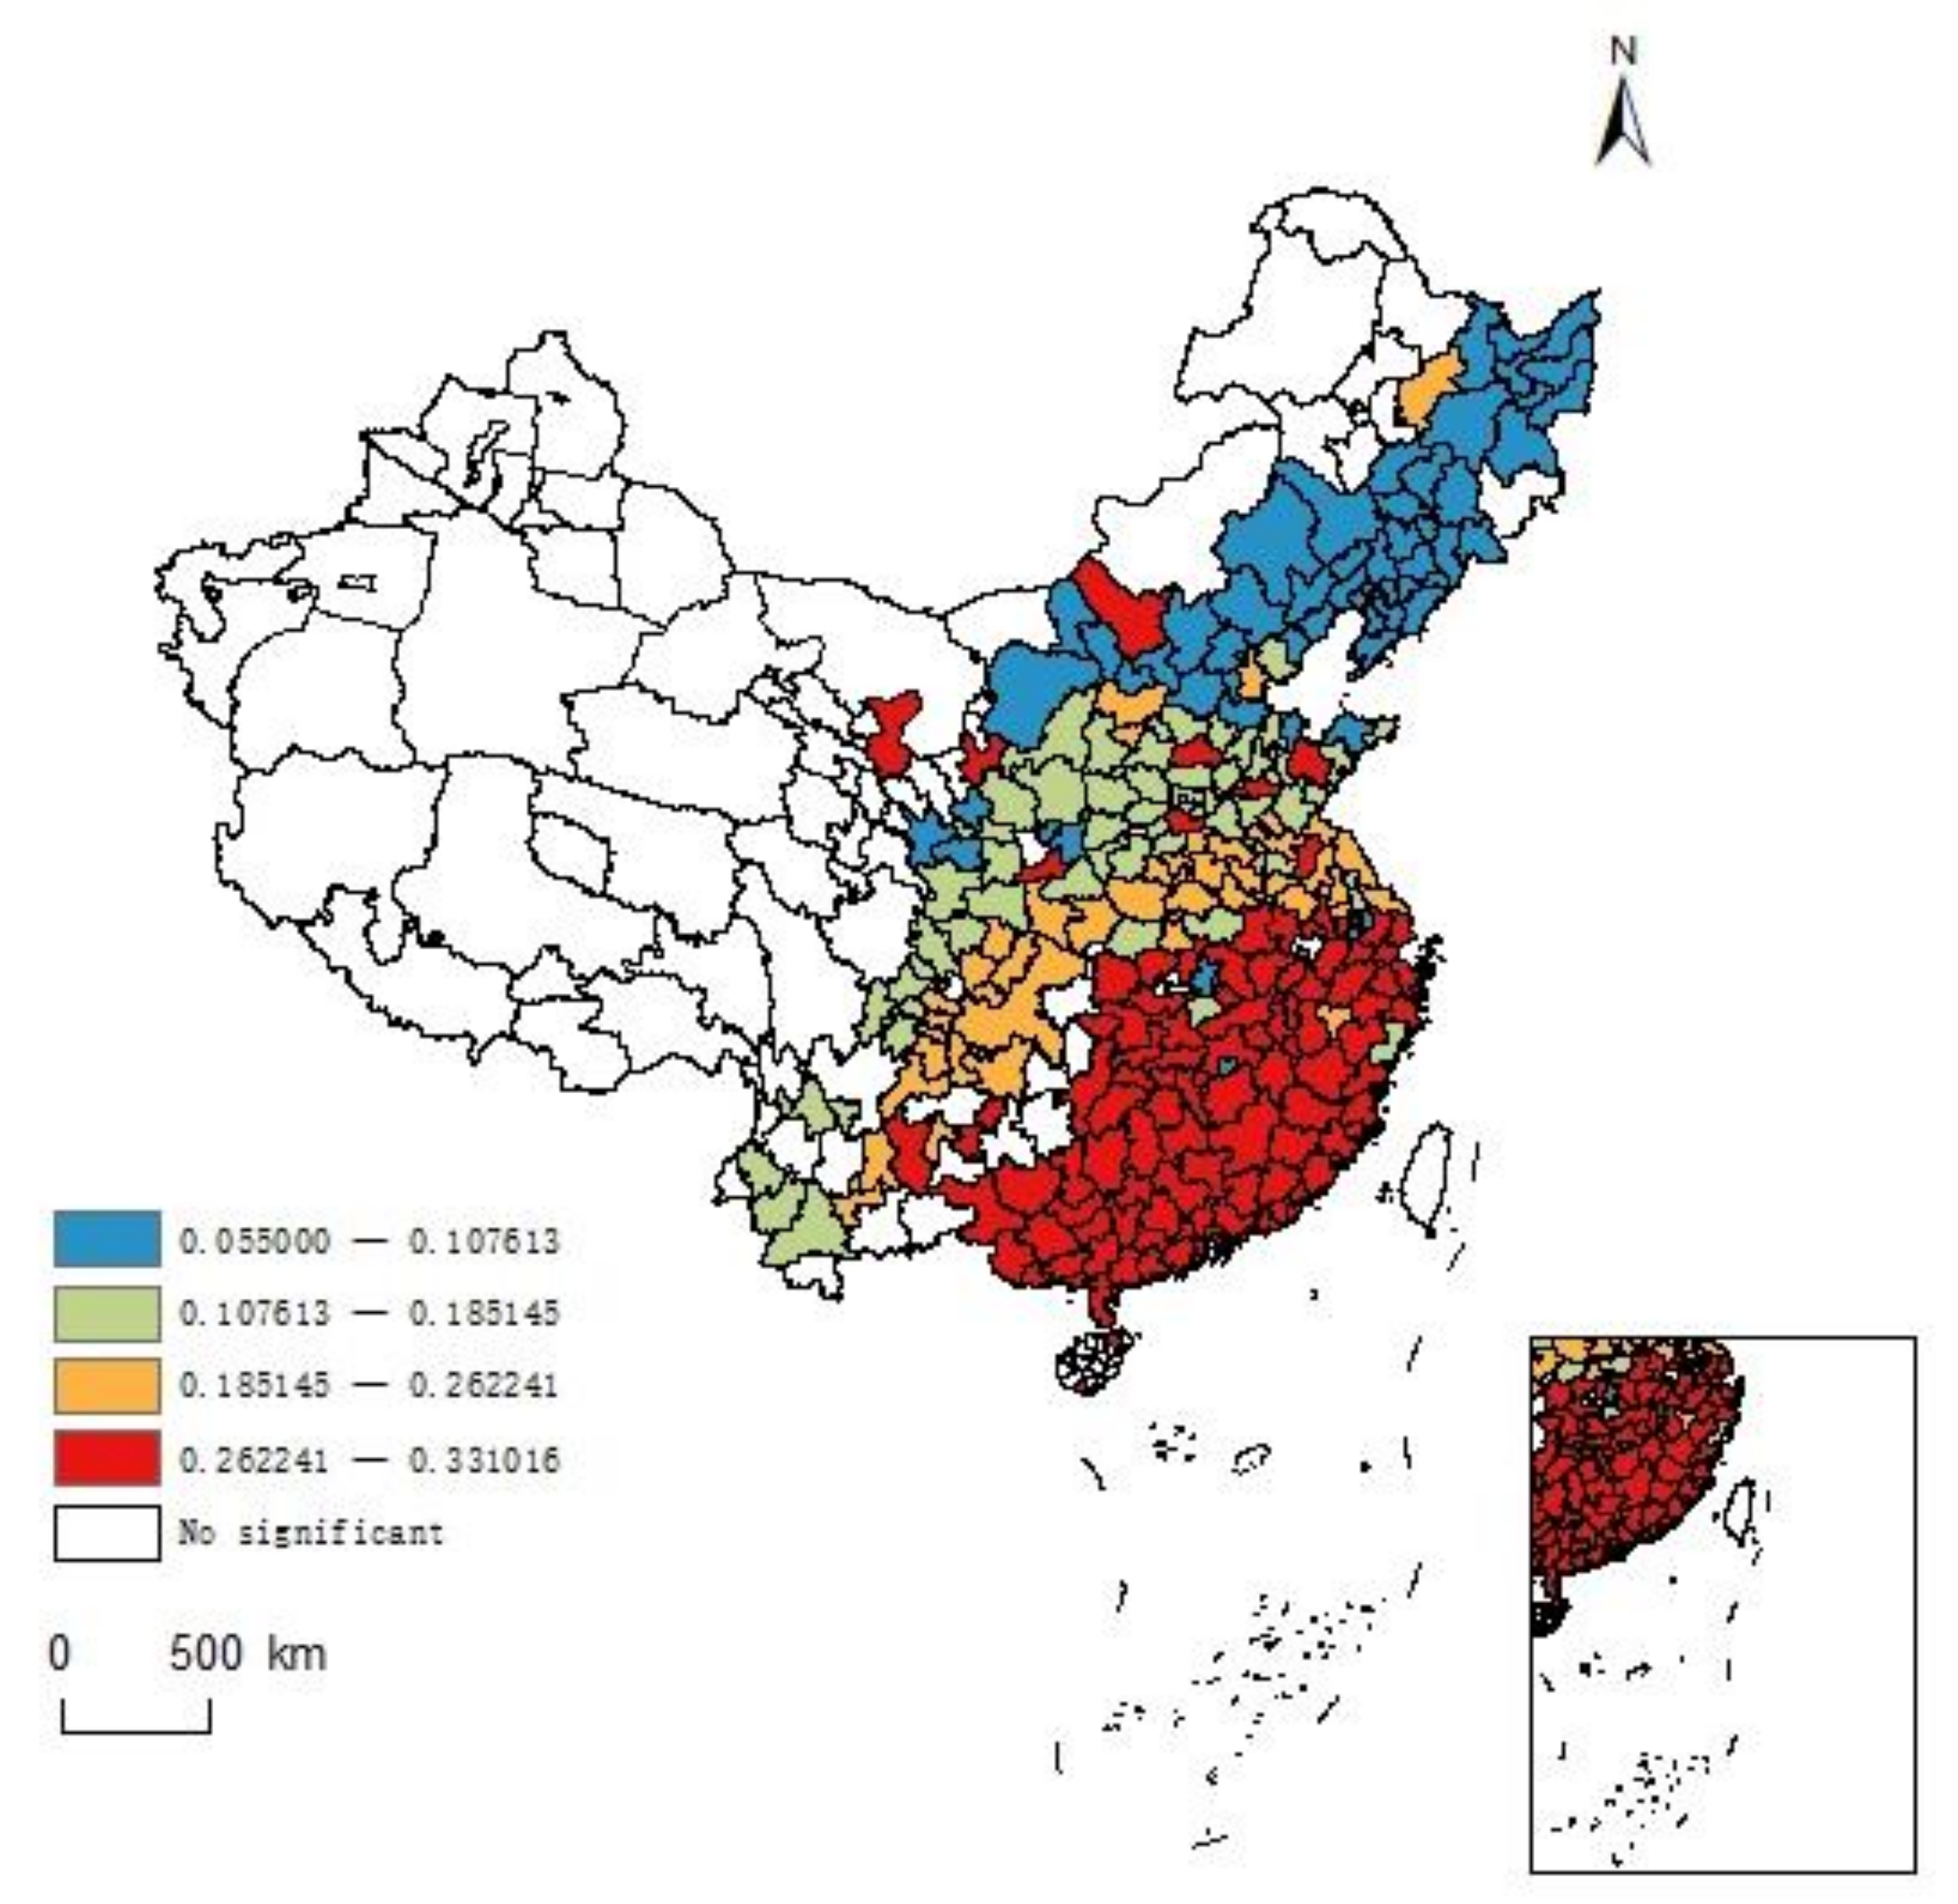
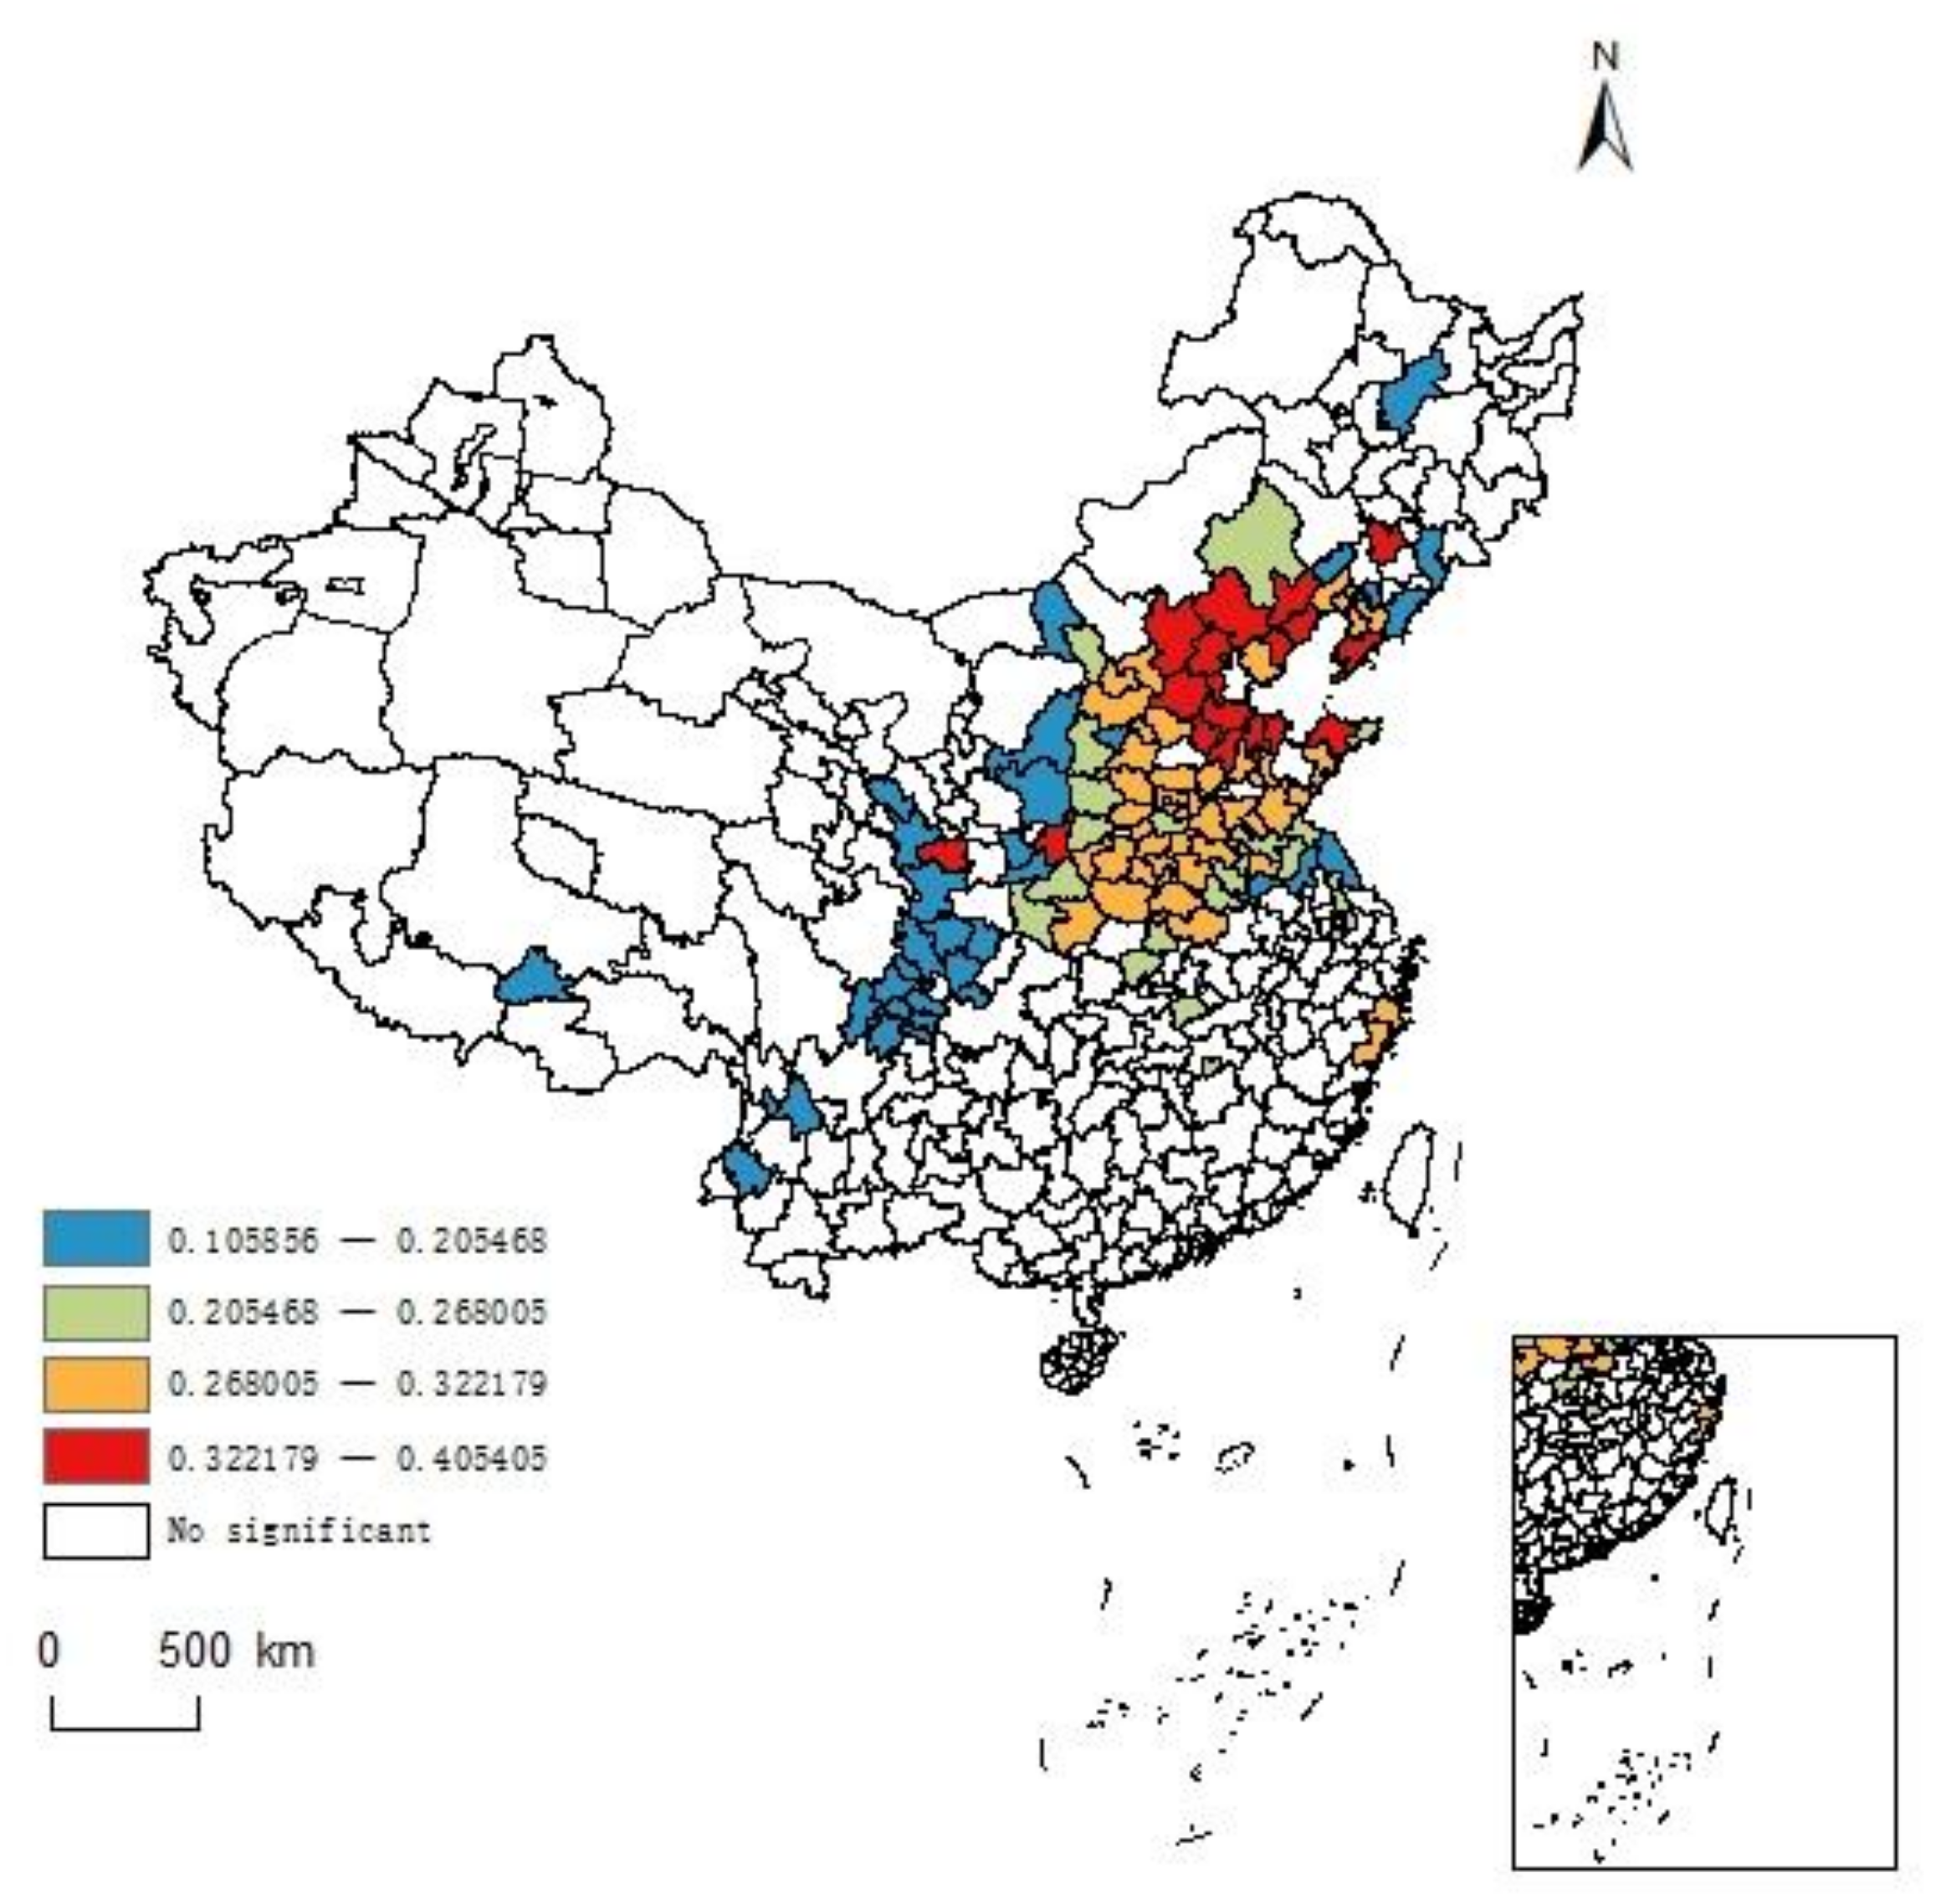
  • In terms of the mean value of coefficients, all influencing factors had a significant beneficial effect on UECC. From the perspective of the mean value of the coefficient, the gradation of influence intensity is as follows: economic development > technology innovation > industrial structure > urbanization level > land endowment > environmental governance > water supply > utilization of foreign capital. Water resource supply, industrial structure, and environmental governance show a step-like distribution from east to west. In contrast, land endowment and economic development show a step-like distribution from north to south. Foreign capital utilization, urbanization level and technological innovation show a tendency to gather in a specific region. The influence of foreign capital utilization and technological innovation is evident in southeastern coastal areas. The urbanization level has a noticeable impact on UECC, mainly in the Yangtze River Delta;
  • Different influencing factors play different roles in each region. According to the analysis of influencing factors, local governments can develop the policy suitable for local conditions, this move can reduce the error cost of developing a unified policy. Nevertheless, the actual situation may hinder the implementation of the policy. It may take years to improve the comprehensive UECC, but with the application of the policy, environmental performance would be better.

5.2. Suggestions

First, the function of urban agglomerations should be strengthened, and a differentiated development strategy should be implemented. As seen from the analysis of various influencing factors, an urban agglomeration is essential to promote UECC. The role of urban agglomerations should be considered when promoting UECC. In coastal regions, core cities should prevent from siphoning resources from surrounding cities, cooperation between governments should be strengthened, low eco-efficient cities should drive through the radiation of highly eco-efficient cities, so that large gaps can be avoided within urban agglomerations, and overall ecological efficiency should be promoted. In the Beijing-Tianjin-Hebei region, each town should focus on relieving noncapital functions and maximizing their strengths while lessening their weaknesses. A city with high UECC should promote the UECC of its surrounding cities while maintaining the original level; cities with medium UECC should prevent a decline in UECC while improving it and realizing the rapid integration of the environmental protection industry and the urbanization process. Towns with a low UECC should pay attention to negative externalities and construction quality in rapid urbanization, focus equal attention on both function and quality. In the process of top-level design, the government should make more efficient use of resources from the overall point of view and find an innovative and characteristic road of ecological civilization construction according to the differences between urban agglomerations.
Second, characteristic industrial clusters with high-quality foreign capital should be developed, and industrial structure optimization with technological innovation should be promoted. According to the findings of influencing factors, the impact of industrial system optimization on UECC is significant, while the impact of foreign capital utilization is weak. Optimizing the industrial structure by attracting foreign capital can produce a scale effect. In South China’s coastal areas, where foreign capital has the most significant impact, there are innovation highlands in Shenzhen and Guangzhou and relatively backward regions of Guangxi and Hainan. Today, the advantages of cities, such as Guangzhou and Shenzhen, to spur the development of cities should be fully used, eventually making the whole area of science and technology innovation and producing a positive effect on UECC. High-end manufacturing and high added value should introduce in the field, advanced manufacturing, modern services, and internet enterprise cooperation should strengthen, following the requirement of “to deepen the development along the Yangtze River, and to accelerate the development of coastal cities.” The linkage of rivers and seas for breakthroughs should promote to ensure the spillover effect of FTZs and the landing of relocated companies. At the same time, the foreign investment import and export structure should optimize, closely combining intensive investment and the promotion of industrial transformation and upgrading, improving the driving effect of foreign investment on the industry to produce a good radiation effect, and driving the coordinated development of other enterprises in related fields. South China should seize the strategic opportunity to attract foreign investment, initiate reform measures and introduce FTZs, constantly optimize the business environment, promote close integration between industry, technology, and talent, form more distinctive industry features, and create a more beautiful ecological environment.
Third, ecological civilization should boost economic development, and economic development should support environmental expenditures. Enabling the protection of the environment and the construction of an ecological civilization at a faster pace. Ecological resources represent a vital wealth factor of high-quality economic development, to stimulate environmental investment and financing, the government needs to improve the structure of public spending and speed up the establishment of an environmentally friendly budget and expenditure system, consistent with each region’s economic development level and actual pollution discharge. In northwest China, the ecology is fragile, and appropriate environmental protection measures must be gradually explored and chosen. On the one hand, to strengthen ecological protection expenditures, the integration of cross-city resource elements can realize by utilizing various urban functions and longboards. The two-way, efficient linkage and circulation of local materials, information, capital, and talent in the field of environmental protection should be promoted, interregional urban function complementarity and factor integration should be realized, and the efficiency of fiscal, ecological protection expenditure in cities with high energy consumption and low output should be improved. On the other hand, economic development should be taken as the goal, industry transfer from coastal cities should be conducted, measures should adjust to local conditions, the radiation impetus function of core cities should develop, environmental barriers should reduce, and urban environmental infrastructure construction and environmental protection technology research and development should be guided.
Fourth, a national layout of ecological civilization should be created based on the “production-living-ecology” space. From the perspective of the whole country, on the premise of environment priority, the good division of production, life, and environment function areas in various regions should be coordinated, and the practicability of the spatial layout of the administrative regions should be enhanced. From the perspective of different regions, in the eastern region, there is a severe contradiction between humankind and land. The urban land space should be optimized, the economical use of land should be promoted, and green ecological space should be fostered. The central region should alter the economic development pattern, accelerate industry transformation and upgrade, reduce pollutant emissions, speed up the implementation of ecological restoration engineering, and improve the self-purification ability of environmental systems. The western region should strengthen urban construction, improve the trunk traffic network, implement the supporting standards of public service facilities, establish agricultural population urbanization mechanisms, attract a large migrant population and rural labor force, and develop characteristic ecological circular agriculture. Urban agglomerations should insist on giving priority to ecology to ensure the stability of the production space structure of urban agglomerations, revise conflict areas in conjunction with each city’s urban development boundaries. In addition, different urban agglomerations should take centralized and distributed development as the guiding principle, promote the formation of two-district and multidistrict driving patterns, and jointly build new ecological corridors and ecological networks.

Author Contributions

Conceptualization, K.L. and Q.Z.; data curation, X.X.; formal analysis, K.L. and X.X.; funding acquisition, K.L. and Q.Z.; methodology, K.L., Q.Z. and X.X.; supervision, K.L. and Q.Z.; software, X.X.; writing—original draft, X.X.; writing—review and editing, K.L., Q.Z. and X.X. All authors have read and agreed to the published version of the manuscript.

Funding

This work was supported by grants from Support Plan for Scientific and Technological Innovation Talents in Henan Institutions of Higher Learning (humanities and social sciences) (2018-cx-012); Training Plan for Key Young Teachers in Henan Institutions of Higher Learning (2018GGJS094); Good Scholar in Philosophy and Social Sciences in Henan Institutions of Higher Learning (2019-YXXZ-20); and Philosophy and Social Science Innovation Team Building Program of Henan Universities (2021-CXTD-12); Philosophy and Social Science Innovation Team Support Plan of Henan Provincial Colleges and Universities (2022-CXTD-05); Research Project of Philosophy and Social Science Think Tanks in Colleges and Universities in Henan Province (2021-ZKYJ-06); 2021 Henan Provincial Social Science Planning Annual Project (2021BJJ111); Henan Province Soft Science Research Project (212400410015).

Institutional Review Board Statement

Not applicable.

Informed Consent Statement

Not applicable.

Data Availability Statement

Data available in a publicly accessible repository.

Conflicts of Interest

The authors declare no conflict of interest. The funders have no role in the design of the study; in the collection, analyses, or interpretation of data; in the writing of the manuscript, or in the decision to publish the results.

References

  1. George, R.M.; Kini, M.K. Formulating urban design guidelines for optimum carrying capacity of a place. Procedia Technol. 2016, 24, 1742–1749. [Google Scholar] [CrossRef] [Green Version]
  2. Peng, B.; Li, Y.; Elahi, E.; Wei, G. Dynamic evolution of ecological carrying capacity based on the ecological footprint theory: A case study of Jiangsu province. Ecol. Indic. 2019, 99, 19–26. [Google Scholar] [CrossRef]
  3. Rees, W. Revisiting carrying capacity: Area-based indicators of sustainability. Popul. Environ. 1996, 17, 195–215. [Google Scholar] [CrossRef]
  4. Shi, Y.; Wang, H.; Yin, C. Evaluation method of urban land population carrying capacity based on GIS-A case of Shanghai, China. Comput. Environ. Urban. 2013, 39, 27–38. [Google Scholar] [CrossRef]
  5. Wang, K.-F. Evaluation of the water resources carrying capacity of Shandong peninsula, China. J. Groundw. Sci. Eng. 2016, 4, 120–130. [Google Scholar]
  6. Leopold, A. Wildlife in American culture. J. Wildl. Manag. 1943, 7, 1–6. [Google Scholar] [CrossRef]
  7. Lin, L.; Liu, Y.; Chen, J.; Zhang, T.; Zeng, S. Comparative analysis of environmental carrying capacity of the Bohai Sea Rim area in China. J. Environ. Monitor. 2011, 13, 3178–3184. [Google Scholar] [CrossRef] [PubMed]
  8. Pearce, D. The limits of cost-benefit analysis as a guide to environmental policy. Kyklos 1976, 29, 97–112. [Google Scholar] [CrossRef]
  9. Rees, W.E. Ecological footprints and appropriated carrying capacity: What urban economics leaves out. Environ. Urban. 1992, 4, 121–130. [Google Scholar] [CrossRef]
  10. Zhu, M.; Shen, L.; Tam, V.; Liu, Z.; Shu, T.; Luo, W. A load-carrier perspective examination on the change of ecological environment carrying capacity during urbanization process in China. Sci. Total Environ. 2020, 714, 136843. [Google Scholar] [CrossRef]
  11. Zhang, Y.; Fan, J.; Wang, S. Assessment of ecological carrying capacity and ecological security in China’s typical eco-engineering areas. Sustainability 2020, 12, 3923. [Google Scholar] [CrossRef]
  12. Wang, Y.; Jiang, Y.; Zheng, Y.; Wang, H. Assessing the ecological carrying capacity based on revised Three-Dimensional ecological footprint model in inner Mongolia, China. Sustainability 2019, 11, 2002. [Google Scholar] [CrossRef] [Green Version]
  13. Liu, D.; Feng, Z.; Yang, Y.; You, Z. Spatial patterns of ecological carrying capacity supply-demand balance in China at county level. J. Geogr. Sci. 2011, 21, 833–844. [Google Scholar] [CrossRef]
  14. Kang, P.; Xu, L. The urban ecological regulation based on ecological carrying capacity. Procedia Environ. Sci. 2010, 2, 1692–1700. [Google Scholar] [CrossRef] [Green Version]
  15. Wang, Y.; Peng, B.; Wei, G.; Elahi, E. Comprehensive evaluation and spatial difference analysis of regional ecological carrying capacity: A case study of the Yangtze River urban agglomeration. Int. J. Environ. Res. Public Health 2019, 16, 3499. [Google Scholar] [CrossRef] [PubMed] [Green Version]
  16. Fang, W.; An, H.; Li, H.; Gao, X.; Sun, X. Urban economy development and ecological carrying capacity: Taking Beijing city as the case. Energy Procedia 2017, 105, 3493–3498. [Google Scholar] [CrossRef]
  17. Zhu, T.; Zhang, L. Study on Ecological Economic Zone Division in the County Based on Comprehensive Evaluation of Ecological Carrying Capacity. In Proceedings of the 2013 the International Conference on Remote Sensing, Environment and Transportation Engineering (RSETE 2013), Nanjing, China, 26–28 July 2013. [Google Scholar]
  18. Hammond, A.L.; Adriaanse, A.; Rodenburg, E.; Bryant, D.; Woodward, R.; World Resources Institute. Environmental Indicators: A Systematic Approach to Measuring and Reporting on Environmental Policy Performance in the Context of Sustainable Development; World Resources Institute: Washington, DC, USA, 1995; p. 11. [Google Scholar]
  19. Hu, G.; Zeng, W.; Yao, R.; Xie, Y.; Liang, S. An integrated assessment system for the carrying capacity of the water environment based on system dynamics. J. Environ. Manag. 2021, 295, 11. [Google Scholar] [CrossRef] [PubMed]
  20. Song, F.; Yang, X.; Liu, T.; Xue, Q. Evaluation of Urban Ecological Carrying Capacity Based on State-space method. In Proceedings of the 4th International Conference on Advances in Energy Resources and Environment Engineering (ICAESEE), Chengdu, China, 7–9 December 2018. [Google Scholar]
  21. Jiao, W.; Min, Q.; Cheng, S.; Zhang, D.; Sun, Y. The emergy-based ecological footprint (EEF) of Traditional agricultural areas in China: A case study of Congjiang County, Guizhou Province. J. Resour. Ecol. 2011, 2, 56–65. [Google Scholar]
  22. Nakajima, E.; Ortega, E. Carrying capacity using emergy and a new calculation of the ecological footprint. Ecol. Indic. 2016, 60, 1200–1207. [Google Scholar] [CrossRef]
  23. Ross, S.; Evans, D. Use of life cycle assessment in environmental management. Environ. Manag. 2002, 29, 132–142. [Google Scholar] [CrossRef] [PubMed]
  24. Yue, D.; Ma, J.; Guo, J.; Zhang, J.; Du, J.; Song, Y.; Hui, C. RS & GIS-based Spatialtemporal Analysis of Ecological Footprint and Biocapacity Pattern of Jinghe River Watershed in China: Does Supply Meet Demand. In Progress in Environmental Science and Engineering; Shanghai University of Electric Power: Shanghai, China, 2011. [Google Scholar]
  25. Chen, Y.; Chen, C.-Y.; Hsieh, T.F. Establishment and applied research on environmental sustainability assessment indicators in Taiwan. Environ. Monit. Assess. 2009, 155, 407–417. [Google Scholar] [CrossRef]
  26. Haberl, H.; Fischer-Kowalski, M.; Krausmann, F.; Weisz, H.; Winiwarter, V. Progress towards sustainability? What the conceptual framework of material and energy flow accounting (MEFA) can offer. Land Use Policy 2004, 21, 199–213. [Google Scholar] [CrossRef]
  27. Wang, S.; Xu, L.; Yang, F.; Wang, H. Assessment of water ecological carrying capacity under the two policies in Tieling City on the basis of the integrated system dynamics model. Sci. Total Environ. 2014, 472, 1070–1081. [Google Scholar] [CrossRef] [PubMed]
  28. Wu, T.; Sang, S.; Wang, S.; Yang, Y.; Li, M. Remote sensing assessment and spatiotemporal variations analysis of ecological carrying capacity in the Aral Sea Basin. Sci. Total Environ. 2020, 735, 11. [Google Scholar] [CrossRef]
  29. Li, X.; Bao, J.; Sun, J.; Wang, J. Application of DPSIR model in prediction of ecological sustainable development capacity in Bohai Sea. Arab. J. Geosci. 2021, 14, 10. [Google Scholar] [CrossRef]
  30. Chen, J.; Zeng, M.; Duan, Y. Regional carrying capacity evaluation and prediction based on GIS in the Yangtze River Delta, China. Int. J. Geogr. Inf. Sci. 2011, 25, 171–190. [Google Scholar] [CrossRef]
  31. Sun, C.; Chen, L.; Tian, Y. Study on the urban state carrying capacity for unbalanced sustainable development regions: Evidence from the Yangtze River Economic Belt. Ecol. Indic. 2018, 89, 150–158. [Google Scholar] [CrossRef]
  32. Shao, Q.; Liu, X.; Zhao, W. An alternative method for analyzing dimensional interactions of urban carrying capacity: Case study of Guangdong-Hong Kong-Macao Greater Bay Area. J. Environ. Manag. 2020, 273, 12. [Google Scholar] [CrossRef] [PubMed]
  33. Liu, Y.; Hu, Y.; Su, M.; Meng, F.; Dang, Z.; Lu, G. Multiregional input-output analysis for energy-water nexus: A case study of Pearl River Delta urban agglomeration. J. Clean. Prod. 2020, 262, 15. [Google Scholar] [CrossRef]
  34. Yue, Q.; Wu, X.; Wang, Y. Analysis and evaluation of the ecological carrying capacity of Liaoning two urban agglomerations based on state space method. In Proceedings of the International Conference on Sustainable Energy and Environmental Engineering (ICSEEE), Guangzhou, China, 29–30 December 2012. [Google Scholar]
  35. Meng, L.; Liu, G.; Xiong, X.; Wang, Q. Spatial analysis of water resource ecological footprint and ecological carrying capacity in Jiangxi Province. In Proceedings of the International Conference on Water Resources and Environment (WRE), Beijing, China, 23–26 July 2016. [Google Scholar]
  36. Tang, M.; Wu, D.; Fu, X.; Cao, H. An assessment of ecological carrying capacity of Xilingol, Inner Mongolia. Int. J. Sust. Dev. World 2017, 24, 408–414. [Google Scholar] [CrossRef]
  37. Wang, M. Calculation of sensitive factors in ecologically sensitive areas of plateau: Comprehensive evaluation of ecological carrying capacity. Appl. Nanosci. 2021. [Google Scholar] [CrossRef]
  38. Wang, C.; Yang, Y.; Zhang, Y. Economic Development, Rural livelihoods, and Ecological Restoration: Evidence from China. Ambio 2011, 40, 78–87. [Google Scholar] [CrossRef] [Green Version]
  39. Xiao, Y.; Wu, X.; Wang, L.; Liang, J. Optimal farmland conversion in China under double restraints of economic growth and resource protection. J. Clean. Prod. 2017, 142, 524–537. [Google Scholar] [CrossRef]
  40. Cakar, N.D.; Gedikli, A.; Erdoğan, S.; Yildirim, D.C. Exploring the nexus between human capital and environmental degradation: The case of EU countries. J. Environ. Manag. 2021, 295, 9. [Google Scholar] [CrossRef] [PubMed]
  41. Fu, J.; Zang, C.; Zhang, J. Economic and resource and environmental carrying capacity trade-off analysis in the Haihe River basin in China. J. Clean. Prod. 2020, 270, 122271. [Google Scholar] [CrossRef]
  42. Zhou, X.; Lei, K.; Meng, W.; Khu, S. Industrial structural upgrading and spatial optimization based on water environment carrying capacity. J. Clean. Prod. 2017, 165, 1462–1472. [Google Scholar] [CrossRef]
  43. Yu, C.; de Jong, M.; Cheng, B. Getting depleted resource-based cities back on their feet again–the example of Yichun in China. J. Clean. Prod. 2016, 134, 42–50. [Google Scholar] [CrossRef] [Green Version]
  44. Yang, Y.; Guo, H.; Chen, L.; Liu, X.; Gu, M.; Ke, X. Regional analysis of the green development level differences in Chinese mineral resource-based cities. Resour. Policy 2019, 61, 261–272. [Google Scholar] [CrossRef]
  45. Chien, F.S.; Ajaz, T.; Andlib, Z.; Chau, K.Y.; Ahmad, P.M.; Sharif, A. The role of technology innovation, renewable energy and globalization in reducing environmental degradation in Pakistan: A step towards sustainable environment. Renew. Energy 2021, 177, 308–317. [Google Scholar] [CrossRef]
  46. Jiang, Z.; Lyu, P.; Ye, L.; Zhou, Y. Green innovation transformation, economic sustainability and energy consumption during China’s new normal stage. J. Clean. Prod. 2020, 27, 123044. [Google Scholar] [CrossRef]
  47. Yao, J.; Xu, P.; Huang, Z. Impact of urbanization on ecological efficiency in China: An empirical analysis based on provincial panel data. Ecol. Indic. 2021, 129, 107827. [Google Scholar] [CrossRef]
  48. Friedman, J.; Gerlowski, D.A.; Silberman, J. What attracts foreign multinational corporations? Evidence from branch plant location in the United States. J. Reg. Sci. 1992, 32, 403–418. [Google Scholar] [CrossRef]
  49. Chung, S.H. Environmental regulation and foreign direct investment: Evidence from South Korea. J. Dev. Econ. 2014, 108, 222–236. [Google Scholar] [CrossRef]
  50. Zheng, J.; Sheng, P. The impact of foreign direct investment (FDI) on the environment: Market perspectives and evidence from China. Economies 2017, 5, 8. [Google Scholar] [CrossRef] [Green Version]
  51. Kearsley, A.; Riddel, M. A further inquiry into the Pollution Haven Hypothesis and the Environmental Kuznets Curve. Ecol. Econ. 2010, 69, 905–919. [Google Scholar] [CrossRef]
  52. Yu, H.; Fotheringham, A.S.; Li, Z.; Oshan, T.; Kang, W.; Wolf, L.J. Inference in multiscale geographically weighted regression. Geogr Anal. 2020, 52, 87–106. [Google Scholar] [CrossRef]
  53. Liu, K.; Qiao, Y.; Zhou, Q. Analysis of China’s Industrial Green Development Efficiency and Driving Factors: Research Based on MGWR. Int. J. Environ. Res. Public Health 2021, 18, 22. [Google Scholar] [CrossRef]
  54. Holling, C.S. Resilience and stability of ecological systems. Annu. Rev. Ecol. Syst. 1973, 4, 1–23. [Google Scholar] [CrossRef] [Green Version]
  55. Zhang, Y.; Yang, Y.; Chen, Z.; Zhang, S. Multi-criteria assessment of the resilience of ecological function areas in China with a focus on ecological restoration. Ecol. Indic. 2020, 119, 106862. [Google Scholar] [CrossRef]
  56. Zhang, X.; Zheng, Y.; Zhang, M.; He, B.; Zou, H. Region city electrical network electric power sustainable development research based on state space law and ecology supporting capacity. In Proceedings of the International Conference on Energy, Environment and Sustainable Development, Shanghai, China, 21–23 October 2011. [Google Scholar]
  57. Tsou, J.; Gao, Y.; Zhang, Y.; Sun, G.; Ren, J.; Li, Y. Evaluating urban land carrying capacity based on the ecological sensitivity analysis: A case study in Hangzhou, China. Remote Sens. 2017, 9, 529. [Google Scholar] [CrossRef] [Green Version]
  58. Wang, J.; He, G. Climate change impacts on the topography and ecological environment of the wetlands in the middle reaches of the Yarlung Zangbo-Brahmaputra River. J. Hydrol. 2020, 590, 125419. [Google Scholar] [CrossRef]
  59. Wang, L.; Wang, Z.; Ma, Y. Heterogeneous environmental regulation and industrial structure upgrading: Evidence from China. Environ. Sci. Pollut. Res. 2021. [Google Scholar] [CrossRef] [PubMed]
  60. Feng, Y.; He, S.; Li, G. Interaction between urbanization and the eco-environment in the Pan-Third Pole region. Sci. Total Environ. 2021, 789, 148011. [Google Scholar] [CrossRef] [PubMed]
  61. Miao, C.; Duan, M.; Yang, Z.; Wu, X. Spatial heterogeneity and evolution trend of regional green innovation efficiency--an empirical study based on panel data of industrial enterprises in China’s provinces. Energy Policy 2021, 156, 112370. [Google Scholar] [CrossRef]
  62. Gyamfi, B.A. Consumption-based carbon emission and foreign direct investment in oil-producing Sub-Sahara African countries: The role of natural resources and urbanization. Environ. Sci. Pollut. Res. 2021. [Google Scholar] [CrossRef] [PubMed]
  63. Zhang, W.; Zhang, M.; Wu, S.; Liu, F. A complex path model for low-carbon sustainable development of enterprise based on system dynamics. J. Clean. Prod. 2021, 321, 128934. [Google Scholar] [CrossRef]
  64. Sun, H. Influence of Ecological Innovation on the Financial Performance of Strategic Emerging Industries. Rev. Cercet. Interv. Soc. 2019, 65, 354–369. [Google Scholar] [CrossRef]
  65. Liu, K.; Qiao, Y.; Zhou, Q. Spatiotemporal Heterogeneity and Driving Force Analysis of Innovation Output in the Yangtze River Economic Zone: The Perspective of Innovation Ecosystem. Complexity 2021, 2021, 8884058. [Google Scholar] [CrossRef]
  66. Yu, Y.; Zhang, N.; Kim, J. Impact of urbanization on energy demand: An empirical study of the Yangtze River Economic Belt in China. Energy Policy 2020, 139, 111354. [Google Scholar] [CrossRef]
  67. Wei, H.; Zhang, Y. Analysis of Impact of Urbanization on Environmental Quality in China. China World Econ. 2017, 25, 85–106. [Google Scholar] [CrossRef]
  68. Grossman, G.M.; Krueger, A.B. Economic growth and the environment. Q. J. Econ. 1995, 110, 353–377. [Google Scholar] [CrossRef] [Green Version]
Figure 1. Trend of Moran’ s I Index from 2010 to 2019.
Land 10 01313 g001
Figure 2. Distribution of the cold and hot spots of UECC in 286 cities in China during 2010–2019. (a) in 2010; (b) in 2013; (c) in 2019.
Land 10 01313 g002
Figure 3. Spatial distribution of the regression coefficient of administrative areas.
Land 10 01313 g003
Figure 4. Spatial distribution of regression coefficients of per capita water resources.
Land 10 01313 g004
Figure 5. Spatial distribution of regression coefficient of the industrial advancement index.
Land 10 01313 g005
Figure 6. Spatial distribution of economic density regression coefficients.
Land 10 01313 g006
Figure 7. Spatial distribution of regression coefficient of urbanization rate.
Land 10 01313 g007
Figure 8. Spatial distribution of regression coefficients of R&D internal expenditure.
Land 10 01313 g008
Figure 9. Spatial distribution of the FDI/GDP regression coefficients.
Land 10 01313 g009
Figure 10. Spatial distribution of regression coefficients of energy conservation and environmental protection expenditures.
Land 10 01313 g010
Table 1. UECC evaluation index system.
Target LayerRule LayerFactor LayerIndex Layer
Urban
Ecological
Carrying
Capacity
ecological resilienceClimatic conditionsAnnual precipitation
Annual average temperature
Sunshine hours
Hydrological conditionsSurface water resources
Groundwater resources
Land conditionsGreen area per capita
Land productivity
Ecological Support
Capacity
Environmental
protection
Comprehensive utilization rate of industrial solid waste
Harmless disposal rate of household garbage
Green coverage rate in urban built-up areas
Municipal sewage treatment rate
Social progressDoctors per 10,000 people
The number of students in colleges and universities per 10,000 persons
City road area at the end of the year
Internet users per 10,000 persons
The total number of books in public libraries per 10,000 people
Total postal services
Policy SupportUrban maintenance and construction fund expenditure
Education expenditure as a proportion of fiscal expenditure
Ecological PressureEnvironmental
disruption
Industrial sulfur dioxide emissions
Industrial wastewater discharged
Industrial smoke (dust) emissions
Population pressureThe population density
Natural population growth rate
Number of employees in the secondary industry
Number of registered unemployed persons in urban areas at the end of the year
Table 2. Evaluation index system of influencing factors of UECC.
Influencing FactorsIndicator NameUnit
Land endowment X1Administrative land areaKm2
Water supply X2Per capita water resourcesPerson/m3
Industrial structure X3Industry Advanced Index
Economic development X4Economic densityYuan/km2
Urbanization level X5Urbanization rate%
Technological innovation X6R&D internal expenditureTen thousand yuan
Foreign capital utilization X7FDI/GDP
Environmental governance X8Energy saving and environmental protection expenditure100 million yuan
Table 3. GWR and MGWR model index.
Model IndexesMGWRGWR
Goodness of fit R20.9290.927
Adjust R20.9060.898
AICc247.457288.108
Residual sum of squares20.21020.984
Table 4. Classical GWR and MGWR model bandwidths.
VariableMGWRGWR
Administrative area22765
Per capita water resource7765
Industry Advanced Index4365
Economic density8465
Urbanization rate10465
R&D internal expenditure4365
FDI/GDP4365
Energy saving and environmental protection expenditures23265
Table 5. Statistical description of MGWR coefficients.
VariableDefinitionMeanStandard DeviationMinMedianMax
tdbfLand endowment0.1970.102−0.0120.2050.331
szygjWater supply0.1260.130−0.0780.1060.405
cyjgIndustrial structure0.3480.301−0.0430.2561.124
jjfzEconomic development0.6330.3810.0840.7821.124
czhspUrbanization level0.2700.0850.1380.2730.435
jscxTechnological innovation0.5280.395−0.7420.4841.403
wzlyForeign capital utilization0.0360.101−0.4370.0110.294
hjzlEnvironmental governance0.1620.0440.1090.1540.228
Publisher’s Note: MDPI stays neutral with regard to jurisdictional claims in published maps and institutional affiliations.

