Article

Research on the Spatial Differences and Convergence Mechanism of Urban Land Use Efficiency under the Background of Regional Integration: A Case Study of the Yangtze River Economic Zone, China

1
Department of Engineering Management and Real Estate, College of City Construction, Jiangxi Normal University, Nanchang 330022, China
2
Institute of Real Estate, Jiangxi Normal University, Nanchang 330022, China
3
College of Public Administration, Huazhong Agricultural University, Wuhan 430070, China
4
School of Public Administration, Central China Normal University, Wuhan 430079, China
*
Author to whom correspondence should be addressed.
Land 2021, 10(10), 1100; https://doi.org/10.3390/land10101100
Submission received: 23 September 2021 / Revised: 10 October 2021 / Accepted: 13 October 2021 / Published: 17 October 2021

Abstract

:
Revealing the spatial differences and convergence mechanism of urban land use efficiency (ULUE) under the background of regional integration is of great significance for exploring the coordinated promotion path of ULUE. We attempted to build a theoretical framework to interpret ULUE spatial convergence under the background of regional integration and build a ULUE “green” evaluation system under multi-objective constraints. Based on this, we employed the super efficiency slack-based model (SBM), exploratory spatial data analysis, and spatial convergence model incorporated into the spatial weight matrix to re-examine the true level, spatial differences, and convergence mechanism of ULUE in the Yangtze River Economic Zone from 2003 to 2019 on a city scale. The results show that: (1) during the investigation period, ULUE in the Yangtze River Economic Zone has obvious spatial disequilibrium and spatial correlation characteristics; (2) there are absolute β-space convergence and conditional β-space convergence of ULUE in the whole Yangtze River Economic Zone and its upstream, midstream, and downstream areas; (3) driven by government management, industrial development, and spatial error effects, the convergence time of ULUE in the whole Yangtze River Economic Zone and its upstream, midstream, and downstream areas is obviously shortened.

1. Introduction

Urban land use efficiency (ULUE), as an objective reflection of the coupling level between the input system of urban production factors and the output system of urban land use, is the core indicator to measure land output capacity and regional development quality [1]. Regional integration will contribute to the free flow of various elements between cities and rational optimization of industrial structure within regions, which is an effective way to promote the green growth of urban land use efficiency [2,3,4,5]. Under the realistic background that regional integration has risen to a national strategy, we urgently need to re-examine ULUE and its spatio-temporal evolution characteristics. It is worth noting that China has a vast territory, unbalanced spatial development, different regional factor endowment structures, and great differences in industrial structure and land-use level among different regions. That will inevitably lead to certain differences in the spatial distribution of ULUE. Then, will the spatial differences of ULUE shrink with time and convergence? Is there a “catch-up effect” in backward areas? Does regional integration promote spatial convergence of ULUE? The research on the above issues has important theoretical value and practical significance for exploring scientific and reasonable ULUE collaborative improvement paths and enhancing regional sustainable development capacity.
At present, there are few studies on the relationship between regional integration and ULUE. The related research mainly focuses on the definition of the basic connotation of ULUE [6,7,8,9], the construction of index system [10,11], the innovation of research methods [12], the analysis of the spatio-temporal pattern [9,13], and the discussion of promotion path [14,15]. In the selection of ULUE indicators, there are mainly two representative categories: the first category is the ULUE single measurement indicator based on land economic density [14] and land development intensity [15] in economics; the second category is the ULUE comprehensive measurement framework from the perspective of the composite system, which mainly includes the expected output variables such as “economy + society + environment” [16], “scale + structure + agglomeration” [1], and “input + output” [15]. However, urban land has also become a non-negligible source of carbon and pollutants while utilizing and embodying its production, living, and ecological functions [16,17,18]. Based on understanding this objective fact, Yang [13] and Yue [19] incorporated the industrial “three wastes” emissions into the “input + expected output + unexpected output” indicator system. Li [20] incorporated energy carbon emissions into the evaluation system of land low-carbon utilization efficiency. Some scholars have also made beneficial explorations of land use patterns and evaluation systems from the perspectives of environment friendliness [18] and sustainable development [21]. In the ULUE measurement method, the DEA model that focuses on the expected output under the mode of “environment for growth” [19] and the SBM model that focuses on the resources and environmental costs in the process of sustainable development and its extended forms, such as the super efficiency SBM model, are widely used. Based on the ULUE calculation results, some scholars explore the influence of economic growth, industrial development, population mobility, and government regulation on the evolution of the ULUE basic pattern through the panel data regression model [22] and the Tobit analysis method [23]. The others use the research framework of “GIS visualization analysis + traditional convergence model” [24] to quantitatively depict the regional differences and convergence of ULUE at different scales.
To sum up, these research results provide literature support and method reference for us to explore the spatial differences and convergence mechanism of ULUE under the background of regional integration. However, there are also some shortcomings: Firstly, the existing studies mostly focus on the single constraint of ULUE such as “carbon emission” or “pollutant emission” and lack the exploration of spatial differences characteristics of ULUE under multi-objective constraints; secondly, few studies consider the role of geographic spatial effect in the process of ULUE spatial convergence, resulting in biased empirical results; finally, relevant studies mostly focus on the inter-provincial level of the whole country or the central region and cannot deeply analyze the ULUE spatial differences, so the guidance and demonstration significance are insufficient.
Based on this, we took 107 prefecture-level cities and above in the Yangtze River Economic Zone as the research object and analyzed the basic level and spatial differences characteristics of ULUE by adopting the super efficiency SBM model and exploratory spatial data analysis model on the basis of considering multi-objective constraints such as energy-saving, emissions reduction, and low carbon. After that, we employed the spatial convergence model considering the geographical spatial effect to explore the convergence mechanism of ULUE. The research results are intended to find out the real situation of ULUE in the Yangtze River Economic Zone and provide empirical support and policy enlightenment for exploring the coordinated development mode of urban land.

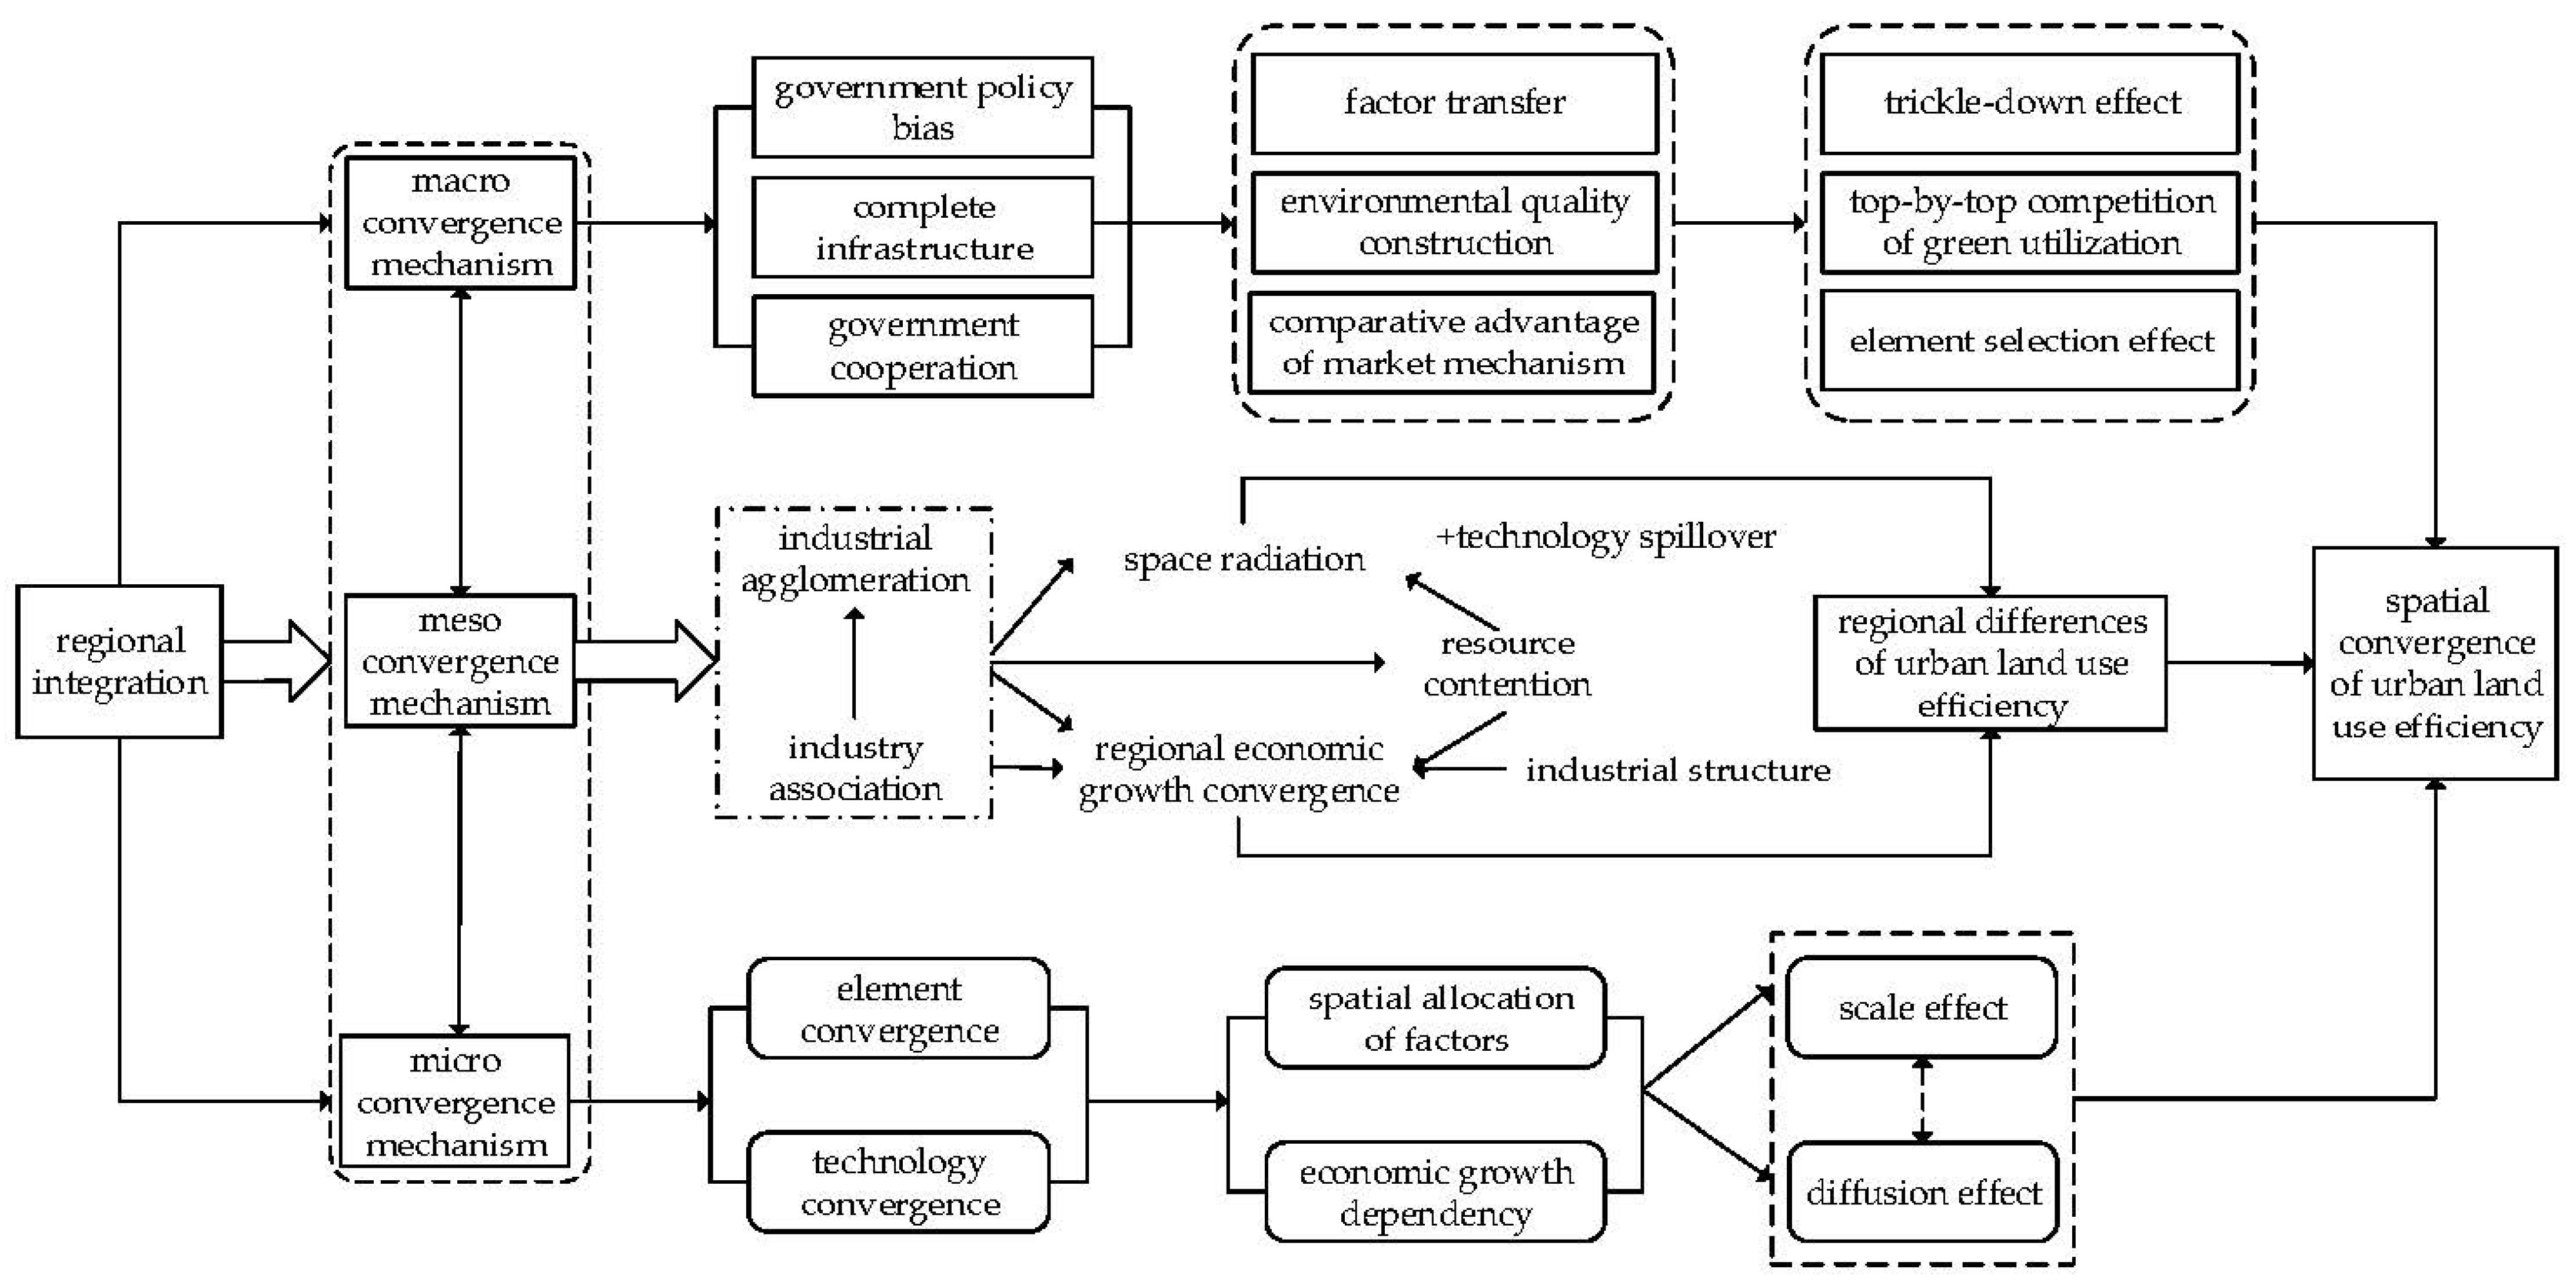
2. Theoretical Hypothesis: ULUE Space Converges under the Background of Regional Integration

Due to the unbalanced spatial distribution of initial resources, technical conditions, and factor structure, the ULUE high-value areas have a larger market scale than the low-value areas, and the former have a stronger economic foundation and green innovation ability and better spatial agglomeration environment. That will accelerate the inflow of production factors into more developed areas driven by comparative advantages and then form the “siphoning effect”, which will bring about the divergent growth of efficiency among regions [25]. However, due to the multi-directional flow of inter-regional elements and cross-regional transfer of industries, central cities will inevitably diffuse and radiate technical knowledge to marginal cities. With the further catalysis of the land price mechanism, the intensity of land green use in marginal cities will benefit from this spatial spillover and will “feedback” the further improvement of ULUE in central cities [1]. Especially under the background of regional integration, the strategy of urban economic growth in different spatial scales has gradually changed from mutual competition to horizontal cooperation. This government policy support, industrial structure upgrading, resource factor agglomeration, and production technology innovation brought by this change will directly or indirectly promote the spatial convergence of regional ULUE from the macro, meso, and micro levels (Figure 1).

2.1. Macro Convergence Mechanism

The convergence mechanism at the macro level is mainly the government behavior convergence mechanism. The regional integration strategy is launched based on government cooperation, with the aim of achieving the regional balance of economic production among different levels of cities in a specific region [26]. In the process of promoting regional integration, urban development policies, capital, and technical support policies that consider “balance” and “sufficiency” will further encourage high-quality production factors such as knowledge, technology, and innovation to gather in relatively backward regions [27,28]. The resulting trickle-down effect can strengthen the endogenous development ability of ULUE in backward regions and promote the convergence growth of ULUE in the region. More importantly, regional integration has brought about the transformation of regional cooperation mode and the further expansion of market demand. The government will manage and intervene in land production activities through a series of measures such as establishing a trading market for pollution emission rights and carrying out joint prevention and control of pollution to form external emission reduction incentives and jointly improve the level of urban land utilization. At the same time, to enhance the high-quality growth potential of the overall regional economy, the government will increase financial investment in public infrastructure construction in urban fringe areas, which will lead to “top-by-top competition” in urban land green utilization [6,29]. On the other hand, under the background of regional integration, the coordination and integration of inter-regional governmental administrative powers is conducive to the functioning of the market mechanism [30,31]. That is, while strengthening the survival of the fittest of production factors, it weakens the “polarization effect” of the development of central cities, thereby reducing the regional differences of ULUE [22].

2.2. Meso Convergence Mechanism

The convergence mechanism at the meso level is the convergence mechanism of the industrial structure. With the deepening of regional integration, various industrial subjects between central and marginal cities in a given region carry out extensive linkage in terms of scale, division of labor, layout, and structure to form a rationalized “industrial community” [30]. In this process, ULUE will change significantly. For one thing, the rational evolution of industrial structure strengthens the regional distribution of production resources and economic commodities according to comparative advantages, thus improving the overall regional labor productivity and energy use efficiency [31], which contributes to the synergistic increase of land use output among cities. Simultaneously, in the development process of industrial structure from rationalization to upgrading, the economic service industry will stand out under the effect of market selection [32,33]. It can not only directly stimulate the competition and R & D learning within the industrial community to improve the quantity ratio of green production factors in land production but also indirectly promote the participation of green production factors in spatial circulation in a wider range and ultimately promote the common improvement of ULUE in the region. For another, the industrial community will have a spatial radiation effect on the adjacent marginal areas. Coupled with the spatial spillover of the industry’s own technical knowledge, the overlap and integration of the two effects will weaken the regional difference of ULUE to a certain extent. Under the influence of these effects, regional integration can better give play to the interaction between industrial structure changes, industrial agglomeration, and convergence of regional economic development. With the gradual convergence of regional economic development structure, the correlation and synergy of industrial structure among different cities have been highlighted year by year, and finally, the spatial convergence of ULUE will be realized [6,34].

2.3. Micro Convergence Mechanism

The micro-level convergence mechanism includes the factor convergence mechanism and the technology convergence mechanism. In the process of regional integration, comprehensive, diversified, and high-level production demand will accelerate the cross-regional flow of clean production factors, broaden the allocation scope of production factors, and improve their spatial allocation efficiency [26,35]. In this process, green capital and factors in developed areas flow into primary industries in underdeveloped areas, further stimulating the continuous expansion of land in backward cities to increase the scale effect of land green use and weaken the regional differences of ULUE. In addition, the research and development of energy-saving and emission-reduction technologies and forward-looking industrial green technologies, which are developed due to the demand of high-quality economic growth, will produce the competitive and related effect in an open market environment. That will be conducive to providing new growth impetus for the green development of urban land and promoting the coordinated improvement of green total factor productivity of urban land [6,33]. At the same time, with the in-depth implementation of the regional coordinated development strategy, the dependence of regional economic growth has gradually increased. It is easier for backward cities to obtain technology spillovers from developed regions at low cost through human capital flow and management experience exchange, thus speeding up the process of learning advanced green production technology and management mode and further reducing the regional differences of ULUE.

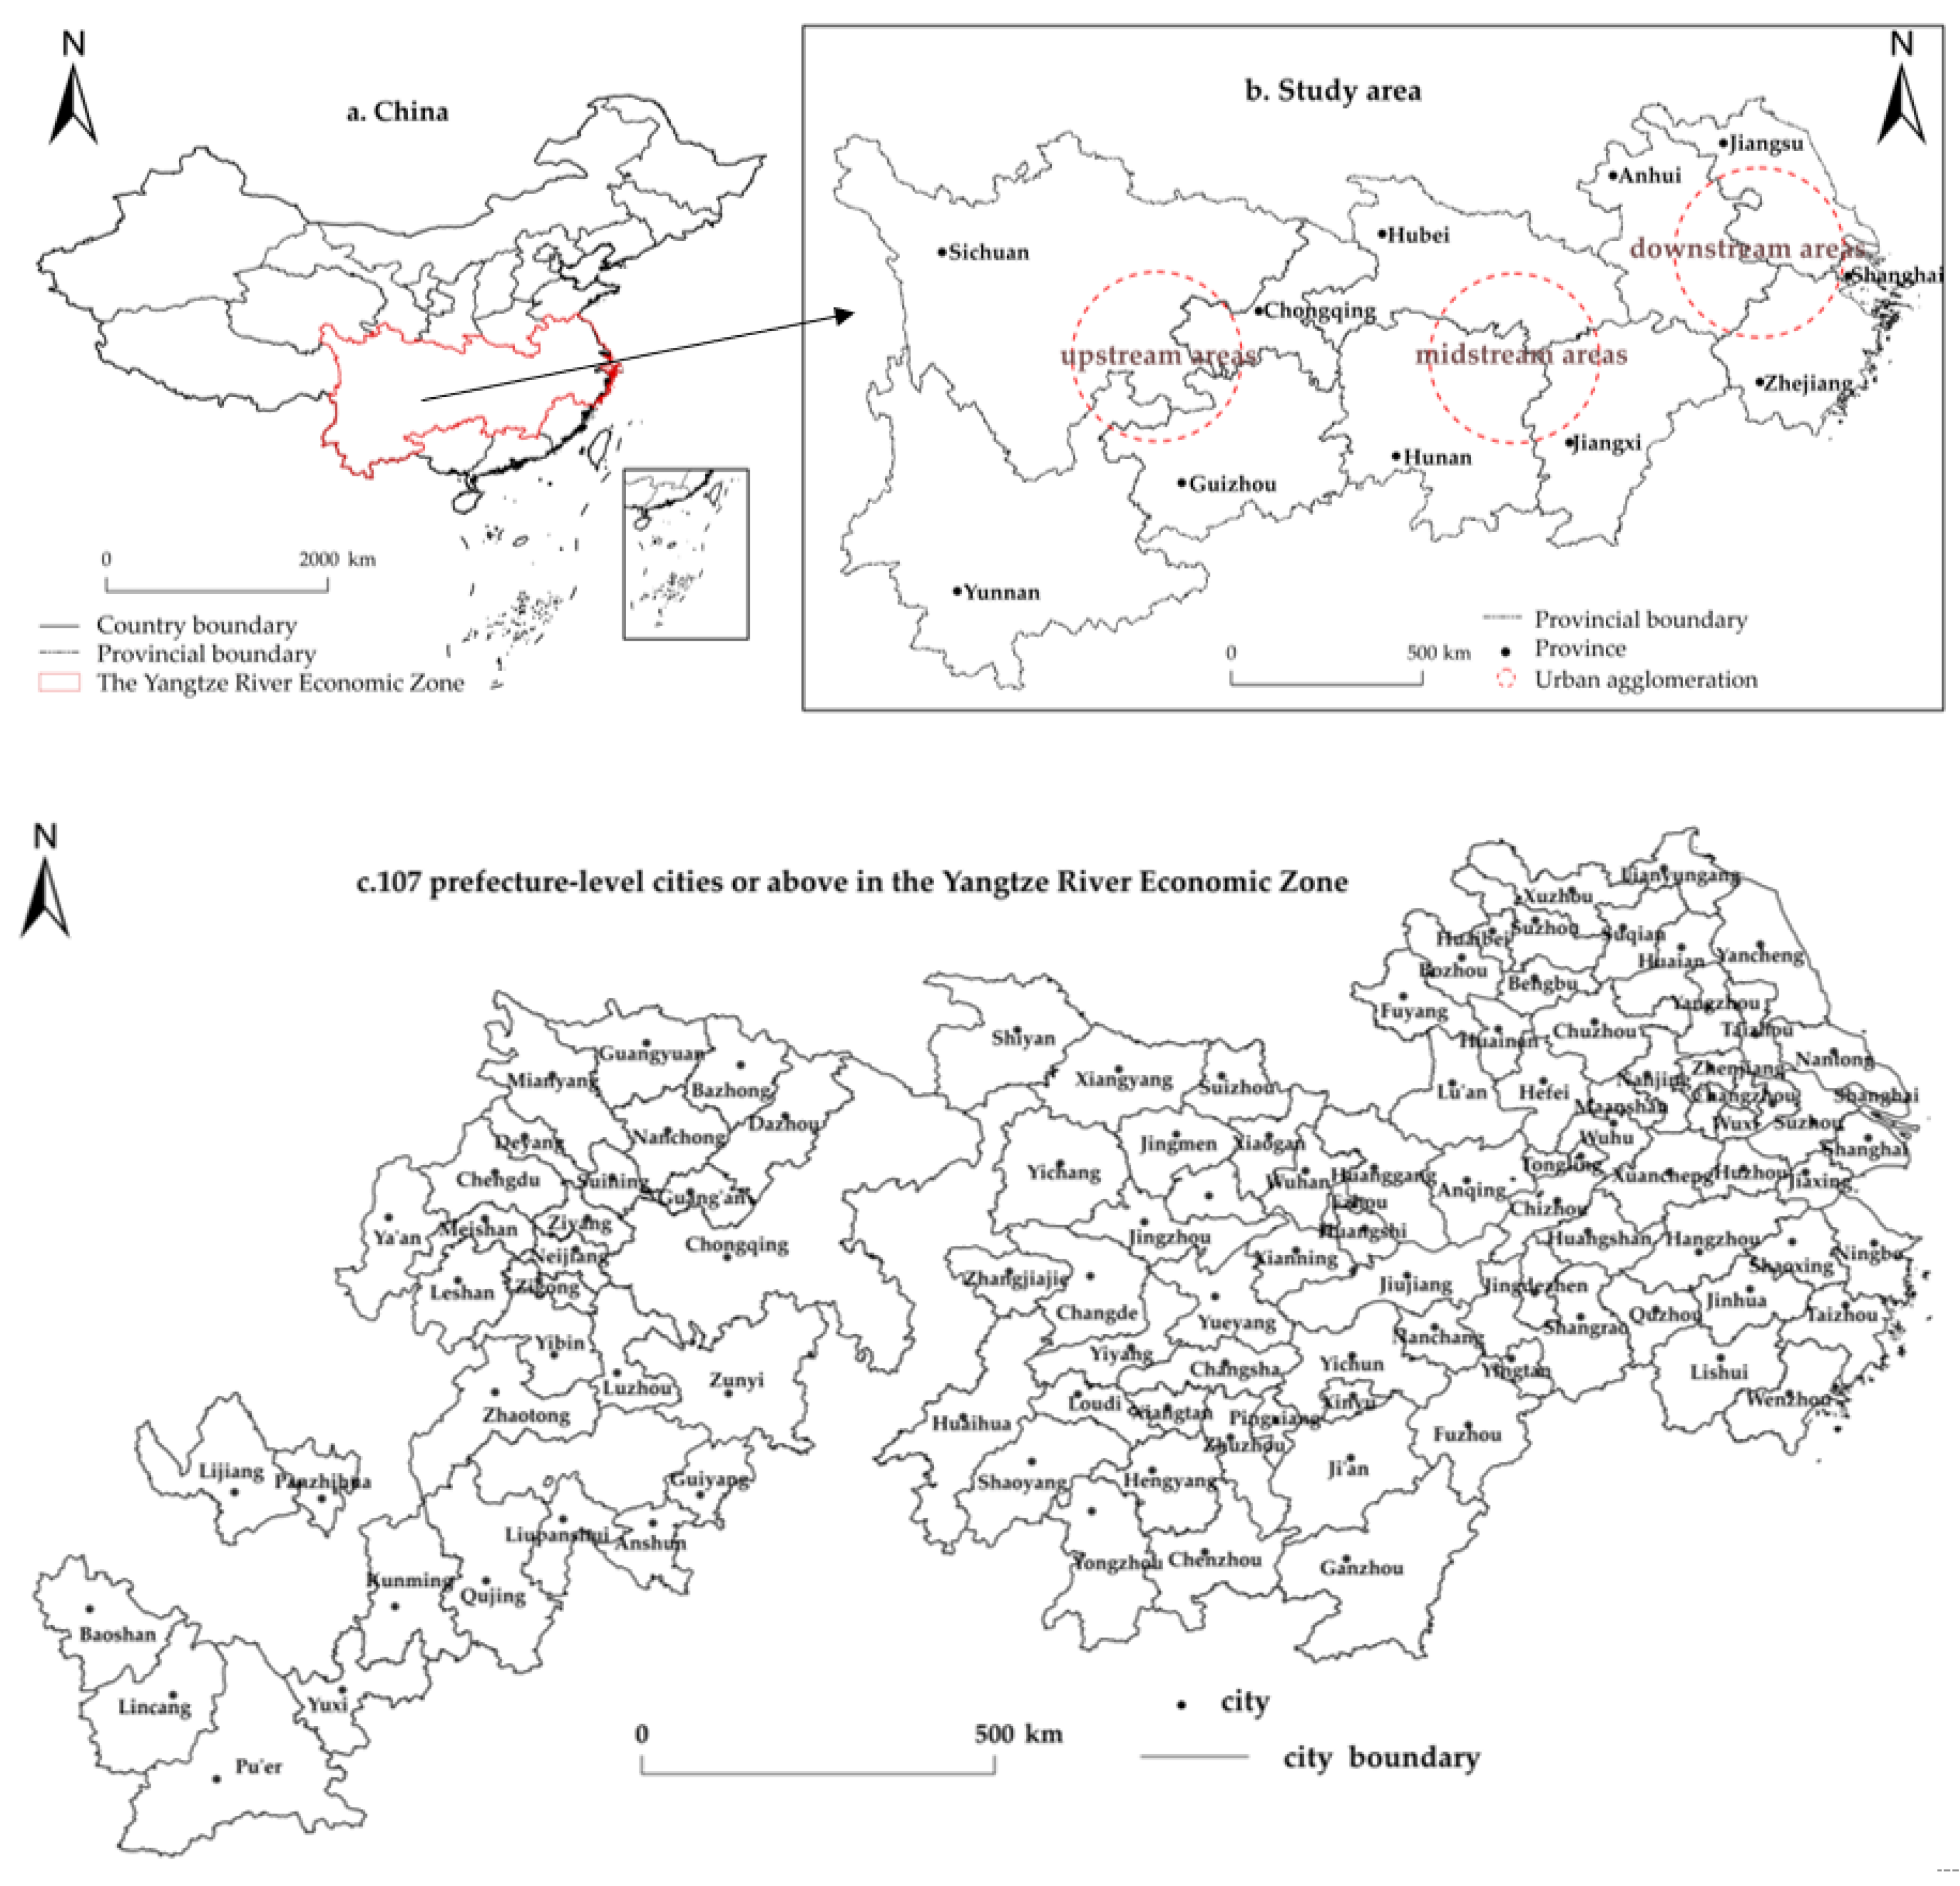
3. Study Area Overview

With the upstream, midstream, and downstream areas of the Yangtze River as a link, the Yangtze River Economic Zone runs through two municipalities, Shanghai and Chongqing, as well as nine provinces, Jiangsu, Zhejiang, Anhui, Jiangxi, Hubei, Hunan, Sichuan, Guizhou, and Yunnan (Figure 2). With one of the most active economic developments, the highest degree of openness, and the strongest innovation capabilities in China, it is a strategic region for regional integration development. In 2019, the Yangtze River Economic Zone gathered 42.9% of China’s population and created 44.1% of the country’s GDP. However, with the continuous improvement of urban land use, problems such as rising labor costs, tightening of resource and environmental constraints, and insufficient regional development momentum have become increasingly prominent in the Yangtze River Economic Zone [36,37]. Additionally, the Yangtze River Economic Zone spans the eastern, central, and western parts of China, and there are significant differences in economic conditions, resource endowments, industrial structure, and policy support among regions. All of these have brought severe challenges to the coordinated improvement of land green use efficiency in the Yangtze River Economic Zone. Under such realistic conditions, how to adapt to the process of regional integration and realize the coordinated improvement of land-use level in the region is extremely urgent.

4. Model Setting and Variable Description

4.1. Model Setting

4.1.1. The Super Efficiency SBM Model

The Super Efficiency SBM (slack-based model) is a data envelopment analysis method proposed by Tone [38], which includes slack variables and undesired output [39]. Compared with the traditional data envelopment method, this model can not only solve the problem of input–output slack but also solve the problem of efficiency analysis in the presence of undesired output. Therefore, it is widely used in the measurement of urban environmental efficiency [40], ULUE [41], and industrial green development efficiency [42]. Considering the loss of resource environment and ecological efficiency in urban land use, we adopted the super efficiency SBM model based on unexpected output to measure the ULUE level of cities in the Yangtze River Economic Zone. The basic model is formulated as follows:
min ρ = 1 m i = 1 m ( x ¯ / x i k ) 1 r 1 + r 2 ( s = 1 r 1 y d ¯ / y s k d + q = 1 r 2 y u ¯ / y q k u
{ x ¯ j = 1 , k n x i j λ j i = 1 , 2 , m y d j = 1 , k n y s j d λ j ¯ s = 1 , 2 , r 1 y d j = 1 , k n y q j u λ j ¯ q = 1 , 2 , r 2 λ j 0 j = 1 , 2 n x ¯ x k k = 1 , 2 m y d y d k ¯ q = 1 , 2 , r 1 y u y k u ¯ u = 1 , 2 , r 2 }
In Equations (1) and (2), n represents the number of decision-making units; m , r 1 , and r 2 , respectively, represent the input, expected outputs, and undesired outputs of the decision-making unit; x , y d , and y u are the number of elements in the corresponding input matrix, expected matrix, and undesired matrix; ρ is the ULUE value.

4.1.2. Exploratory Spatial Data Analysis

Exploratory spatial data analysis (ESDA) is a scientific method to measure the correlation degree of research data with spatial dependence or heterogeneity and interpret its spatial action mechanism [16]. The commonly used ESDA mainly includes global spatial autocorrelation analysis and local spatial autocorrelation analysis [43]. Global spatial autocorrelation analysis can be used to explore the overall spatial correlation degree and difference characteristics of ULUE. It is commonly expressed by Global Moran’s I statistic, and the formula is as follows:
M o r a n s   I     Global = i = 1 n j i n w i j ( x i x ¯ ) ( x j x ¯ ) σ 2 i = 1 n j i n w i j = i = 1 n j i n w i j ( x i 1 n i = 1 n x i ) ( x j 1 n i = 1 n x i ) 1 n i = 1 n ( x i 1 n i = 1 n x i ) 2 i = 1 n j i n w i j
In Equation (3), x i and x j represent the ULUE observed values of space geographical units i and j , respectively, and i j ; w i j represents the weight matrix of geographical adjacent space; If i and j are adjacent to each other, then w i j = 1 , otherwise w i j = 0 ; x ¯ represents the average value of ULUE; σ 2 represents the variance of ULUE; ( x i x ¯ ) ( x j x ¯ ) represents the similarity of ULUE between space geographical units i and j ; n represents the number of space geographical units.
Local spatial autocorrelation analysis is to further explain the spatial non-stationary and heterogeneous characteristics of regional local unit ULUE, which is often expressed by Local Moran’s I statistic. Based on calculating local Moran’s I of ULUE, we drew the Moran scatter diagram and LISA aggregation diagram to explore the local association mechanism of ULUE under the background of regional integration. The formula is as follows:
M o r a n s   I     Local = n ( x i x ¯ ) j = i n w i j ( x j x ¯ ) i = 1 n ( x i x ¯ ) 2

4.1.3. Spatial Convergence Model

The traditional convergence models include absolute β-convergence and conditional β-convergence [44]. Absolute β-convergence can be reflected in a relatively homogeneous economy, and the growth rate of the comprehensive development level of ULUE is negatively correlated with the initial level. In other words, ULUE low-value areas have a faster growth rate than high-value areas, which makes backward areas catch up with developed areas, thus making it possible to narrow the regional gap. Conditional β-convergence is to consider the influence of external factors based on absolute β-convergence, which can avoid missing explanatory variables and enhance the ability to explain regional differences in specific geographical phenomena. The existence of conditional β-convergence means that the ULUE in each region will converge to its own steady-state level.
It is worth noting that if the spatial correlation of ULUE is determined, we need to build a spatial β-convergence model incorporating into the spatial weight matrix. It mainly includes the spatial error model (SEM) and spatial lag model (SLM). The corresponding model is constructed as follows:
ln ( U L U E i t + T U L U E i t ) = α + β ln ( U L U E i t ) + ρ W ln ( U L U E i t + T U L U E i t ) + ε i t ln ( U L U E i t + T U L U E i t ) = α + β ln ( U L U E i t ) + ρ W ln ( U L U E i t + T U L U E i t ) + γ X i t + ε i t
ln ( U L U E i t + T U L U E i t ) = α + β ln ( U L U E i t ) + ( 1 - λ W ) 1 μ i t ln ( U L U E i t + T U L U E i t ) = α + β ln ( U L U E i t ) + γ X i t + ( 1 - λ W ) 1 μ i t
Equation (5) is the SEM model of absolute β-convergence and conditional β-convergence; Equation (6) is the SLM model of absolute β-convergence and conditional β-convergence; ρ is the coefficient of the spatial lag term; W is the spatial weight matrix; λ is the coefficient of spatial error term; β is the convergence coefficient; ε i t and μ i , t are both random errors. β < 0 indicates that there is β-convergence; otherwise, there is no β-convergence. Meanwhile, according to β value, the convergence rate s and half-life cycle τ can be obtained. The formula is as follows:
s = ln ( 1 | β | ) T , τ = ln ( 2 ) s

4.2. Variable Description

4.2.1. Explained Variable: Urban Land Use Efficiency (ULUE)

ULUE under the background of regional integration is essentially a kind of green land use efficiency. That is, under the concept of green development, it is an important indicator to measure the adaptation intensity and degree of land use input and output under multiple objectives such as the optimization of resource use scale, the minimization of environmental pressure, and the coordinated improvement of social, economic, and ecological output [6,11]. Different from the previous concept that only one problem of economy and environment was solved in urban land use, it emphasizes the ability and potential of urban land use to achieve the optimal level under the triple constraints of energy saving, emission reduction, and low carbon. Based on calculating the allocation scale of land, manpower, capital, and other factors as well as the benefits of socio-economic and ecological output, ULUE needs to further consider the dynamic impact of green and sustainable development on urban land use. Therefore, it is necessary to include unexpected indicators such as energy consumption, environmental pollution, and “carbon emissions” at the same time.
In the selection of ULUE indicators, we referred to measurement ideas of the ULUE by scholars such as Liang [6], Lu [7], and Wang [12]. They construct the evaluation system from the perspective of input index and production place index (expected output and unexpected output), select input index mainly from the dimension of production factors and energy, screen expected index from the angle of social economic ecological impact, and consider expected output from the angle of industrial waste. (1) In addition to considering the quantity of land, capital, and labor factor inputs, the input indicators also try to consider the dynamic changes in energy input scale over time. We selected the built-up areas, fixed asset investment per land, tertiary industry employees per land, and electricity consumption per unit of GDP to characterize it; (2) the expected output indicators mainly consider the development of economic, social, and green ecological brought about by urban land use. To a certain extent, the total GDP can be used to characterize the economic output level of the land. To enhance the comparability of the data, with 2003 as the base period, we used the regional GDP index to convert the nominal GDP into comparable real GDP. The social development index can reflect the level of regional social development and the improvement of people’s livelihood. We used the entropy weight method to calculate the social development index by selecting the population growth rate, the proportion of the population with a college degree or above in the total population, and the number of hospital beds per 10,000 people. Expanding the green areas of built-up areas is an eco-environment-friendly urban land use method. We selected the coverage rate of green area in built-up areas as the measure index of the ecological quality of urban land use; (3) on the specific selection of undesired outputs indicators, we adopted the entropy weight method to synthesize industrial wastewater, solid waste, and industrial SO2 into a comprehensive pollutant emission index. At the same time, considering emission of CO2 from urban land use, energy carbon emissions indicators were added to the undesired outputs, including the carbon emissions produced by the consumption of raw coal, coke, gasoline, kerosene, diesel, fuel oil, liquefied petroleum gas, natural gas, cleaned coal, other coal washing, and coke oven gas. The calculation method referred to the IPCC accounting framework [45].

4.2.2. Control Variables

Based on the previous theoretical discussion on the macro, meso, and micro multiple mechanisms of ULUE spatial convergence and research on the influencing factors of ULUE [9,11,34], the following variables were mainly included to investigate the conditional β-convergence trend and dynamic mechanism of ULUE. (1) At the macro level, we mainly selected the degree of government intervention Govern (the proportion of local fiscal expenditure in GDP) and the level of infrastructure investment Infrastructure (the proportion of public infrastructure fiscal investment in GDP); (2) At the meso level, we mainly considered the upgrading of industry structure Upgrade (the ratio of the output value of the tertiary industry to the output value of the secondary industry) and the rationalization of the industrial structure Rational (measured by Theil index); (3) At the micro-level, we mainly considered the level of technological innovation Technology (the proportion of R&D investment in GDP).

4.2.3. Variable Statistics

The descriptive statistics of the variables involved in this paper are shown in Table 1.

4.3. Data Source

Considering that the spatial measurement part requires the geographical and spatial continuity of the sample, Zhoushan City in Zhejiang Province was not included in the research scope as an island. In addition, the original Chaohu City was revoked and placed under the administration of Hefei City in 2011. Therefore, we selected 107 prefecture-level cities or above in the Yangtze River Economic Zone as research samples. Among them, there were 31 cities in the upstream areas, 36 cities in the midstream areas, and 40 cities in the downstream areas. Socio-economic data were retrieved from the China City Statistical Yearbook and the provincial statistical yearbooks from 2004 to 2020, and a few missing values were supplemented by the linear interpolation.

5. Empirical Analysis

5.1. Spatio-Temporal Evolution of ULUE under the Background of Regional Integration

Based on the basic principle of the super efficiency SBM model, we used the MaxDEA6.4 software to calculate the ULUE of 107 cities along the Yangtze River Economic Zone from 2003 to 2019 and analyzed the time series evolution and spatial pattern of ULUE.

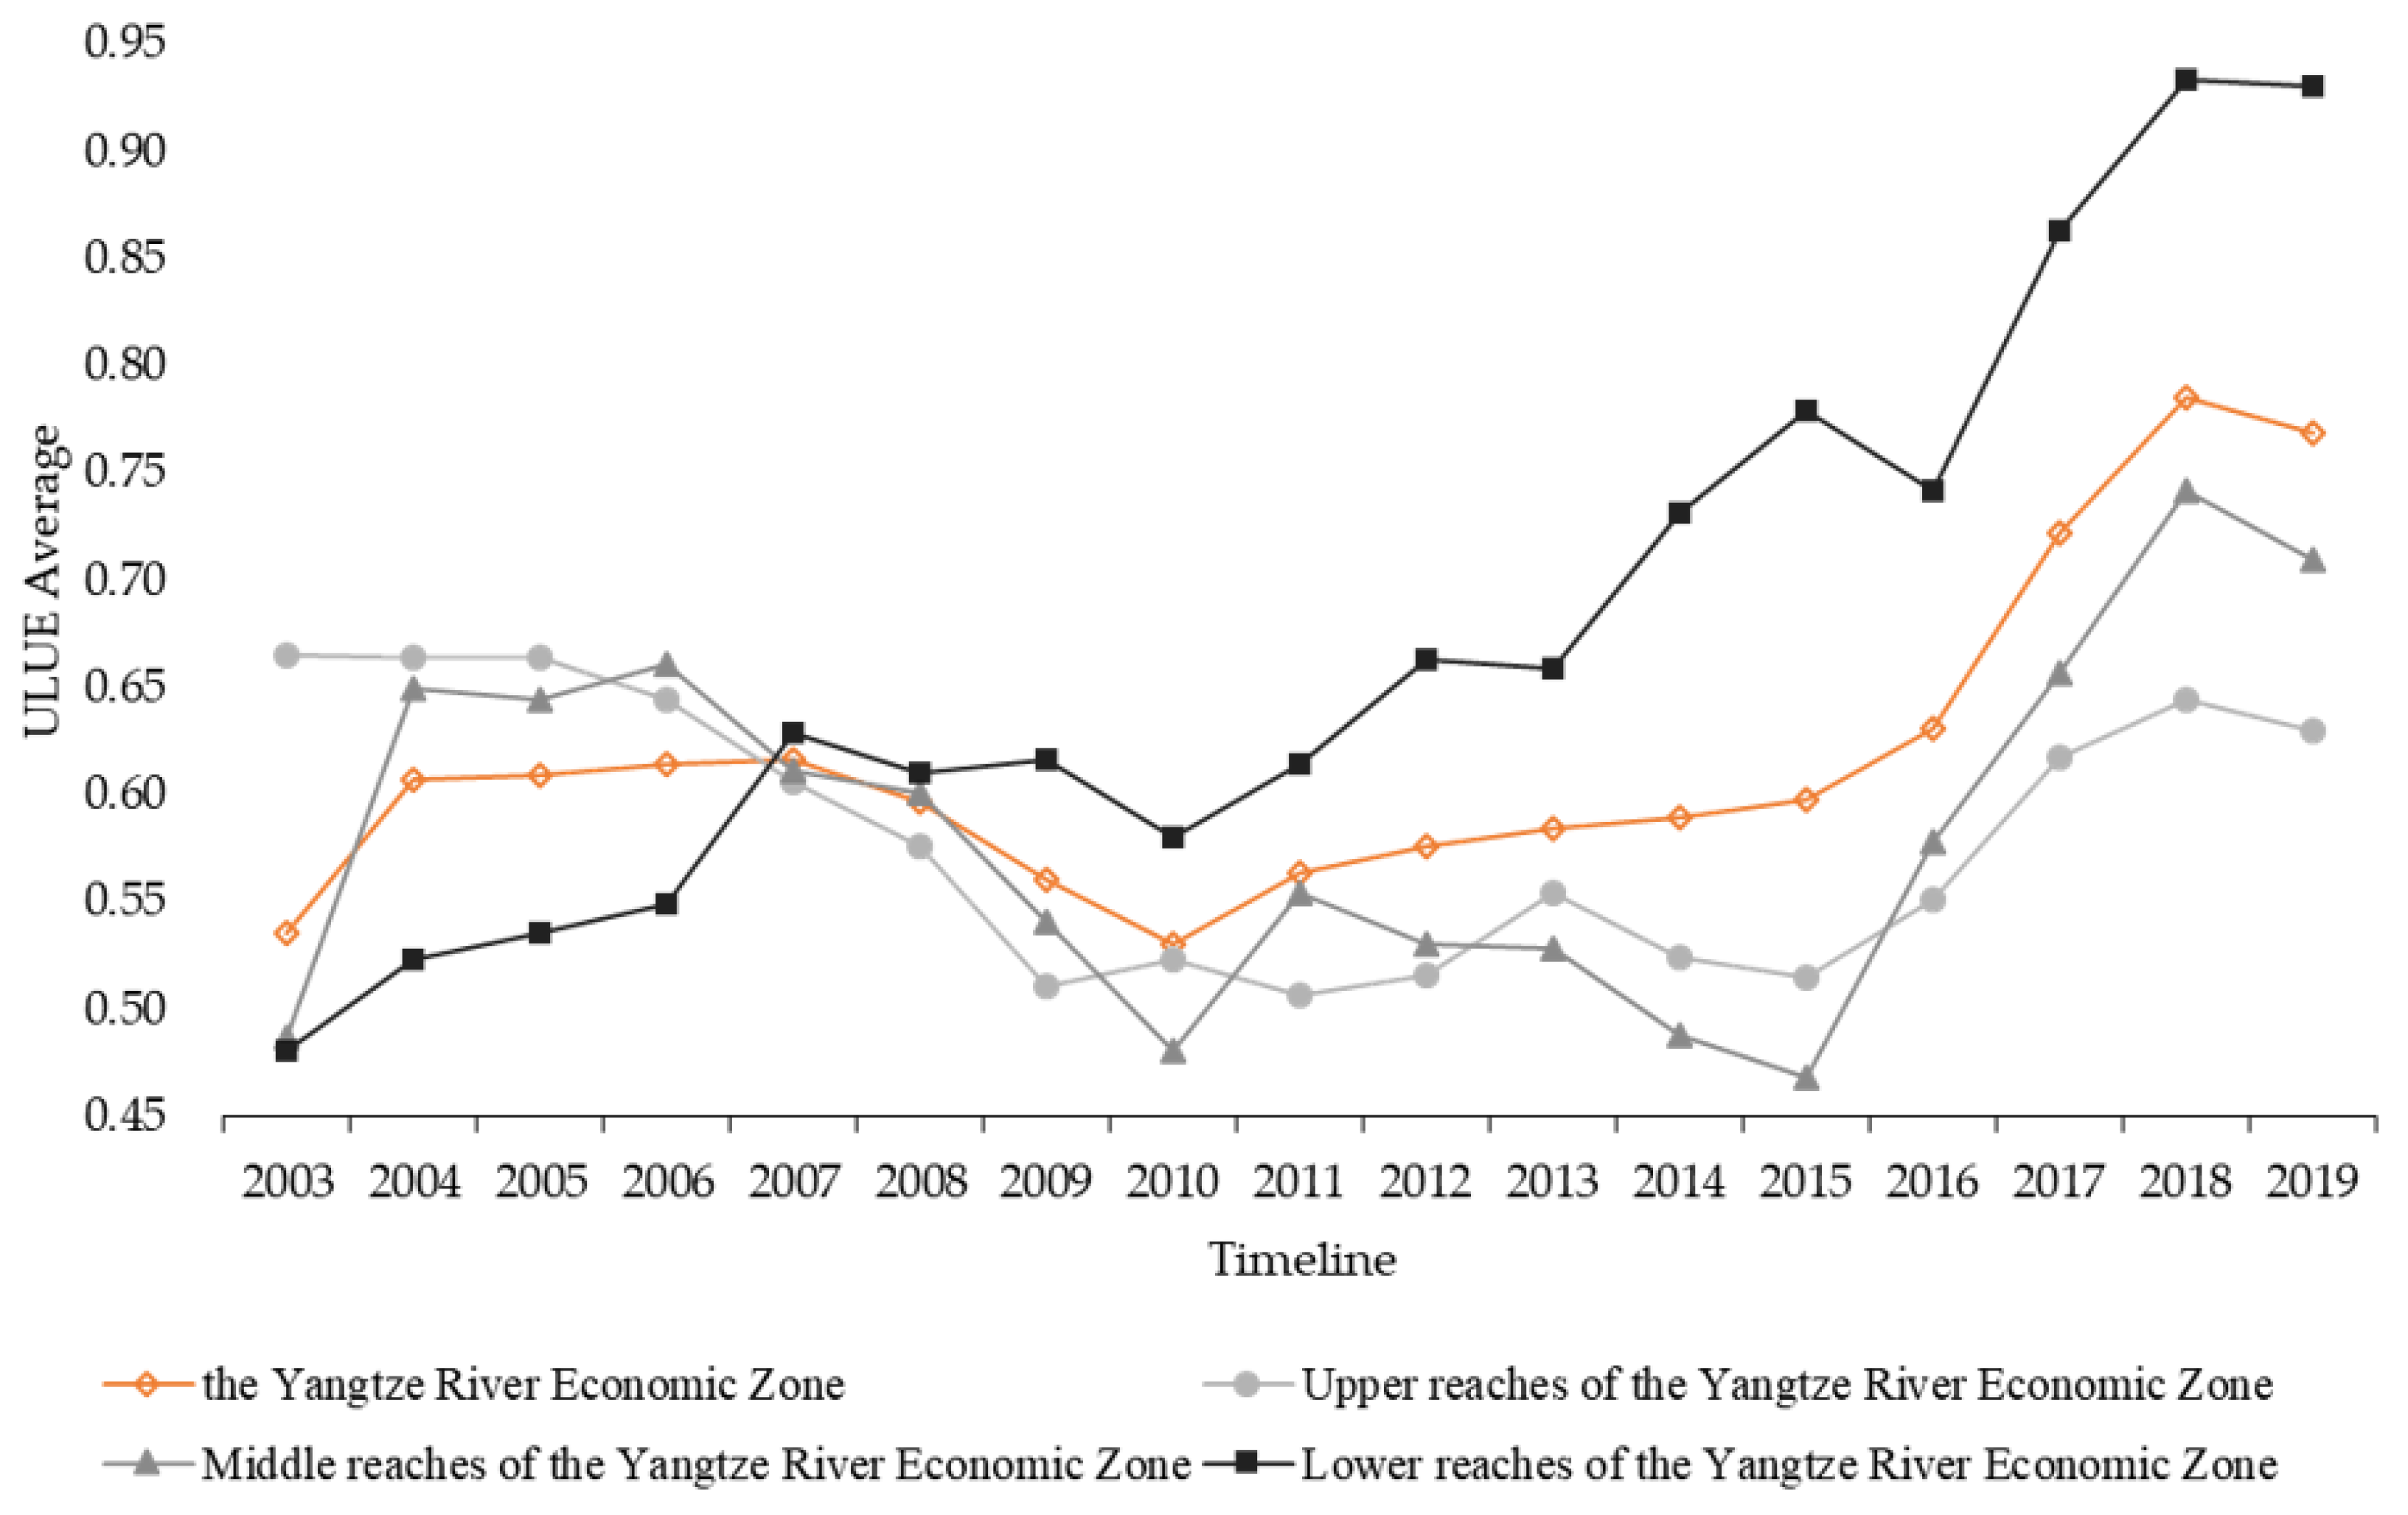
5.1.1. Timing Series Evolution

Figure 3 showed the time series change trend of ULUE in the Yangtze River Economic Zone. On the whole, the mean value of ULUE in the Yangtze River Economic Zone fluctuated and increased during the inspection period. The efficiency index increased from 0.5360 in 2003 to 0.7692 in 2019, with an average annual growth of 2.72%. First of all, the improvement of ULUE benefits from the favorable promotion of regional coordinated development strategy (proposed in 2003) and the continuous improvement of the regional green development planning system; moreover, it also benefits from the fact that governments at all levels gradually realized the important position of green development in the process of land use. For example, Hubei Province laid out scientific and rational land green production space, living space, and ecological space through land consolidation and improved the accountability system for ecological environmental protection of land use and the compensation system for environmental damage so that the whole province could share the dividends of land green use. Regionally, ULUE in the midstream and downstream areas of the Yangtze River Economic Zone showed different degrees of growth, from 0.4867 and 0.4803 in the initial stage to 0.7100 and 0.9301 in the final late stage, with average annual growth rates of 2.87% and 5.85%, respectively. In contrast, due to the relatively loose environmental regulations during the implementation of the “Western Development” policy, some industries with high energy consumption and high pollution are growing too fast, which leads to the loss of ecological and environmental effects of urban land use in the upstream areas of the Yangtze River Economic Zone. This result is like the research result of Tan et al. (2021) on the urban land use green efficiency. As a result, the ULUE average value in the upstream areas of the Yangtze River Economic Zone reduced from 0.6651 at the beginning to 0.6303 at the end.

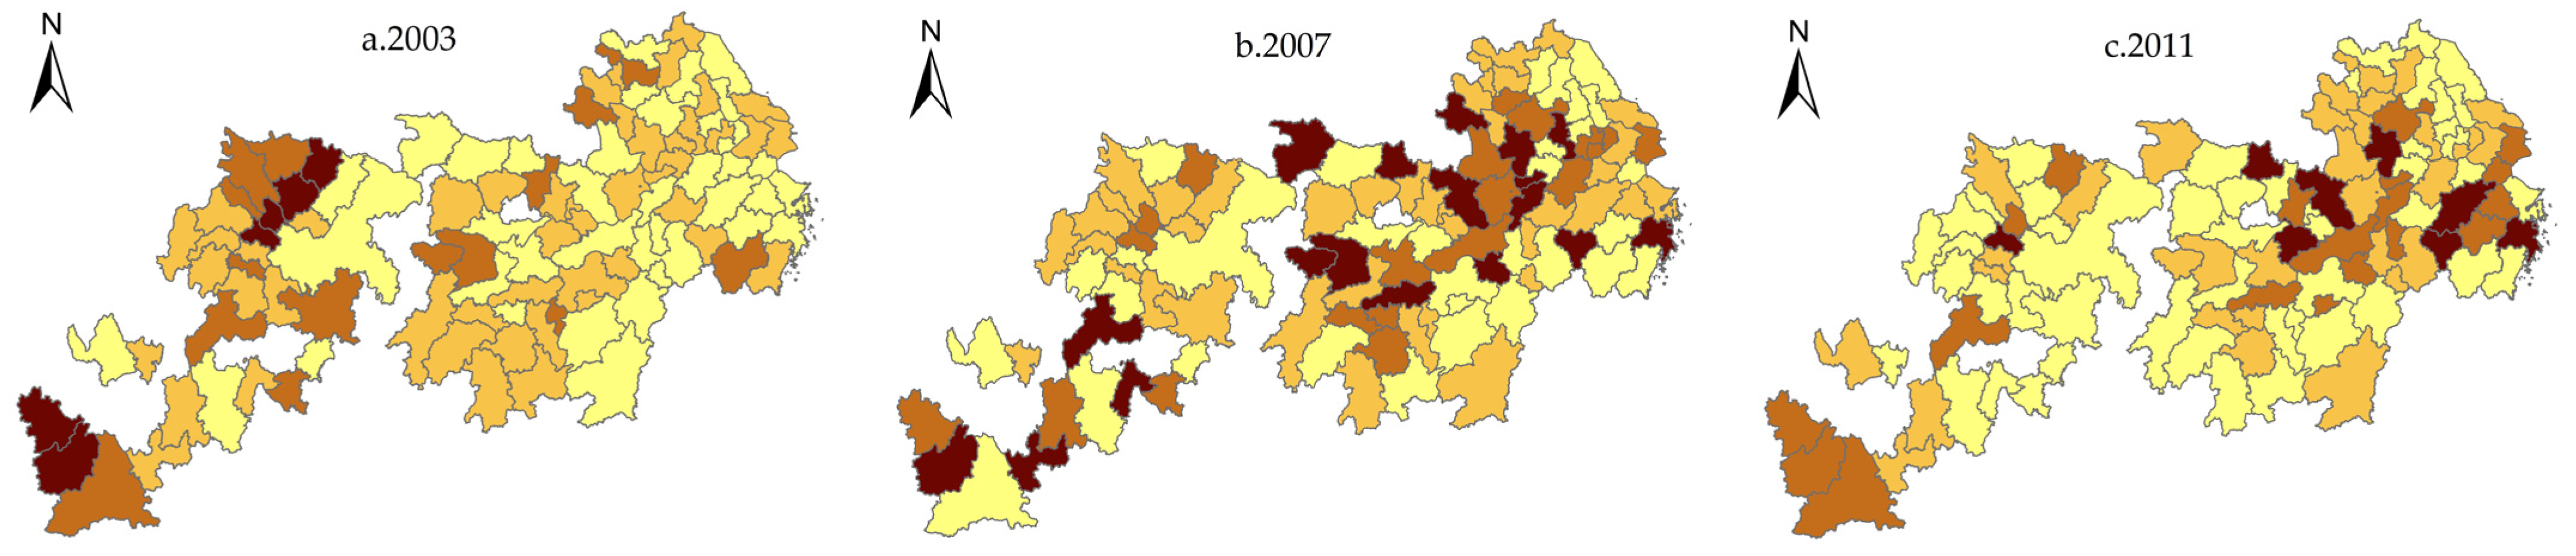
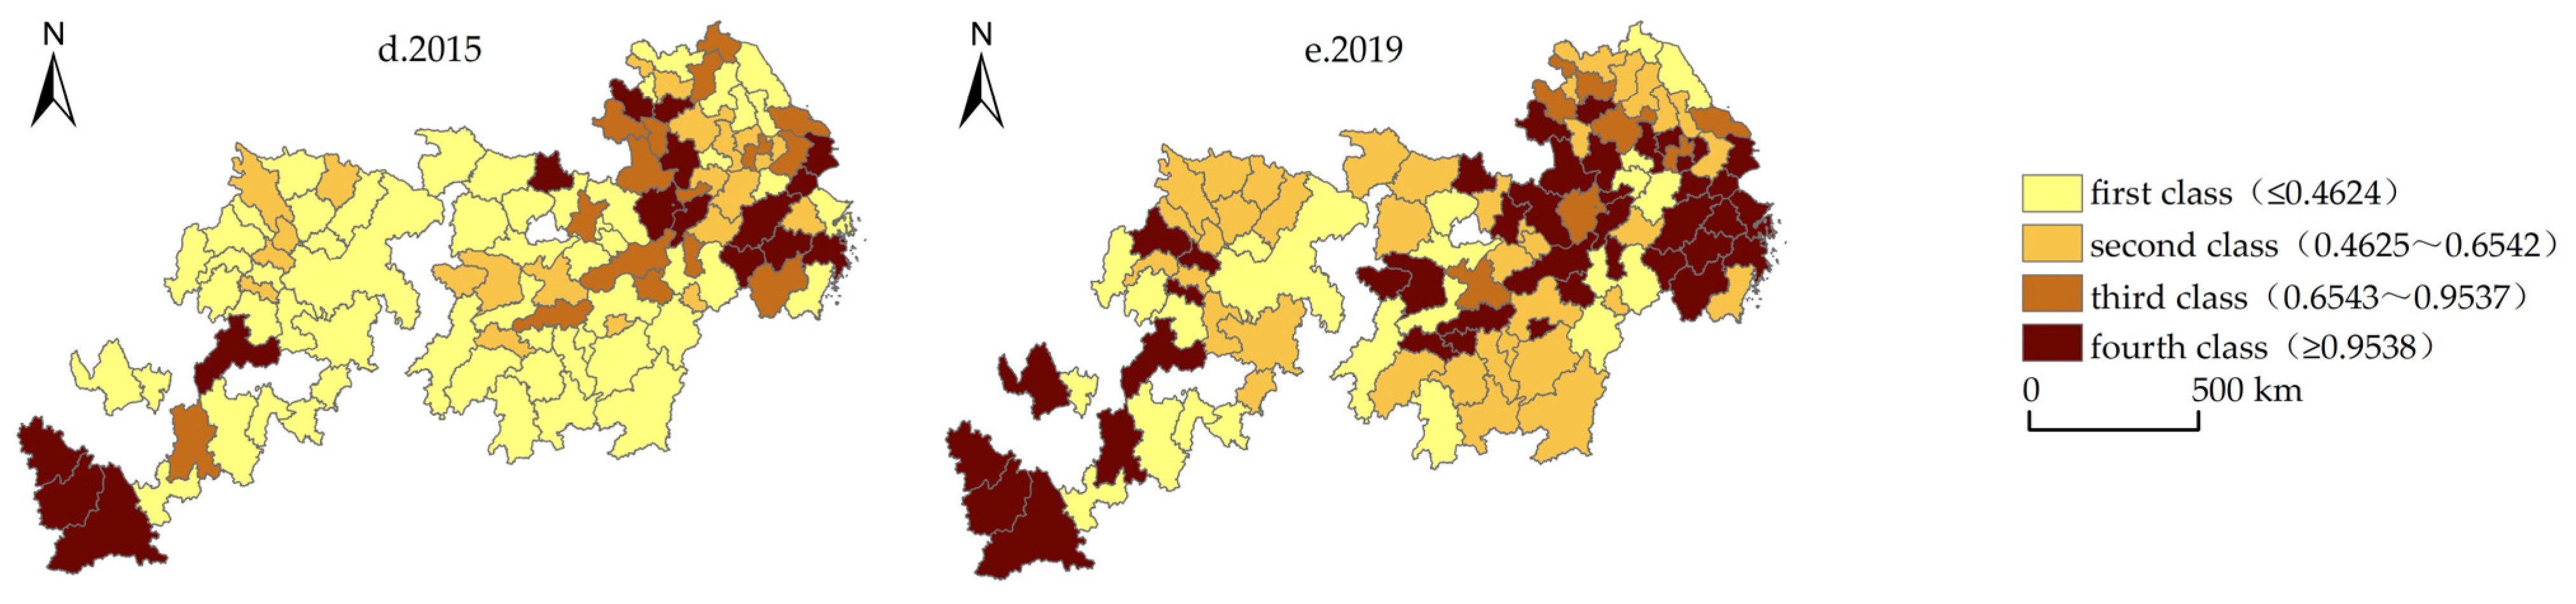
5.1.2. Spatial Pattern

We used Arcgis10.2 software to show the spatial pattern of ULUE in the Yangtze River Economic Zone (Figure 4). The level of ULUE in the Yangtze River Economic Zone has evolved from a low-level balanced pattern to a high-level balanced pattern from 2003 to 2019, and the spatial convergence has become increasingly prominent. Specifically, in 2003, ULUE high-value areas were concentrated in the upstream cities, and two high-value areas including Suining City, Nanchong City, Bazhong City, Ya ‘an City, Yuxi City, and lincang City were formed. ULUE low-level types are mainly distributed in the midstream and downstream provinces, forming a banded distribution pattern. Over time, the spatial pattern of ULUE has changed significantly, with the low-value areas decreasing sharply and showing scattered distribution characteristics, while the high-value areas are concentrated in Jiangsu, Shanghai, Zhejiang, and other regions, and the agglomeration effect is gradually strengthened. In 2019, the Yangtze River Economic Zone initially formed ULUE high-value agglomeration areas with the Yangtze River Delta urban agglomeration, Wuhan urban agglomeration, and Yunnan Province as the main areas. To verify the above spatial relationship, we used the exploratory spatial data analysis model to further analyze the spatial correlation of ULUE in the Yangtze River Economic Zone.

5.2. Spatial Differences of ULUE

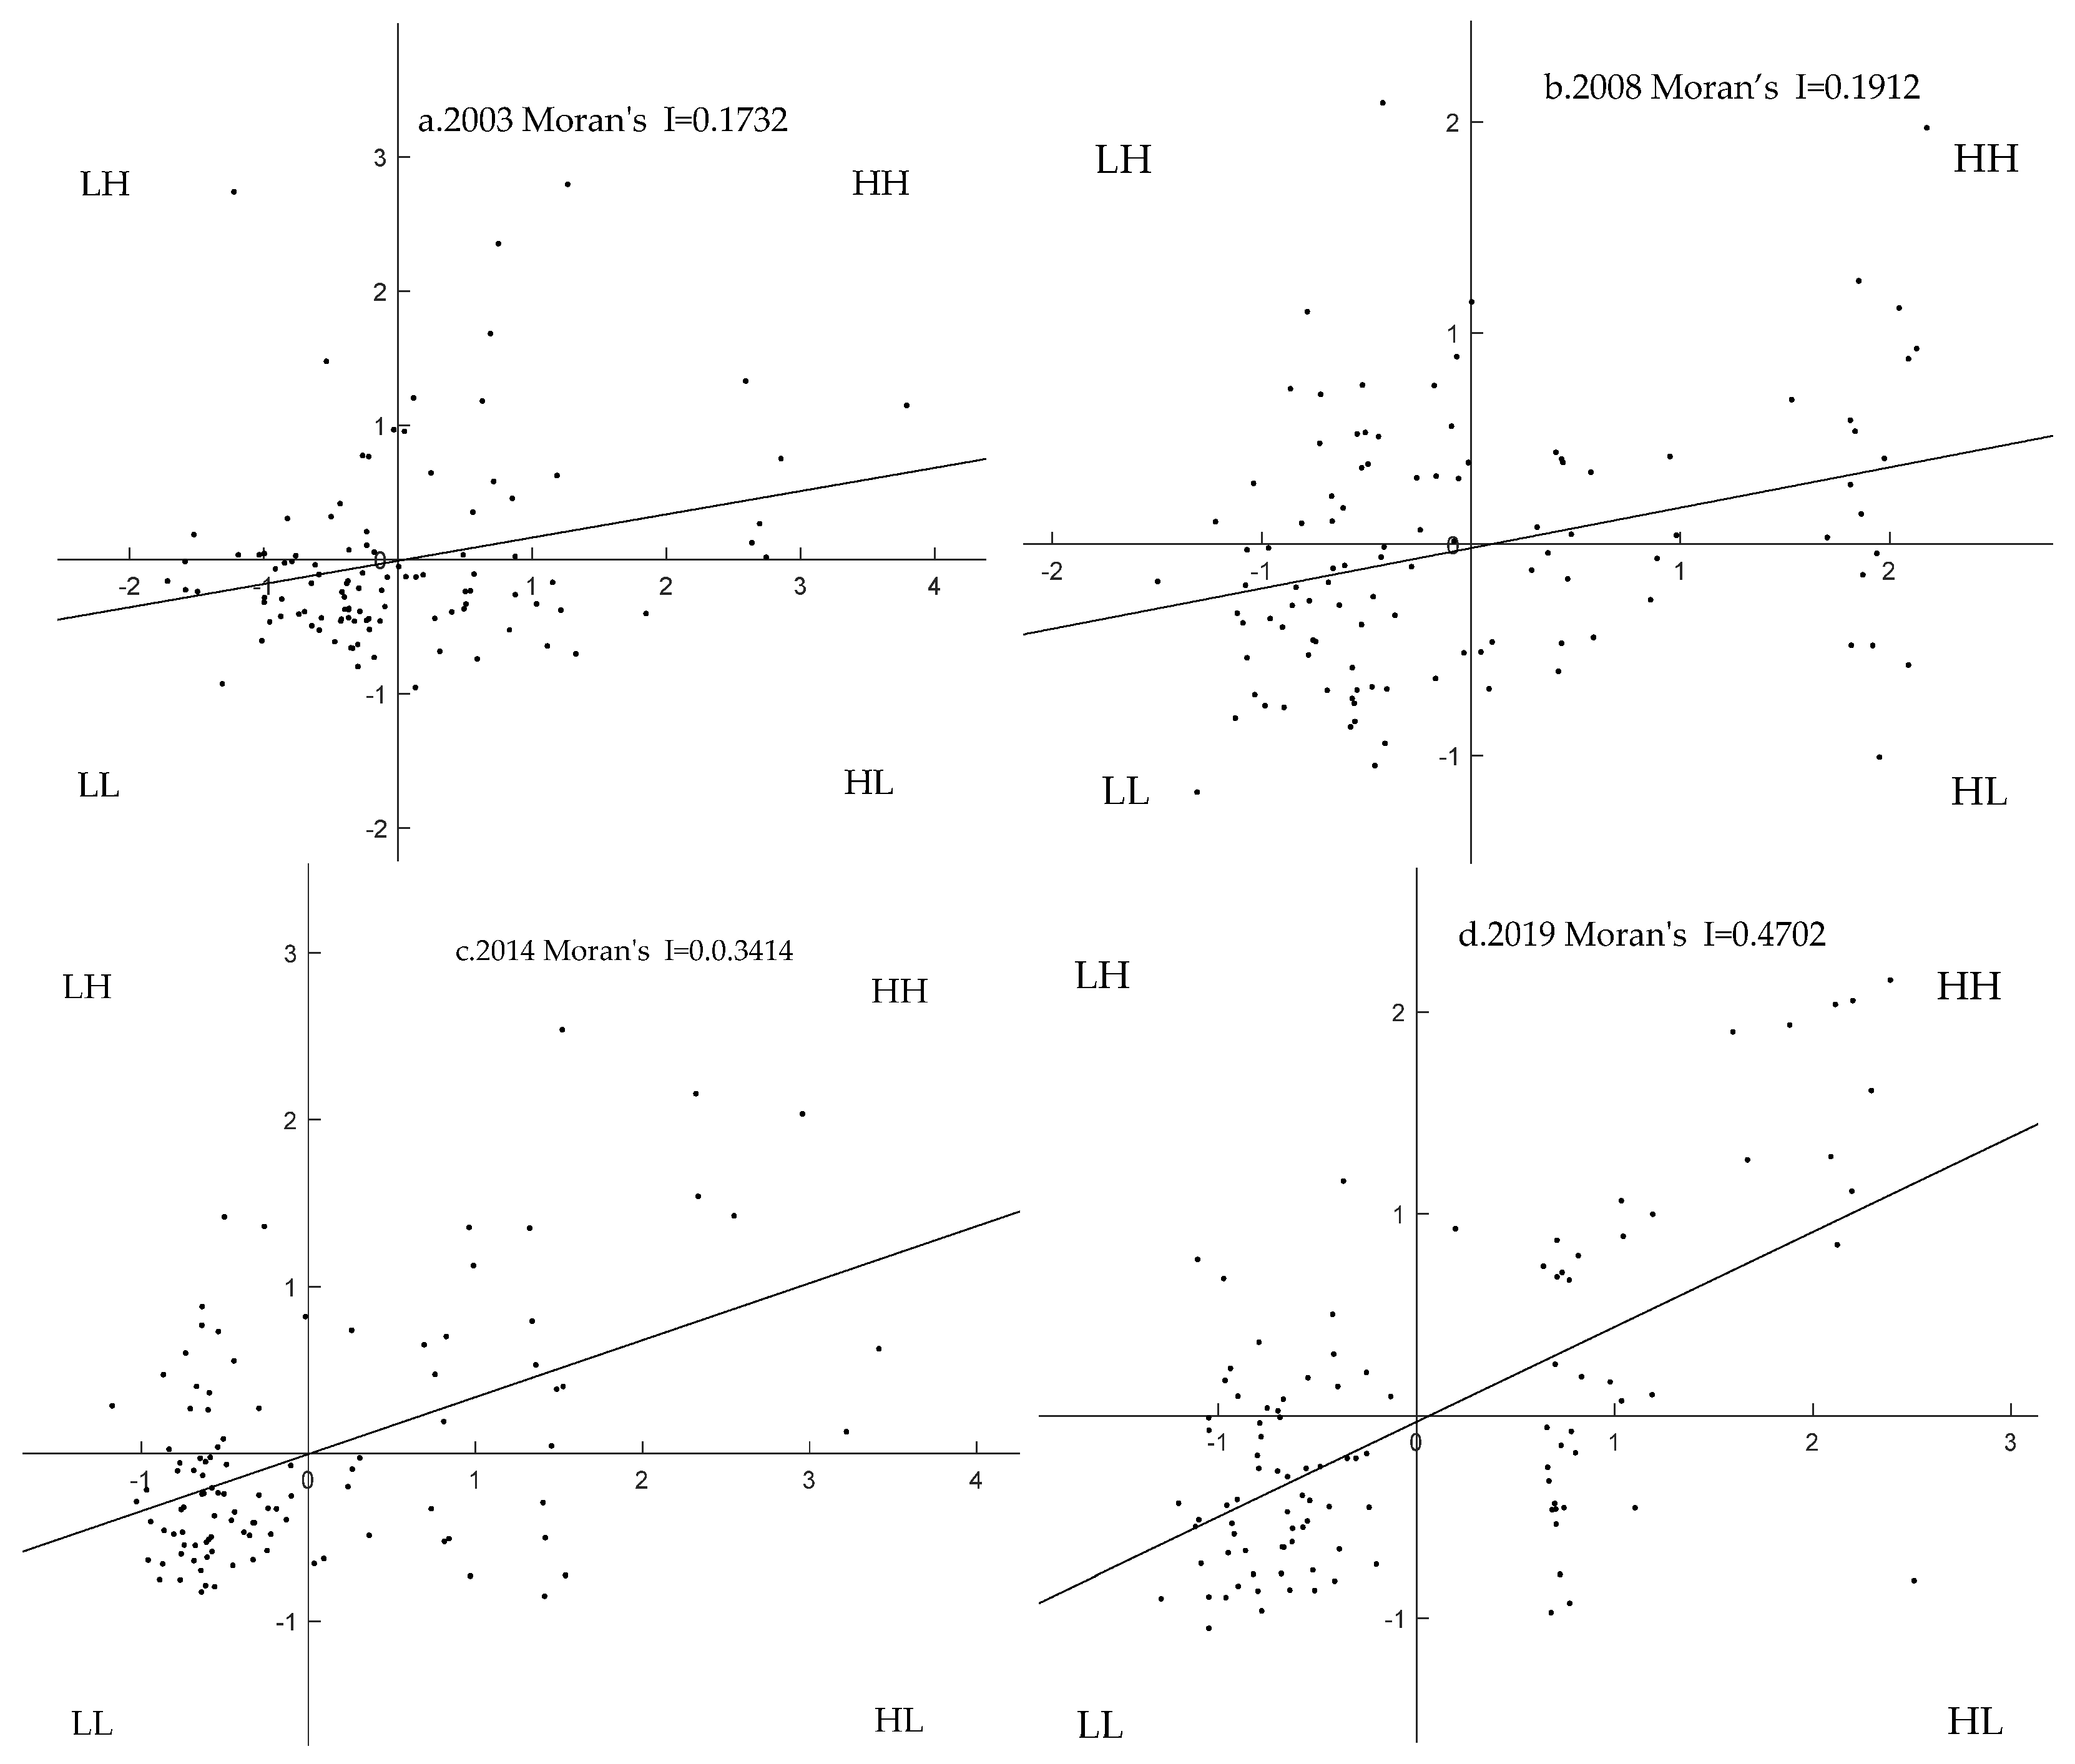
5.2.1. Global Spatial Association

We used GeoDa095i software to calculate the Global Moran’s I index of ULUE in the Yangtze River Economic Zone from 2003 to 2019 (Table 2). The results showed the Global Moran’s I index of ULUE in the Yangtze River Economic Zone is all positive during the study period, which has significant statistical significance. Especially after 2011, Global Moran’s I index showed a rapid growth trend. That means ULUE in the Yangtze River Economic Zone not only has the positive spatial correlation but also has the increasing spatial agglomeration effect.

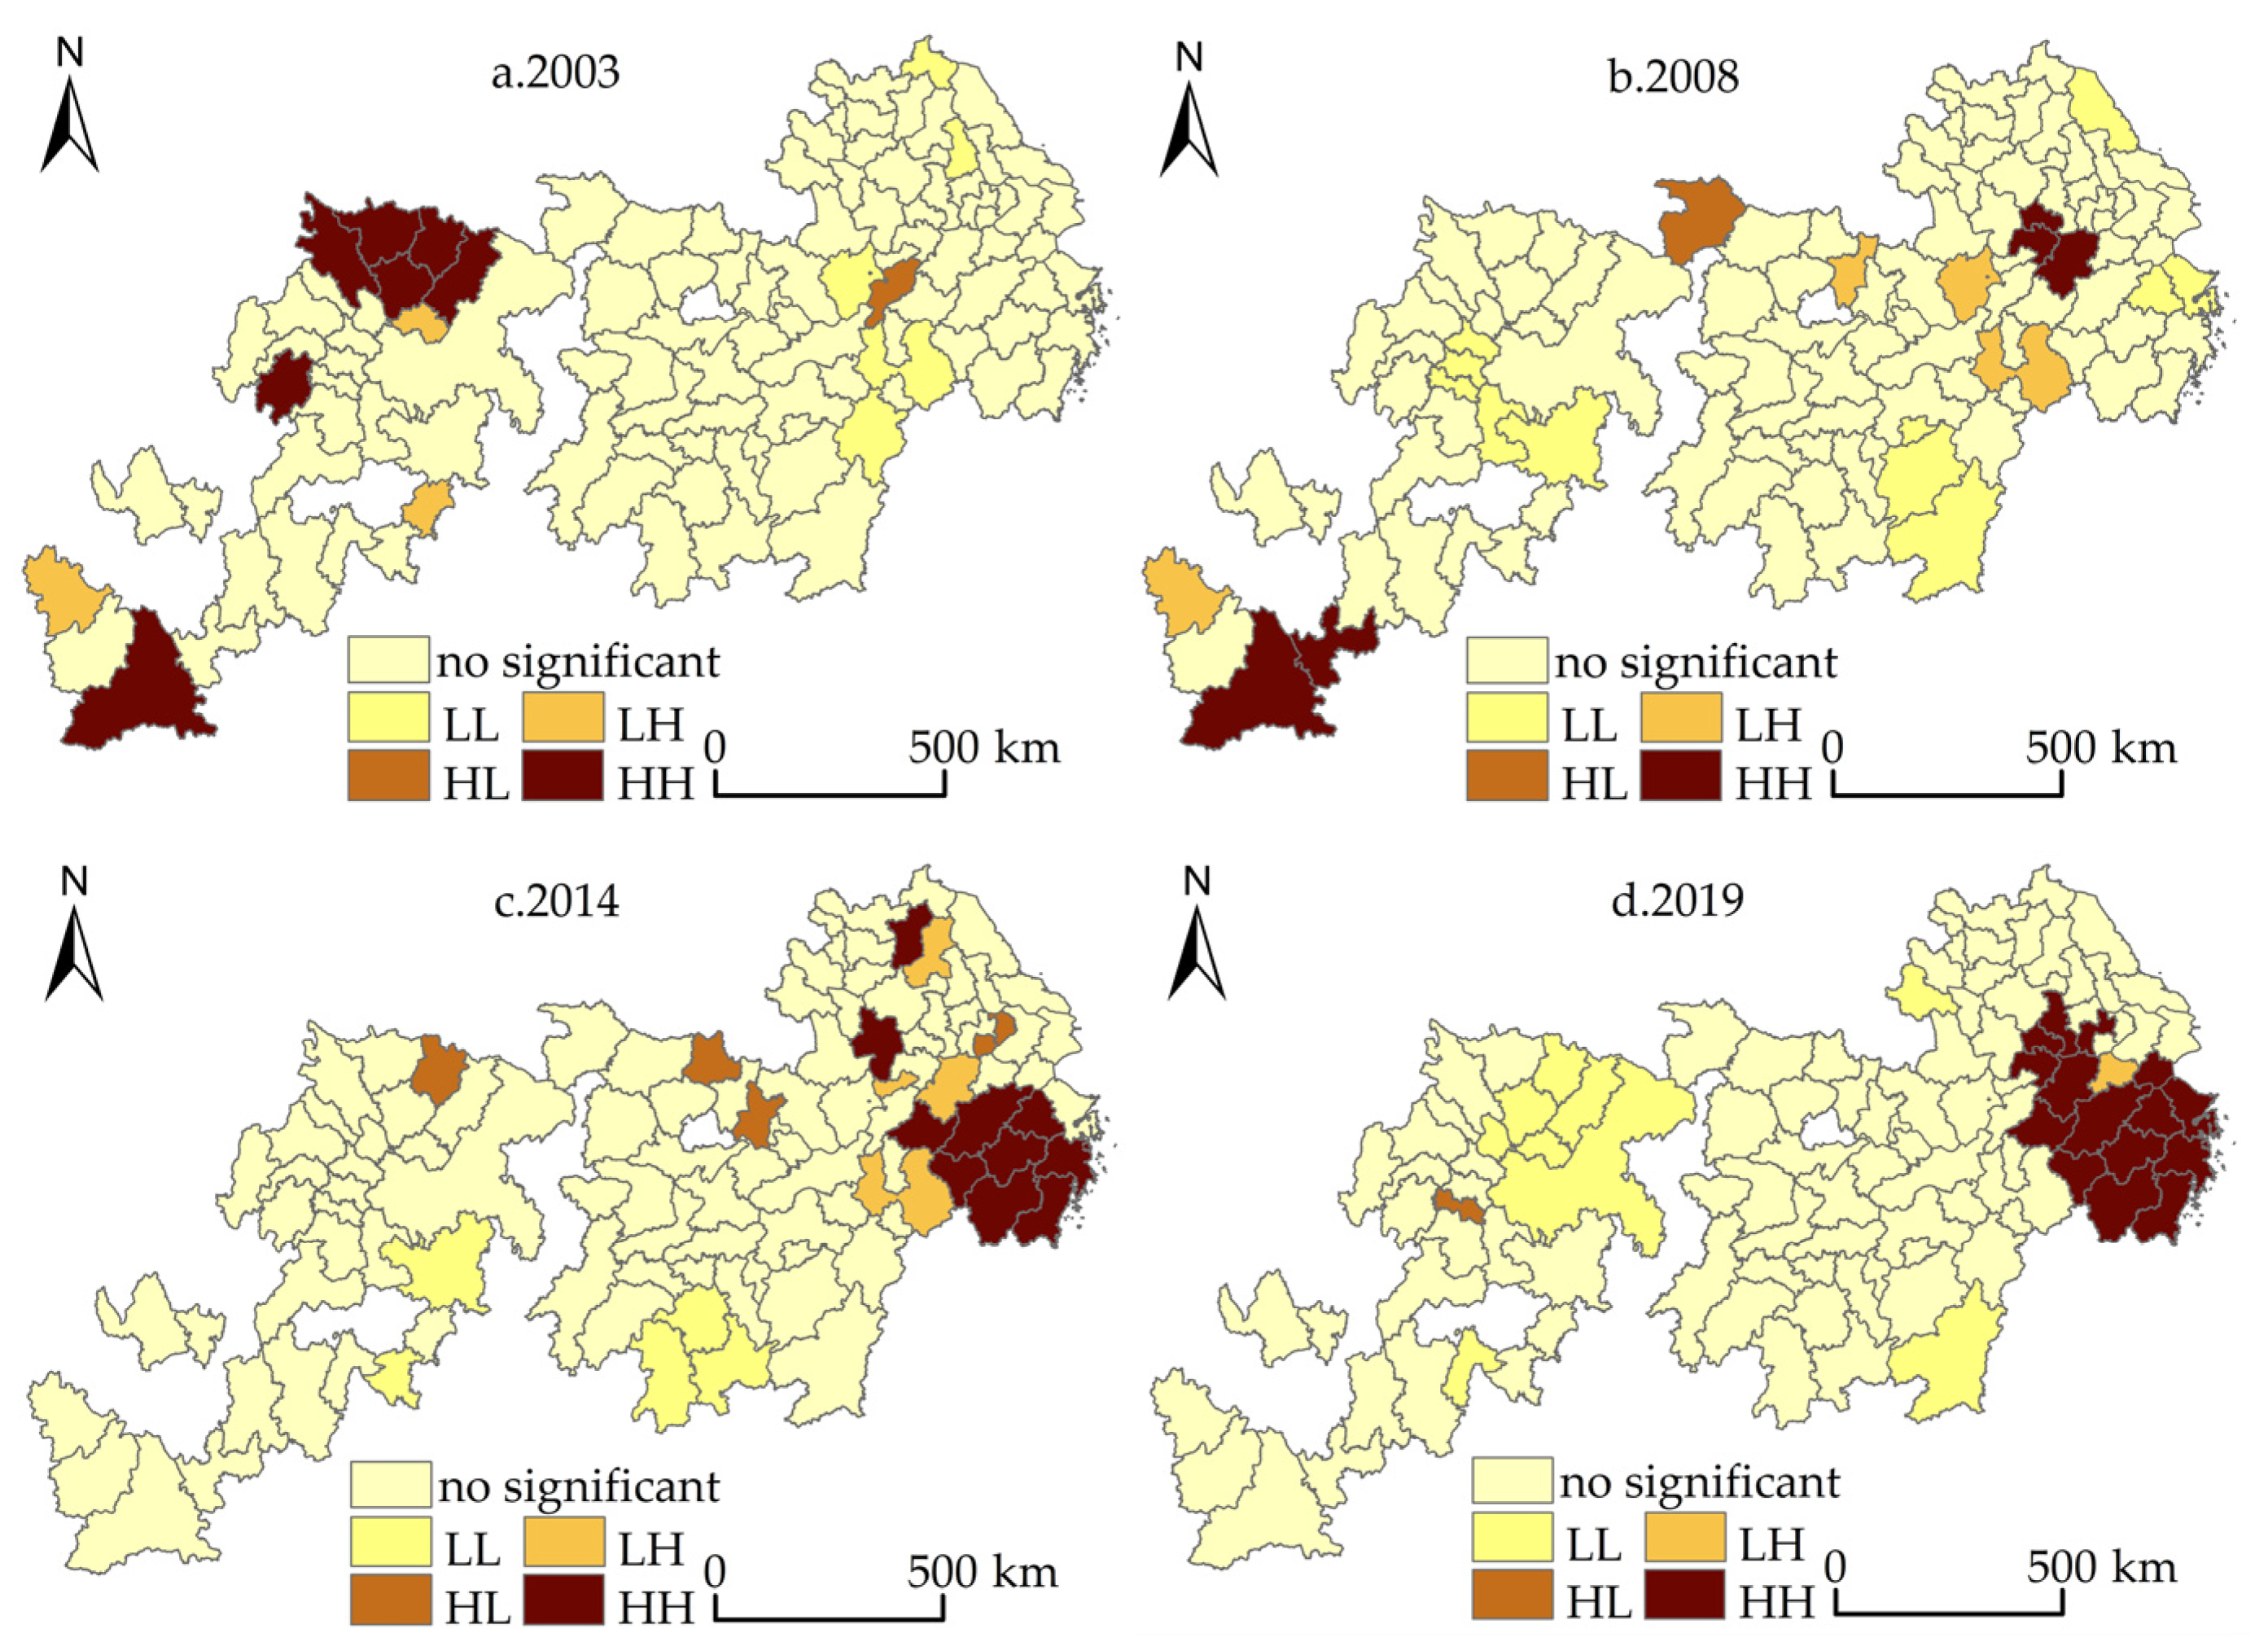
5.2.2. Local Spatial Correlation

To further identify the aggregation types and locations of ULUE in different regions, we drew the Local Moran scatter plot (Figure 5) and LISA agglomeration plot (Figure 6) to describe the local spatial correlation characteristics of ULUE in the Yangtze River Economic Zone from 2003 to 2019.
According to the Local Moran scatter plot, during the study period, most cities in the Yangtze River Economic Zone were in I and III quadrants (ULUE showed spatial positive correlation), and only a few cities were in II and IV quadrants (ULUE showed spatial negative correlation). In addition, in 2019, the number of cities of HH type and LL type increased compared with that in 2003, indicating the increasing spatial agglomeration effect of regional ULUE, which is consistent with the evolution of Global Moran’s I index.
During the study period, the number of cities with significant agglomeration of ULUE at the 5% level in the Yangtze River Economic Zone increased gradually, and the total number increased from 16 in 2003 to 26 in 2019. It can be seen from Figure 6 that these cities were distributed in the western region in the early stage and then extended to the central and eastern regions. These remarkable gathering areas can reflect spatial homogeneity to some extent, indicating that there may be spatial diffusion and spillover effects in the gathering areas. At the same time, different agglomeration types and their agglomeration degree change significantly with time, and ULUE shows spatial differentiation characteristics. Specifically, the HH agglomeration areas spread from the upstream areas and finally migrated to the downstream areas. Moreover, the agglomeration degree is enhanced. The possible reason is that there is a strong correlation between the downstream cities. Zhejiang, Shanghai, and Anhui give full play to the leading role of the green benchmarking industry, thus forming a spatial pattern of coordinated improvement of regional green development; the number of cities in the LL agglomeration areas remained basically unchanged during the study period, but the distribution pattern was relatively unstable. The agglomeration areas shifted from Lianyungang City, Yangzhou City in the downstream areas, and Anqing City, Shangrao City, and Fuzhou City in the midstream areas to Liupanshui City, Bazhong City, Nanchong City, Suining City, Dazhou City, Guang’an City, and Chongqing City in the upstream areas. In contrast, the number of cities located in HL (high-low) and LH (low-high) agglomeration areas was small and scattered, and most of them were distributed in the fringe of HH (high-high) or LL (low-low) agglomeration areas.

5.3. Spatial Convergence Analysis of ULUE

Exploratory spatial data analysis showed that the ULUE in the Yangtze River Economic Zone has significant spatial autocorrelation characteristics. If there is spatial autocorrelation between the data, the results of the absolute convergence equation estimated by the OLS method may be biased, so Table 3 also listed the maximum likelihood estimation results of the spatial error model (SEM) and spatial lag model (SLM), respectively. It is not difficult to find that the goodness of fitting of the spatial econometric model is much higher than that of the OLS model. That indicates that after considering the spatial effect, the spatial autocorrelation of the residuals of the SEM model and SLM model estimated by the maximum likelihood method is eliminated, and the estimated residuals of the models are randomly distributed in space.
Furthermore, according to the basic principle of the spatial convergence model, we used the Lagrange multiplier (LM) and Robust-LM test to select the spatial error model or the spatial lag model. Table 4 showed that in absolute convergence, LM (lag), Robust-LM (lag), LM (error), and Robust-LM (error) all pass 1% significant level test, and the LM (error) statistics are greater than LM (lag) statistics. Therefore, we adopted the spatial error model to analyze ULUE absolute convergence. Similarly, it is more appropriate to use the spatial error model in ULUE conditional convergence analysis. In addition, Table 3 showed that the goodness of fit of the SEM model is higher than that of SLM model, which also verifies the rationality of our final choice of the SEM model. It is worth noting that according to the test results of Hausman statistics (Table 4), the absolute β-convergence analysis and conditional β-convergence analysis in this paper should be based on the fixed-effect model.
From the view of spatial econometric model selection, SEM model selection shows that the ULUE of each city in the Yangtze River Economic Zone is not only related to the ULUE level at its starting time but also related to the random impact term of the ULUE of the adjacent cities. However, it has nothing to do with the ULUE of adjacent cities. For example, if the ULUE in the surrounding area of a certain city in the area is higher, it does not mean that the city also has a higher ULUE level. Hence, ULUE in the Yangtze River Economic Zone has both agglomeration and heterogeneity characteristics in the whole economic space, which is consistent with the previous conclusion obtained from the Local Moran scatter plot and LISA agglomeration plot. Due to   λ > 0   (the coefficient of the spatial error term), the ULUE residual term of each city in the region has a diffusion effect on the ULUE of adjacent cities.
By comparing the OLS estimation results of absolute β-convergence with the spatial error model estimation results (Table 3), we found that the symbol of ULUE convergence coefficient ( β ) has not changed. That indicates the convergence direction of ULUE in the Yangtze River Economic Zone has not changed after considering the influence of spatial factors on ULUE, and the significance level of the coefficient has increased. Not only that, but the convergence speed (s) of ULUE in the region is obviously accelerated. By referring to the study of Chen et al. [36], the convergence of ULUE is affected by many factors. Even if every city is segmented, the law of diminishing marginal returns will also lead to the convergence of ULUE. After considering the influence of spatial factors, that is, the actual open economy, the cross-regional flow of capital, labor, knowledge, and technology is more conducive to promoting ULUE convergence and speeding up its convergence. In term of region difference, the upstream, midstream, and downstream areas of the Yangtze River Economic Zone also show the same convergence trend, so we do not repeat them here.
Based on this, we argue that regional integration, which can significantly weaken or eliminate administrative barriers and enable the free flow of production factors, should be regarded as one of the important mechanisms to promote the convergence of regional ULUE. Next, based on the theoretical hypothesis and the research on the influencing factors of ULUE, we introduced five variables, including the government intervention degree (Govern), infrastructure investment level (Infrastructure), industrial structure upgrading (Upgrade), industrial structure rationalization (Rational), and technological innovation level (Technology) to explore the conditional β-convergence trend of ULUE. This result is basically consistent with Liang et al. [6].
The conditional β-convergence model can be regarded as the robustness test of the absolute β-convergence model to a certain extent. It can be seen from the estimation results of conditional convergence (Table 5) that the goodness of fitt of the conditional β-convergent SEM model is higher than that of the absolute β-convergent SEM model after introducing control variables. It indicates that the conditional β-convergent regression model has a better explanatory ability. In addition, for every 1% increase in ULUE in the Yangtze River Economic Zone, ULUE will converge at a rate of 5.37% under the combined influence of government intervention, infrastructure investment, industrial structure upgrading, technological innovation, and spatial error effect. That is faster than the convergence rate of 5.01% in the ordinary panel model. This shows that after considering the spatial effect, the conditional convergence rate of ULUE has also increased, which means geographical and spatial factors play an important role in the improvement of ULUE in the Yangtze River Economic Zone. Regionally, the upstream, midstream, and downstream areas of the Yangtze River Economic Zone also show similar convergence characteristics. However, due to the large differences in natural conditions, resource endowments, and economic development levels in different areas, there are significant differences in the periods when they reach 1/2 convergence, and they will converge to different ULUE steady-state levels.
The estimation results of control variables showed that: (1) In the whole region of the Yangtze River Economic Zone, the estimated coefficient of government intervention degree is 0.0106, which is significant at a 5% level. That indicates that strengthening government management reasonably is conducive to improving the comprehensive development of ULUE and then speeding up the conditional convergence process of ULUE. The areas with more reasonable intervention tend to converge at a higher level of land use. We believe that the coordination and integration of inter-regional government administrative power under the background of regional integration does not hinder the market mechanism from playing its role but is conducive to breaking administrative barriers and improving the allocation efficiency of land resources. Regionally, the upstream, midstream, and downstream areas of the Yangtze River Economic Zone also showed the same phenomenon as the whole scale. Under the background of regional integration, strengthening the government’s reasonable intervention can promote the improvement of ULUE and the convergence of ULUE spatial differences within the region. Additionally, the promoting effect showed the basic pattern of the upstream areas > the midstream areas > the downstream areas; (2) in the whole region of the Yangtze River Economic Zone, the estimated coefficients of the upgrade and rationalization of the industrial structure are positive, and they have passed the significance tests of 1% and 5%, respectively. It shows that industrial structure upgrading and industrial structure adjustment can effectively promote the coordinated improvement of ULUE among areas. Especially, the increase in the proportion of high-tech industries can provide a better platform for the rational use of land. Regionally, the upgrading effect of industrial structure in the upstream and midstream areas of the Yangtze River Economic Zone is temporarily inferior to the downstream areas, and the effect of industrial structure adjustment in the upstream and midstream areas has not yet appeared, but its industrial structure has greater development potential. We believe that improving the industry structure in the backward areas will have a positive influence on the convergence of ULUE in the Yangtze River Economic Zone; (3) in the whole region of the Yangtze River Economic Zone, the estimated coefficients of infrastructure investment level and technology innovation level are negative, and they have passed the significance tests of 10% and 5%, respectively. It indicates that the impact of both on ULUE convergence is significantly negative during the study period. We believe that improving the level of infrastructure investment and technological innovation will not reduce ULUE by itself. The possible explanation is that infrastructure investment has squeezed the government’s investment and subsidies for the green technological innovation of enterprises to a certain extent, thus causing ULUE losses; also, the investment in technological innovation does not encourage enterprises to develop green technology innovation or improve the level of clean technology as expected; on the contrary, it increases the “compliance cost” of enterprises. As a result, under the double constraints of profit maximization and limited resources, technological progress follows costs and squeezes out other profitable investments of enterprises, hindering the further improvement of ULUE.

6. Conclusions and Discussion

Compared with the existing research, the possible contribution of this paper is to build a theoretical framework of spatial convergence of ULUE under the background of regional integration and to construct a “green” evaluation system of ULUE with multi-objective constraints. Then, we re-examined the spatial differences and convergence mechanism of ULUE in the Yangtze River Economic Zone from 2003 to 2019 through the super efficiency SBM model, exploratory spatial data analysis model, and spatial convergence model incorporating the spatial weight matrix.
The results showed that the ULUE level in the Yangtze River Economic Zone has been continuously improved during the study period, but there are significant spatial disequilibrium and spatial correlation characteristics. HH agglomeration and LL agglomeration are the main spatial agglomeration patterns of ULUE in the Yangtze River Economic Zone. Therefore, after considering the impact of spatial factors on ULUE, the ULUE in the Yangtze River Economic Zone and its upstream, midstream, and downstream areas all show a more obvious trend of absolute β-convergence and conditional β-convergence. Moreover, reasonable government intervention and industrial structure improvement can accelerate the convergence process of the ULUE. Unfortunately, the investment in infrastructure and technology does not have a positive impact on the conditional β-convergence of the ULUE in the Yangtze River Economic Zone.
Based on the above conclusions, we put forward the following policy recommendations:
(1)
Actively promoting the integration of the Yangtze River Economic Zone. It is necessary to break the administrative barriers, establish a regional coordinated development mechanism, strengthen the guidance of ecological priority policies, and establish a development committee of the Yangtze River Economic Zone led by national authorities and joined by provinces along the Yangtze River. At the same time, it is necessary to incorporate “regional cooperation” into the assessment system of party and government leading cadres and promote regional integration development by examining the role of “baton”, thus maximizing its role in promoting the green utilization of urban land; additionally, we should focus on building a regional collaborative development mechanism, giving full play to the spatial spillover effect of integrated development, focusing on optimizing the spatial distribution channels of elements, and improving the ability of cross-regional resource allocation and element spatial integration. Moreover, it is necessary to reduce the scale of regional pollution emissions through industrial spatial redistribution, thus realizing the green transformation of land use.
(2)
According to the spatial pattern of ULUE, formulating the regional development strategy according to local conditions [46]. HH agglomeration areas should not only give priority to cultivating green high-tech industrial community and accelerate the formation of land green intensification effect with industrial green development but also give full play to its diffusion effect and strengthen the radiation driving effect on the surrounding areas. HL agglomeration and LH agglomeration areas, as transitional plates, should fully rely on geographical proximity to connect spatial elements transfer corridors and ultimately achieve ULUE collaborative promotion. In contrast, the LL agglomeration areas should focus on the establishment of regional internal sharing and external linkage mechanisms, actively promote the process of open interaction patterns between ULUE high-value areas and low-value areas, and actively absorb advanced technologies and development concepts in high-value areas.
(3)
Coordinating regional green development strategy and implementing policies for different cities based on different driving factors. Government management and technological innovation are the main driving forces for ULUE convergence. Based on increasing the investment of the joint pollution control fund, the government should give full play to the correlation effect of infrastructure and promote the coordinated promotion of ULUE by accelerating inter-regional cooperation to achieve a win–win situation. The downstream areas should make full use of the economic system to realize the effective connection between capital and technology and accelerate the cultivation of green management talents and incubation of green technology. More importantly, the downstream areas should drive the development of the ULUE around by releasing spillover effects of the green kinetic energy; the midstream and upstream areas should increase government technical support and at the same time introduce supporting policies for talent introduction. The midstream and upstream areas need to achieve steady improvement and leapfrog development of ULUE through policy advantages. In addition, the optimization and upgrading of industrial structures can accelerate the convergence of ULUE. The region should actively construct the linkage and sharing mechanism of industrial development and form a cooperative and progressive pattern of industrial dislocation, complementary advantages, and division of labor. The key for technological innovation to promote ULUE growth is to guide enterprises to produce “efficiency compensation” to offset the “compliance cost” of industrial environmental pollution control and ultimately realize the win–win situation between the economy and the environment of regional land use.

Author Contributions

Conceptualization, methodology, and writing—original draft and editing: K.G.; funding acquisition: K.G., D.C. and S.K.; project administration and supervision: X.L. and S.K.; data curation, resources, software, and visualization: D.C. and S.Z.; writing—review and editing: D.C. and S.Z. All authors have read and agreed to the published version of the manuscript.

Funding

This research was funded by “Jiangxi Provincial Association of Social Sciences” (grant number: 20GL37), “Education Department of Jiangxi Province” (grant number: GJJ191710), “Ministry of Education of the People’s Republic of China” (grant number: 21YJC790006; 21YJC790056).

Institutional Review Board Statement

Not applicable.

Informed Consent Statement

Not applicable.

Data Availability Statement

The data presented in this study are available on request from the first author.

Conflicts of Interest

The authors declare no conflict of interest.

References

  1. Chen, D.L.; Lu, X.H.; Kuang, B. Dynamic evolution and spatial convergence of urban land use efficiency in the middle reaches of the Yangtze River. China Popul. Resour. Environ. 2018, 28, 106–114. [Google Scholar]
  2. Zhang, K. Is regional Integration Beneficial to Emission reduction? Financ. Res. 2018, 1, 67–83. [Google Scholar]
  3. Huang, W.; Zhang, Y.Y. Does the strategy of regional integration affect the high-quality development of China’s urban economy? An empirical study based on urban agglomeration in the Yangtze river Economic Belt. Ind. Econ. Res. 2019, 6, 14–26. [Google Scholar]
  4. Wu, C.Y.; Wei, Y.D.; Huang, X.J.; Chen, B.W. Economic transition, spatial development and urban land use efficiency in the Yangtze River Delta, China. Habitat Int. 2017, 63, 67–78. [Google Scholar] [CrossRef]
  5. Arouri, M.E.H.; Rault, C.; Teulon, F. Equity Risk Premium and Regional Integration. Int. Rev. Financ. Anal. 2013, 28, 79–85. [Google Scholar] [CrossRef] [Green Version]
  6. Liang, L.T.; Yong, Y.J.; Yuan, C.G. Measurement of urban land green use efficiency and its spatial differentiation characteristics: An empirical study based on 284 cities. China Land Sci. 2019, 33, 80–87. [Google Scholar]
  7. Lu, X.H.; Yang, X.; Chen, Z.X. Measurement and temporal-spatial evolution characteristics of urban land green use efficiency in China. China Popul. Resour. Environ. 2020, 30, 83–91. [Google Scholar]
  8. Dadi, D.; Azadi, H.; Senbeta, F.; Abebe, K.; Taheri, F.; Stellmacher, T. Urban sprawl and its impacts on land use change in Central Ethiopia. Urban For. Urban Green. 2016, 16, 132–141. [Google Scholar] [CrossRef]
  9. D’Amour, C.B.; Reitsma, F.; Baiocchi, G.; Barthel, S.; Güneralp, B.; Erb, K.H.; Haberl, H.; Creutzig, V.O.P.; Seto, K.C. Future urban land expansion and implications for global croplands. Proc. Natl. Acad. Sci. USA 2017, 114, 8939–8944. [Google Scholar] [CrossRef] [PubMed] [Green Version]
  10. Danni, Z. Land use efficiency and its change of Vietnam based on DEA. In Proceedings of the IOP Conference Series: Earth and Environmental Science, Guiyang, China, 14–16 June 2019. [Google Scholar]
  11. Tan, S.K.; Hu, B.X.; Kuang, B.; Zhou, M. Regional differences and dynamic evolution of urban land green use efficiency within the Yangtze River Delta, China. Land Use Policy 2021, 106, 105449. [Google Scholar] [CrossRef]
  12. Wang, D.Q.; Pang, X.Q. Research on green land-use efficiency of Beijing-Tianjin-Hebei urban agglomeration. China Popul. Resour. Environ. 2019, 29, 68–76. [Google Scholar]
  13. Yang, Q.K.; Duan, X.J.; Ye, L.; Zhang, W. Efficiency evaluation of city land utilization in the Yangtze River Delta using an sbm-undesirable model. Resour. Sci. 2014, 36, 712–721. [Google Scholar]
  14. Ji, Z.H.; Zhang, P. Spatial difference and driving mechanisms of urban land use efficiency under environmental constraints: Based on 285 cities in China. China Land Sci. 2020, 34, 72–79. [Google Scholar]
  15. Liang, L.T.; Zhao, Q.L.; Chen, C. Analysis on the Characters of Spatial Disparity of Urban Land Use Efficiency and Its Optimization in China. China Land Sci. 2013, 27, 48–54. [Google Scholar]
  16. Zhang, Y.J.; Jin, H. Research on the efficiency of urban construction land and the drive mechanism in the Mid-Yangtze River. Resour. Sci. 2015, 37, 1384–1393. [Google Scholar]
  17. Zhang, Y.G. Economic Development Pattern Change Impact on China’s Carbon Intensity. Econ. Res. J. 2010, 45, 120–133. [Google Scholar]
  18. Liang, Q.M.; Deng, H.M.; Liu, M. Co-control of CO2 emissions and local pollutants in China: The perspective of adjusting final use behaviors. J. Clean. Prod. 2016, 131, 198–208. [Google Scholar] [CrossRef]
  19. Yue, L.; Li, W.B. Typical urban land use efficiency in China under environmental constraints based on DDF-Global Malmquist-Luenberger index modeling. Resour. Sci. 2017, 39, 597–607. [Google Scholar]
  20. Li, K.Q.; Chen, Y.R.; Chen, J.R. An Evaluation Model for the Low-carbon and Intensive Urban Land Use Using Analytic Network Process. Econ. Geogr. 2013, 33, 156–161. [Google Scholar]
  21. Zhang, X.; Wu, Y.; Shen, L. An evaluation framework for the sustainability of urban land use: A study of capital cities and municipalities in China. Habitat Int. 2011, 35, 141–149. [Google Scholar] [CrossRef]
  22. Li, C.J.; Miao, M. Urban land-use efficiency measurement of city group in middle reaches of the Yangtze River: Reality mechanism and spatiotemporal diversities. China Popul. Resour. Environ. 2017, 27, 157–164. [Google Scholar]
  23. Zhao, K.; Zhang, A.L.; Xu, W.T. Driving Forces of Urban Construction Land Expansion: An Empirical Analysis Based on Provincial Panel Data. Resour. Sci. 2011, 33, 935–941. [Google Scholar]
  24. Zhao, K.; Xu, T.Q.; Li, P.; Zhang, A.L. Disparities and convergence of land productivity of different scale cities: Based on panel data of 265 cities in China. J. Arid Land Resour. Environ. Chin. 2015, 29, 1–6. [Google Scholar]
  25. Song, Y.; Yeung, G.; Zhu, D.L.; Xu, Y.; Zhao, J.M. Spatio-temporal patterns and driving factors of urban land use efficiency at the county level in Beijing-Tianjin-Hebei urban agglomeration. China Land Sci. 2021, 35, 69–78. [Google Scholar]
  26. Hu, X.P.; Zhong, C.L. Influence of the Integration of Regional Production Factors on Urban Land Use Efficiency-A Case of Urban Agglomeration in the Middle Reaches of the Yangtze River. Hunan Ke Ji Da Xue X 2017, 39, 14–21+129. [Google Scholar]
  27. Wang, J.; Chen, W. Implication of regionalism and regional integration under the global shift. Prog. Geogr. 2013, 32, 1082–1091. [Google Scholar]
  28. Zhang, Y.H.; Chen, J.L.; Gao, J.L.; Jiang, W.X. The impact mechanism of urban land use efficiency in the Yangtze River Delta from the perspective of economic transition. J. Nat. Resour. 2019, 34, 1157–1170. [Google Scholar]
  29. Lu, X.H.; Chen, D.L.; Kuang, B. Influences on urban land use efficiency by regional integration: Taking Wuhan Urban Agglomeration for example. Urban Probl. 2018, 3, 19–26. [Google Scholar]
  30. Koroso, N.H.; Lengoiboni, M.; Zevenbergen, J.A. Urbanization and urban land use efficiency: Evidence from regional and Addis Ababa satellite cities, Ethiopia. Habitat Int. 2021, 117, 102437. [Google Scholar] [CrossRef]
  31. Chen, Y.; Zhao, L. Exploring the relation between the industrial structure and the eco-environment based on an integrated approach: A case study of Beijing, China. Ecol. Indic. 2019, 103, 83–93. [Google Scholar] [CrossRef]
  32. Chen, Y.; Chen, Z.G.; Xu, G.L.; Tian, Z.Q. Built-up land efficiency in urban China: Insights from the general land use plan (2006-2020). Habitat Int. 2016, 51, 31–38. [Google Scholar] [CrossRef]
  33. Zhu, G.L.; Wang, C.J.; Zhou, J.N.; Zou, W. Industrial Development, Intensive Land Use and Urban Expansion. Resour. Environ. Yangtze Basin 2020, 29, 1473–1485. [Google Scholar]
  34. An, H.S.; Li, R.L. Effect and Realization Way of Regional Economic Integration. Hunan Soc. Sci. 2007, 5, 95–102. [Google Scholar]
  35. Zhang, Z.D.; Wu, D.; Zhou, S.D. Production factor Mobility, Regional Coordination and Integration and Economic Growth. J. Ind. Technol. Ec. 2018, 37, 58–66. [Google Scholar]
  36. Chen, E.; Dong, J.; Xu, L. Spatial-temporal Differences and Convergence of Urban Land Use Efficiency in Changjiang River Economic Belt. Resour. Dev. Mark. 2018, 34, 316–321. [Google Scholar]
  37. Chen, D.L.; Lu, X.H.; Hu, W.B.; Zhang, C.Z.; Lin, Y.B. How urban sprawl influences eco-environmental quality: Empirical research in China by using the Spatial Durbin model. Ecol. Indic. 2021, 131, 108113. [Google Scholar] [CrossRef]
  38. Tone, K. A slacks-based measure of super-efficiency in data envelopment analysis. Eur. J. Oper. Res. 2002, 143, 32–41. [Google Scholar] [CrossRef] [Green Version]
  39. Zhang, W.X.; Wu, Q.; Wang, B.; Huang, J. Multidimensional study of specialized agglomeration and diversified agglomeration on urban land-use efficiency. China Popul. Resour. Environ. 2019, 29, 100–110. [Google Scholar]
  40. Li, D.S.; Zhao, Y.W.; Li, L.Y. Change of environmental efficiency and environmental productivity of coal cities: Based on panel data of 11 cities in Shanxi province. J. Nat. Resour. 2021, 36, 618–633. [Google Scholar]
  41. Hu, B.X.; Li, J.; Kuang, B. Evolution characteristics and influencing factors of urban land use efficiency differences under the concept of green development. Econ. Geogr. 2018, 38, 183–189. [Google Scholar]
  42. Xiang, Y.B.; Wang, S.Y.; Deng, C.X. Spatial differentiation and driving factor of green development efficiency of the chemical industry in the Yangtze River Economic Belt. Econ. Geogr. 2021, 41, 108–117. [Google Scholar]
  43. Cliff, A.D.; Ord, J.K. Spatial Autocorrelation. Biometrics 2010, 30, 729. [Google Scholar]
  44. Burkhauser, R.V.; Rovba, L. Income Inequality in the 1990s: Comparing the United States, Great Britain, and Germany. Jpn. J. Soc. Secur. Policy 2005, 4, 1–16. [Google Scholar]
  45. 2006 IPCC Guidelines for National Greenhouse Gas Inventories. Available online: www.ipcc-nggip.iges.or.jp/public/2006gl/index.html (accessed on 29 August 2021).
  46. Chen, D.L.; Lu, X.H.; Zhang, C.Z.; Zhang, X.P. Study on the impact mechanism of regional integration on urban land green use efficiency from a multi-dimensional perspective. Econ. Manag. Res. 2021, 42, 96–110. [Google Scholar]
Figure 1. Spatial convergence mechanism of ULUE under the background of regional integration.
Land 10 01100 g001
Figure 2. The spatial scope of the Yangtze River Economic Zone in China.
Land 10 01100 g002
Figure 3. Temporal series variation of ULUE in Yangtze River Economic Zone.
Land 10 01100 g003
Figure 4. The spatial distribution of ULUE in the Yangtze River Economic Zone. (a) ULUE in 2003; (b) ULUE in 2007; (c) ULUE in 2011; (d) ULUE in 2015; (e) ULUE in 2019.
Land 10 01100 g004aLand 10 01100 g004b
Figure 5. Local Moran scatter plot of ULUE in the Yangtze River Economic Zone. (a) Moran’s I in 2003; (b) Moran’s I in 2008; (c) Moran’s I in 2014; (d) Moran’s I in 2019.
Land 10 01100 g005
Figure 6. LISA gathering plot of ULUE in the Yangtze River Economic Zone. (a) LISA in 2003; (b) LISA in 2008; (c) LISA in 2014; (d) LISA in 2019.
Land 10 01100 g006
Table 1. Descriptive analysis of the variables.
TypeVariableSymbolNMaximumMinimumMeanStandard Error of Mean
explained variableurban land use efficiencyULUE18191.71460.16720.61710.2865
control variablelevel of government interventionGovern181964.88332.479014.82687.1067
level of infrastructure investmentInfrastructure181967.21180.37647.36056.5291
upgrade of industry structureUpgrade18199.05690.23930.97690.5759
rationalization of industrial structureRational18191.18710.00000.20890.2034
technology innovation levelTechnology18192.98250.00080.25550.2940
Table 2. ULUE Global Moran’s I index of the Yangtze River Economic Zone from 2003 to 2019.
Year200320042005200620072008200920102011
Index
Global Moran’s I0.1732 ***0.1418 **0.1601 **0.1924 ***0.1873 ***0.1912 ***0.1787 **0.1854 ***0.2196 **
P0.00600.01700.01300.00600.00500.00300.01300.00800.0020
Z(I)2.82062.28582.58993.02592.92872.97552.75262.79213.6524
Year20122013201420152016201720182019
Index
Global Moran’s I0.2217 ***0.2424 ***0.3414 ***0.3615 ***0.4480 ***0.4507 ***0.4513 ***0.4702 ***
P0.00100.00200.00100.00100.00100.00100.00100.0010
Z(I)3.52663.64995.13385.58866.53276.80706.71506.9872
Note: *, **, and *** represent significance at 10%, 5% and 1% statistical level, respectively.
Table 3. Absolute β-convergence estimation result.
VariableThe Yangtze River Economic ZoneThe Upstream AreasThe Midstream AreasThe Downstream Areas
OLSSEMSLMOLSSEMSLMOLSSEMSLMOLSSEMSLM
β −0.0769 ***
(−9.2300)
−0.5599 ***
(−24.2215)
−0.4030 ***
(−20.4593)
−0.0377 ***
(−2.8986)
−0.4762 ***
(−11.0950)
−0.3756 ***
(−10.5089)
−0.0815 ***
(−5.7188)
−0.6574 ***
(−17.2210)
−0.5703 ***
(−16.0932)
−0.1083 ***
(−7.0555)
−0.5116 ***
(−13.3342)
−0.4440 ***
(−13.4126)
λ 0.3160 ***
(10.0879)
0.1840 ***
(3.4196)
0.1878 ***
(2.6557)
0.4101 ***
(5.8158)
ρ 0.1799 ***
(6.1925)
0.0660 **
(1.9657)
0.1869 ***
(3.9364)
0.4024 ***
(8.4036)
s0.00470.05860.03030.00230.04620.02770.00520.07650.04970.00670.05120.0345
τ147.478111.828522.8761301.368315.003225.0233133.29759.060713.9467103.454813,538020.0912
R20.04160.27230.25580.01630.23800.22250.04730.39160.36610.05520.21290.1590
Log(L)−27.4357154.4103180.445860.902690.0146117.9425−17.885880.697996.6282−52.7359−8.523418.9436
Note: T-Statistics are included in parentheses. *, **, and *** represent significance at 10%, 5%, and 1% statistical level, respectively.
Table 4. ULUE spatial correlation test.
TestAbsolute β-ConvergenceConditional β-Convergence
t-Statisticp-Valuest-Statisticp-Values
Hausman test of spatial error model143.04040.0000146.00590.0000
Hausman test of spatial lag model18.23210.000029.27530.0001
LM (lag)39.20150.000037.94320.0000
Robust-LM (lag)96.92120.000052.93700.0000
LM (error)120.52830.000095.75440.0000
Robust-LM (error)178.24790.0000110.74820.0000
Table 5. Conditional β-convergence estimation result.
VariableThe Yangtze River Economic ZoneThe Upstream AreasThe Midstream AreasThe Downstream Areas
Ordinary Least SquaresSpatial Error ModelOrdinary Least SquaresSpatial Error ModelOrdinary Least SquaresSpatial Error ModelOrdinary Least SquaresSpatial Error Model
β−0.5041 ***
(−23.1664)
−0.5282 ***
(−23.0323)
−0.4542 ***
(−11.1850)
−0.5216 ***
(−11.3815)
−0.6598 ***
(−17.6315)
−0.7272 ***
(−18.6605)
−0.4723 ***
(−13.0524)
−0.5213 ***
(−13.7073)
λ 0.1460 ***
(4.7308)
0.0950 *
(1.8732)
0.1418 **
(1.9670)
0.1701 **
(2.3489)
Govern0.0061 **
(2.3006)
0.0106 **
(2.3184)
0.0152 *
(1.6023)
0.0289 *
(−1.2997)
0.0173 *
(0.2906)
0.0126 *
(1.6496)
0.0066
(1.6057)
0.0038 *
(0.4945)
Infrastructure−0.0229 *
(−1.2919)
−0.0623 *
(−1.7483)
−0.0212
(−1.0708)
−0.0652 *
(−1.7217)
−0.0022
(−0.2660)
−0.0016 *
(−0.0608)
−0.2043 **
(−2.5395)
−0.6230 ***
(−3.6308)
Upgrade0.0557 ***
(3.1482)
0.1424 ***
(4.1034)
0.0033
(0.1280)
0.0933 *
(1.7763)
0.0702 **
(2.4184)
0.2696 ***
(4.2889)
0.1436 ***
(3.6011)
0.3033 ***
(4.2133)
Rational0.0210 **
(2.3221)
0.0205 *
(2.2104)
0.0053
(0.8311)
0.0432
(2.2644)
0.0108
(1.0400
0.013
5(1.3369)
0.0057
(1.3423)
0.0524 *
(1.9097)
Technology−0.0610 **
(−3.1067)
−0.0581 ***
(−2.8815)
−0.0364
(−1.6664)
−0.0829 **
(−2.5606)
−0.0959 ***
(−2.9750)
−0.0930 ***
(−2.8302)
−0.0013
(−1.5400)
0.0051 **
(2.0041)
s0.05010.05370.04330.05270.07700.09280.04570.0526
τ13.835312.907816.008013.15279.00197.469315.167313.1778
R20.26620.32190.22840.28440.38680.45220.23770.3005
Log(L)120.3042153.893687.221497.012881.8231103.2177−12.46314.5342
Note: t value is in parentheses; *, **, and *** represent significance at 10%, 5% and 1% statistical level, respectively.
Publisher’s Note: MDPI stays neutral with regard to jurisdictional claims in published maps and institutional affiliations.

