
Simulation of Policy Tools’ Effects on Farmers’ Adoption of Conservation Tillage Technology: An Empirical Analysis in China

Abstract
:1. Introduction
2. Theoretical Framework
3. Materials and Methods
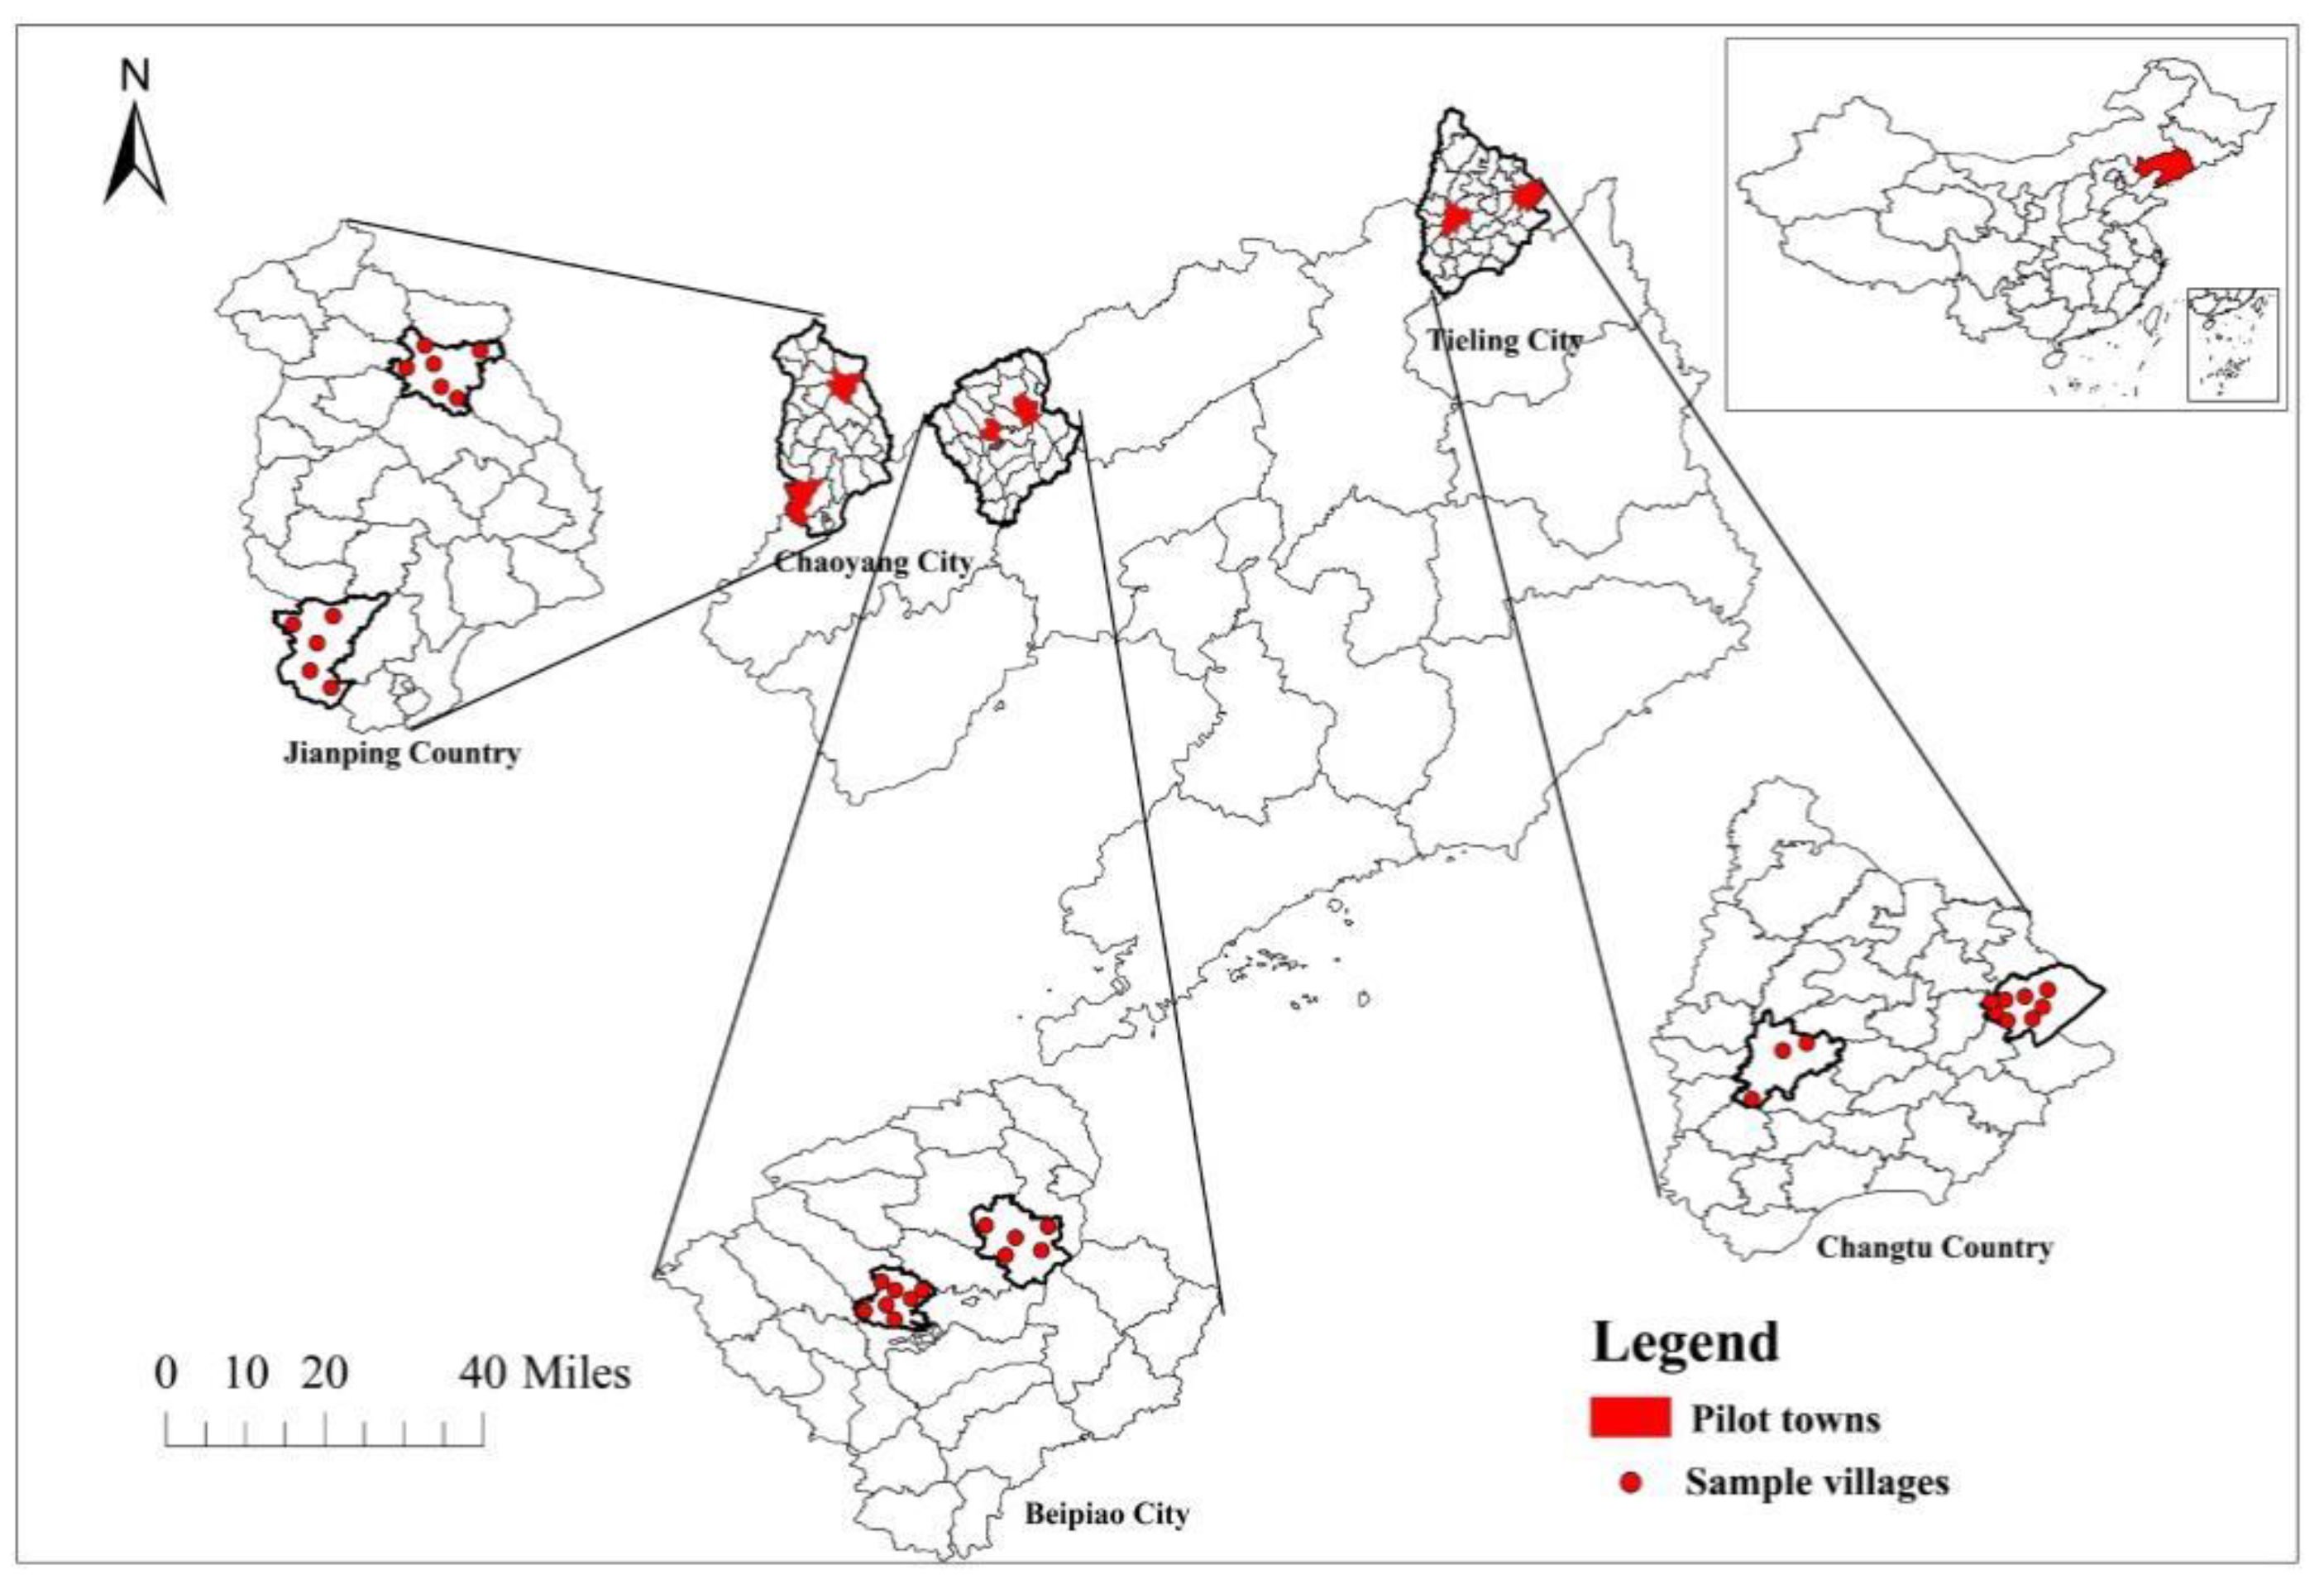
3.1. Study Areas
3.2. Research Method
3.2.1. Modeling Process
3.2.2. Agent Attributes
3.2.3. Agent Behavior Decision
Belief (B)
Desire (D)
Intention (I)
3.2.4. Policy Tool Simulation Scenarios
4. Results
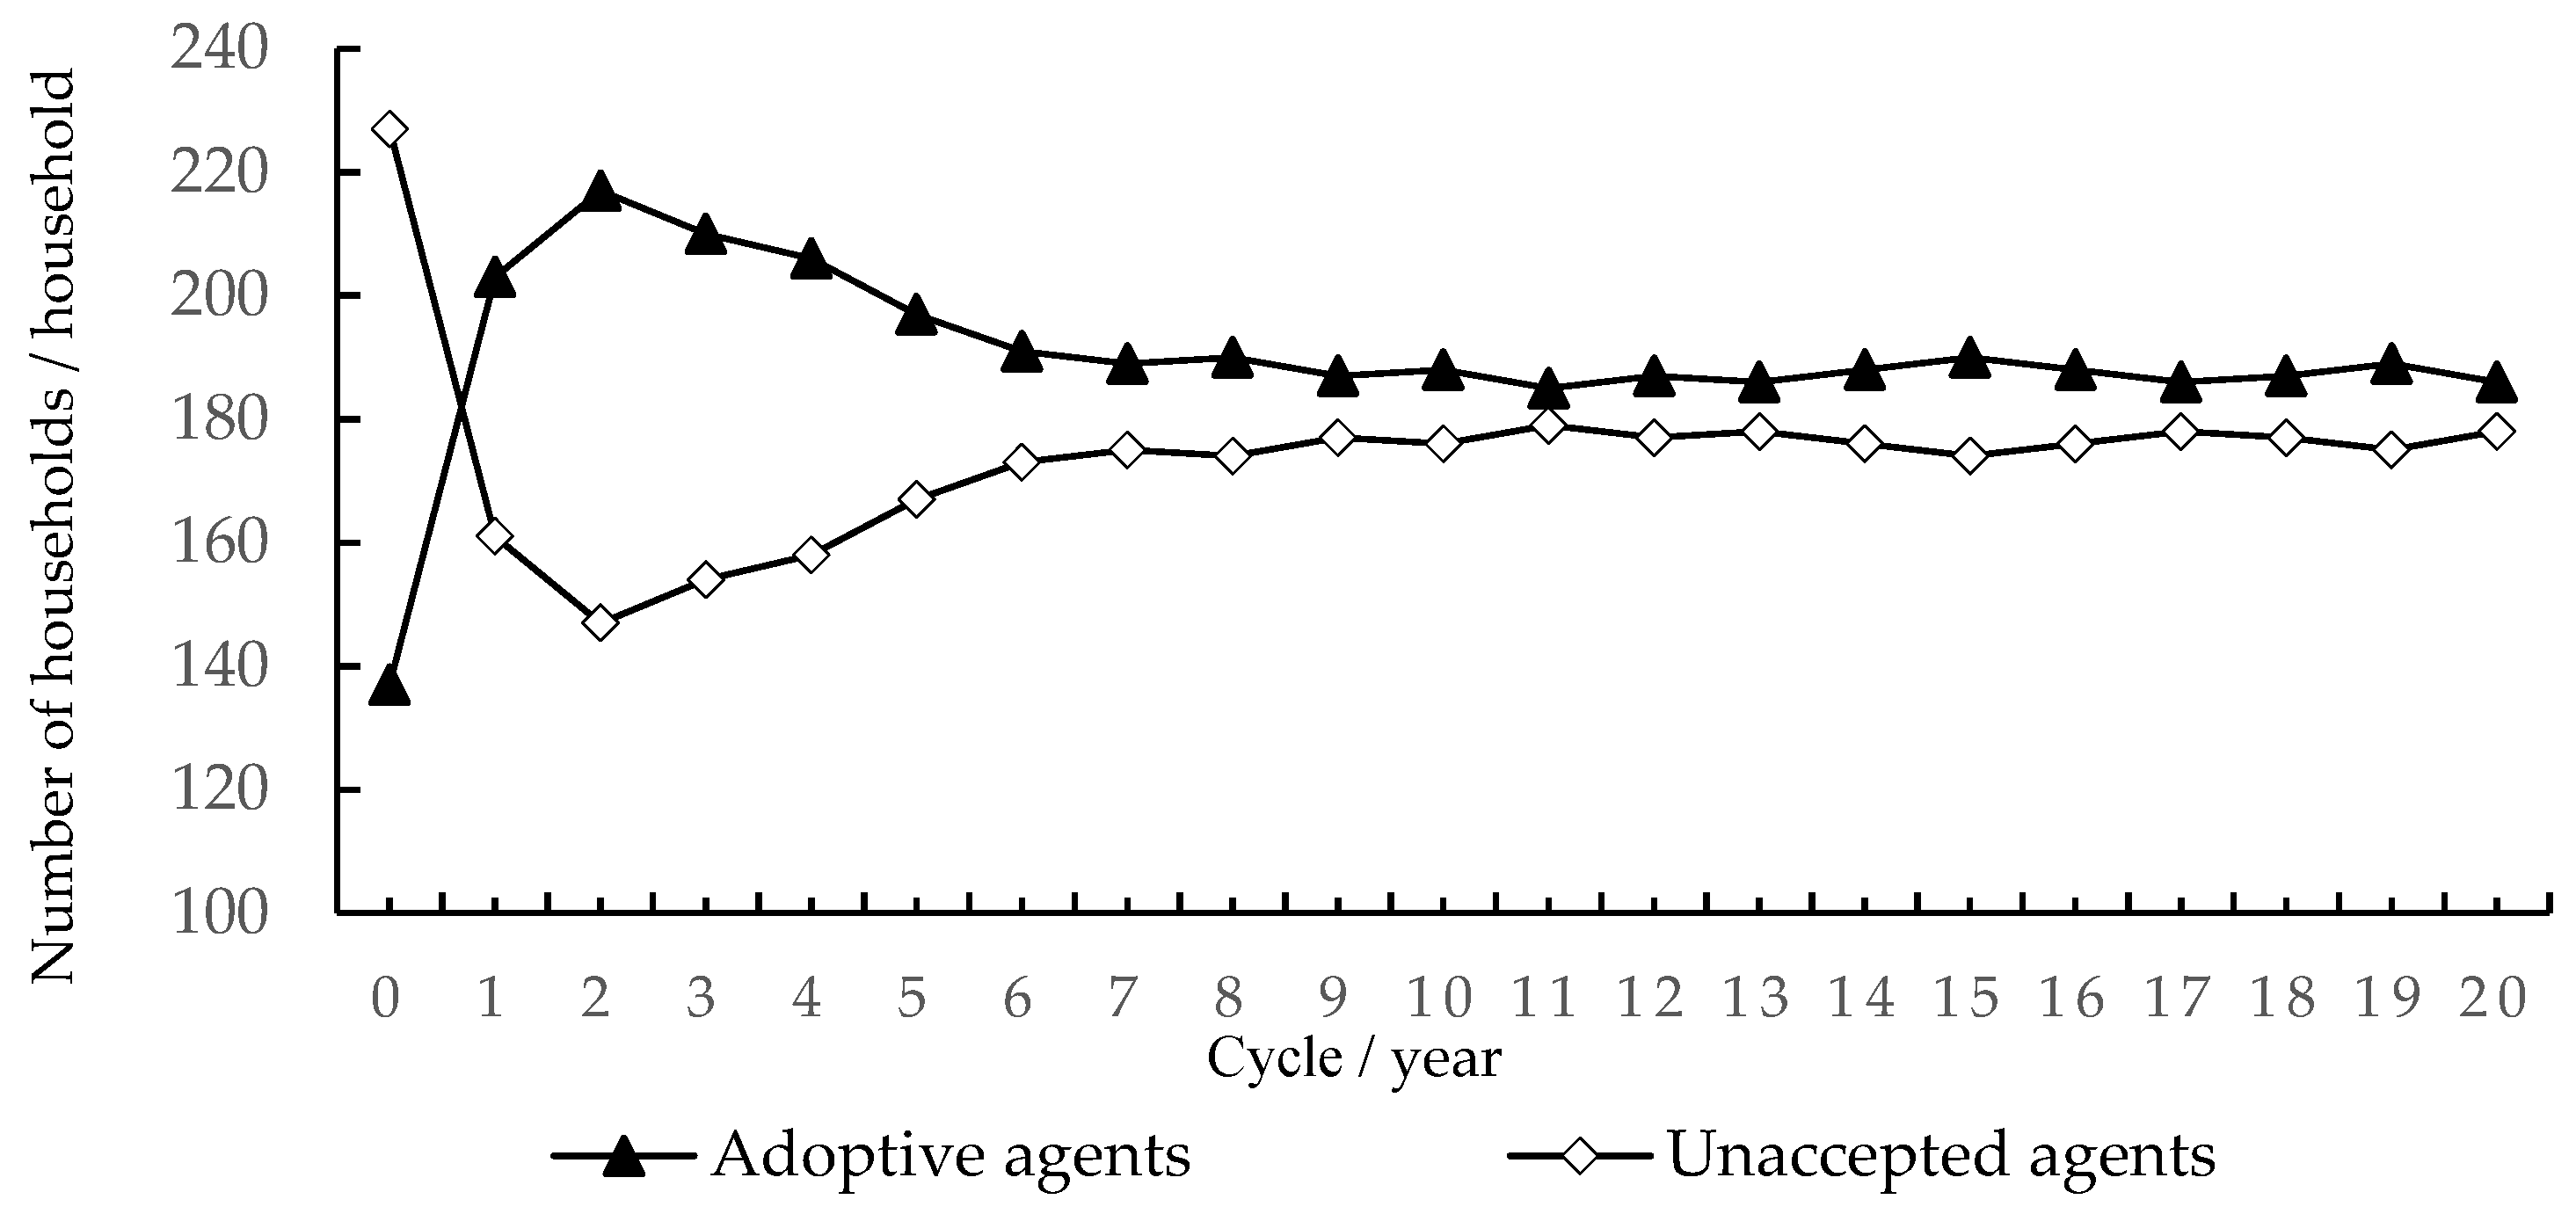
4.1. Model Checking
4.2. Farmers’ Decision Parameters
4.3. Farmers’ Decision-Making Behavior under Information-Induced Policy
4.4. Farmers’ Decision-Making Behavior under Fund–Subsidy Policy
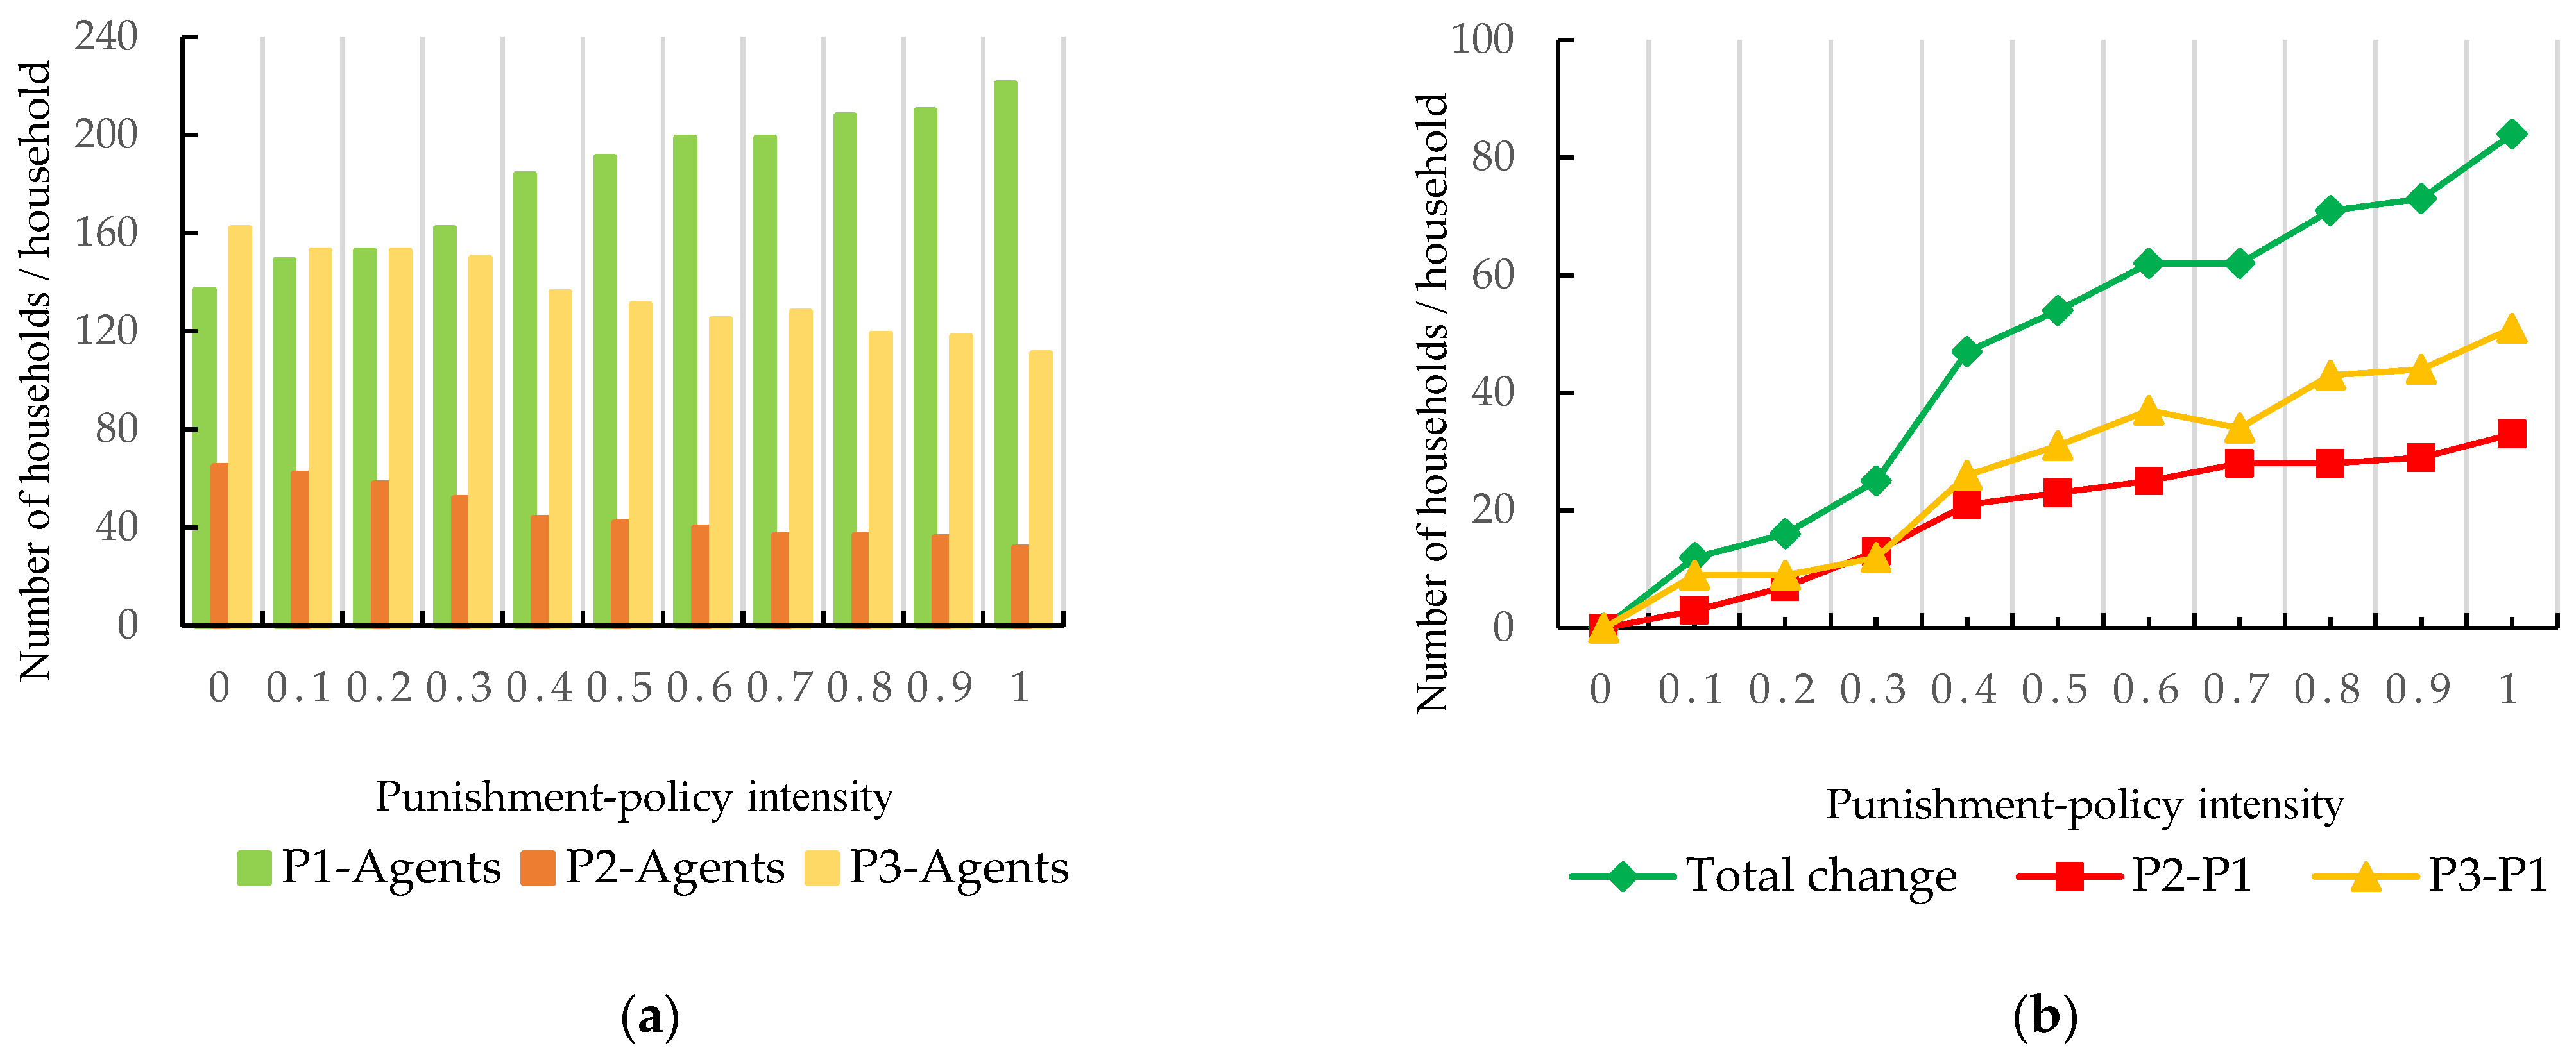
4.5. Farmers’ Decision-Making Behavior under Control-Constrained Policy
4.6. Summary of Results
5. Conclusions and Discussion
Author Contributions
Funding
Institutional Review Board Statement
Informed Consent Statement
Data Availability Statement
Acknowledgments
Conflicts of Interest
References
- Li, W.; Feng, T.T.; Hao, J.M. The evolving concepts of land administration in China: Cultivated land protection perspective. Land Use Policy 2009, 26, 262–272. [Google Scholar] [CrossRef]
- Liu, X.W.; Zhao, C.L.; Song, W. Review of the evolution of cultivated land protection policies in the period following China’s reform and liberalization. Land Use Policy 2017, 67, 660–669. [Google Scholar] [CrossRef]
- Chavez, A.B.; Perz, S.G. Adoption of policy incentives and land use: Lessons from frontier agriculture in southeastern peru. Hum. Ecol. 2012, 40, 525–539. [Google Scholar] [CrossRef]
- Wang, Z.T.; Liu, L.; Chen, Q.; Wen, X.X.; Liao, Y.C. Conservation tillage increases soil bacterial diversity in the dryland of northern China. Agron. Sustain. Dev. 2016, 36, 28. [Google Scholar] [CrossRef] [Green Version]
- He, J.; Li, H.W.; Wang, Q.J.; Gao, H.W.; Li, W.Y.; Zhang, X.M.; McGiffen, M. The adoption of conservation tillage in China. Ecol. Complex. Sustain. 2010, 1195, 96–106. [Google Scholar] [CrossRef]
- Derpsch, R.; Franzluebbers, A.J.; Duiker, S.W.; Reicosky, D.C.; Koeller, K.; Friedrich, T.; Sturny, W.G.; Sa, J.C.M.; Weiss, K. Why do we need to standardize no-tillage research? Soil Tillage Res. 2016, 137, 16–22. [Google Scholar] [CrossRef]
- Liu, B.B.; Wu, Q.R.; Wang, F.; Zhang, B. Is straw return-to-field always beneficial? Evidence from an integrated cost-benefit analysis. Energy 2019, 171, 393–402. [Google Scholar] [CrossRef]
- Zhang, S.X.; Li, Q.; Zhang, X.P.; Wei, K.; Chen, L.J.; Liang, W.J. Effects of conservation tillage on soil aggregation and aggregate binding agents in black soil of Northeast China. Soil Tillage Res. 2012, 124, 196–202. [Google Scholar] [CrossRef]
- He, J.; Li, H.W.; Kuhn, N.J.; Wang, Q.J.; Zhang, X.M. Effect of ridge tillage, no-tillage, and conventional tillage on soil temperature, water use, and crop performance in cold and semi-arid areas in Northeast China. Aust. J. Soil Res. 2010, 48, 737–744. [Google Scholar] [CrossRef]
- Pedersen, A.B.; Nielsen, H.O.; Christensen, T.; Hasler, B. Optimising the effect of policy instruments: A study of farmers’ decision rationales and how they match the incentives in Danish pesticide policy. J. Env. Plamning Manag. 2012, 55, 1094–1110. [Google Scholar] [CrossRef] [Green Version]
- Xu, X.M.; Zheng, F.L.; Wilson, G.V.; He, C.; Lu, J.; Bian, F. Comparison of runoff and soil loss in different tillage systems in the Mollisol region of Northeast China. Soil Tillage Res. 2018, 177, 1–11. [Google Scholar] [CrossRef]
- Pannell, D.J.; Claassen, R. The Roles of Adoption and Behavior Change in Agricultural Policy. Appl. Econ. Perspect. Policy 2020, 4, 31–41. [Google Scholar] [CrossRef]
- Liu, M.; Wu, L.H.; Gao, Y.; Wang, Y.H. Farmers’ adoption of sustainable agricultural technologies: A case study in Shandong Province, China. J. Food Agric. Envirment 2011, 9, 623–628. [Google Scholar]
- Kaine, G.; Young, J.; Lourey, R.; Greenhalgh, S. Policy choice framework: Guiding policy makers in changing farmer behavior. Ecol. Soc. 2017, 22, 2. [Google Scholar] [CrossRef] [Green Version]
- Madarasz, B.; Jakab, G.; Szalai, Z.; Juhos, K.; Kotroczo, Z.; Toth, A.; Ladanyi, M. Long-term effects of conservation tillage on soil erosion in Central Europe: A random forest-based approach. Soil Tillage Res. 2021, 209, 29–43. [Google Scholar] [CrossRef]
- Dai, Z.J.; Hu, J.S.; Fan, J.; Fu, W.; Wang, H.; Hao, M.D. No-tillage with mulching improves maize yield in dryland farming through regulating soil temperature, water and nitrate-N. Agric. Ecosyst. Environ. 2021, 309, 107288. [Google Scholar] [CrossRef]
- Ntshangase, N.L.; Muroyiwa, B.; Sibanda, M. Farmers’ Perceptions and Factors Influencing the Adoption of No-Till Conservation Agriculture by Small-Scale Farmers in Zashuke, KwaZulu-Natal Province. Sustainability 2018, 10, 555. [Google Scholar] [CrossRef] [Green Version]
- Grabowski, P.P.; Kerr, J.M. Resource constraints and partial adoption of conservation agriculture by hand-hoe farmers in Mozambique. Int. J. Agric. Sustain. 2014, 12, 37–53. [Google Scholar] [CrossRef]
- Carlisle, L. Factors influencing farmer adoption of soil health practices in the United States: A narrative review. Agroecol. Sustain. Food Syst. 2016, 4, 583–613. [Google Scholar] [CrossRef]
- Mann, S. Conservation by Innovation: What Are the Triggers for Participation among Swiss Farmers? Ecol. Econ. 2018, 146, 10–16. [Google Scholar] [CrossRef]
- Hou, D.Y.; Ding, Z.Y.; Li, G.H.; Wu, L.H.; Hu, P.J. A Sustainability Assessment Framework for Agricultural Land Remediation in China. Land Degration Dev. 2018, 29, 1005–1018. [Google Scholar] [CrossRef]
- Schieffer, J.; Dillon, C. The economic and environmental impacts of precision agriculture and interactions with agro-environmental policy. Precis. Agric. 2016, 16, 46–61. [Google Scholar] [CrossRef]
- Wu, Y.Z.; Shan, L.P.; Guo, Z.; Peng, Y. Cultivated land protection policies in China facing 2030: Dynamic balance system versus basic farmland zoning. Habitat Int. 2017, 69, 126–138. [Google Scholar] [CrossRef]
- Kuang, B.; Han, J.; Lu, X.H.; Zhang, X.P.; Fan, X.Y. Quantitative evaluation of China’s cultivated land protection policies based on the PMC-Index model. Land Use Policy 2020, 99, 105062. [Google Scholar] [CrossRef]
- Liao, C.N.; Chen, Y.J.; Tang, C.S. Information Provision Policies for Improving Farmer Welfare in Developing Countries: Heterogeneous Farmers and Market Selection. MSom-Manuf. Serv. Oper. Manag. 2019, 21, 254–270. [Google Scholar] [CrossRef] [Green Version]
- Brendan, B.; Ian, N.; Rick, L. Constraints to the utilisation of conservation agriculture in Africa as perceived by agricultural extension service providers. Land Use Policy 2018, 73, 331–340. [Google Scholar]
- Pan, Y.; Wu, J.X.; Zhang, Y.J.; Zhang, X.Z.; Yu, C.Q. Simultaneous enhancement of ecosystem services and poverty reduction through adjustments to subsidy policies relating to grassland use in Tibet, China. Ecosyst. Serv. 2021, 48, 101254. [Google Scholar] [CrossRef]
- Barry, L.E.; Yao, R.T.; Harrison, D.R.; Paragahawewa, U.H.; Pannell, D.J. Enhancing ecosystem services through afforestation: How policy can help. Land Use Policy 2014, 39, 135–145. [Google Scholar] [CrossRef]
- Yadav, D.; Vishwakarma, A.K.; Sharma, N.K.; Biswas, A.K.; Ojasvi, P.R.; Kumar, D.; Kumawat, A.; Singh, D. Sustaining the properties of black soil in Central India through crop residue management in a conservation-agriculture-based soybean-wheat system. Land Degrad. Dev. 2021, 32, 2906–2921. [Google Scholar] [CrossRef]
- Aregay, F.A.; Zhao, M.J.; Xu, T. Knowledge, attitude and behavior of farmers in farmland conservation in China: An application of the structural equation model. J. Environ. Plan. Manag. 2018, 6, 249–271. [Google Scholar] [CrossRef]
- Deng, J.; Sun, P.S.; Zhao, F.Z.; Han, X.H.; Yang, G.H.; Feng, Y.Z. Analysis of the ecological conservation behavior of farmers in payment for ecosystem service programs in eco-environmentally fragile areas using social psychology models. Sci. Total Environ. 2016, 550, 382–390. [Google Scholar] [CrossRef] [PubMed]
- Malawska, A.; Topping, C.J. Evaluating the role of behavioral factors and practical constraints in the performance of an agent-based model of farmer decision making. Agric. Syst. 2016, 143, 136–146. [Google Scholar] [CrossRef]
- Huang, S.Y.; Hu, G.P.; Chennault, C.; Su, L.; Brandes, E.; Heaton, E.; Schulte, L.; Wang, L.Z.; Tyndall, J. Agent-based modeling of bioenergy crop adoption and farmer decision-making. Energy 2016, 115, 1188–1201. [Google Scholar] [CrossRef]
- Valbuena, D.; Verburg, P.H.; Bregt, A.K.; Ligtenberg, A. An agent-based approach to model land-use change at a regional scale. Landsc. Ecol. 2010, 25, 185–199. [Google Scholar] [CrossRef] [Green Version]
- Morgan, F.J. Daigneault, A.J. Estimating Impacts of Climate Change Policy on Land Use: An Agent-Based Modelling Approach. PLoS ONE 2015, 10, 127317. [Google Scholar] [CrossRef]
- Pakravan, M.H.; MacCarty, N. An Agent-Based Model for Adoption of Clean Technology Using the Theory of Planned Behavior. J. Mech. Des. 2021, 143, 21402. [Google Scholar] [CrossRef]
- Singh, D.; Padgham, L.; Logan, B. Integrating BDI Agents with Agent-Based Simulation Platforms. Auton. Agents Multi-Agent Syst. 2016, 30, 1050–1071. [Google Scholar] [CrossRef] [Green Version]
- Mehryar, S.; Sliuzas, R.; Schwarz, N.; Sharifi, A.; van Maarseveen, M. From individual Fuzzy Cognitive Maps to Agent Based Models: Modeling multi-factorial and multi-stakeholder decision-making for water scarcity. J. Environ. Manag. 2019, 250, 109482. [Google Scholar] [CrossRef] [PubMed]
- Mao, H.; Chai, Y.J.; Chen, S.J. Land Tenure and Green Production Behavior: Empirical Analysis Based on Fertilizer Use by Cotton Farmers in China. Int. J. Environ. Res. Public Health 2021, 18, 4677. [Google Scholar] [CrossRef] [PubMed]
- Casali, A.; Godo, L.; Sierra, C. A graded BDI agent model to represent and reason about preferences. Artif. Intell. 2011, 175, 1468–1478. [Google Scholar] [CrossRef] [Green Version]
- Su, C.; Li, H.G. An affective learning agent with Petri-net-based implementation. Appl. Intell. 2012, 37, 569–585. [Google Scholar] [CrossRef]
- Tian, G.J.; Ouyang, Y.; Quan, Q.A.; Wu, J.G. Simulating spatiotemporal dynamics of urbanization with multi-agent systems-A case study of the Phoenix metropolitan region, USA. Ecol. Model. 2011, 222, 1129–1138. [Google Scholar] [CrossRef]
- Liang, X.Y.; Chen, H.; Wang, Y.N.; Song, S.X. Design and application of a CA-BDI model to determine farmers’ land-use behavior. Springerplus 2016, 5, 1581. [Google Scholar] [CrossRef] [PubMed] [Green Version]
- Schmid, A.A. The Spartan School of Institutional Economics at Michigan State University. Res. Hist. Econ. Thought Methodol. 2002, 22, 207–243. [Google Scholar]
- Rutherford, M. American Institutional Economics in the Interwar Period; Blackwell Publishing Ltd.: Hoboken, NJ, USA. [CrossRef]
- Ye, Y.; Fang, X.Q. Land use change in Northeast China in the twentieth century: A note on sources, methods and patterns. J. Hist. Geogr. 2009, 35, 311–329. [Google Scholar] [CrossRef]
- Li, W.B.; Wang, D.Y.; Liu, S.H.; Zhu, Y.L.; Yan, Z.R. Reclamation of Cultivated Land Reserves in Northeast China: Indigenous Ecological Insecurity Underlying National Food Security. Int. J. Environ. Res. Public Health 2020, 17, 1211. [Google Scholar] [CrossRef] [Green Version]
- Qian, F.K.; Chi, Y.R.; Lal, R. Spatiotemporal characteristics analysis of multifunctional cultivated land: A case-study in Shenyang, Northeast China. Land Degrad. Dev. 2020, 31, 1812–1822. [Google Scholar] [CrossRef]
- Thiele, J.C.; Grimm, V. NetLogo meets R: Linking agent-based models with a toolbox for their analysis. Environ. Model. Softw. 2010, 25, 972–974. [Google Scholar] [CrossRef]
- Niazi, M.; Hussain, A. Agent-Based Tools for Modeling and Simulation of Self-Organization in Peer-to-Peer, Ad Hoc, and Other Complex Networks. IEEE Commun. Mag. 2009, 47, 166–173. [Google Scholar] [CrossRef] [Green Version]
- Rebaudo, F.; Rouzic, A.L.; Dupas, S.; Silvain, J.F.; Harry, M.; Dangles, O. SimAdapt: An individual-based genetic model for simulating landscape management impacts on populations. Methods Ecol. Evol. 2013, 4, 595–600. [Google Scholar] [CrossRef]
- Banitz, T.; Gras, A.; Ginovart, M. Individual-based modeling of soil organic matter in NetLogo: Transparent, user-friendly, and open. Environ. Model. Softw. 2015, 71, 39–45. [Google Scholar] [CrossRef]
- Wang, H.Z.; Mostafizi, A.; Cramer, L.A.; Cox, D.; Park, H. An agent-based model of a multimodal near-field tsunami evacuation: Decision-making and life safety. Transp. Res. Part C-Emerg. Technol. 2016, 64, 86–100. [Google Scholar] [CrossRef]
- Li, H.; Dai, M.; Dai, S.L.; Dong, X.J. Current status and environment impact of direct straw return in China’s cropland—A review. Ecotoxicol. Environ. Saf. 2018, 159, 293–300. [Google Scholar] [CrossRef] [PubMed]
- Hong, J.L.; Ren, L.J.; Hong, J.M.; Xu, C.Q. Environmental impact assessment of corn straw utilization in China. J. Clean. Prod. 2016, 112, 1700–1708. [Google Scholar] [CrossRef]


| Index | Value | Frequency | Proportion | Index | Value | Frequency | Proportion |
|---|---|---|---|---|---|---|---|
| Age | Under 30 years old | 14 | 3.85 | Proportion of agricultural income | <50% | 268 | 73.63 |
| 30–40 years old | 52 | 14.29 | >=50% | 96 | 26.37 | ||
| 41–50 years old | 142 | 39.01 | Net agricultural population | 0–1 people | 127 | 34.89 | |
| 51–60 years old | 104 | 28.57 | 2–3 people | 224 | 61.54 | ||
| Over 60 years old | 52 | 14.28 | 4 people | 13 | 3.57 | ||
| Education | Primary school | 86 | 23.63 | Fineness degree of cultivated land | <=5 pieces | 248 | 68.13 |
| Junior middle school | 249 | 68.41 | 5–10 pieces | 98 | 26.92 | ||
| High school and above | 29 | 7.96 | 10–15 pieces | 16 | 4.39 | ||
| Risk attitude | Risk preference | 164 | 45.05 | 15–20 pieces | 1 | 0.28 | |
| Risk neutral | 90 | 24.73 | >20 pieces | 1 | 0.28 | ||
| Risk aversion | 110 | 30.22 | Ownership of agricultural machinery | yes | 74 | 20.33 | |
| Social stratum | Village cadres | 62 | 17.03 | no | 290 | 79.67 | |
| Non-village cadres | 302 | 82.97 | Cultivated land scale | <3.3 hectares | 284 | 78.02 | |
| Group psychology | yes | 311 | 85.44 | 3.3–6.7 hectares | 43 | 11.81 | |
| no | 53 | 14.56 | >6.7 hectares | 37 | 10.17 |
| Name | Assignment Description | Mean | Standard Deviation | Minimum | Maximum |
|---|---|---|---|---|---|
| Adopted or not | Whether straw mulching technology is adopted? 1 = yes; 0 = no | 0.376 | 0.485 | 0 | 1 |
| Age | What is your age? 1 =< 30; 2 = 30~40; 3 = 41~50; 4 = 51~60; 5 => 60 years old. | 3.352 | 1.016 | 1 | 5 |
| Education | What is your educational background? 1 = primary school and below; 2 = junior high school; 3 = high school and above. | 1.843 | 0.54 | 1 | 3 |
| Social stratum | Are you a village cadre? 1 = yes; 0 = no. | 0.17 | 0.376 | 0 | 1 |
| Risk attitude | Are you willing to take risks and losses in order to obtain more income? 1 = totally disagree; 2 = disagree; 3 = General; 4 = relatively agreed; 5 = fully agree. | 3.206 | 1.049 | 1 | 5 |
| Number of farmers | What is the number of pure business farmers in your family? The value is 0–4 persons. | 1.712 | 0.807 | 0 | 4 |
| Farmland fragmentation | What is the number of cultivated land plots in your family? 1 =< 5; 2= 5~10; 3 = 10~15; 4 = 15~20; 5 = > 20 pieces. | 1.372 | 0.606 | 1 | 5 |
| Agricultural machinery | Does your family have agricultural machinery facilities? 1 = yes; 0 = no. | 0.203 | 0.403 | 0 | 1 |
| Proportion of agricultural income | What is the proportion of your family’s agricultural income? 1 = 0–20%; 2 = 20–40%; 3 = 40–60%; 4 = 60–80%; 5 = 80~100%. | 3.728 | 1.068 | 1 | 5 |
| Environmental awareness | Do you think straw mulching can protect the environment? 1 = totally disagree; 2 = disagree; 3 = General; 4 = relatively agreed; 5 = fully agree. | 3.887 | 0.945 | 1 | 5 |
| Benefit cognition | Do you think straw mulching technology can improve crop yield? 1 = totally disagree, 2 = not quite agree, 3 = average, 4 = relatively agree, 5 = totally agree. | 3.967 | 1.033 | 1 | 5 |
| Intention | Decision | Characteristics | Behavior Description |
|---|---|---|---|
| IT < IT+1 | Random selection | It is easy to make random changes to farming techniques. | : Maintain the status quo. |
| : Farmers randomly transformed into “P1” or “P3” type. | |||
| : Randomly transformed into “P1” type farmers. | |||
| IT = IT+1 | Emulate relatives and friends | Easily influenced by social networks to make changes. | : If more than half of the “P2” and “P3” farmer are present, they will be randomly transformed into “P2” or “P3” farmers. |
| : If more than half of the surrounding “P1” and “P3” farmers are randomly transformed into “P1” or “P3” farmers. | |||
| : If more than half of the “P1” type farmers are present, they will be randomly transformed into “P1” type farmers; If more than half of the “P2” type farmers are around, they will be randomly transformed into “P2” type farmers. | |||
| IT > IT+1 | Choose carefully | It is not easy to change the choice of farming technology. | : If the intention value is greater than the average value of “P1”, follow the example of relatives and friends; on the contrary, maintain the status quo. |
| : If the intended value is greater than the average value of “P2”, follow the example of relatives and friends; on the contrary, maintain the status quo. | |||
| : If the intended value is greater than the average value of “P3”, follow the example of relatives and friends; on the contrary, maintain the status quo. |
| Variable | Non-standardized Coefficient | Standardization Factor | Significance | Model Setting | ||
|---|---|---|---|---|---|---|
| Coefficient | Standard Error | Beta | Result | Weight | ||
| Age | 0.044 | 0.020 | 0.093 | 0.028 | Keep | 0.076 |
| Risk attitude | 0.038 | 0.019 | 0.083 | 0.051 | Keep | 0.068 |
| Cultivated land fragmentation | 0.065 | 0.028 | 0.100 | 0.020 | Keep | 0.082 |
| Social class | 0.282 | 0.051 | 0.233 | 0.000 | Keep | 0.190 |
| Agricultural machinery | 0.241 | 0.049 | 0.208 | 0.000 | Keep | 0.170 |
| Benefit perception | 0.089 | 0.021 | 0.189 | 0.000 | Keep | 0.154 |
| Environmental awareness | 0.163 | 0.023 | 0.318 | 0.000 | Keep | 0.260 |
| Education | −0.021 | −0.04 | −0.024 | 0.582 | Remove | 0.000 |
| Number of farmers | 0.023 | 0.025 | 0.039 | 0.347 | Remove | 0.000 |
| Proportion of agricultural income | 0.024 | 0.019 | 0.053 | 0.216 | Remove | 0.000 |
| Constant | −1.266 | 0.167 | - | - | - | - |
| Type | Basic Cost | Cost Saving | Total Cost | Relative Cost | ||
|---|---|---|---|---|---|---|
| Cost Structure | Yuan/ha | Cost Structure | Yuan/ha | Yuan/ha | ||
| Returning straw to the field (P1) | Production cost + crusher cost | 10,162.80 | Compound fertilizer cost | 450.00 | 9712.80 | 1.013 |
| Straw burning (P2) | Production cost | 9562.80 | Pesticide cost | 14.37 | 9347.25 | 0.981 |
| Other types (P3) | Production cost | 9562.80 | - | - | 9562.80 | 0.997 |
| Total cost average | 9591.3 | 1.000 | ||||
| Type | Time Characteristics | Strength Characteristics | ||||
|---|---|---|---|---|---|---|
| Features | Timeliness | Stationary Period | Features | Optimal Strength | Optimal Strength Utility | |
| Information-induced | Increase first, decrease, then stabilize | One to three years | Seven years later | The effect gradually increases with intensity | 1.0 | 190 adopters |
| Fund-subsidy | One to two years | Nine years later | The effect is multiplied by the rapid increase in the early stage and the slow increase trend in the later stage | 0.4–0.7 | 247 adopters | |
| Control-constrained | One to two years | Seven years later | As the intensity increases, the utility is smaller in the early stage and larger in the later stage | >0.3 | 247 adopters | |
Publisher’s Note: MDPI stays neutral with regard to jurisdictional claims in published maps and institutional affiliations. |
© 2021 by the authors. Licensee MDPI, Basel, Switzerland. This article is an open access article distributed under the terms and conditions of the Creative Commons Attribution (CC BY) license (https://creativecommons.org/licenses/by/4.0/).
Share and Cite
Liu, H.; Wu, M.; Liu, X.; Gao, J.; Luo, X.; Wu, Y. Simulation of Policy Tools’ Effects on Farmers’ Adoption of Conservation Tillage Technology: An Empirical Analysis in China. Land 2021, 10, 1075. https://doi.org/10.3390/land10101075
Liu H, Wu M, Liu X, Gao J, Luo X, Wu Y. Simulation of Policy Tools’ Effects on Farmers’ Adoption of Conservation Tillage Technology: An Empirical Analysis in China. Land. 2021; 10(10):1075. https://doi.org/10.3390/land10101075
Chicago/Turabian StyleLiu, Hongbin, Mengyao Wu, Xinhua Liu, Jiaju Gao, Xiaojuan Luo, and Yan Wu. 2021. "Simulation of Policy Tools’ Effects on Farmers’ Adoption of Conservation Tillage Technology: An Empirical Analysis in China" Land 10, no. 10: 1075. https://doi.org/10.3390/land10101075