Article

Application of the Adapted Approach for Crop Management Factor to Assess Soil Erosion Risk in an Agricultural Area of Rwanda

by
Albert Poponi Maniraho
1,2,3,4,
Richard Mind’je
1,2,3,4,
Wenjiang Liu
5,
Vincent Nzabarinda
1,3,
Patient Mindje Kayumba
1,3,4,
Lamek Nahayo
4,
Adeline Umugwaneza
1,3,4,
Solange Uwamahoro
1,3 and
Lanhai Li
1,2,3,5,6,*
1
State Key Laboratory of Desert and Oasis Ecology, Xinjiang Institute of Ecology and Geography, Chinese Academy of Sciences, 818 South Beijing Road, Urumqi 830011, China
2
Ili Station for Watershed Ecosystem Research, Chinese Academy of Sciences, Urumqi 835800, China
3
University of Chinese Academy of Sciences, Beijing 100049, China
4
Faculty of Environmental sciences, University of Lay Adventists of Kigali (UNILAK), Kigali 6392, Rwanda
5
CAS Research Center for Ecology and Environment of Central Asia, 818 South Beijing Road, Urumqi 830011, China
6
Xinjiang Key Laboratory of Water Cycle and Utilization in Arid Zone, Urumqi 830011, China
*
Author to whom correspondence should be addressed.
Land 2021, 10(10), 1056; https://doi.org/10.3390/land10101056
Submission received: 25 September 2021 / Revised: 3 October 2021 / Accepted: 4 October 2021 / Published: 8 October 2021
(This article belongs to the Topic Climate Change and Environmental Sustainability)

Abstract

:
Land use and land cover (LULC) management influences the severity of soil erosion risk. However, crop management (C) is one factor of the Revised Universal Soil Loss Equation (RUSLE) model that should be taken into account in its determination, as it influences soil loss rate estimations. Thus, the present study applied an adapted C-factor estimation approach (CvkA) modified from the former approach (Cvk) to assess the impact of LULC dynamics on soil erosion risk in an agricultural area of Rwanda taking the western province as a case study. The results disclosed that the formerly used Cvk was not suitable, as it tended to overestimate C-factor values compared with the values obtained from t CvkA. An approximated mean soil loss of 15.1 t ha−1 yr−1, 47.4 t ha−1 yr−1, 16.3 t ha−1 yr−1, 66.8 t ha−1 yr−1 and 15.3 t ha−1 yr−1 in 2000, 2005, 2010, 2015 and 2018, respectively, was found. The results also indicated that there was a small increase in mean annual soil loss from 15.1 t ha−1 yr−1 in 2000 to 15.3 t ha−1 yr−1 in 2018 (1.3%). Moreover, the soil erosion risk categories indicated that about 57.5%, 21.8%, 64.9%, 15.5% and 73.8% had a sustainable soil erosion rate tolerance (≤10 t ha−1 yr−1), while about 42.5%, 78.2%, 35.1%, 84.5% and 16.8% had an unsustainable mean soil erosion rate (>10 t ha−1 yr−1) in 2000, 2005, 2010, 2015 and 2018, respectively. A major portion of the area fell under the high and very high probability zones, whereas only a small portion fell under the very low, low, moderate and extremely high probability zones. Therefore, the CvkA approach presents the most suitable alternative to estimate soil loss in the western province of Rwanda with reasonable soil loss prediction results. The study area needs urgent intervention for soil conservation planning, taking into account the implementation of effective conservation practices such as terracing for soil erosion control.

1. Introduction

Globally, soil erosion incidences enhanced by human activities have been a serious environmental problem since the last century [1]. They are a known risk factor to an ecosystem’s integrity and cause major environmental impacts, including a reduction in agricultural productivity; they can even affect the freshwater ecology of different regions. Previous studies have reported a soil loss of approximately 73.5 Pg yr−1 in agricultural land [2,3]. Topography, soil characteristics, local climatic conditions and land use are considered as the main influencing factors of increasing soil erosion risks [3,4,5].
However, it is not easy to estimate soil loss without relating it to various human, natural or physical processes. Quantitative and qualitative descriptions of soil erosion have been executed by field observations and measurements and via meta-analyses of soil erosion levels [6]. Owing to the scarcity of in situ or field data, as well as their expensiveness and time-consuming aspects, researchers have established quantitative soil-erosion modeling approaches that apply physical factors including topography, climate, soil features and vegetation type, with the aim of mapping spatial distribution rates to better understand the mechanisms of soil erosion. Moreover, these erosions provide a clear understanding of natural phenomena such as the transportation and deposit of sediment, including soil erosion prediction [7,8].
It is difficult to find a model that matches all types of erosion. This situation contributes to the intricacy in identifying areas prone to practicing soil conservation measures in terms of a reduction in soil loss. Therefore, the development and planification of numerous alternative land-use scenarios are of great significance as far as the management of soil erosion risk is concerned [9].
The primary challenge in modeling soil erosion risk is mostly associated with accuracy assessments, especially in data-scarce regions such as Rwanda [4]. Therefore, it is challenging to determine the degree of risk without the existence of numerous soil erosion models. For the prediction of soil erosion, different approaches have been proposed by different authors depending on study objectives, time, data availability and spatial scales [10,11,12]. The approaches for modeling soil erosion are easily understandable because of their powerful reliance on geospatial techniques that include remote sensing (RS) and geographic information system (GIS) platforms [11]. To this end, the USLE (Universal Soil Loss Equation) and its modified form, RUSLE (the Revised Universal Soil Loss Equation), proposed by [13], are largely applied due to their ability to integrate the aforementioned geospatial techniques. The integrated application of RUSLE and GIS combined with RS technology has been verified as an effective approach for assessing the spatial variability of soil erosion occurrence and its drivers [11,14,15,16,17].
In Rwanda, studies have applied the RUSLE model to simulate soil erosion at both national and local scales. However, those considering agricultural areas are still understudied. Among the few existing studies, Nyesheja and Chen [18] modeled soil erosion in the Congo Nile Ridge region of Rwanda by estimating serious soil loss from different land use/land cover (LULC) types such as grasslands, forestlands and farmlands that expressed impaired ecosystems. Additionally, Byizigiro et al. [19] estimated soil erosion in the Ngororero district taking the Satinskyi Catchment as a case and disclosed the geomorphological features and processes of the area to be the major natural factors that aggravated increased soil erosion rates pronounced in the area. In conjunction with its seven-year development strategies on the sensitization of the population regarding aspects related to soil conservation, Niyonsenga et al. [20] considered the Nyamasheke district to spatially analyze the unknown sensitivity of soil erosion. They reported that soil erosion and the associated high level of land degradation caused by vegetation cover change are leading to a loss in fertile soil in the area.
Nevertheless, keeping the basic form of the RUSLE equation, these studies presented the overestimation of the crop management (C) factor, which seemed to provide unsatisfactory results in the considered areas [21,22]. In addition, all the above-mentioned studies were limited to only the district and catchment scales of the province opposite this study, which considered the agricultural areas of the entire western province. Useful information related to LULC change, erosional features such as rainfall interception and gullies has been delivered by multi-temporal satellite images to analyze the LULC change in relation to soil erosion hazards at a regional scale [23]. LULC change is central to the study of global environmental change, including land degradation [24]. It is the most significant indicator between a natural environment and human activity. Rwanda is considered one of the regions highly vulnerable to water-induced soil erosion [25]. This is because of its rapid population growth with a low economic base, poor agricultural practices, fragile soil [26] and steep topography, which contributes to heavy rainfall [27]. Similarly, the effects of LULC change studies have been conducted at different small watersheds at district, national, regional and global levels [11,28,29,30]. All these studies agree on the strong influence of land-use change on soil erosion.
Rwanda has experienced a significant regional change in its land-use patterns, especially in the western province, with limited scientific studies tackling this issue. In line with this, Nambajimana and He [21] used the RUSLE model for Land-Use Change Impacts on water erosion in Rwanda and identified the driving forces of soil erosion; however, this study was limited by its inability to capture degraded areas in its impact assessment. This can have some unforeseen significant impacts on land area and the wellbeing of local residents. Based on this background and the context of evolving land-use changes in Rwanda, this present study intends to address all of the above-mentioned shortcomings in the previous studies, and establish an adapted approach that is suitable for the estimation of C-factor in the RUSLE model that exhibits overestimated values. Thus, the objectives of this study are to: (a) examine the adapted approach for the estimation of the crop management (C) factor in the western province of Rwanda; (b) analyze the LULC changes and their impacts on soil erosion risk; (c) estimate the potential annual soil loss rate for the study area; and (d) delineate the spatial distribution of soil erosion probability zones. Addressing these objectives will fill the knowledge gap in identifying the most degraded parts of agricultural lands in the study area, which is crucial for effective soil conservation planning and environmental management.

2. Datasets and Methods
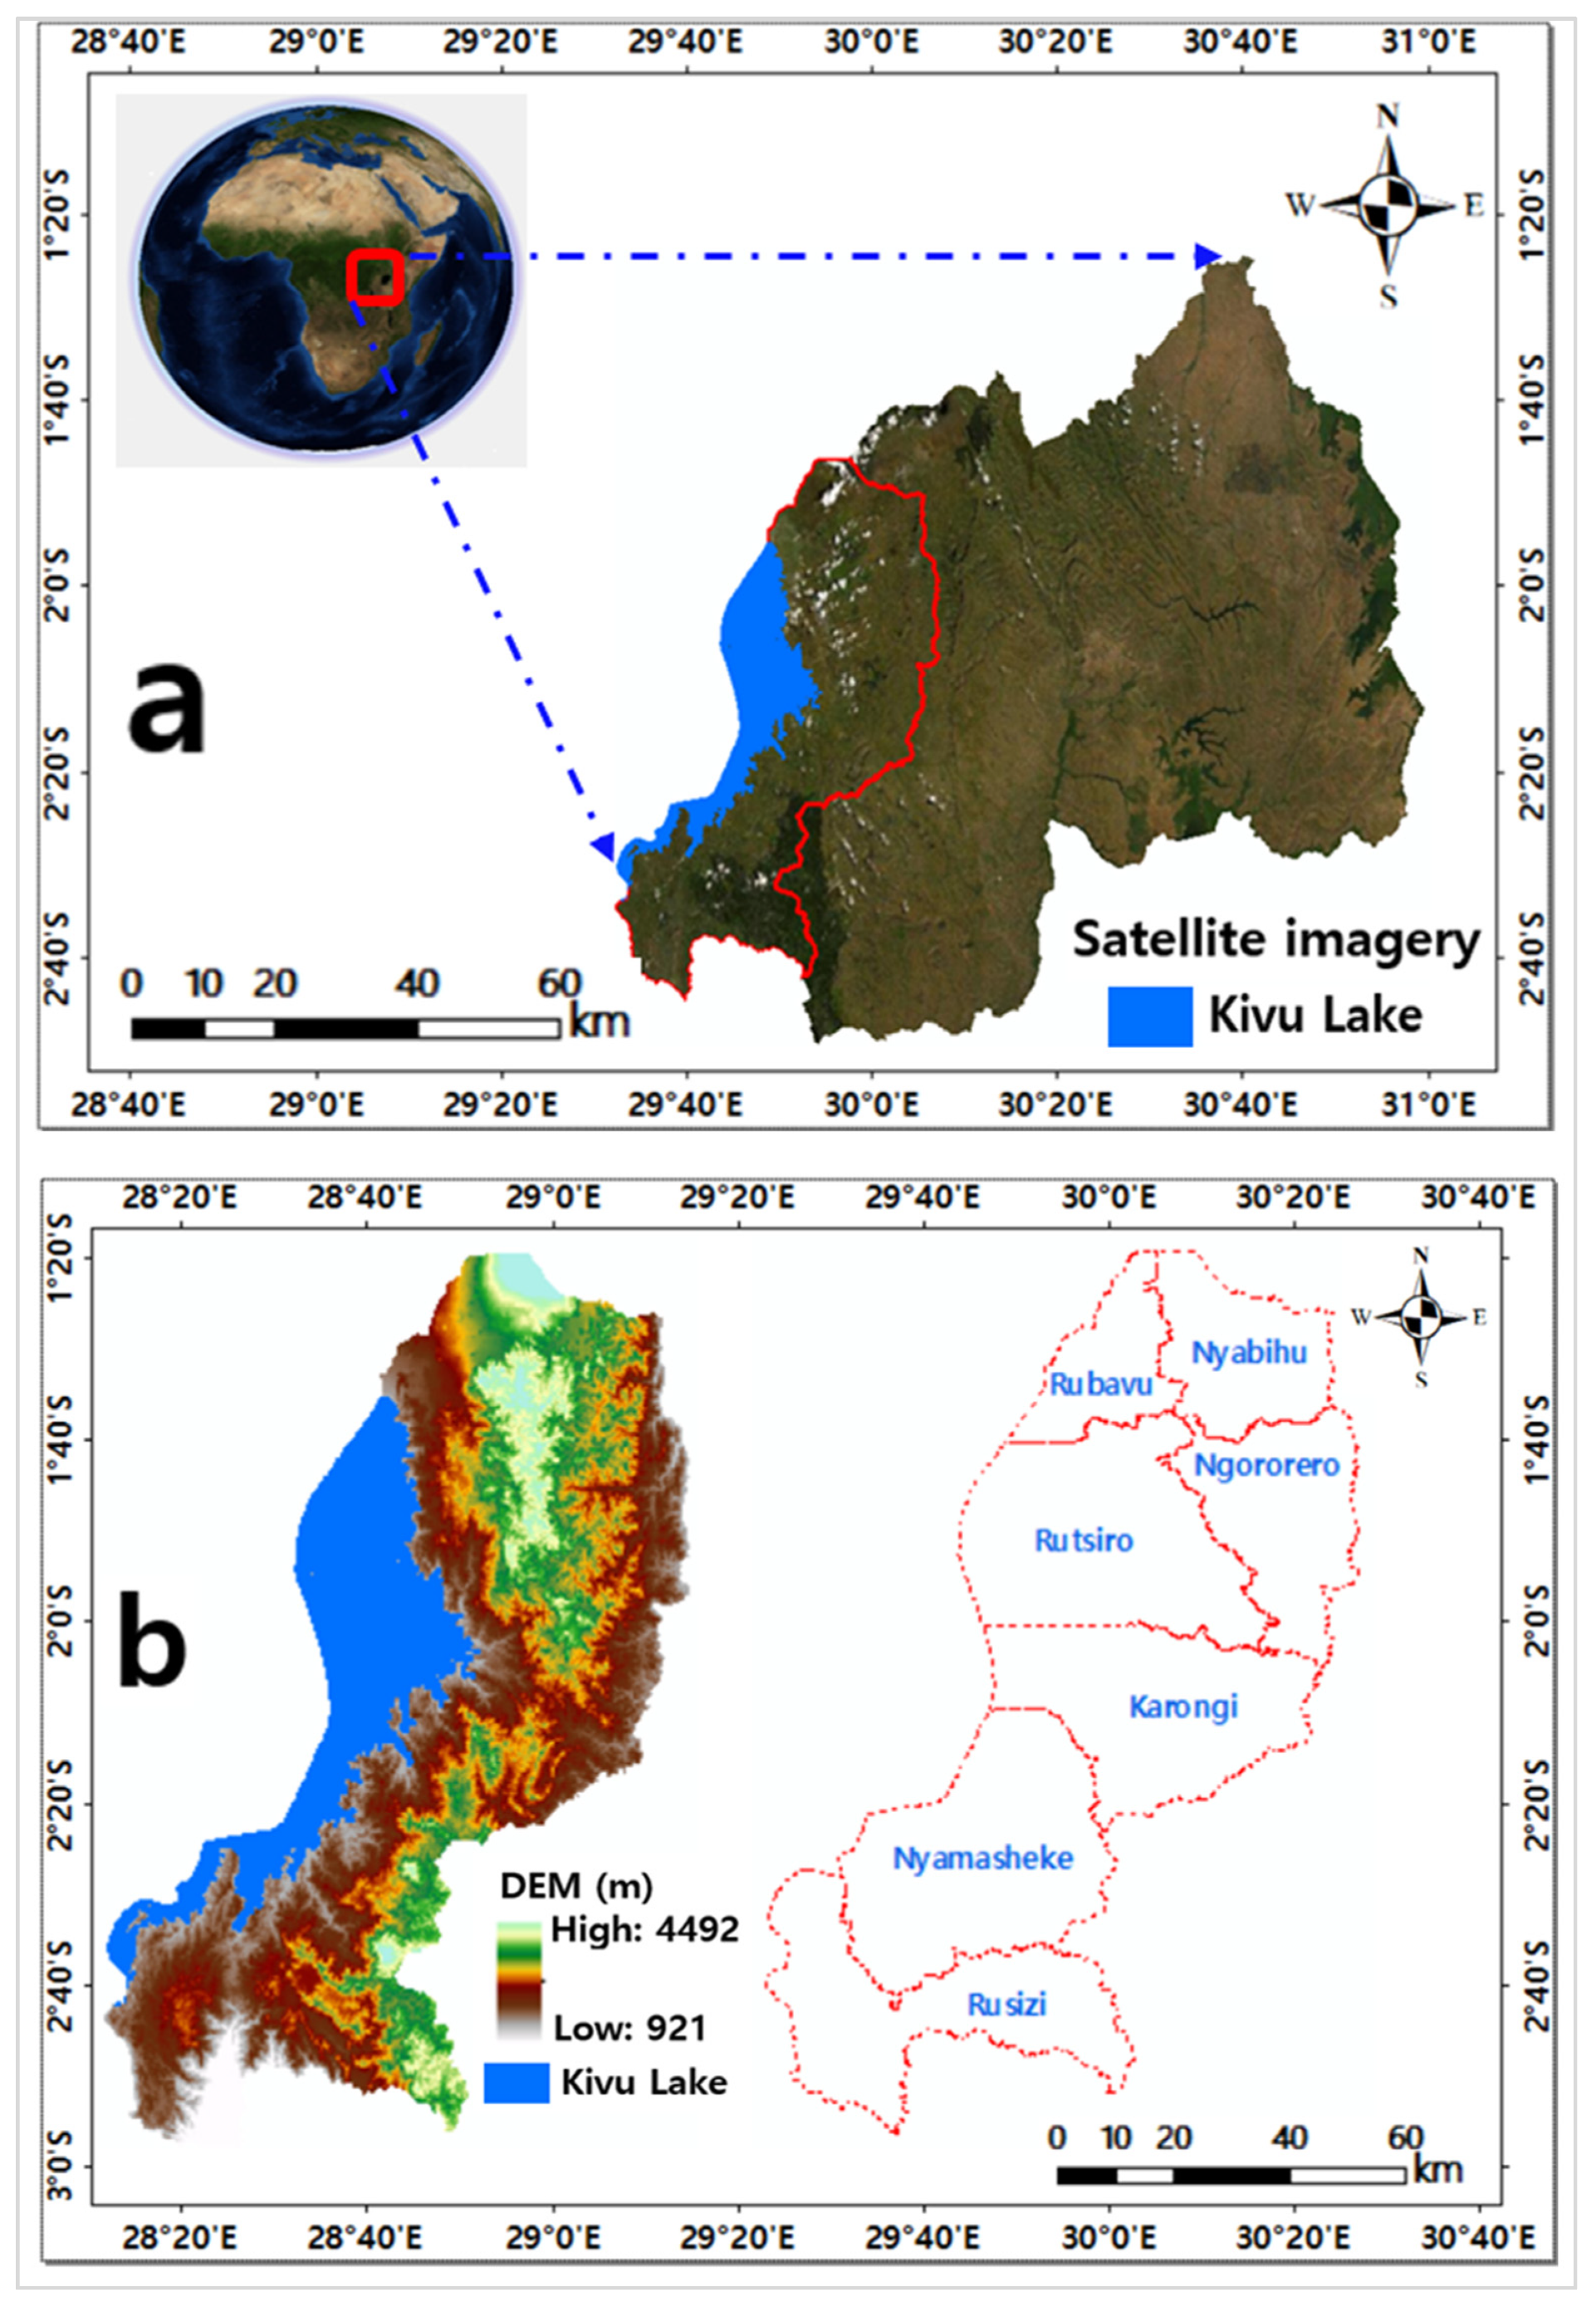
2.1. Study Area

The study covers the entire western part of Rwanda with −2° 22’” and 17.99” south latitude and 29°12” and 21°00” east longitude spatial coordinates. It is made of seven districts, namely Ngororero, Karongi, Rubavu, Nyabihu, Rutsiro, Rusizi and Nyamasheke (Figure 1). The area is mountainous and covers 5883 km2, with the highest altitude in the country. It has an elevation ranging between 921 m and 4492 m, with an annual average temperature of 18°C. The country’s climate is made up of four seasons, namely the long dry (June–September), short dry (mid-December–mid-February), long rainy (late February–late May) and short rainy (late September–early December) seasons [31]. The area receives up to 1800 mm annual rainfall, which usually contributes to high average runoff [18]. High annual precipitation and steep topography (> 26°) constitute major natural factors that influence morphological developments in the area. The latter is aggravated by agriculture and mining operations, which contribute to increased soil erosion rates observed in the area.

2.2. Data and Preprocessing

For the successful application of the RUSLE model in this study, GIS and RS techniques were used for satellite data processing and analysis. The Landsat 7 ETM+ and Landsat 8 OLI-TIRS images (30 m × 30 m, WRS path 172 and rows 61) products were acquired from the United States Geological Survey (USGS) EROS data center. These images were pre-processed for radiometric and atmospheric rectification [32] and then used for calculating the vegetation index, as well as LULC classification using a supervised maximum classification algorithm supported by expert judgment and ground truth observation. The main land-cover classes were water bodies, forest, grassland, cropland, wetland and settlements. In addition, the Digital Elevation Model (SRTM-DEM) at 30 m resolution (http://www.earthexplorer.usgs.gov, accessed on 4 October 2021) was acquired to calculate the flow accumulation and the slope gradient (degrees), which were both used to generate the factors representing the length of the slope and its steepness (LS). Moreover, a soil-type map from the Food and Agriculture Organization of the United Nations (FAO) was used in addition to meteorological data (rainfall) acquired from the Rwanda Meteorological Agency. Further details of the datasets are illustrated in Table 1.

2.3. Estimations Based of RUSLE Model

RUSLE is an erosion empirical model aiming to predict the long-term averages of soil loss per year caused by runoff from specific slopes area in specified cropping and management systems. The RUSLE model collects many factors on the process of soil erosion into different groups (relief, climate, vegetation, land use, soil profile and the practice of land management). These five groups are subdivided as soil erosion factors, including the rainfall erosivity (R) factor, the soil erodibility (K) factor, the slope length and slope steepness (LS) factor, the crop management (C) factor and the erosion management practice (P) factor. The expected soil loss in t/ha/yr was estimated by multiplying these factors’ values based on the dimensions used in the climate and soil factor.
The RUSLE equation is given below:
A = R   ×   K   ×   LS   ×   C   ×   P
where A is the estimated spatial average soil loss and temporal average soil loss per unit area, expressed in t/ha/yr.

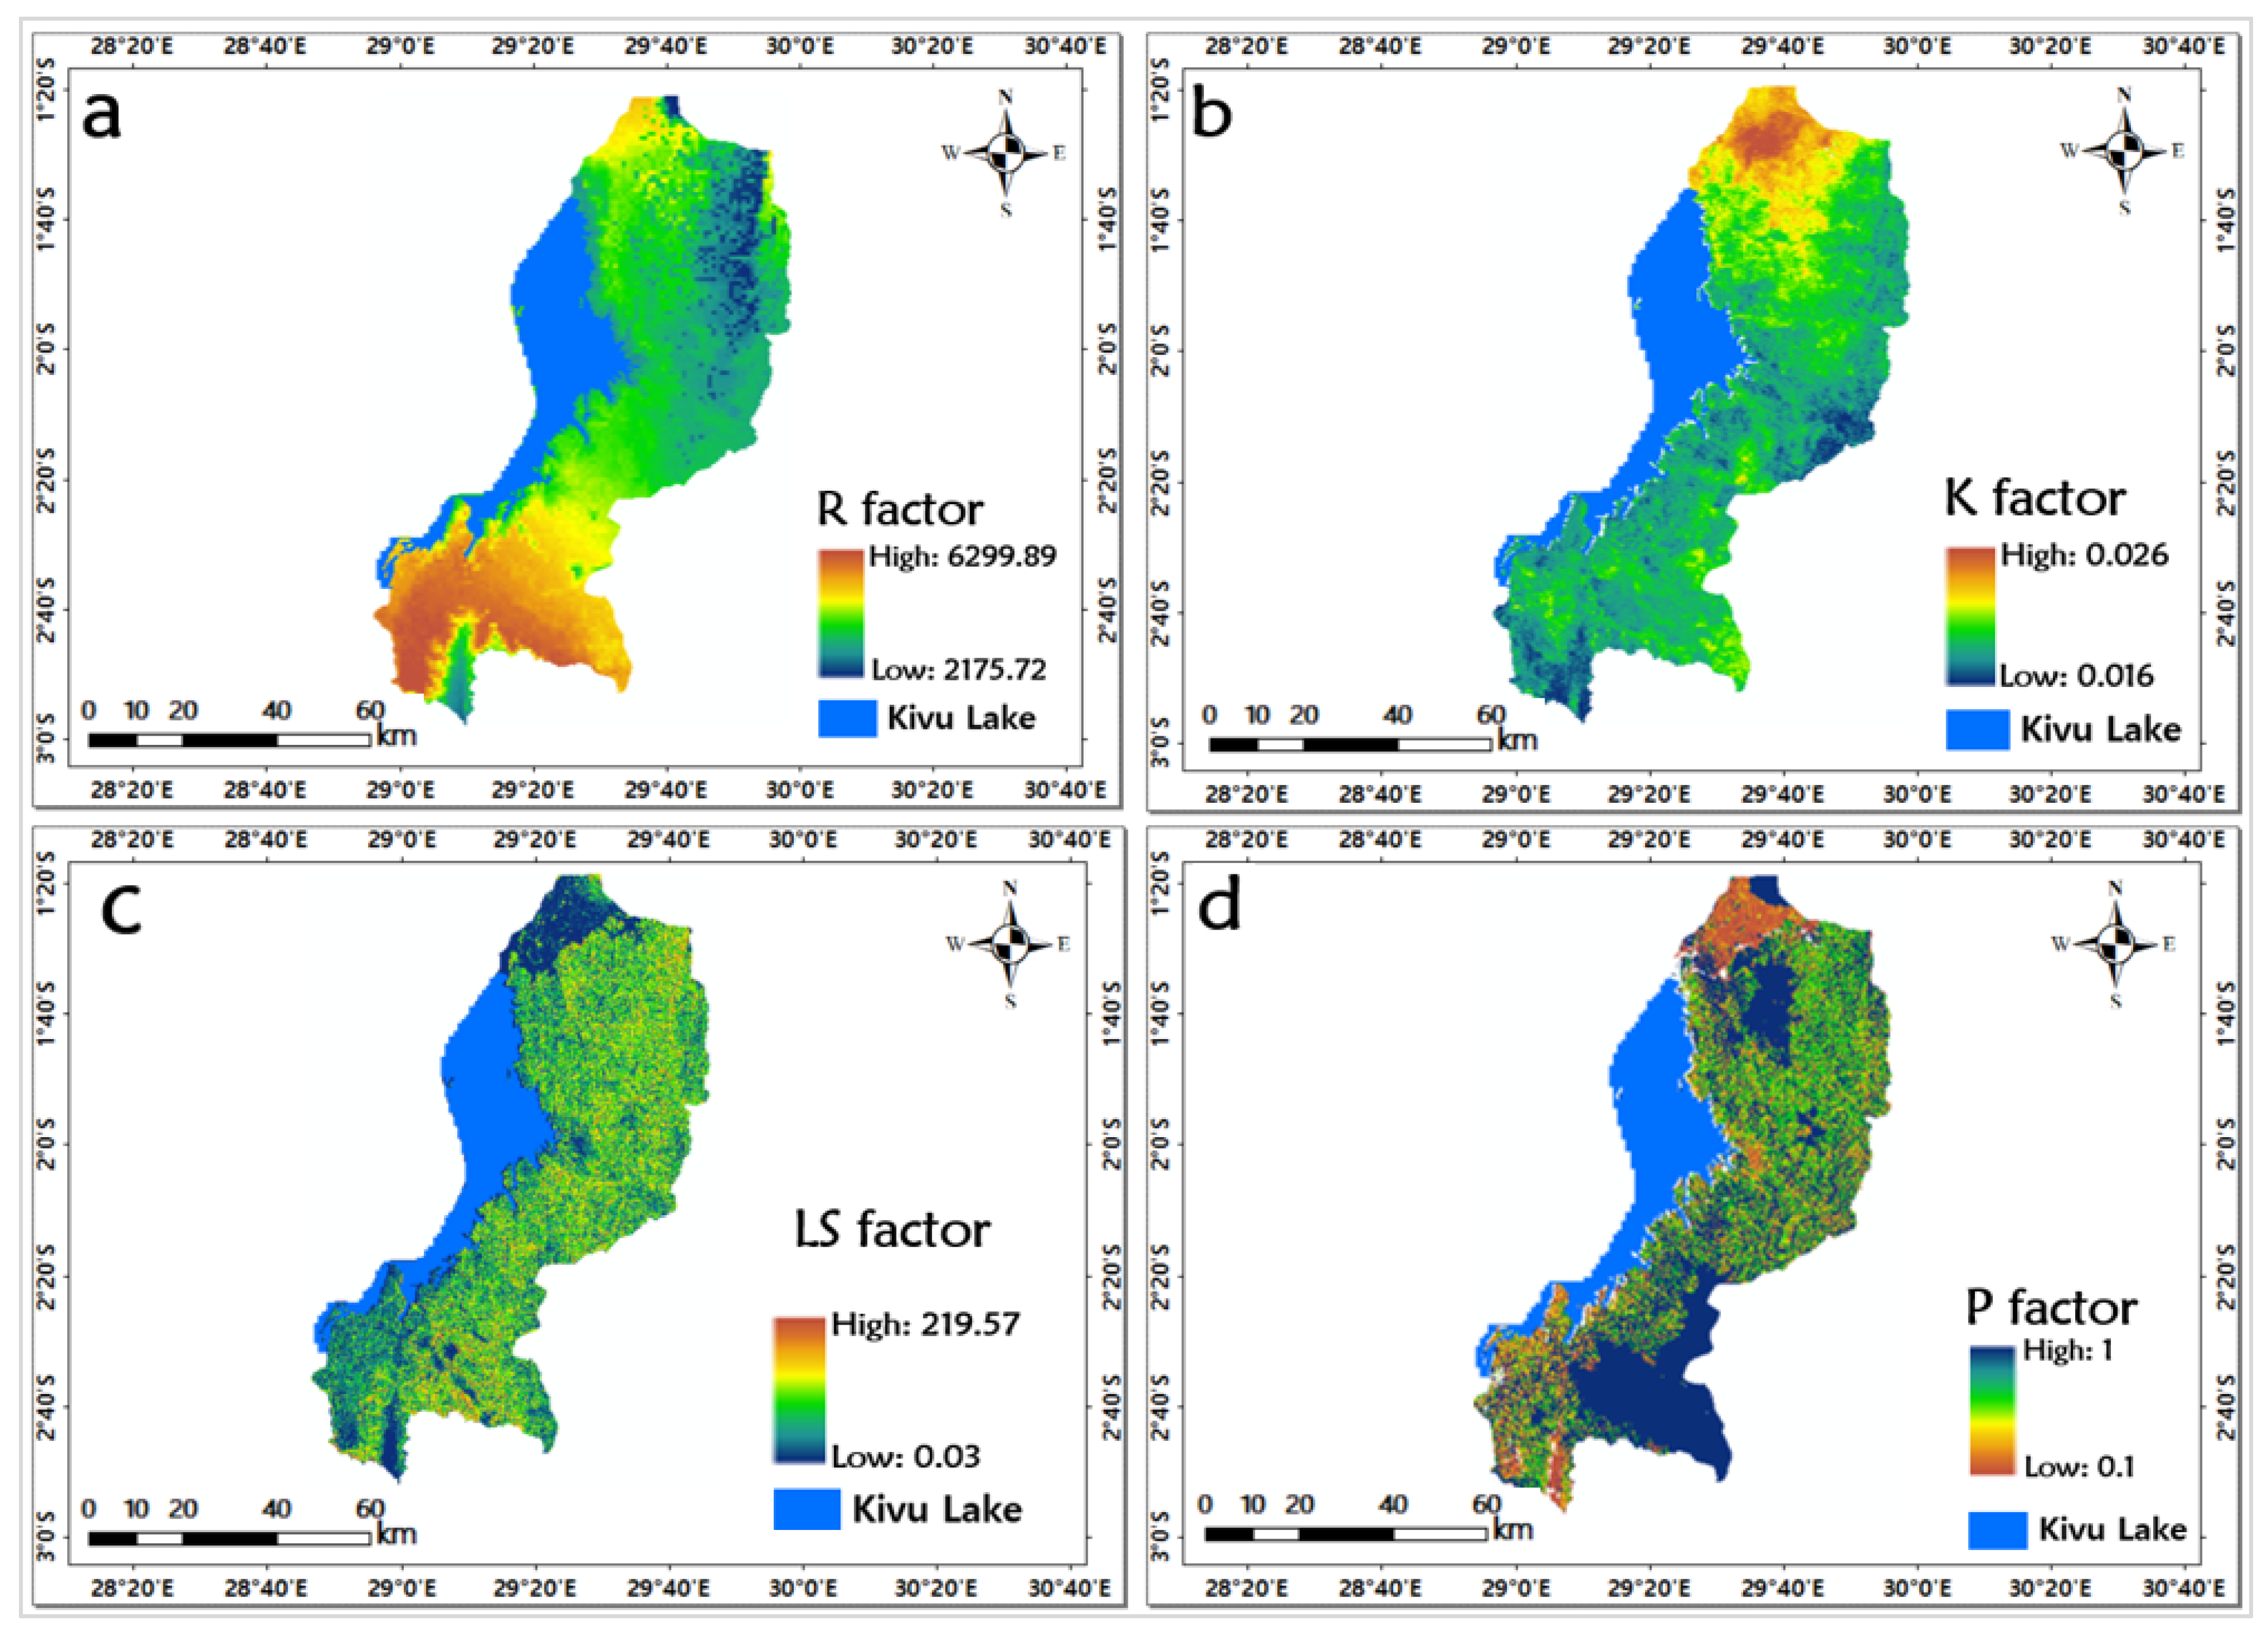
2.3.1. Rainfall Erosivity (R) Factor

Rainfall is a key factor triggering soil erosion in the tropic region. The R factor defines the erosive power of precise rainfall or the intensity of rainfall as the factor causing soil erosion [33]. The understanding of this factor relies on the kinetic force of raindrops on the soil’s surface [34]. In the RUSLE model, R factor estimation depends on the product given by the storm power based on a rainfall intensity of 30 min, expressed as R = EI30 [34]. The R factor (Figure 2a) was estimated using Equation (2) proposed by [35]:
R = 38.5 + 0.35 P
where R represents the rainfall erosivity factor while the mean annual rainfall (mm) is represented by P.

2.3.2. Soil Erodibility (K) Factor

The K-factor expresses the susceptibility of soil-to-soil erodibility. K-factor (Figure 2b) was computed based on the soil properties, including a fraction of sand, clay, silt and organic carbon using the Equation (3):
K = A   *   B   *   C   *   D   *   0
where A represents the soils with high-and rough-sand contents and those with less sand (Equation (3a)), B specifies the soils with high clay-to-silt fractions (Equation (3b)), C is soils rich in organic carbon (Equation (3c)) and D defines soils very rich in sand (Equation (3d)). Practically, A, B, C and D were multiplied with 0.1317 values to convert the K-factor from the American system to the metric system unity/International System of Units (SI).
A = ( 0.2 + 0.3. exp [ 0.256. SAN . ( 1 SIL 100 ) ] )
B = ( SIL CLA + SIL ) 0.3  
C = ( 1 0.0256 C C + exp ( 3.72 2.95 C ) )
D = ( 1 0.7 SN 1 SN 1 + exp ( 5.51 + 22.9 SN 1 ) )
where SAN is the sand content percentage (0.05–2.00 mm diameter); SIL specifies the silt content percentage (0.002–0.05 mm diameter); CLA specifies the clay content percentage (<0.002 mm diameter); C is the organic carbon content percentage; and SN1 = 1 − (SAN/100).

2.3.3. Slope Length and Its Steepness (LS) Factor

LS is a factor derived from DEM obtained by multiplying the length (L) and steepness (S) of a slope. L is the fraction of soil loss from the ground to soil loss from 22.1 meters under similar conditions, while S is the fraction of soil loss from the ground slope gradient to the loss of soil from 9% under similar conditions. L was derived from an algorithm (Equation (4)) developed by Desmet and Govers [36], while the S factor was computed using the McCool and Brown [37] method (Equation (5)). Finally, the LS (Figure 2c) was calculated using the equations below:
L = ( λ 22.13 ) m
m = ( E 1 + E )
E = Sin θ / 0.0896 3   ( Sin θ ) 0.8 + 0.56
S 1 = 10.8 * + 0.03
S 2 = 16.8 * 0.05    
where L and S indicate the slope length and steepness factor (dimensionless); λ is the slope length (in m); m denotes the variable power based on E; E denotes the rill to inter-rill erosion fraction; and θ is the slope angle (in degrees). S1 and S2 represent the slope percentage <9% and slope percentage ≥ 9%, respectively.

2.3.4. Crop Management (C) Factor

C is a factor representing crop management as a fraction of soil loss from land collected under specified conditions to the soil loss from the same area in tilled unceasing fallow land. It represents the effects of vegetation and other ground covers [38]. The traditional approach for the calculation of the C-factor in space is allocating values to LULC classes. The effects of vegetation are generally expressed using different vegetation indices, whereby each index has its specific expression of green vegetation and its particular suitability for specific applications. Therefore, the choice of a specific vegetation index or soil biophysical indices needs to be made cautiously by widely considering and analyzing their prevailing advantages and shortcomings. For this specific study, the Normalized Difference Vegetation Index (NDVI) was deemed worthy of being used for the estimation of the RUSLE-based C-factor due to its important advantages such as its ability to indicate green vegetation potency [39], show fluctuations in LULC [40] and estimate values that represent the utmost heterogeneity in the stage of crop growth [41]. Different researchers developed many techniques to calculate the C-factor using the NDVI for assessing soil loss with the USLE/RUSLE model. This index can be derived from the spectral reflectance difference between near infrared (NIR) and red. It ranges between −1 and +1, with the highest values accredited to areas with higher vegetation cover [42,43], and it is estimated using the equation below:
NDVI = NIR RED NIR + RED    
We used NDVI and two approaches for determining the soil cover management factor. The first (Equation (6)) was proposed by Van der Knijff and Jones [22], and the second was suggested as an adapted version of the first approach (Equation (7)). In the approach proposed by Van der Knijff and Jones [44] (Cvk), the C-factor is calculated as:
Cvk = exp ( α NDVI ( β NDVI ) )      
where α and β are the parameters that determine the shape of the curve that links NDVI with the C-factor. Van der Knijff and Jones [22] used values 2 and 1 for European climate conditions as the best representatives of the equation parameters α and β, respectively. Nevertheless, for tropical climate conditions with high intensities of rainfall, the C-factor tends to be overestimated compared to that calculated using the approach by Van der Knijff and Jones [22] for the same vegetation cover. Hence, a newly adapted approach for calculating the RUSLE C-factor was presented in this study in comparison to the former one. Due to the bias identified in the previous studies, this study recommends an adjustment factor of 2, which has been divided by the aforementioned equation (Equation (6)) to minimize the bias for the tropical climate conditions. Therefore, the adapted C-factor (CvkA) was proposed as follows:
CvkA = exp [ α ( NDVI / ( β NDVI ) ) ] 2                
To establish the adequacy of the used index (NDVI) in the estimation of the RUSLE-based C-factor, a linear regression analysis was then executed using the extracted values against the related NDVI-based C-factor values [42]. Additionally, the shape of the mean cover management factor values calculated for all images was compared to determine the relationship between the two approaches (Cvk and CvkA). To achieve this, a sample of spatially distributed random points within the study area was produced in the ArcGIS 10.8 platform, and then its tool was applied to extract multi-values to points from both variables (NDVI and C-factor). To quantify the sensitivity of NDVI-derived CvkA values to biophysical variables, the influence of biophysical variables (Table 2) on CvkA (adapted C-factor) in Equation (7) with regard to this NDVI was carried out.

2.3.5. Support Practice (P) Factor

P is a factor that represents the support practice to express the rate of soil loss with erosion control practices such as strip-cropping, terracing and contouring [18]. The P factor (Figure 2d) can be computed for the croplands of different slope classes. Depending on the slope grades, either erosion control practice can be used. However, the values of the P factor were not estimated as part of the equation due to the unavailability of data. Therefore, this study adopted the P factor values (Table 3) suggested by Shin and Noh [45].

2.4. Soil Erosion Probability Zones Delineation

For the identification and generation of the areas with a probability of soil erosion, maps were prepared using ArcGIS 10.8 version. Key factors including slope, rainfall intensity, LULC and soil properties were utilized as the most influential factors on soil erosion. Weights were assigned to each theme taking into consideration its role in soil erosion. A raster overlay analysis process (weighted index overlay) was used to generate the zones with the highest probability of soil erosion occurrence. Therefore, the feature with the highest susceptibility was given the maximum value, while the minimum value was assigned to the feature with the lowest susceptibility.

3. Results

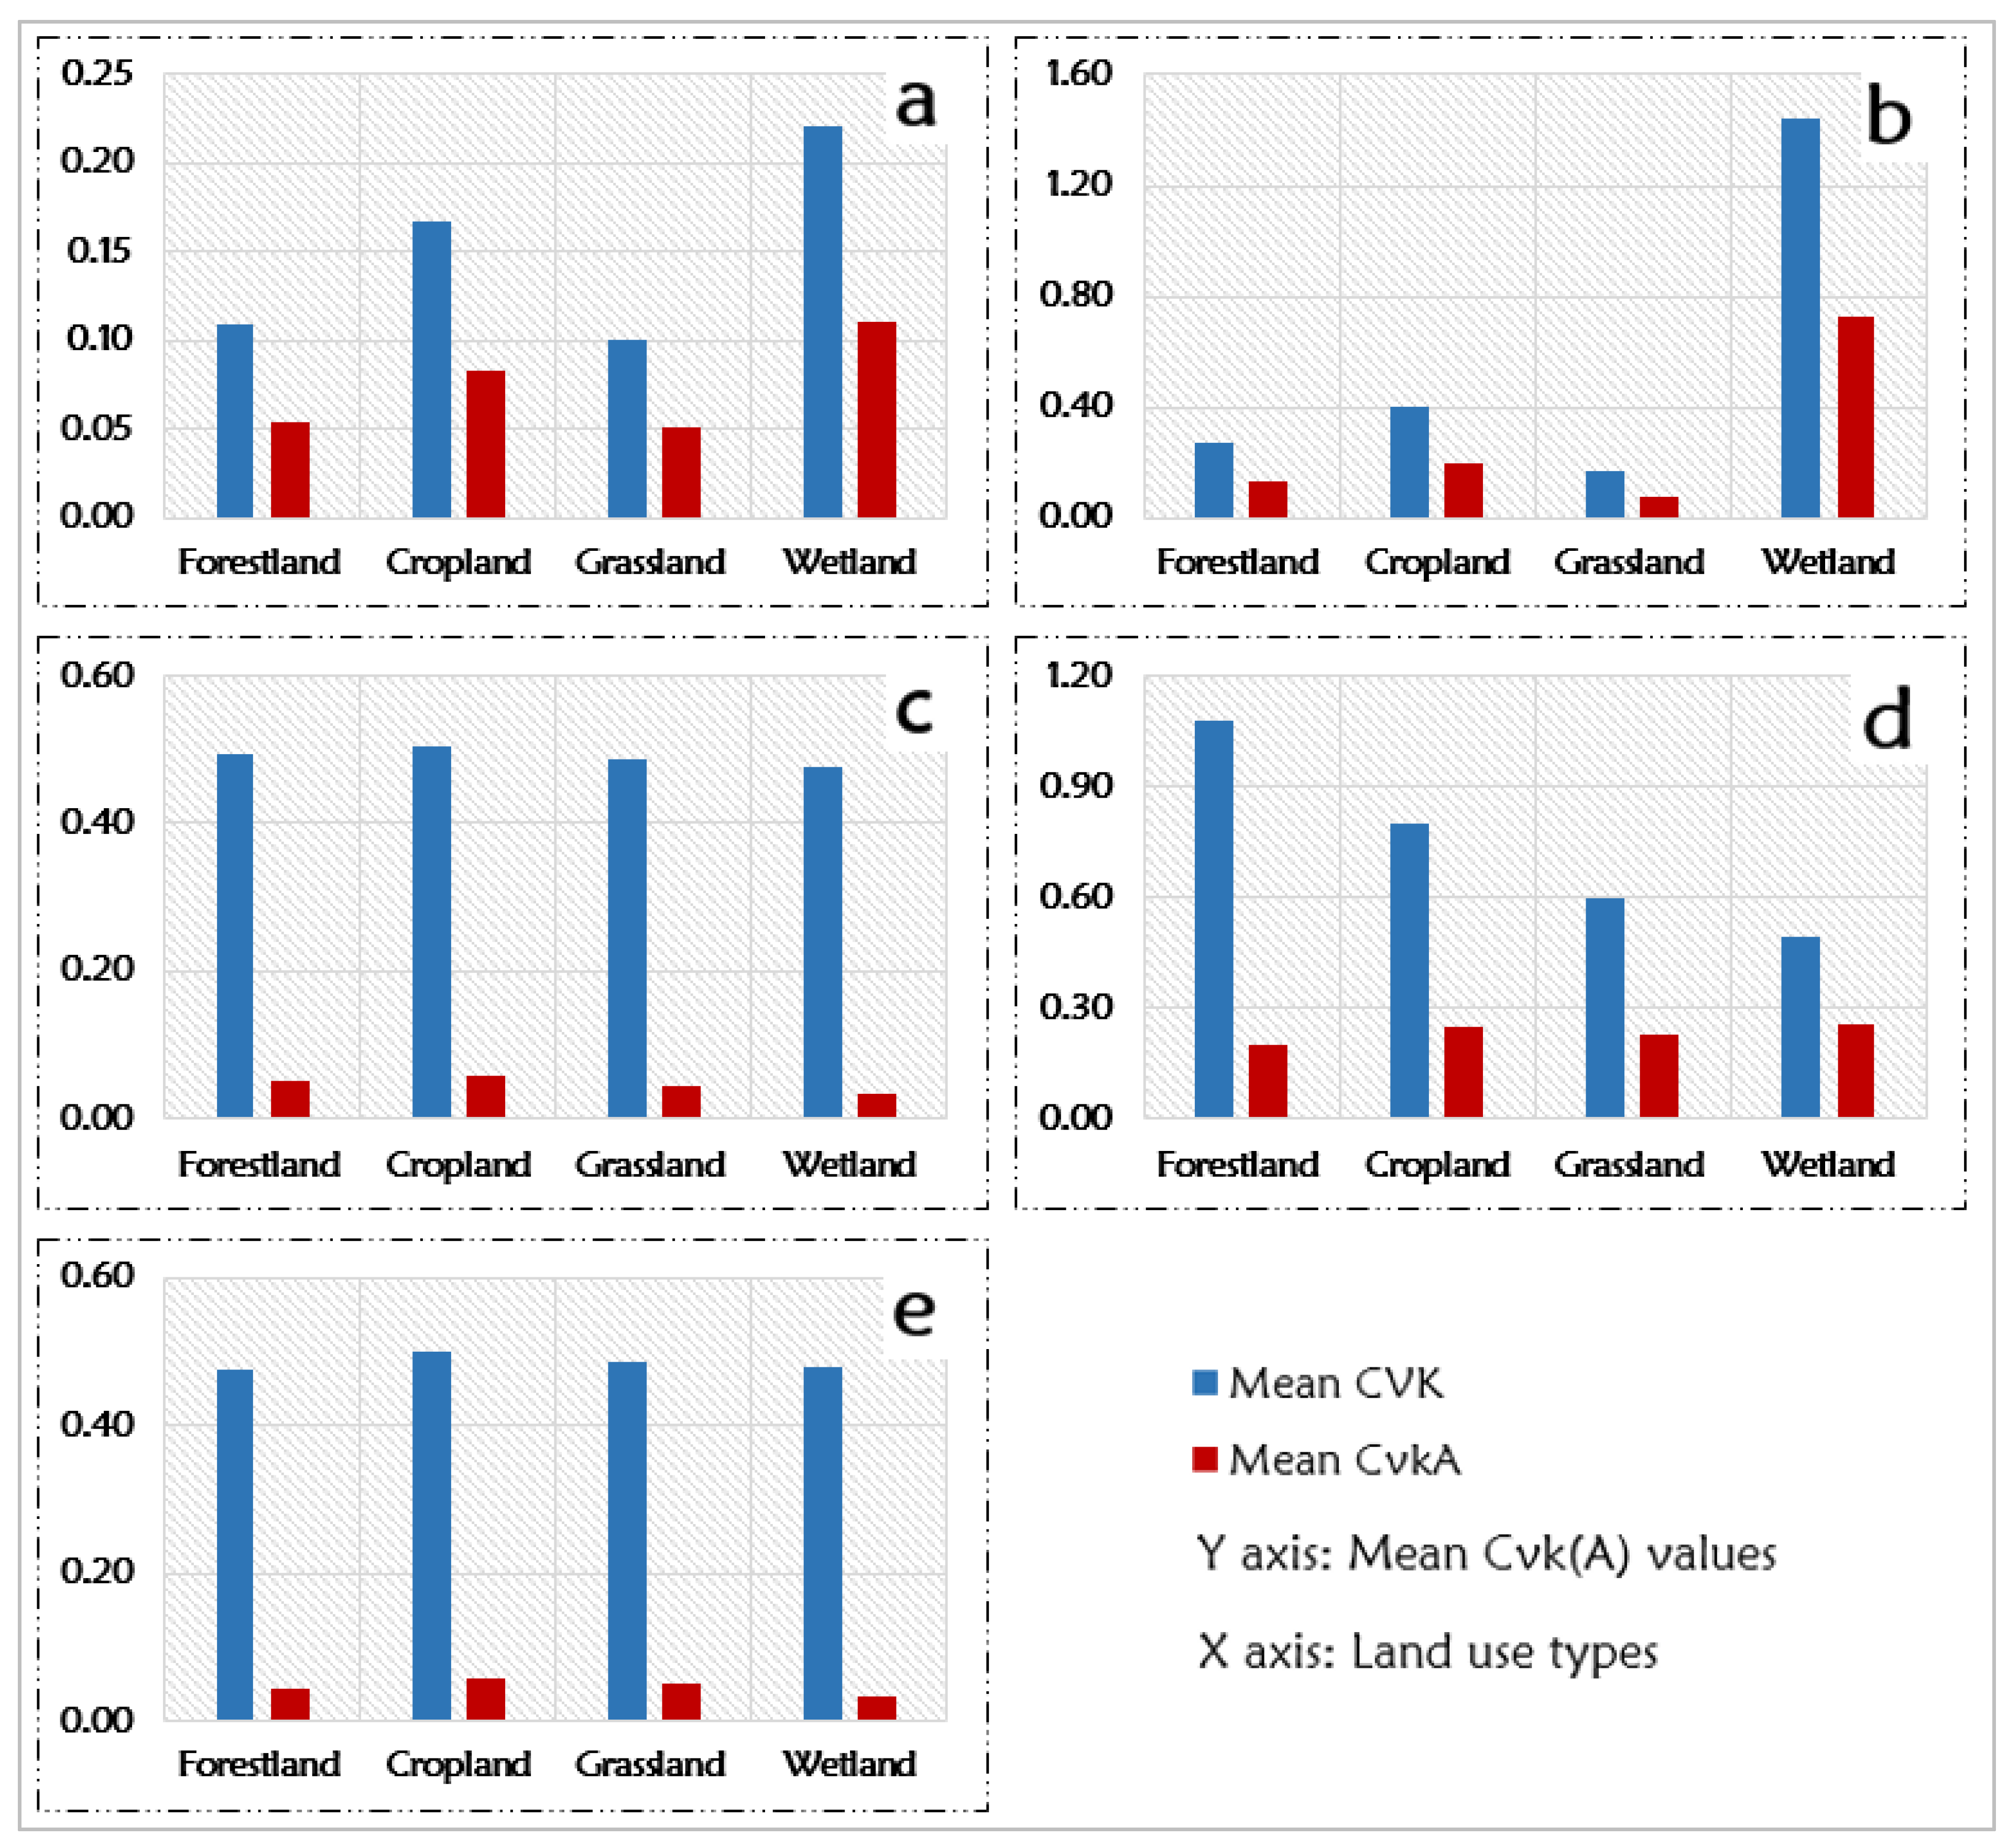
3.1. Adapted Approach (CvkA) for C-Factor Estimation

By comparing the C-factor values from both methods (Cvk and its adapted version CvkA), the results exhibited Cvk with higher overestimations for the mean value in different LULCs (forestland, cropland, grassland and wetland) than CvkA in all the periods studied (Figure 3). The results estimated from the adapted C-factor (CvkA) presented greater consistent values compared with those of the Cvk approach, which makes the estimation of soil loss more reliable. Figure 4 shows the spatial distribution of C-factor values estimated from two approaches for the LULC in the western province of Rwanda.
The mean and standard deviation values of CvkA are 0.068 ± 0.054 in 2000, 0.27 ± 0.23 in 2005, 0.10 ± 0.14 in 2010, 0.29 ± 0.13 in 2015 and 0.11± 0.17 in 2018, respectively, while Cvk values are 0.14 ±0.11, 0.36 ± 0.22, 0.55 ± 0.17, 2.6 ± 1.9 and 0.56 ± 0.20 in 2000, 2005, 2010, 2015 and 2018, respectively (Figure 4). Cvk was found not to be suitable for estimating the C-factor in the study area, as it presented overestimated values compared to those from its adapted equation. CvkA was the most suitable based on the spatial variability of vegetation coverage of the area and the obtained C-factor values.
In general, NDVI is one of the several numerical combinations of satellite bands reported to be sensitive indicators in the existence and state of green vegetation considering the LULC of an area. For this, based on the spatial variability of soil coverage in the study area, the method using NDVI to obtain the C-factor was the most suitable. It was applied with an assumption that there was a linear relationship between NDVI and the C-factor linear model (Figure 5). The two variables have shown a tendency to move in the opposite direction from one another, such that when NDVI increased, C-factor decreased, and vice versa. The study achieved the highest correlation coefficient between the NDVI and C-factors in all the considered periods, with an R2 higher than 85% (Figure 5). Thus, NDVI was judged to be relevant in the estimation of the C-factor in the adapted equation.

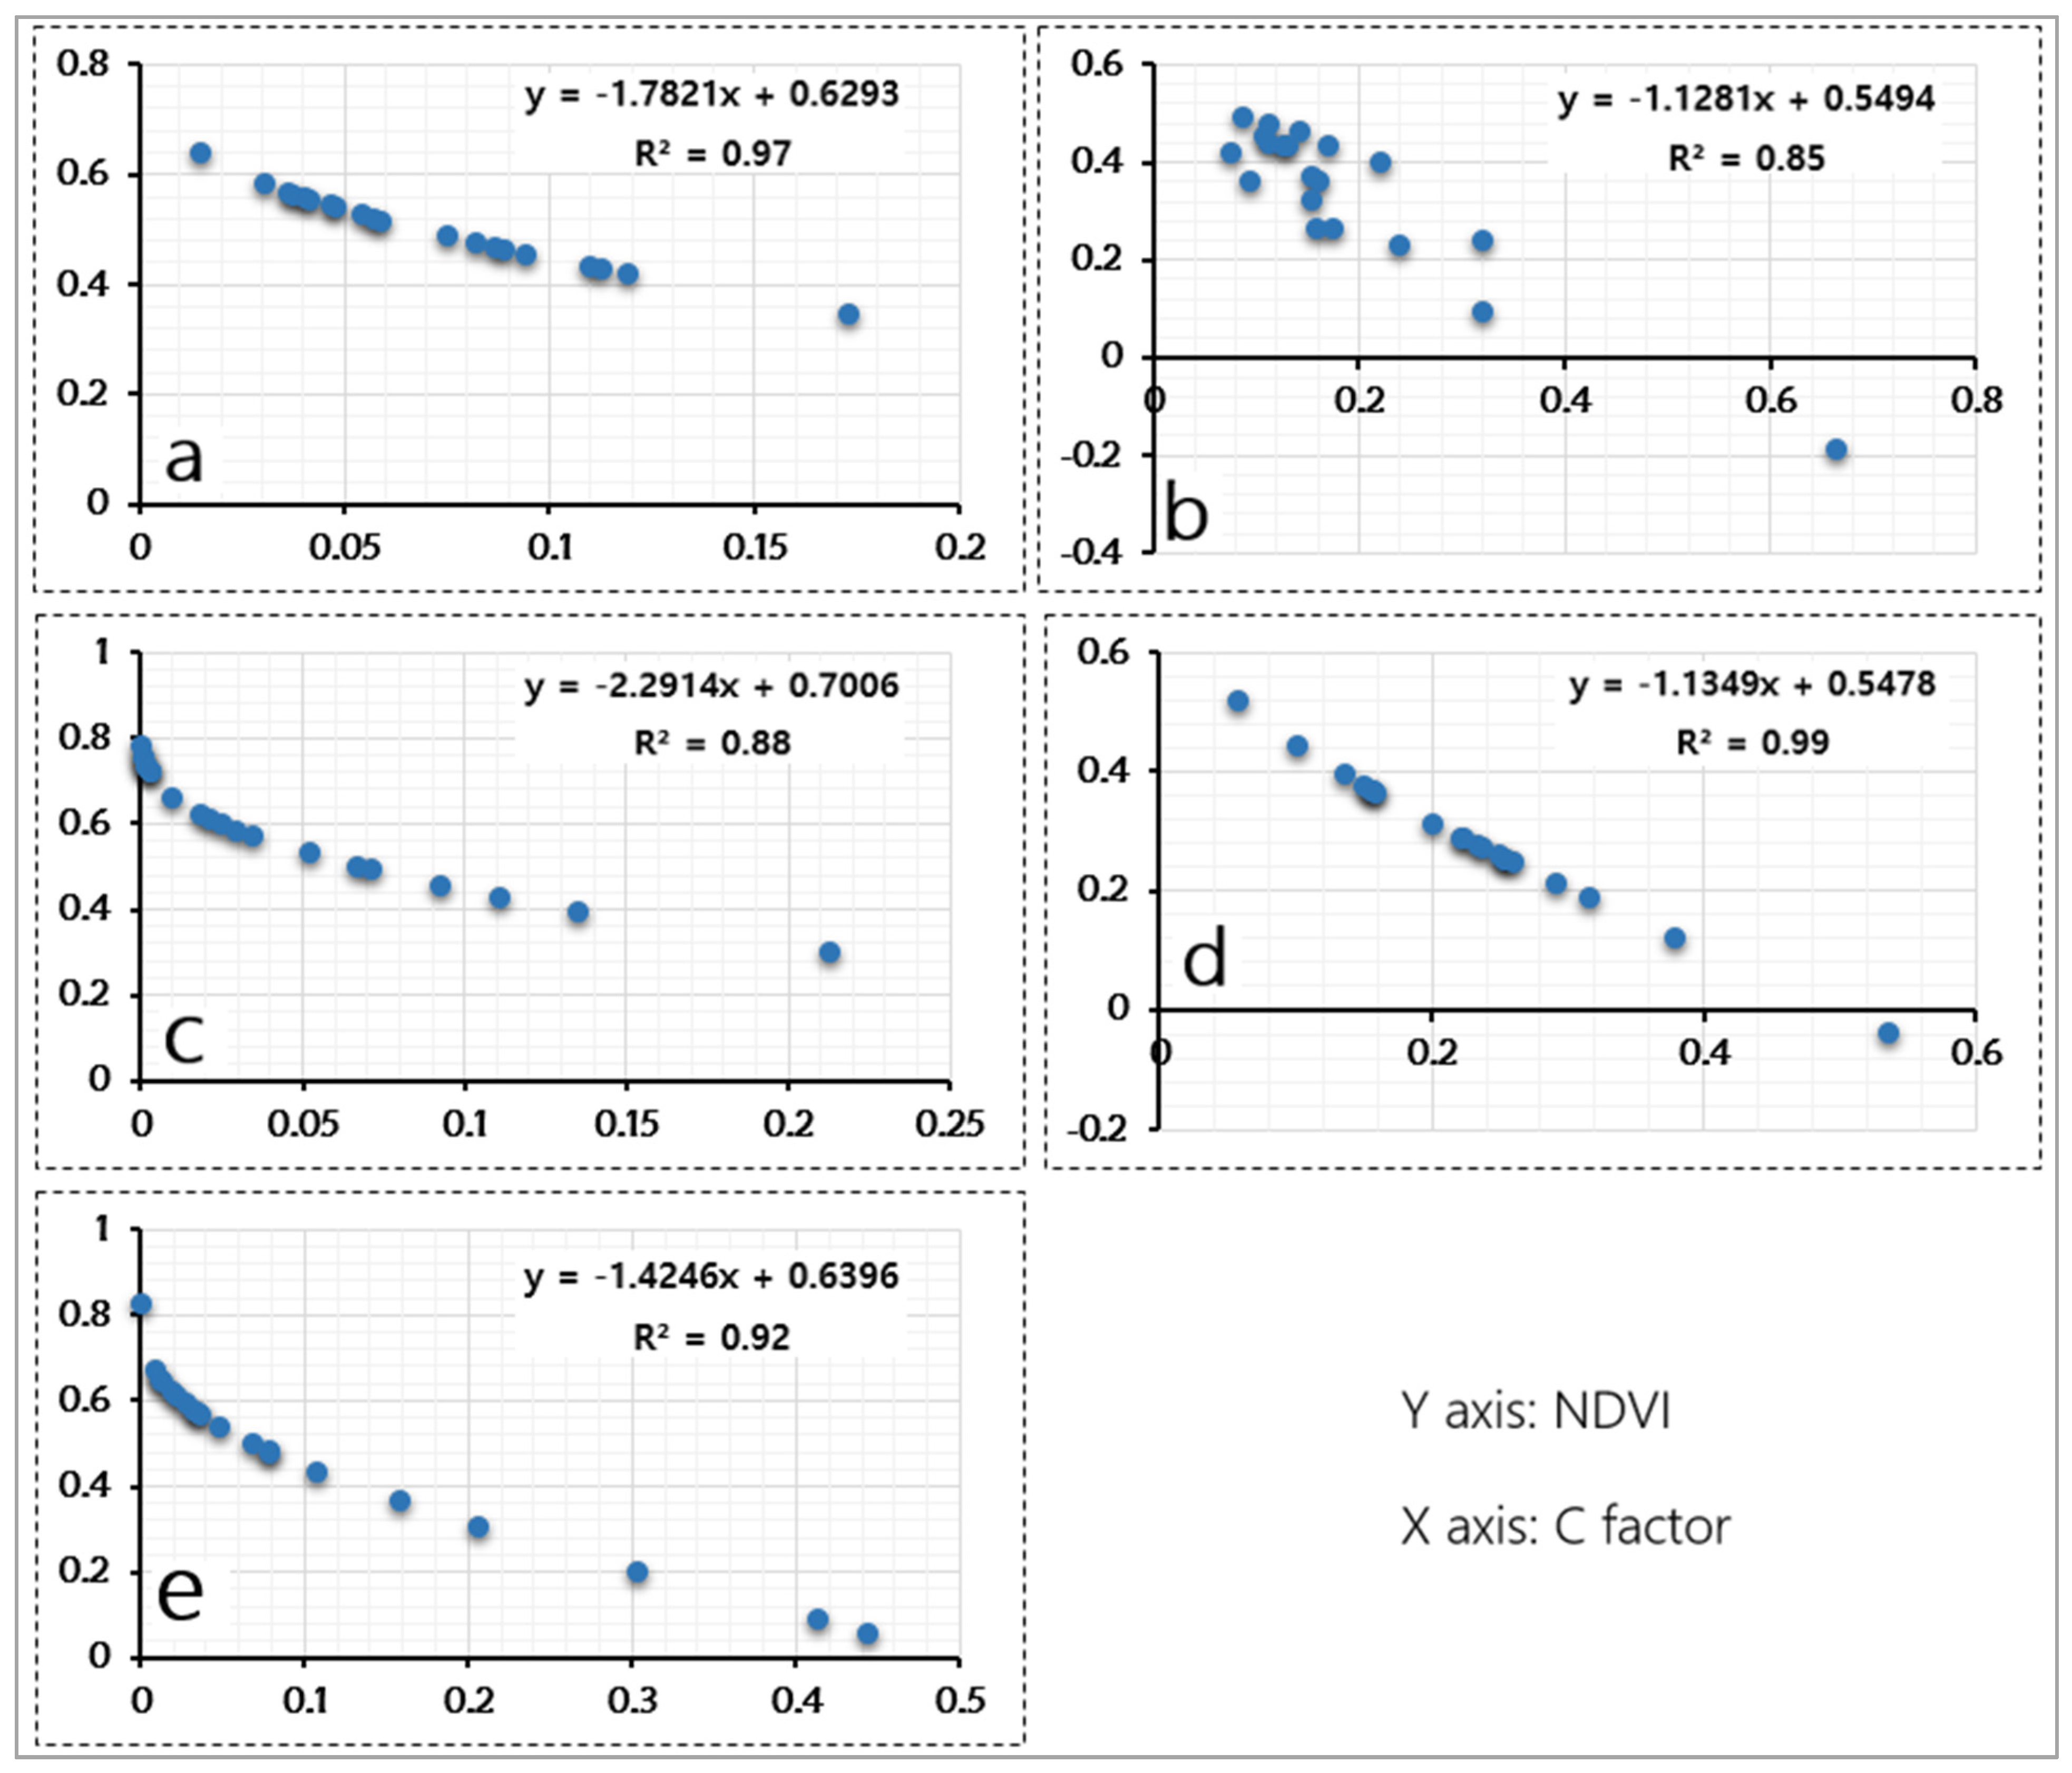
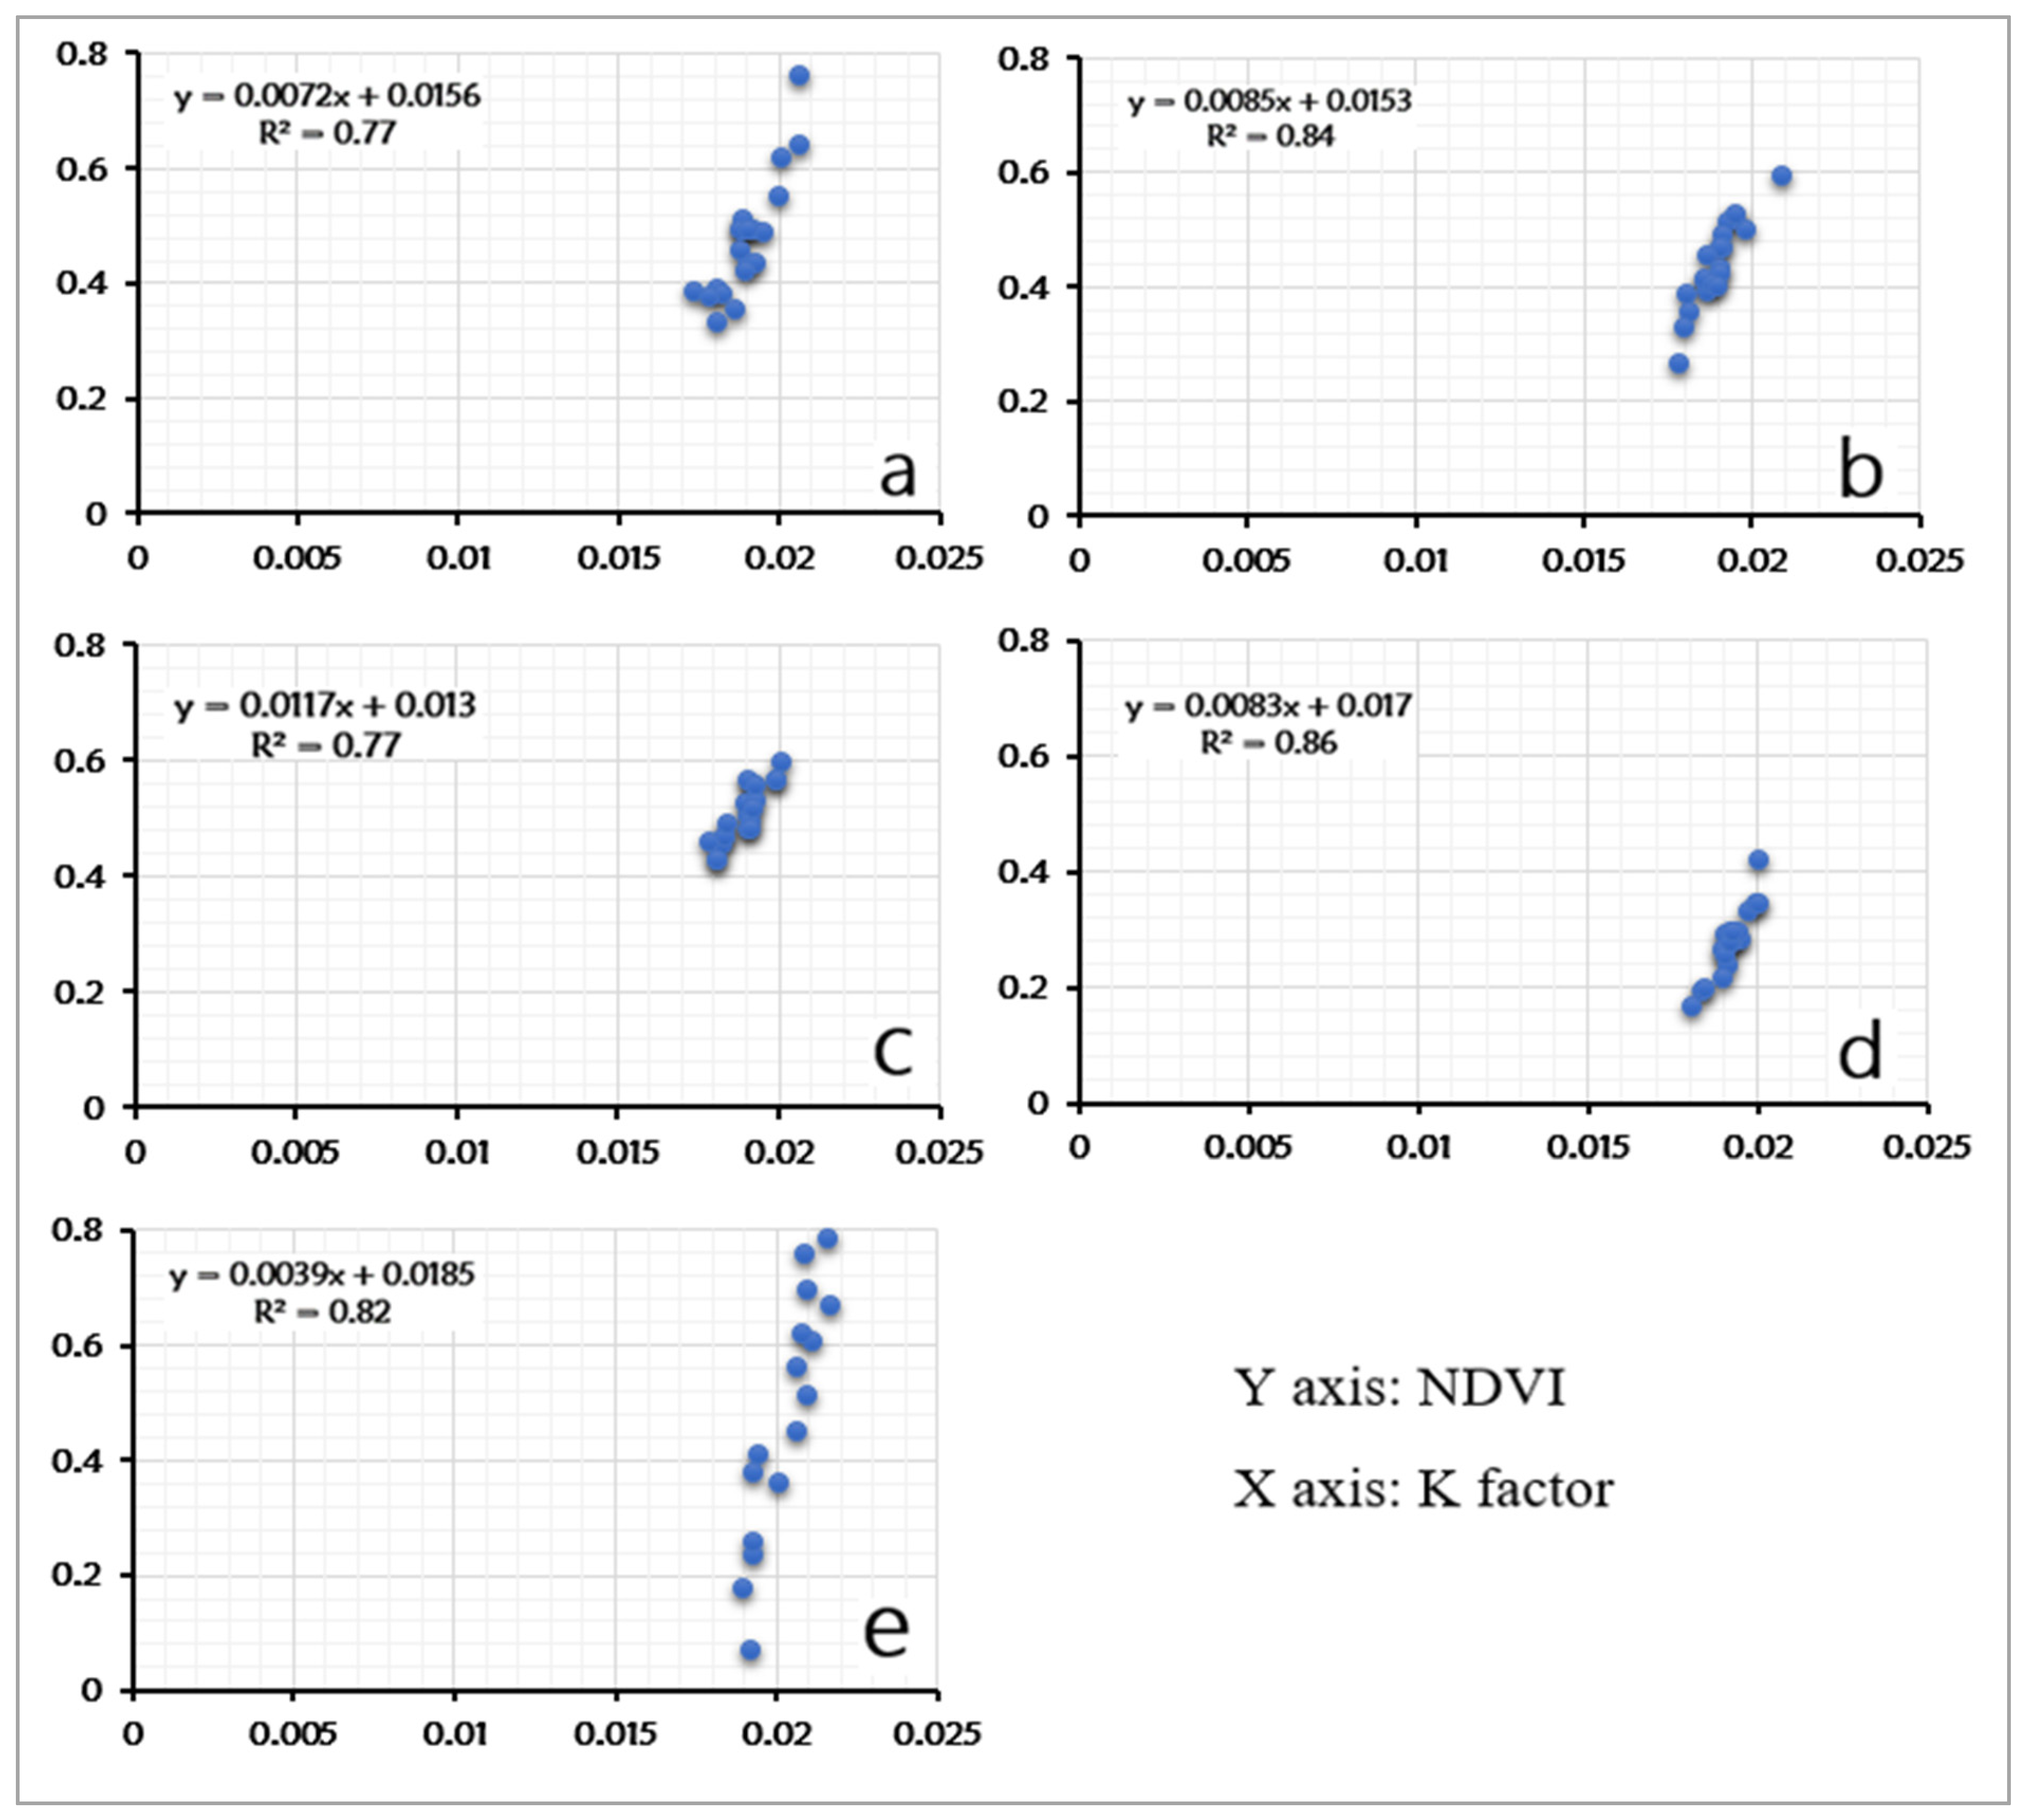
3.2. Influence of Soil Erodibility on NDVI-Derived C-Factor (CvkA)

The executed regression analysis revealed that the vegetation index-derived C-factor values were affected by the soil erodibility (K) values (Figure 6). The correlation analysis varied from 0.77 to 0.86. The sensitivity of the adapted C-factor estimation (CvkA) to the variation of soil background can be clarified through the spatial variability of soil erodibility (K) values in the study area. In the current study, an increase in the value of soil erodibility led to an increase in the values of NDVI-derived C-factor (Figure 6), while the magnitude probably changed following different seasons of a year. A higher value in the K-factor resulted in a higher near-infrared reflectance (NIR) band, while the lower the NIR reflectance, the lower NDVI values. This fact can explain the possible overestimation of the values in the prediction of soil erosion risk using the Cvk method under certain climate conditions, which may generate different K-factor values that compound the impact of the K-factor and NDVI-derived C-factor values in the RUSLE model (Figure 8).

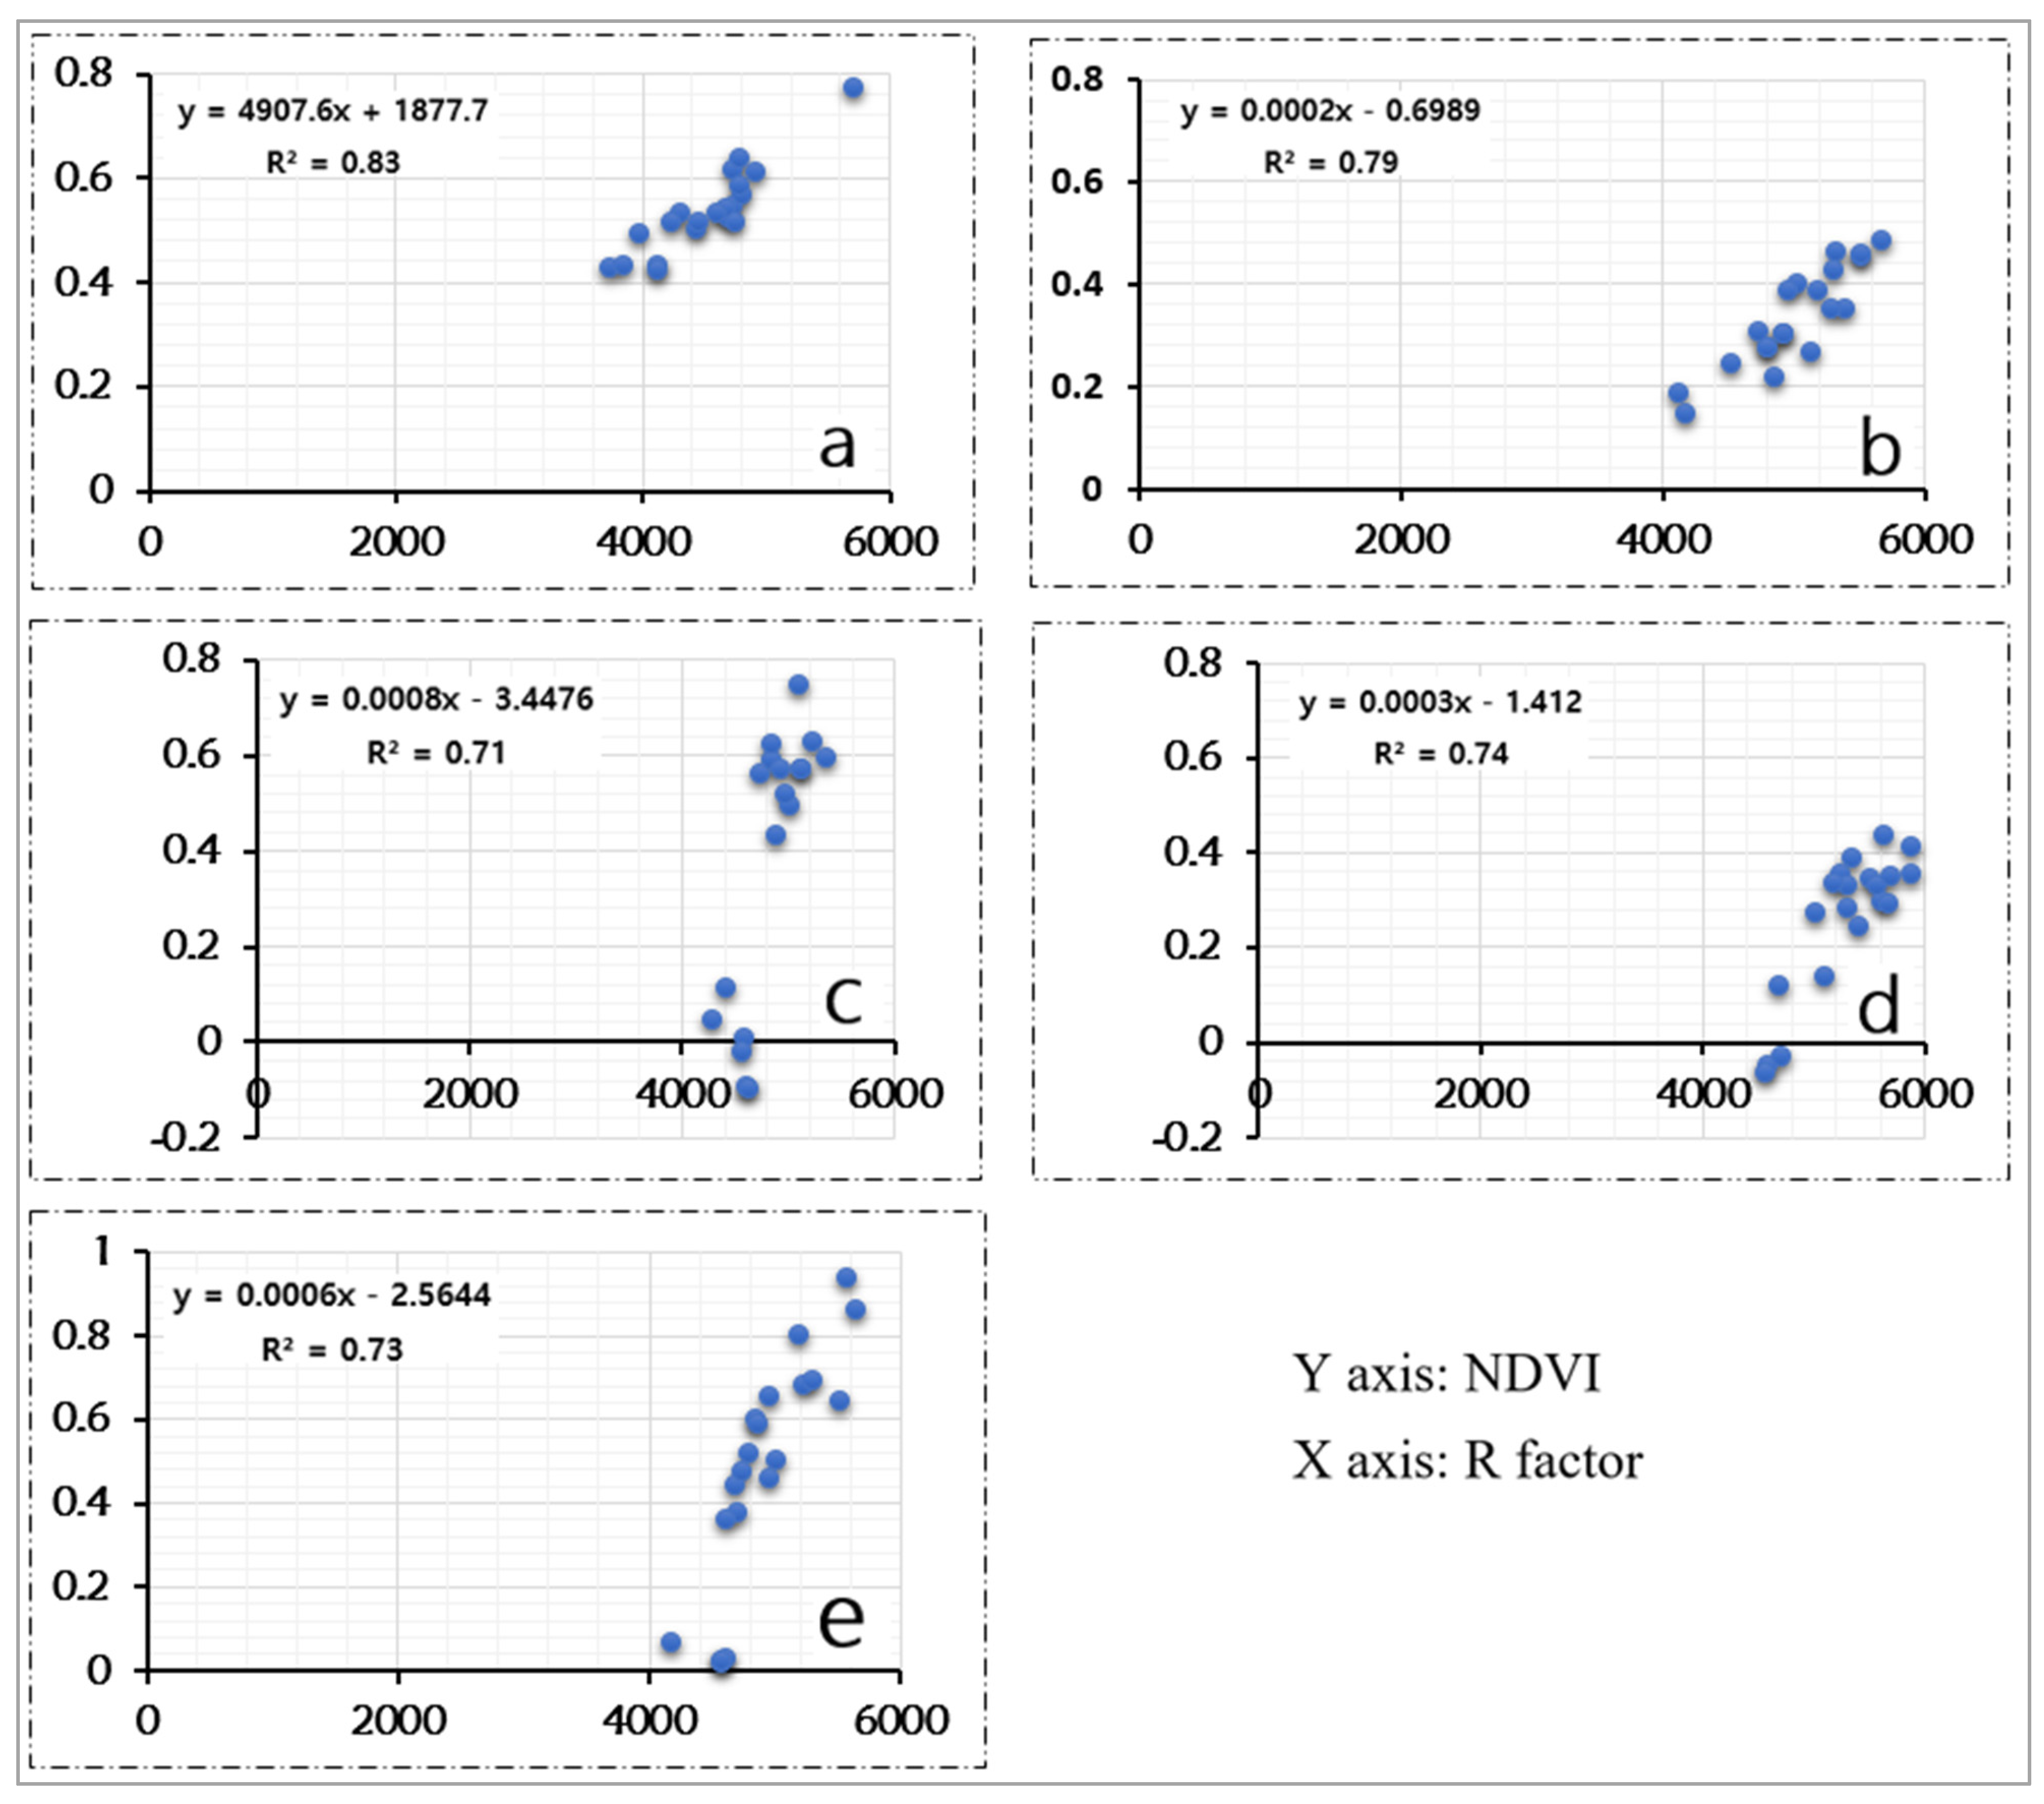
3.3. Influence of Rainfall on NDVI-Derived C-Factor (CvkA)

The correlation between annual mean NDVI and rainfall variable is shown in Figure 7. The studied period (2000–2018) clearly showed the geographical distribution of the relationship between NDVI and rainfall. The results revealed NDVI to be closely interacting with rainfall erosivity (Figure 7). The R2 values were 0.83 in 2000, 0.79 in 2005, 0.71 in 2010, 0.74 in 2015 and 0.73 in 2018 (Figure 7). When the annual rainfall erosivity increased, the values of NDVI also increased at the same time. The analyses proved that more rainfall would definitely lead to higher NDVI value, which might affect the estimation of C-factor for accurate soil erosion predictions. The variation in annual NDVI was determined by climate variable including rainfall. The correlation between NDVI and rainfall is stronger due to the fact that rainfall is the dominant factor influencing vegetation growth in the area.

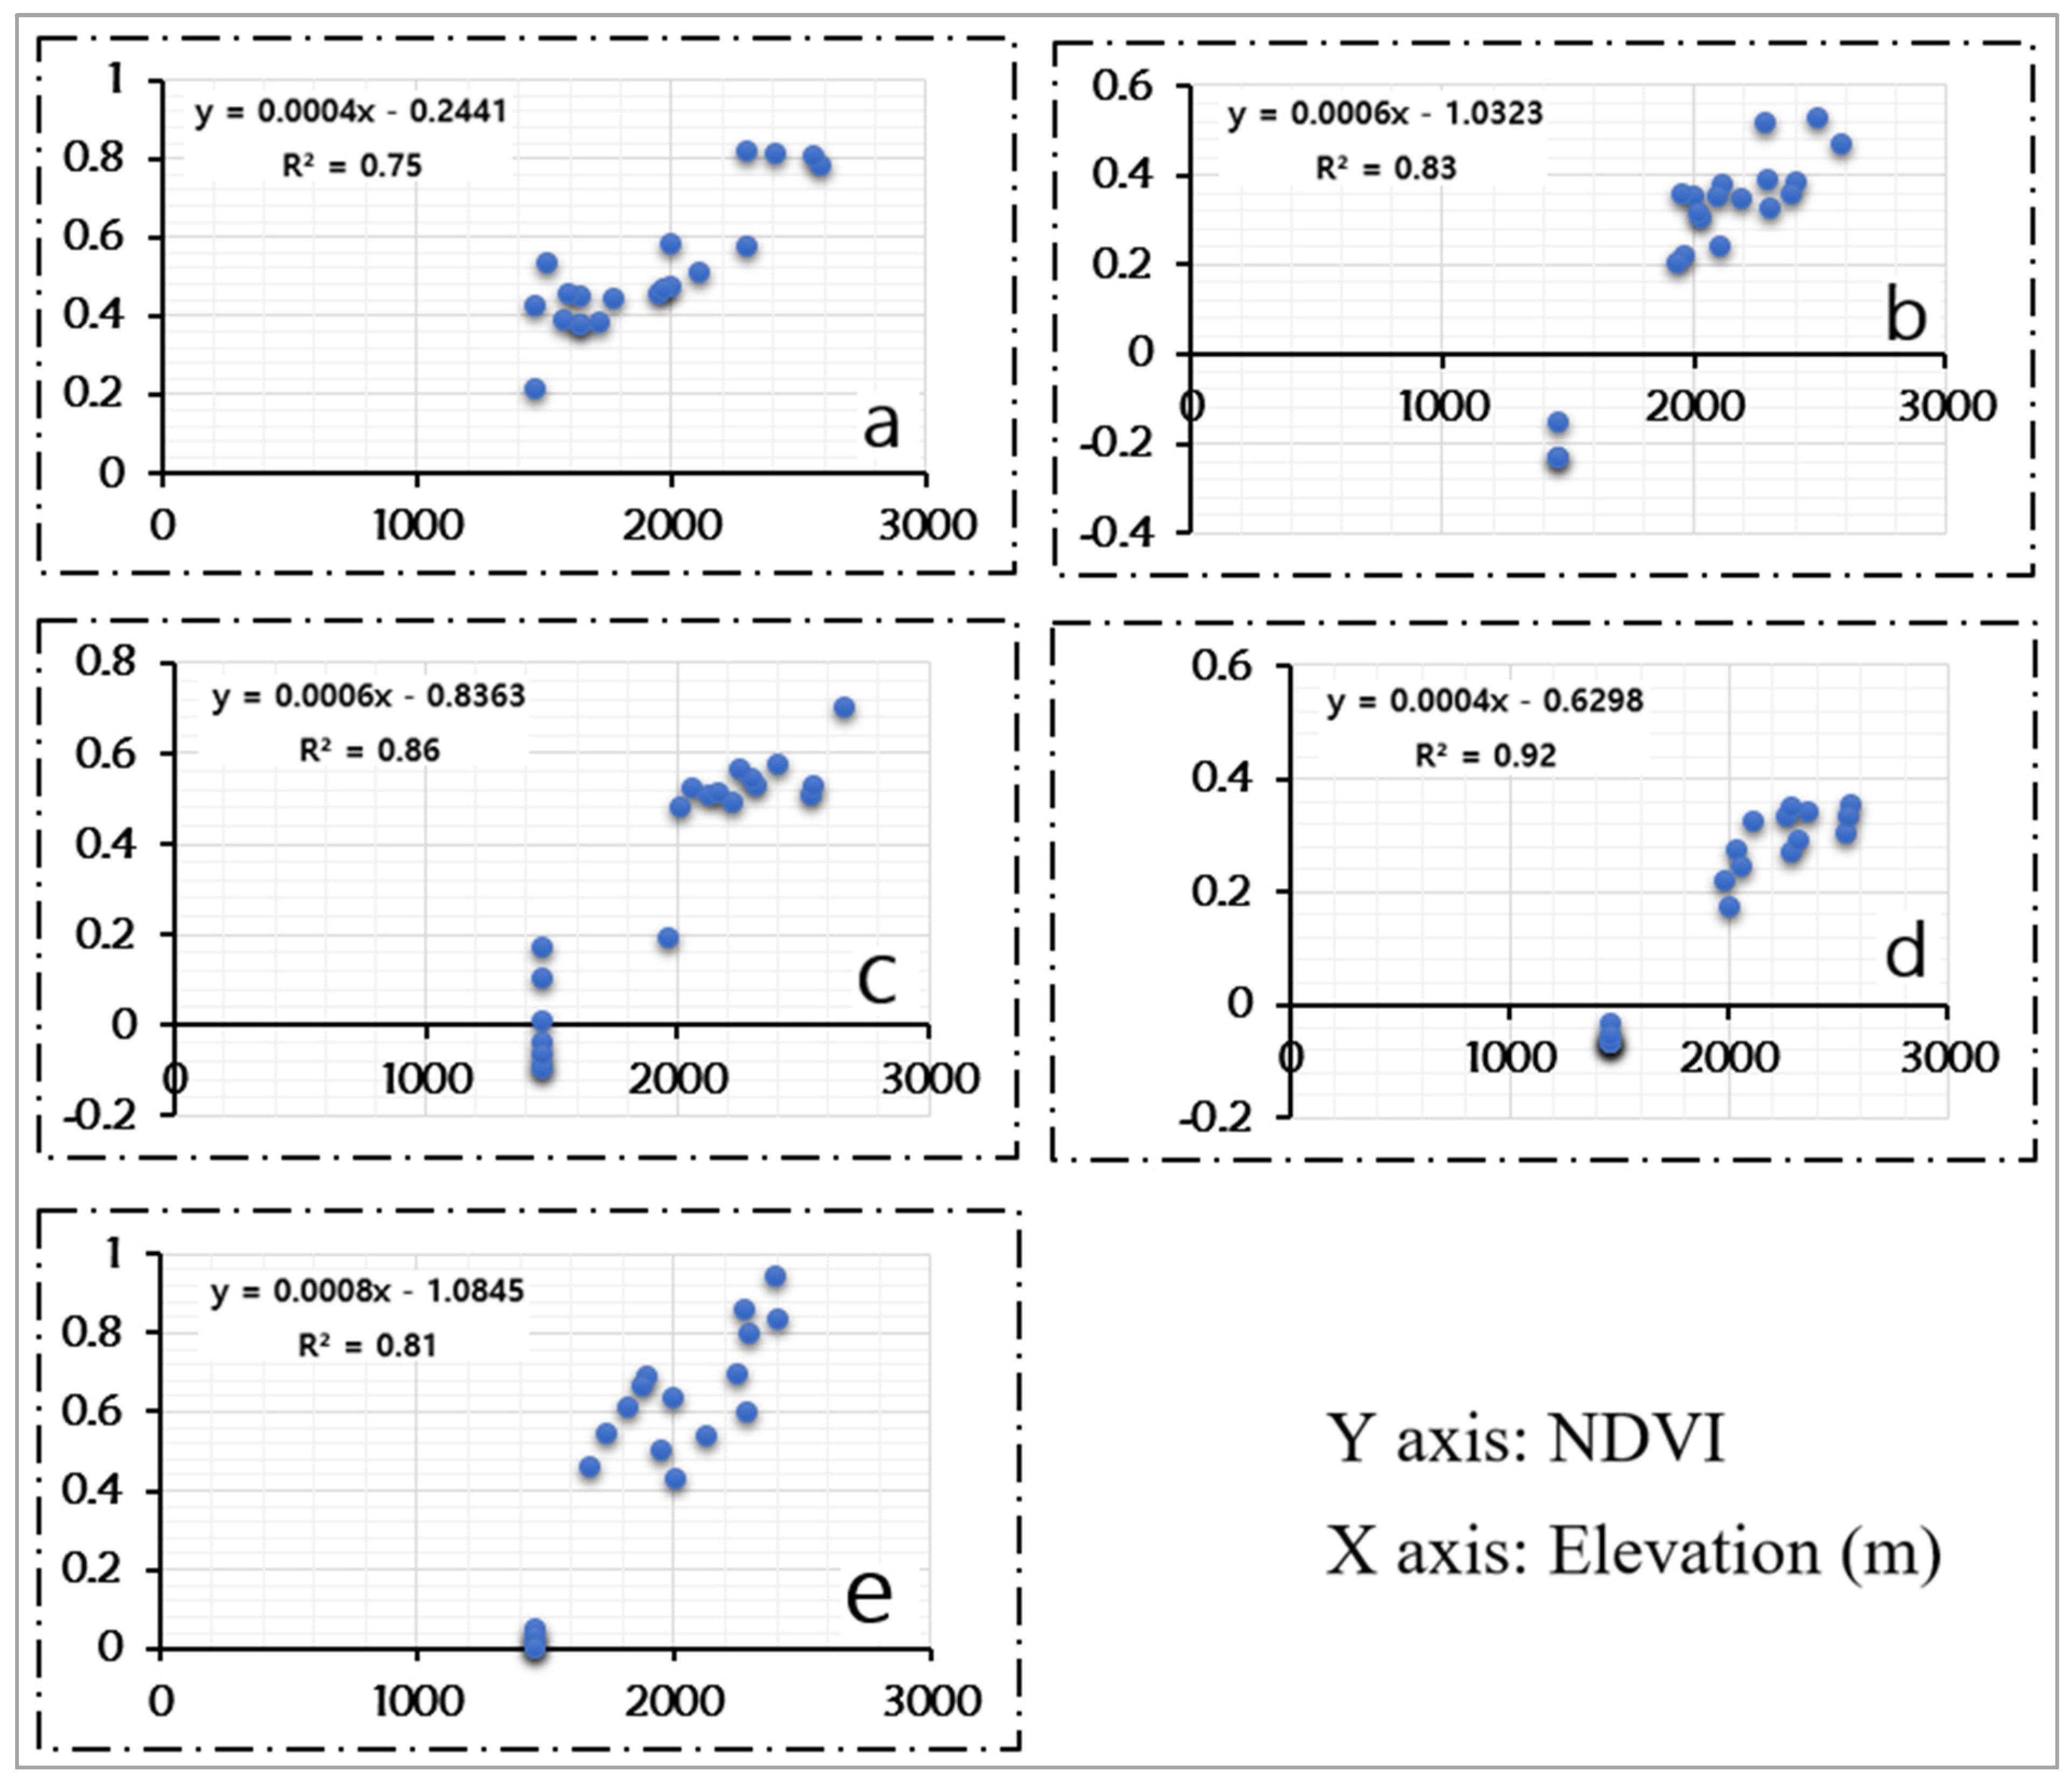
3.4. Influence of Topographic Features on NDVI-derived C-Factor (CvkA)

The results showed that NDVI-derived CvkA values had a significant impact on the varying elevation of the area (Figure 8). The increase in NDVI values increased with elevation, mainly in high-elevation areas. NDVI values increased fast within elevation ranges between 1500 and 2000 m in 2000, 1800 and 2200 m in 2005, 1600 and 2400 m in 2010, 2000 and 2600 in 2015 and 1600 and 2000 m in 2018 (Figure 8). This latter point shows that topographic features have significant effects on the vegetation distribution in the study area.

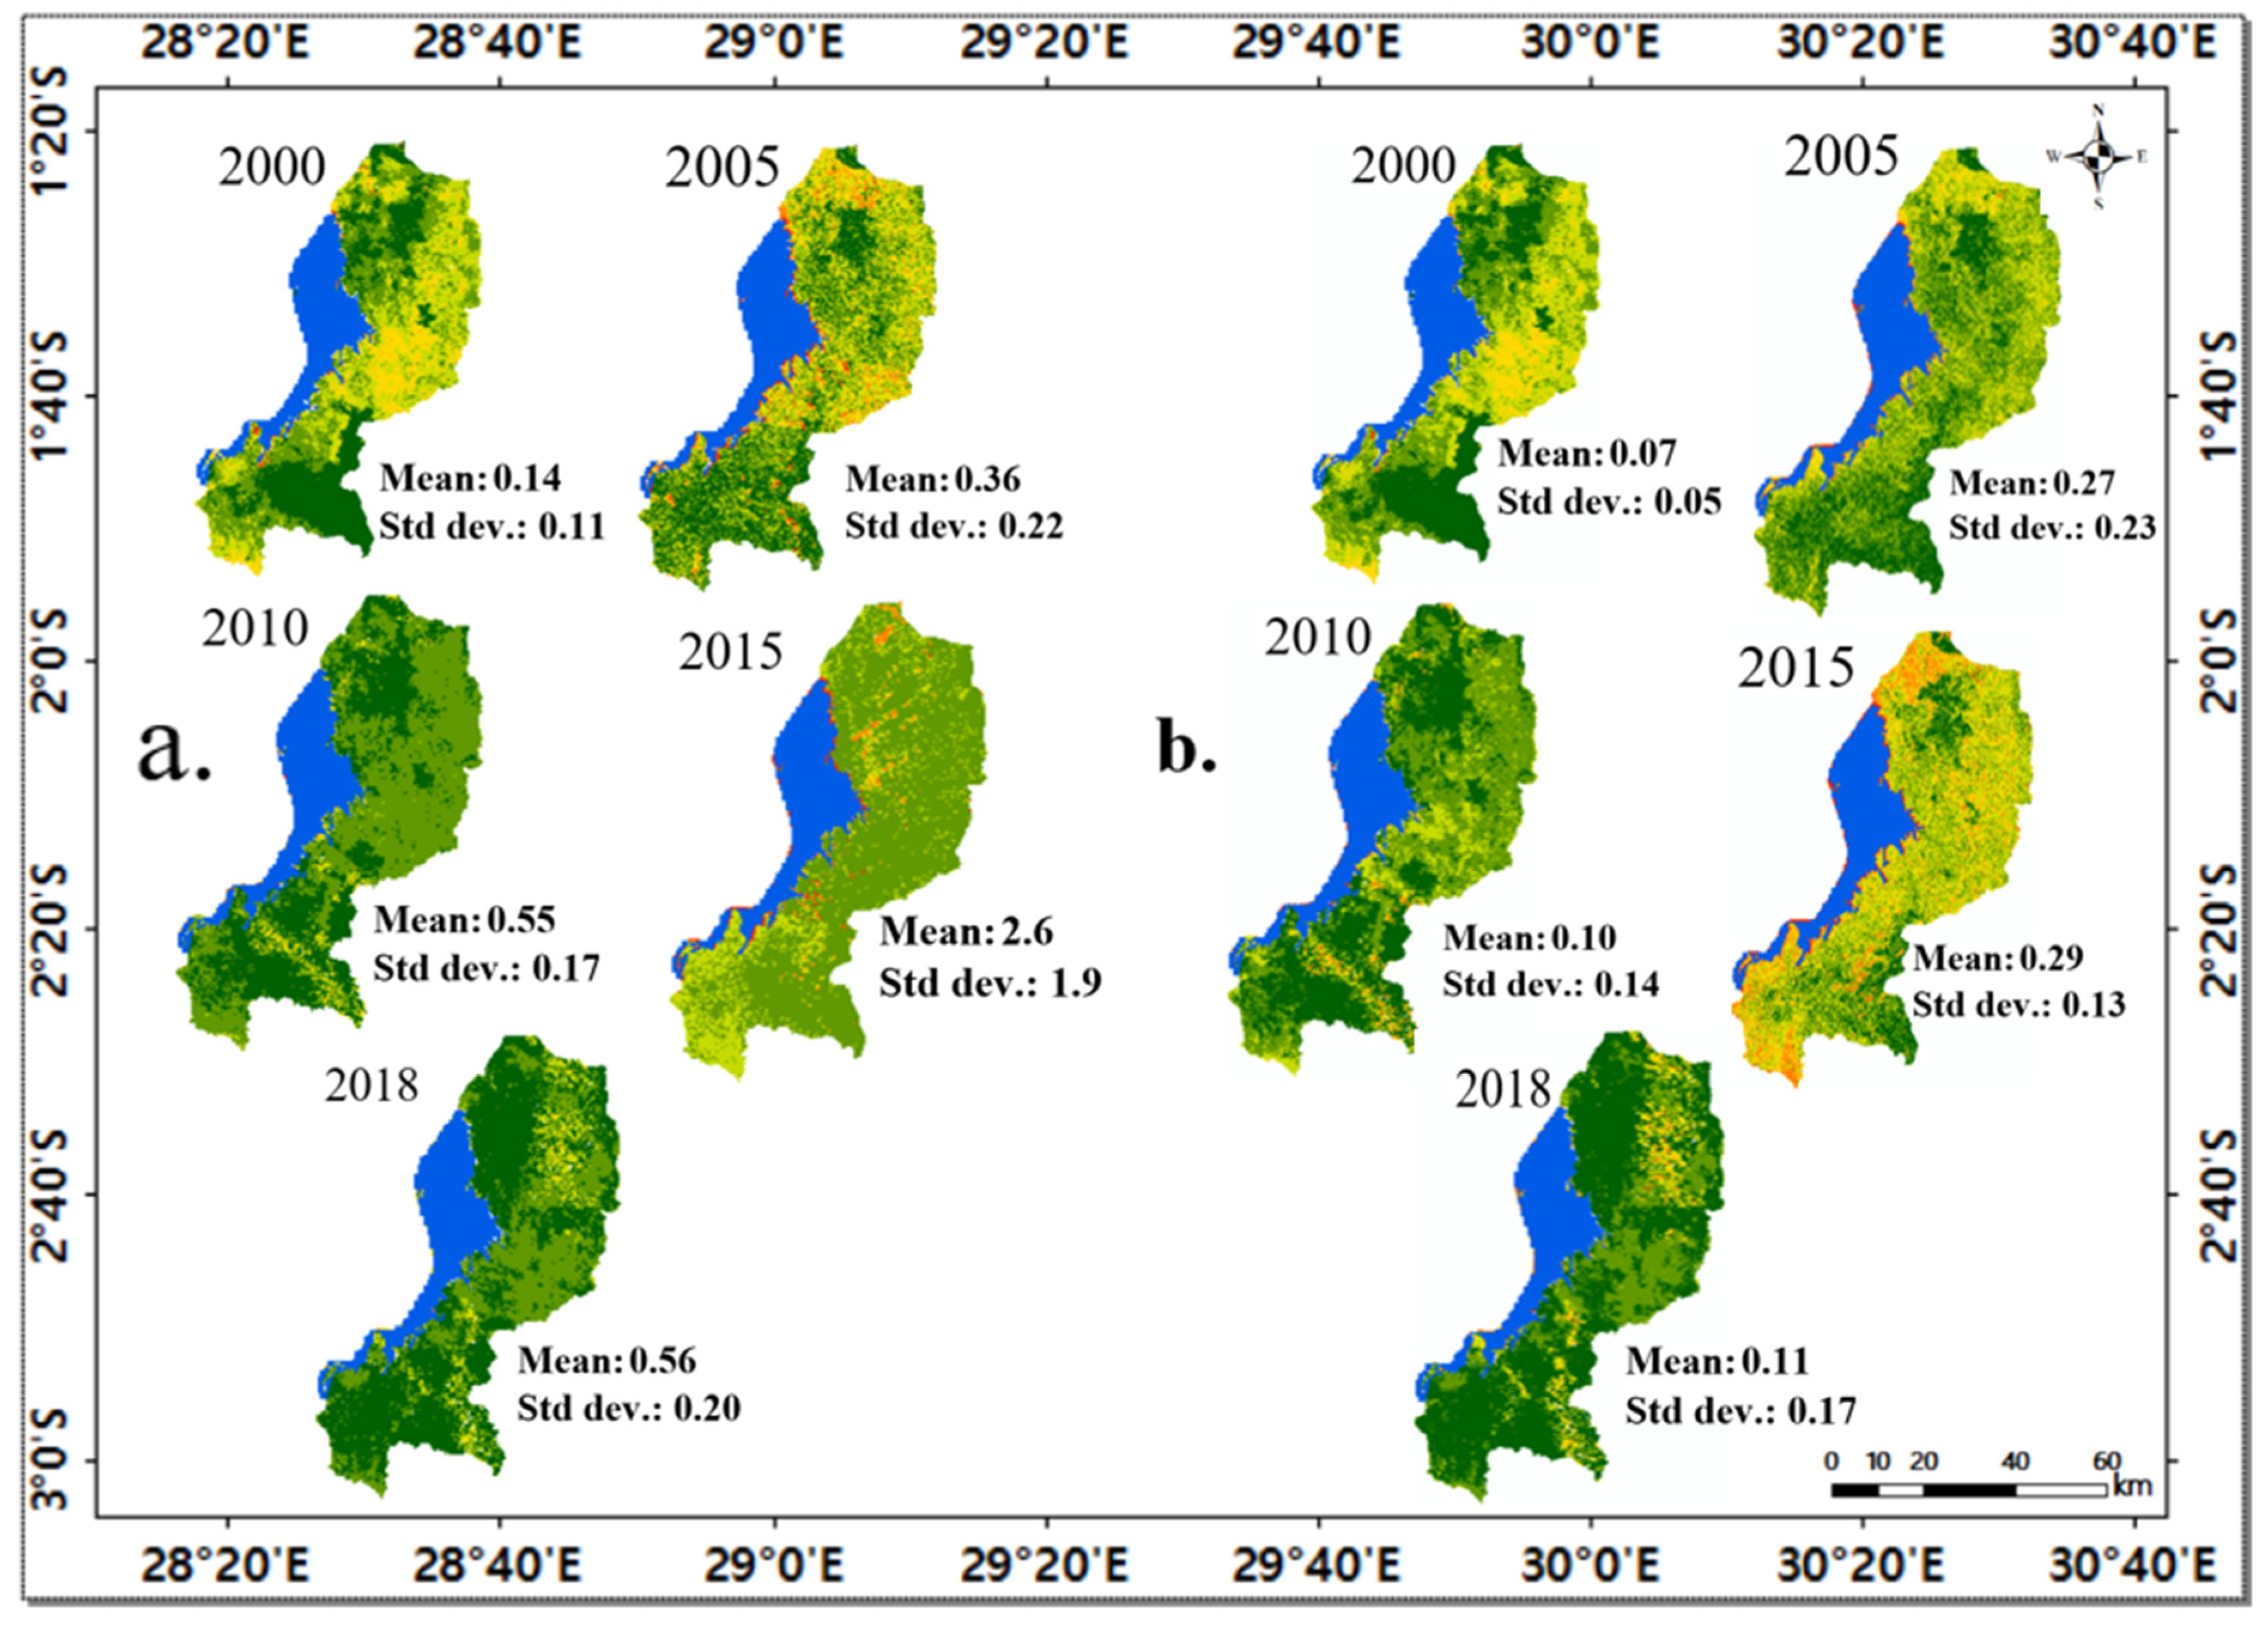
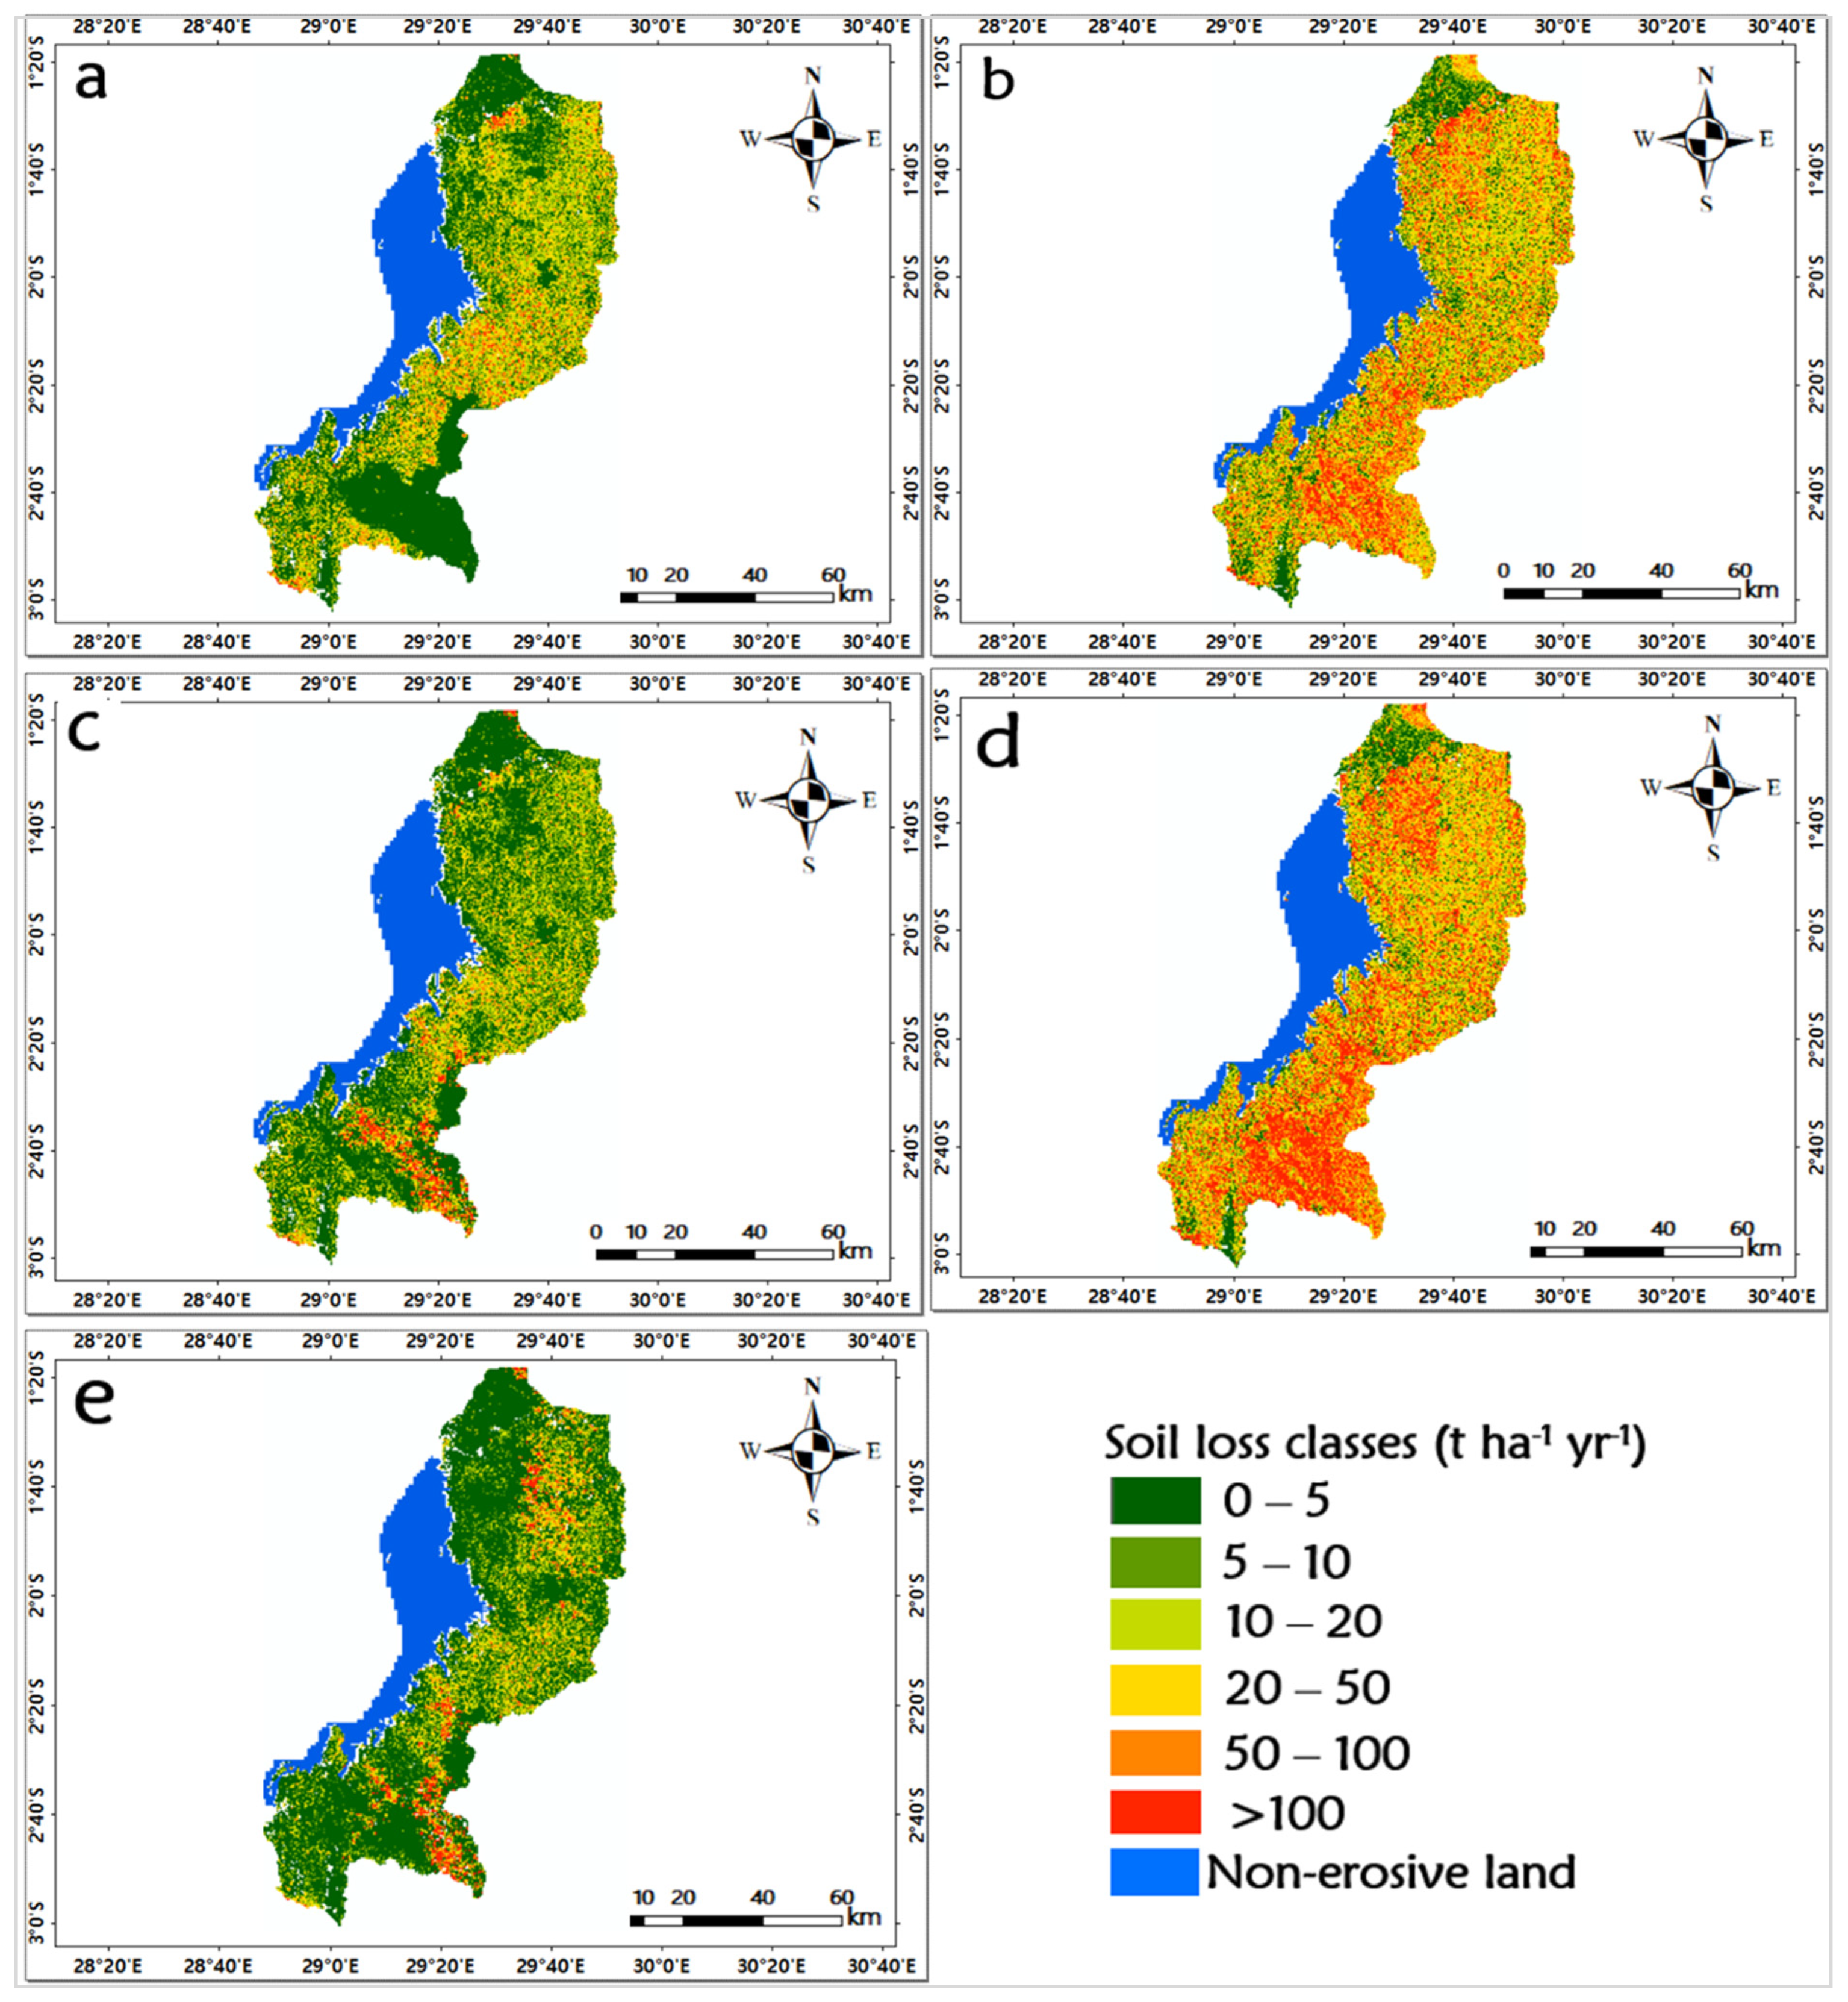
3.5. Soil Loss Rate Estimation

To facilitate the analysis and identify soil erosion severity classes that are of high priority for conservation practices, the estimated soil erosion maps (Figure 9) were classified into six categories. From total surface area (5883 km2), erosion-prone areas were estimated at 4670.8 km2 (79.4%). Based on the LULC, the remaining 20.6% in each was occupied by non-erosive lands. The results revealed a mean soil loss of 15.1 t ha−1 yr−1 in 2000, 47.4 t ha−1 yr−1 in 2005, 16.3 t ha−1 yr−1 in 2010, 66.8 t ha−1 yr−1 in 2015 and 15.3 t ha−1 yr−1 in 2018 for entirely erosive lands.
An estimated soil loss rate of ≤10 t ha−1 yr−1 was considered as a threshold for soil erosion rate tolerance; however, an area that experiences a soil erosion rate of >10 t ha−1 yr−1 occupied by the area with high erosion susceptibility requires urgent soil erosion control measures (Figure 9). Analyses showed that an area of about 2684.16 km2 (57.5%) in 2000, 1017.2 Km2 (21.8%) in 2005, 3033.86 km2 (64.9%) in 2010, 724.32 km2 (15.5%) in 2015 and 3445.87 km2 (73.8%) in 2018 had a sustainable soil erosion rate tolerance (≤10 t ha−1 yr−1). However, 1,985.84 km2 (42.5%) in 2000, 3,652.8 km2 (78.2%) in 2005, 1636.14 km2 (35.1%) in 2010, 3945.68 km2 (84.5%) in 2015 and 1224.13 km2 (16.8%) had an unsustainable mean rate of soil loss tolerance (>10 t ha−1 yr−1) (Figure 9 and Table 4). However, our study found a high increase in annual mean soil loss by 68.1% (15.11 t ha−1 yr−1 to 47.4 t ha−1 yr−1) from 2000 to 2005 and 75.5% (16.3 t ha−1 yr−1 to 66.8 t ha−1 yr−1) from 2010 to 2015, while the small percentage increase in annual mean soil loss was found to be 1.3% (15.1 t ha−1 yr−1 to 15.3 t ha−1 yr−1) from 2000 to 2018.
A soil erosion severity map was developed from the estimated soil erosion of the western province of Rwanda (Figure 9). The result showed that about 40.7% (1900.12 km2), 45.4% (2119.3 km2) and 59.2% (2764.44 km2) of the total erosive land highly was in the very low category (0–5 t ha−1 yr−1) of soil erosion risk in 2000, 2010 and 2018, which contributed to about 0.64%, 0.58% and 0.45% of the mean annual estimated soil loss, respectively. These results also show that only about 30% (1397.3 km2) and 29% (1350.06 km2) of the total erosive land was mostly covered by the category of high soil erosion rate (20–50 t ha−1 yr−1) in 2005 and 2015, respectively (Table 3). High, very high and extremely high soil loss categories experienced increases of 13.8%, 12.4% and 12.42% in terms of total erosive land from 2000 to 2005 (Figure 9a,b), respectively, while increases of about 16.77%, 15.7 % and 21.06% were recorded from 2010 to 2015 (Figure 9c,d), respectively. Therefore, the high (20–50 t ha−1 yr−1), very high (50–100 t ha−1 yr−1) and extremely high (>100 t ha−1 yr−1) erosion categories were found mainly in a small part of the Rusizi district (Bweyeye and Butare sectors), Nyamasheke district (Karambi, Mahembe, Cyato, Rangiro and Bushekeri sectors), Ngororero district (Muhanda sector) and in Nyabihu district (in Muringa Sector and north-east part of Kabatwa sector (Figure 9b,d,e). Commonly, this was mainly influenced by steep slopes in the area, rainfall intensity and land-cover management factors.

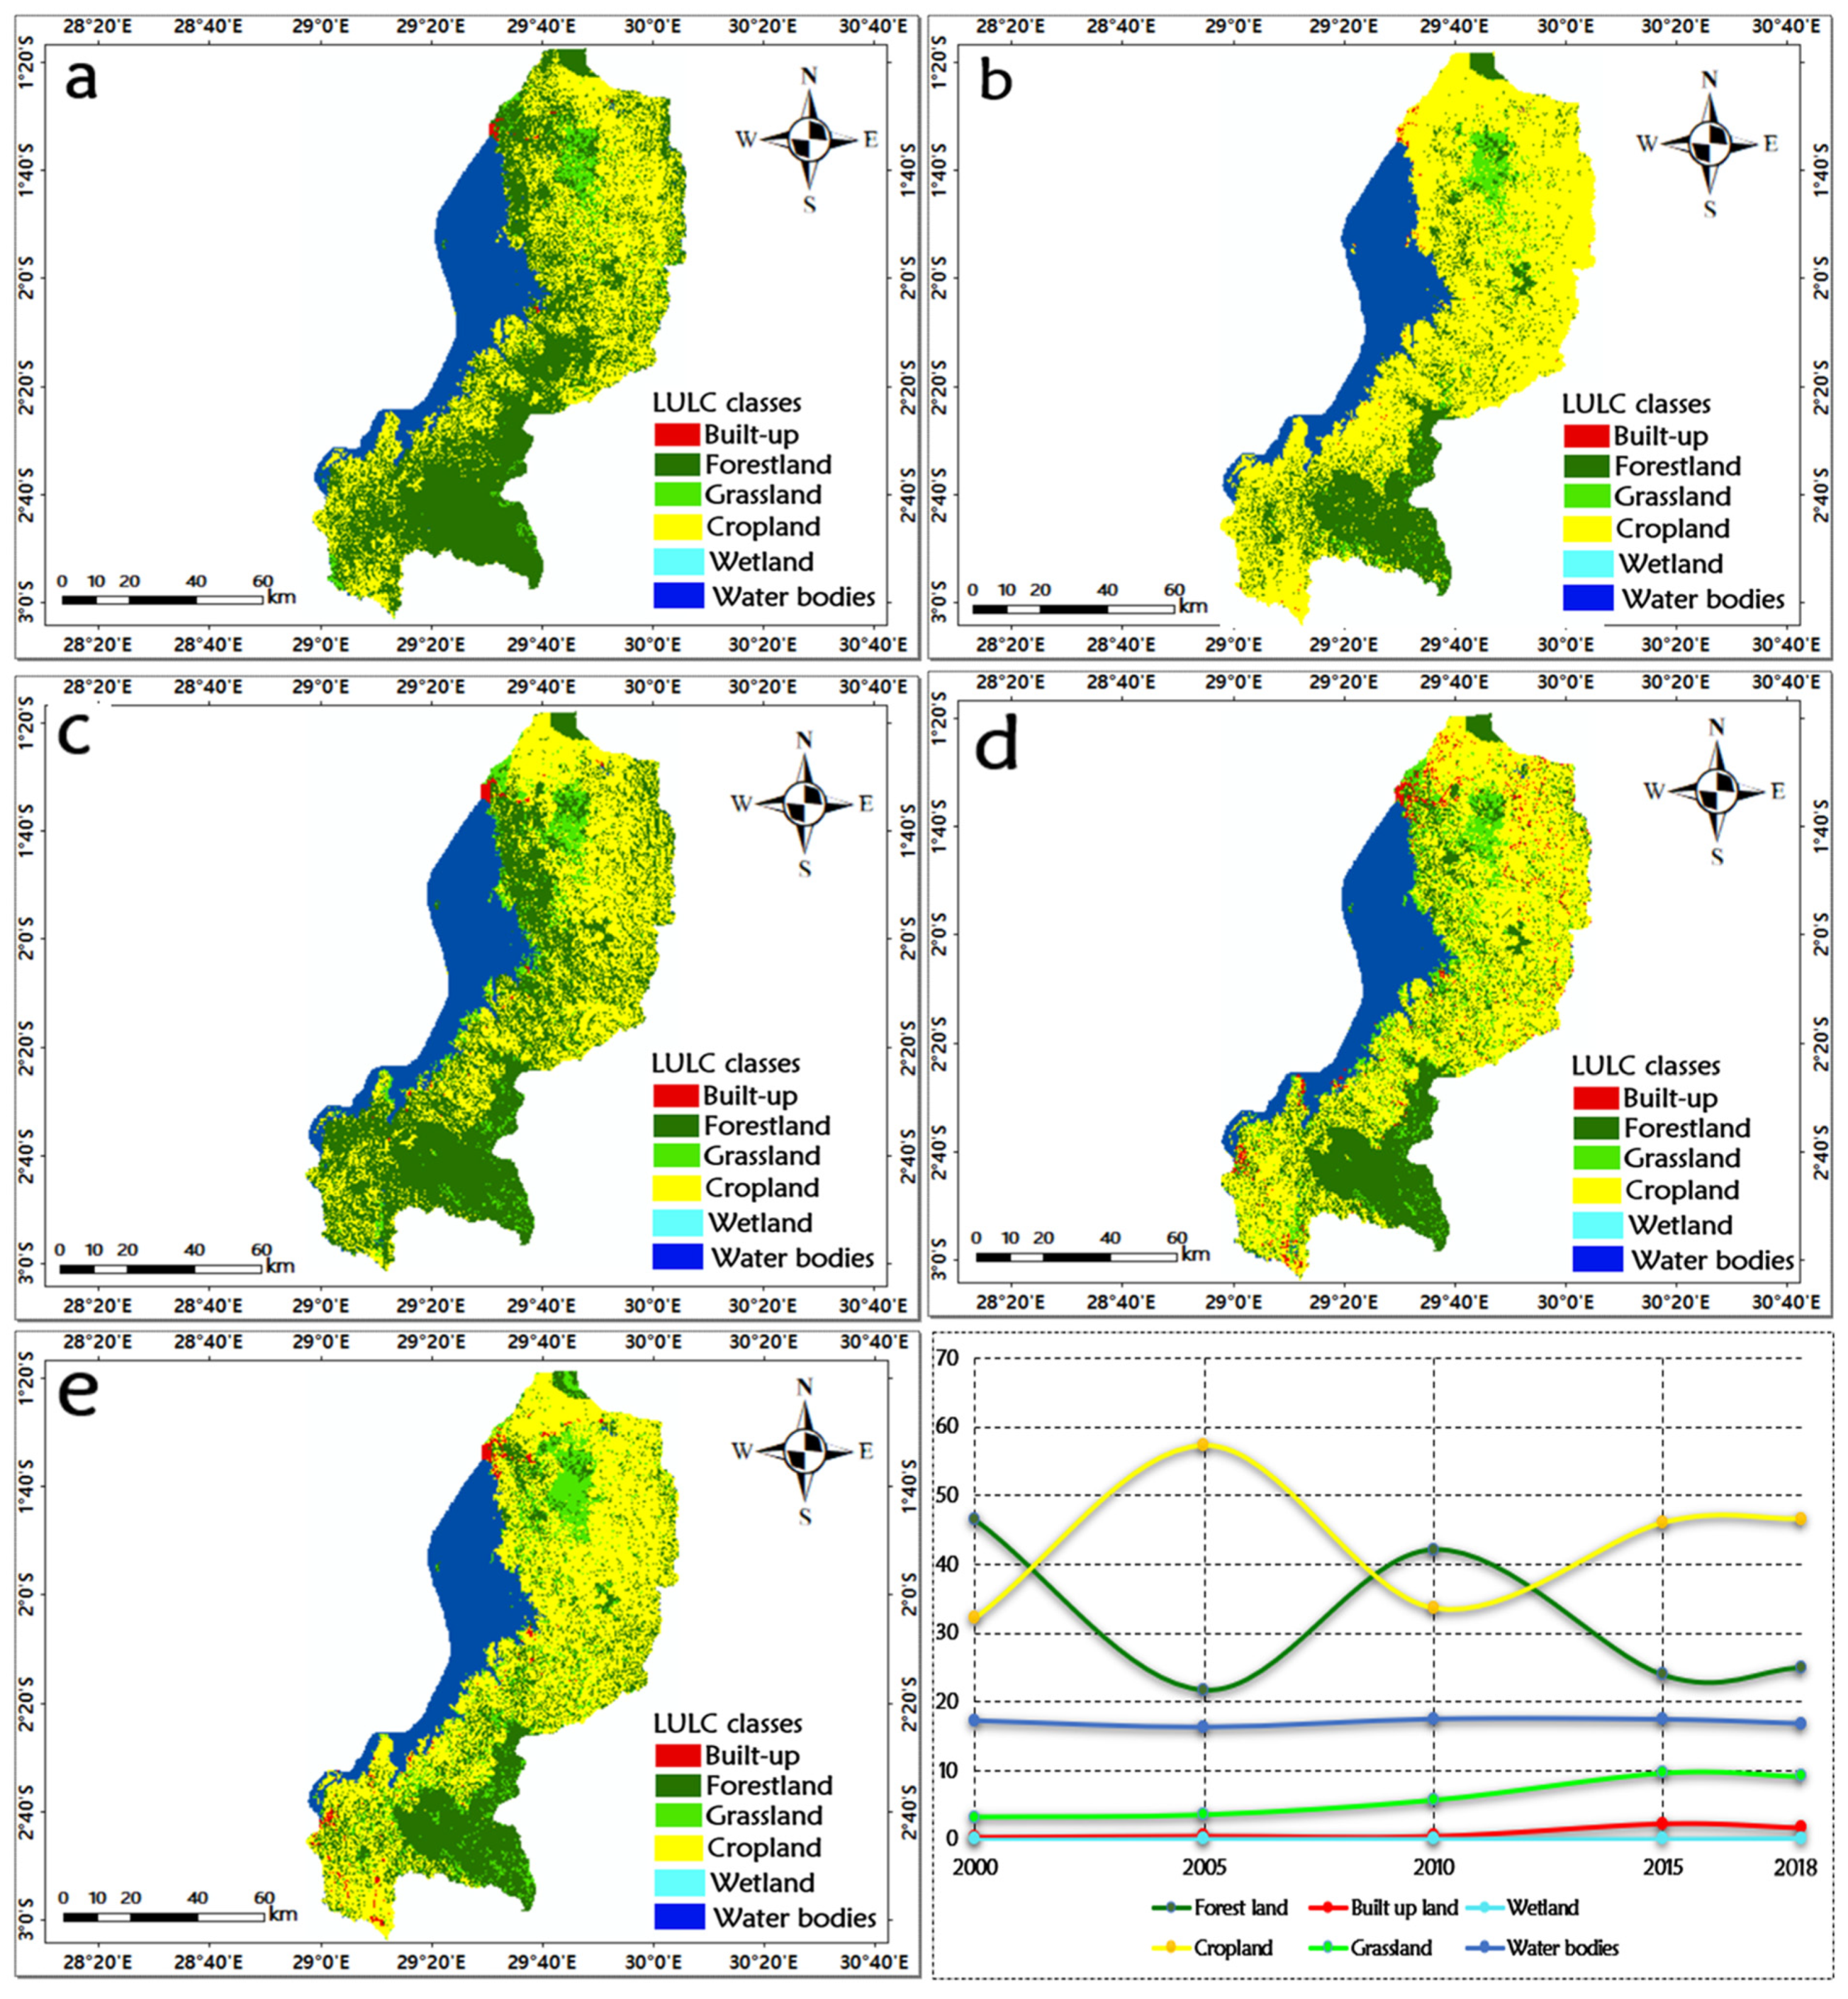
3.6. LULC Change and Its Impacts on Soil Erosion Rate

Classification and statistical results are presented in Figure 10 and Table 4, while estimated soil erosion rates per each LULC are shown in Table 5. We assessed the dynamics in LULC over eighteen years subdivided into different time intervals (2000, 2005, 2010, 2015 and 2018). The forest area revealed the most significant change. The significant decrease in forestland, which was closely doubled, reduced from 46.5% to 21.84% in 2000 and 2005, and from 42.14% to 23.99% in 2010 to 2015, respectively. This decreasing trend from forestland occurred due to the expense of the increase in cropland from 32.2% in 2000 to 57.29% in 2005, as well as from 33.79% in 2010 to 46.18 % in 2015, respectively. The estimated grassland cover was about 3.28%, 3.6%, 5.76%, 9.75% and 9.23% of the total area in 2000, 2005, 2010, 2015 and 2018, respectively.
Considering the entire surface area, the net annual forest loss was 53% from 2000 to 2005, and 43% from 2010 to 2015, respectively (Table 5). The built-up area had less significant land cover, but steadily increased from 0.43% to 0.6 and 0.57 to 2.39% between 2000 and 2005, and between 2010 and 2015, respectively. This increase is due to a decrease in forestland, resulting in an increase of mean soil loss in the cropland from 15.6 t/ha/yr to 34.3 t/ha/yr between 2000 and 2005 and from 10.4 t/ha/yr to 45.41 t/ha/yr between 2010 and 2015 (Table 6). Therefore, there was a mean increase of 18.7 t/ha/yr (about 120%) and 35.01 t/ha/yr (about 337%) from 2000 to 2005 and 2010 to 2015 in cropland, respectively; these values were generated at the expense of a high decrease in forest cover (Table 5).

3.7. Estimated Mean Soil Loss for Each LULC Category

Comparing the soil erosion based on land-use types, the results showed a significant increase in the estimated soil erosion rates in cropland in 2005 and 2015 (Table 6). A decline in this type of land was found in 2010 and 2018. Cropland covered about 32.2%, 57%, 33.7%, 46.1% and 46% of the total studied area in 2000, 205, 2010, 2015 and 2018. However, it is responsible for about 31%, 21%, 20%, 18.2%, and 16% of the total predicted soil loss in 2000, 2005, 2010, 2015 and 2018, respectively. From 2000 to 2005 and 2010 to 2015, the predicted mean soil erosion in cropland is more than two times (15.6 t/ha/yr to 34.3 t/ha/yr) and more than four times (10.4 t/ha/yr to 45.41 t/ha/yr) higher than mean soil erosion rates, respectively (Table 6). Water bodies are considered as non-erosive land. The forestland and grassland are expected to have low erosion rates, but the results show that meant soil loss increased. Therefore, the poor coverage of trees due to a decline in forestland in the steep slopes accelerates soil erosion rates in the area.

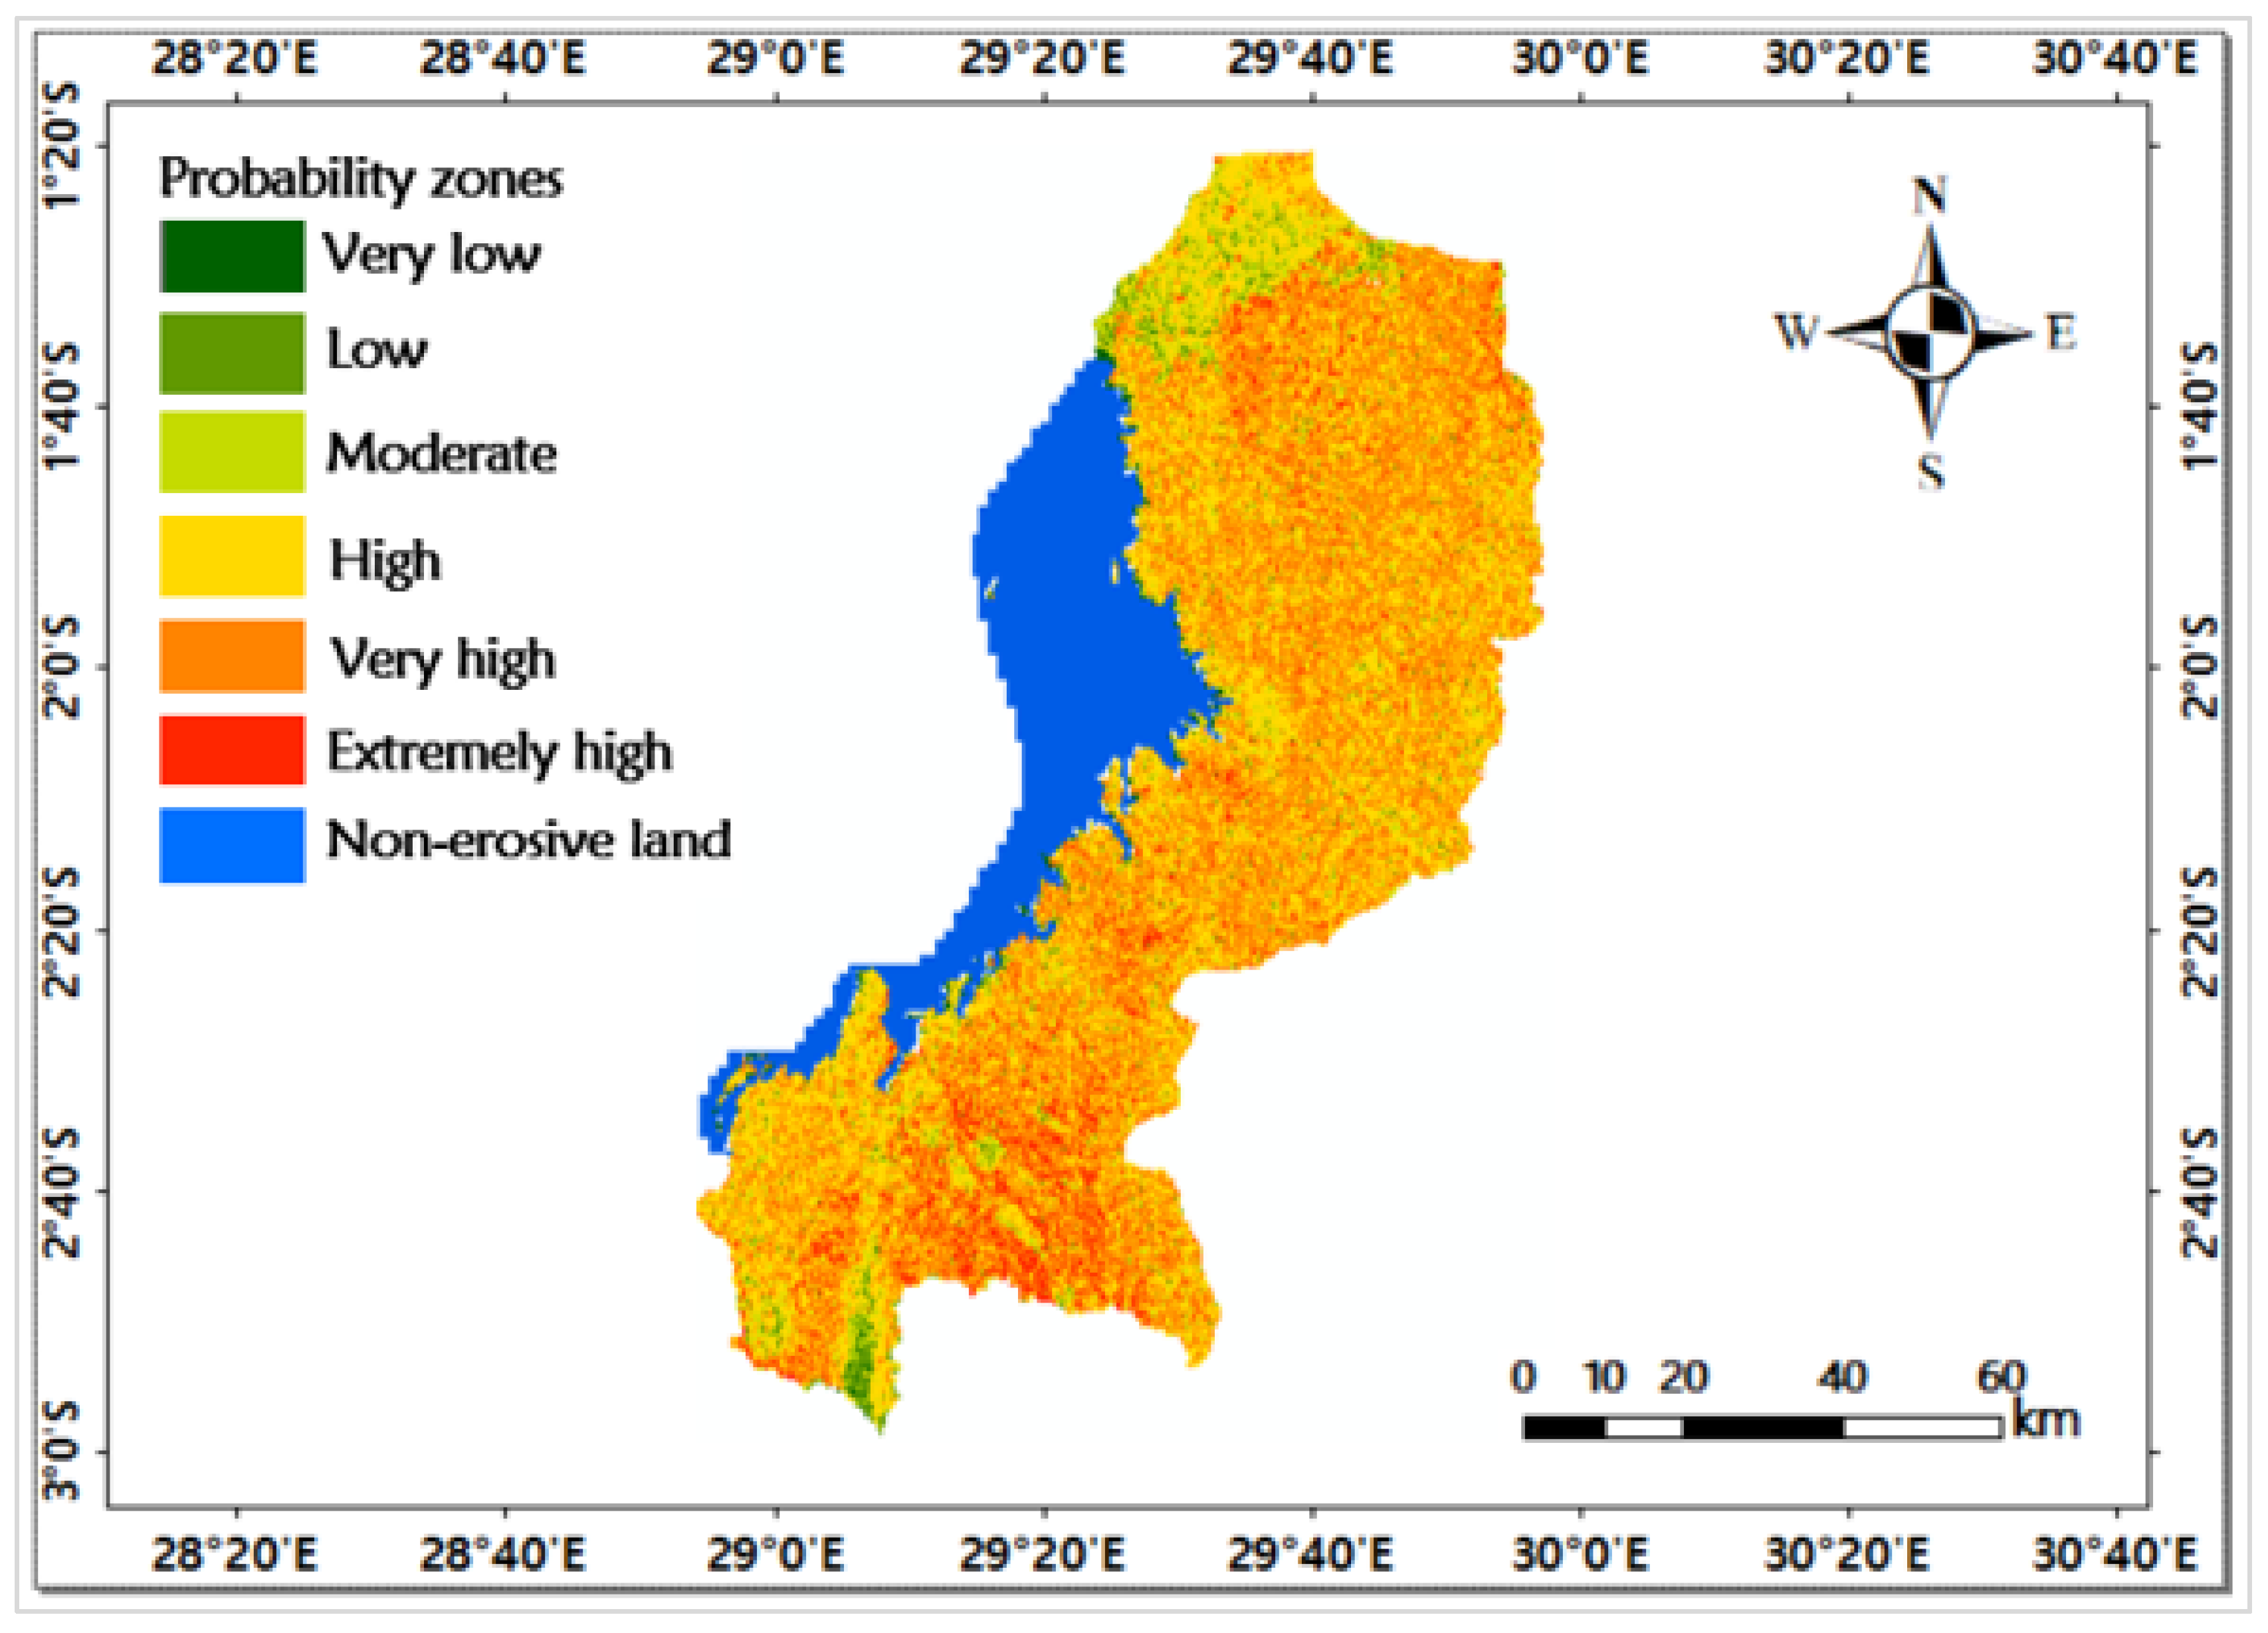
3.8. Soil Erosion Probability Zones

The zones with a probability of soil erosion have been classified into six categories, including very low, low, moderate, high, very high and extremely high risk. It was observed that approximately 44.9% of the total eroded land produced a very high mean soil erosion of 697.6 t ha−1 yr−1 (Figure 11), while zones with high probability occupied 42.9% of the total eroded land, with 315 t ha−1 yr−1 mean soil loss. That said, zones of extremely high probability were found to cover 5.03% of the total eroded land, producing a mean soil loss of 1164.6 t ha−1 yr−1. Therefore, the three smallest probability zones were very low, low and moderate, which covered about 0.46%, 2.10% and 4.5% of the total eroded area and produced a mean soil loss of 3.47 t ha−1 yr−1, 32.79 t ha−1 yr−1 and 75.8 t ha−1 yr−1, respectively.

4. Discussion

4.1. Cover Management (C) Factor and Biophysical Variables

The change in soil loss prediction can be reflected by NDVI with some variation in the values of cover management practices. The C-factor is one of the decisive parameters of the RUSLE, preventing bias from any C-factor estimation approach, which affects the prediction of soil erosion rate estimations [46]. For this, estimating the C-factor using NDVI by considering biophysical variables should be taken into account, as the applied equation has an influence on the estimated values. For this reason, the NDVI used to estimate C-factor was analyzed by checking its sensitivity to some biophysical factors such as rainfall, elevation and soil erodibility. The results revealed a good agreement between both variables (NDVI and biophysical factors) with acceptable and good correlation coefficients (Figure 5, Figure 6, Figure 7 and Figure 8). This is in agreement with a previous study [42] reporting that the NDVI-derived C-factor used to estimate soil erosion can be sensitive to different biophysical variables, such as soil condition, topographic features and vegetation phenology. In this sense, Jin and Zhang [47] argued that the spatial distribution of vegetation cover through NDVI was usually affected by elevation, concluding that elevation was the main controlling factor in vegetation growth in their study area. The result of this study revealed that variation in annual NDVI was determined by climate variable including rainfall; this is aligned with an earlier study [48] that reported that various climate factors, including rainfall, played a vital role in vegetation growth. Moreover, topographic reasons also conformed with an earlier study [19] that argued that highly mountainous and elevated sites are susceptible to soil erosion due to the domination of high inclination slopes and heavy rainfall distribution. Ayalew and Deumlich [42] revealed that a higher erodibility condition was associated with higher C-factor values which, in turn, might affect the prediction of soil erosion. To this end, this study found that the Van der Knijff and Jones [44] approach (Cvk) was not fit to estimate the C-factor in the study area, as it overestimated the values [18]. This can be clarified by the fact that this approach assessed the monthly C-factor based on NDVI and then calibrated the factor in a European study area that was totally different from the current study area (tropical) in terms of climate conditions and vegetation features. This is in agreement with Almagro and Thomé [43], who found underestimated Cvk values and concluded that this method was not suitable for tropical regions such as Rwanda; thus, this approach should be changed to CvkA. Generally, this study adapted the aforementioned equation by also performing a correlation analysis between the used NDVI and the produced C-factor (Figure 5), leading to a good result in the prediction of soil loss in the study area without overestimation.

4.2. Variation in Land Use Land Cover and Soil Erosion

This study found that the main reason behind an accelerated soil erosion rate is attributable to changes in LULC (Figure 10). The changes were depicted by the expansion of agricultural areas resulting from the decrease in forestland, steep slopes and high annual rainfall, which are also considered to be core soil erosion risk factors. Compared with different parts of the world, studies [49,50,51] have disclosed different rates of mean soil erosion under different land uses. The same conclusion was reached for the average annual soil losses following the fluctuation of land-use types triggered by changing rainfall patterns, while the highest estimated average annual soil loss per LULC has been accredited to seasonal agricultural land [52]. Moreover, based on global circulation models (GCMs) data, projected future storm rainfall and soil erosion rates in a monsoon-dominated region of eastern India showed that these regions were challenged by relatively greater erosion problems triggered by intense precipitation. They concluded that the loss of soils during erosion processes leads to decline in soil fertility, and thus the deterioration of soil resources in the region; this consequence should be expected in the study area examined in this paper. All the aforementioned drivers could be accelerated by LULC change, as the area showed dynamism. In the study area, the LULC change affecting soil erosion can be depicted clearly in the areas where a decrease in forestland and expansion of cropland areas resulted in an increase in the mean soil erosion of cropland cover from 2000 to 2005 and from 2010 to 2015 (Table 6). Previous studies found that the LULC change affects soil erosion rates by producing higher mean soil loss [18,25,30]. In the temperate forest zone of Russia characterized by multifaceted levels of land-use history, Zhidkin and Fomicheva [53] compared the simulated rates of soil erosion given by two models based on the type of precipitation (rainfall and snow erosion). Concerning rainfall acting as a trigger and the same types of land-use cover as examined in this present study, they found that variations in arable land (cropland) area and cropping structure were factors that determined changes in soil erosion to a greater extent, while other factors had no directional trend. This latter point is in accordance with the findings of this study, where the risk of erosion increases when land use changes from forestland in 2000 and 2010 to cropland in 2005 and 2015, respectively (Figure 10). The features of each LULC category could be considered in changing the average soil loss estimated from one land-use class to another [54,55]. Similar to this study, some LULC types such as cropland and built-up land increased, while others, including forestland, decreased (Figure 10). The change in forestland to uncontrolled agricultural lands is the main cause blamed for the increase in soil erosion, with triggers such as heavy rainfall and the length and steepness of slopes (Figure 9); these results are in accordance with a study [52] conducted in Kenya located in the same region as our case study disclosing that the increment of slope steepness and its length (LS-factor) increases the level of soil erosion due to the high velocity and erosivity of runoff. Generally, in rural areas of the western province, a large number of the residents depends on agriculture as a means of livelihood [56]. Land scarcity for agriculture and the continuous increase in demand for agricultural commodities are the main reasons pushing communities to convert forest and grasslands into cultivated lands [56]. Unfortunately, unprecedented climate changes are expected in the region, and the most prominent climatic change impact on rain-fed agriculture results in a reduction in crop productivity [57,58]. Thus, areas with a considerable conversion from forest to less vegetated areas, coupled with steep slopes and rainfall intensity, in the study area should expect higher soil erosion potential [25,59,60,61].

4.3. Estimation of Soil Loss and Probability Zones

Table 4 shows the estimated soil erosion intensity classes and the mean soil erosion rate of a certain magnitude of soil loss and its area coverage over the previous two decades. In the entire study area, soil erosion severity was classified from very low to extremely high. These classes were concentrated in cultivated land and steep slope areas, which indicated that areas in these categories were highly susceptible to soil erosion. These findings are in accordance with a previous study [62] providing details on the intensity of soil erosion in different slope gradients, whereby the analysis of soil erosion intensity exhibited a slightly intense erosion on largely gentle (<5°) slope terrains and steep terrains (15–25°), while severe soil erosion was found to be on moderate (5–15°) slopes. However, the very low and low soil erosion classes fell under a <10 t ha−1 yr−1 severity class, making them less susceptible to soil erosion based on slope gradient [25,30]. This study also indicates a significant increase in high, very high and extremely high soil erosion severity classes of about 13.85, 12.3% and 12.42%, respectively, between 2000 and 2005. Increases of about 16.77%, 15.7% and 21.06%, were found in high, very high and extremely high soil erosion severity class, respectively, from 2010 to 2015, accelerated by the expansion of cropland in steep slopes. Nevertheless, a small decline in three severity classes (very low, low, moderate) from 2005 to 2010 and from 2015 to 2018 resulted from various conservation activities implemented by local leaders and sector land officers in the study area for sustainable land-use management [25,29]. The activities include the implementation of bench terraces on steep cultivated land and afforestation campaigns. While this optimistic initiative to lessen the soil loss caused by erosion has proven popular, problems related to clearing natural forests and unsuitable cultivation on steep slopes still exist. Therefore, rainfall intensity and forest clearance become core factors for increasing zones prone to soil erosion within the study area. It was also demonstrated that about 44.9 % of the study area fell under very high soil erosion risk, while high-probability zones covered 42.9% of the study areas (Figure 11). Compared with an earlier study [63] in the Urmodi river watershed (India), a significant output regarding increased conversion was obtained from very slight to very severe risk zone; research concluded the existence of extensive variation in very severe soil vulnerable risk zones over the study period. Overall, the findings of this study and other studies carried out in Rwanda and east African regions similar to results reported by Karamage [30,62], which seem to overestimate soil loss rates.
The conversion of lower to higher risk category areas of soil erosion was detected all over the study area. Hence, croplands and grasslands, with their related conversions as the main LULC classes, should lead the immediate execution of more suitable agricultural practices; terracing integrated with surface residue mulching and cover-cropping and cross-slope farming should be suggested for reducing soil erosion potential within agricultural areas in the western province of Rwanda.

5. Conclusions

In this study, an adapted approach (CvkA) for the estimation of cover management (C) factor from RUSLE was explored in comparison with the formerly used approach (Cvk) based on NDVI. We also analyzed the correlation between the adapted C-factor (CvkA), NDVI and different biophysical variables such as the rainfall, elevation and soil erodibility. The Cvk approach presented an overestimation of the C-factor values, making it unsuitable for the study area. Therefore, using the adapted C-factor, which was found to be suitable for this study, we analyzed the impacts of LULC dynamics on soil erosion risk in agricultural areas of the western province of Rwanda. The results showed significant correlations between the NDVI and the biophysical variables, which implied that using remote sensing data to capture the spatial and temporal changes in C-factor estimation can serve as an input factor for soil erosion modeling procedures that can themselves be enhanced by considering the quantified sensitivity of NDVI-based C-factor estimations.
Moreover, the results revealed that the area experienced estimated annual mean soil losses of about 15.1 t ha−1 yr−1, 47.4 t ha−1 yr−1, 16.3 t ha−1 yr−1, 66.8 t ha−1 yr−1 and 15.3 t ha−1 yr−1 in 2000, 2005, 2010, 2015 and 2018, respectively. However, cropland experienced a great increase in soil loss during the period when there was a decline in forests (2000–2005 and 2010–2015). It was also observed that the rate of erosion varied based on steep slopes and LULC changes. The noted differences in the studied period indicated that LULC changes affected the rate of soil erosion significantly. The application of the weighted index overlay (WIO) method supported the categorizing of areas into different probable zones of soil erosion risk, which was useful for developing sustainable soil conservation measures. The estimated amount of soil loss suggests the urgent implementation of conservation practices such as terracing, integrated with surface residue mulching and cover cropping and cross-slope farming in the study area. The results of this study may be useful for soil and water conservation planning and soil loss estimations. However, the application of the adapted C-factor (CvkA) approach can be used in similar tropical regions after evaluating its performance. Future research should attempt to compare NDVI with other spectral indices such as the soil adjusted vegetation index and enhanced vegetation index in the context of C-factor estimation.

Author Contributions

Conceptualization, A.P.M., L.L. and W.L.; methodology and data curation, A.P.M. and R.M.; software and visualization, P.M.K. and V.N.; formal analysis and writing the original draft preparation, A.P.M.; review and editing previous draft versions, L.N., R.M., A.U., S.U.; supervision and funding acquisition, L.L. All authors have read and agreed to the published version of the manuscript.

Funding

This research funded by the key program for international cooperation of the Bureau of International Cooperation, Chinese Academy of Sciences: 151542KYSB20200018; Sino-Africa Joint Research Center of Chinese Academy of Sciences: SAJC202107.

Acknowledgments

This study was funded and supported by the key program for international cooperation of the Bureau of International Cooperation, Chinese Academy of Sciences (Grant No.151542KYSB20200018) and the Sino-Africa Joint Research Center of Chinese Academy of Sciences (Grant Number: SAJC202107). The authors are also thankful to Tianshan Station for Snow cover and Avalanche Research for its remarkable assistance in the data collection and processing.

Conflicts of Interest

The authors declare no conflict of interest.

References

  1. Nunes, A.N.; de Almeida, A.C.; Coelho, C.O. Impacts of land use and cover type on runoff and soil erosion in a marginal area of Portugal. Appl. Geogr. 2011, 31, 687–699. [Google Scholar] [CrossRef]
  2. Crosson, P.; Pimentel, D.; Harvey, C.; Resosudarno, P.; Sinclair, K.; Kurz, D.; Fitton, L. Soil erosion estimates and costs. Science 1995, 269, 461–466. [Google Scholar]
  3. Borrelli, P.; Robinson, D.A.; Fleischer, L.R.; Lugato, E.; Ballabio, C.; Alewell, C.; Ferro, V. An assessment of the global impact of 21st century land use change on soil erosion. Nat. Commun. 2017, 8, 2013. [Google Scholar] [CrossRef] [Green Version]
  4. Ganasri, B.; Ramesh, H. Assessment of soil erosion by RUSLE model using remote sensing and GIS-A case study of Nethravathi Basin. Geosci. Front. 2016, 7, 953–961. [Google Scholar] [CrossRef] [Green Version]
  5. Zare, M.; Panagopoulos, T.; Loures, L. Simulating the impacts of future land use change on soil erosion in the Kasilian watershed, Iran. Land Use Policy 2017, 67, 558–572. [Google Scholar] [CrossRef]
  6. García-Ruiz, J.M.; Beguería, S.; Nadal-Romero, E.; González-Hidalgo, J.C.; Lana-Renault, N.; Sanjuán, Y. A meta-analysis of soil erosion rates across the world. Geomorphology 2015, 239, 160–173. [Google Scholar] [CrossRef] [Green Version]
  7. De Vente, J.; Poesen, J.; Verstraeten, G.; Govers, G.; Vanmaercke, M.; Van Rompaey, A.; Arabkhedri, M.; Boix-Fayos, C. Predicting soil erosion and sediment yield at regional scales: Where do we stand? Earth Sci. Rev. 2013, 127, 16–29. [Google Scholar] [CrossRef]
  8. Shi, Z.H.; Ai, L.; Fang, N.F.; Zhu, H.D. Modeling the impacts of integrated small watershed management on soil erosion and sediment delivery: A case study in the Three Gorges Area, China. J. Hydrol. 2012, 438, 156–167. [Google Scholar] [CrossRef]
  9. Fistikoglu, O.; Harmancioglu, N.B. Integration of GIS with USLE in assessment of soil erosion. Water Resour. Manag. 2002, 16, 447–467. [Google Scholar] [CrossRef]
  10. Li, P.; Mu, X.; Holden, J.; Wu, Y.; Irvine, B.; Wang, F.; Gao, P.; Zhao, G.; Sun, W. Comparison of soil erosion models used to study the Chinese Loess Plateau. Earth -Sci. Rev. 2017, 170, 17–30. [Google Scholar] [CrossRef] [Green Version]
  11. Alkharabsheh, M.M.; Alexandridis, T.K.; Bilas, G.; Misopolinos, N.; Silleos, N. Impact of land cover change on soil erosion hazard in northern Jordan using remote sensing and GIS. Procedia Environ. Sci. 2013, 19, 912–921. [Google Scholar] [CrossRef] [Green Version]
  12. De Vente, J.; Poesen, J. Predicting soil erosion and sediment yield at the basin scale: Scale issues and semi-quantitative models. Earth Sci. Rev. 2005, 71, 95–125. [Google Scholar] [CrossRef]
  13. Renard, K.G. Predicting Soil Erosion by Water: A Guide to Conservation Planning with the Revised Universal Soil Loss Equation (RUSLE); United States Government Printing: Washington, DC, USA, 1997. [Google Scholar]
  14. Karamage, F.; Zhang, C.; Liu, T.; Maganda, A.; Isabwe, A. Soil erosion risk assessment in Uganda. Forests 2017, 8, 52. [Google Scholar] [CrossRef]
  15. Erdogan, E.H.; Erpul, G.; Bayramin, I. Use of USLE/GIS Methodology for Predicting Soil Loss in a Semiarid Agricultural Watershed. Environ. Monit. Assess. 2006, 131, 153–161. [Google Scholar] [CrossRef] [PubMed]
  16. Chandramohan, T.; Durbude, D.G. Estimation of soil erosion potential using universal soil loss equation. J. Indian Soc. Remote Sens. 2002, 30, 181–190. [Google Scholar] [CrossRef]
  17. Da Silva, R.M.; Montenegro, S.M.G.L.; Santos, C.A.G. Integration of GIS and remote sensing for estimation of soil loss and prioritization of critical sub-catchments: A case study of Tapacurá catchment. Nat. Hazards 2012, 62, 953–970. [Google Scholar] [CrossRef]
  18. Nyesheja, E.M.; Chen, X.; El-Tantawi, A.M.; Karamage, F.; Mupenzi, C.; Nsengiyumva, J.B. Soil erosion assessment using RUSLE model in the Congo Nile Ridge region of Rwanda. Phys. Geogr. 2019, 40, 339–360. [Google Scholar] [CrossRef]
  19. Byizigiro, R.V.; Rwanyiziri, G.; Mugabowindekwe, M.; Kagoyire, C.; Biryabarema, M. Estimation of Soil Erosion Using RUSLE Model. and GIS: The Case of Satinskyi Catchment, Western Rwanda. Rwanda, J. Eng. Sci. Technol. Environ. 2020, 3, 20–56. [Google Scholar] [CrossRef]
  20. Niyonsenga, J.D.; Mugabowindekwe, M.; Mupenzi, C. Spatial analysis of soil erosion sensitivity using the revised universal soil loss equation model in Nyamasheke District, Western Province of Rwanda. Trans. GIS 2021, 25, 735–750. [Google Scholar] [CrossRef]
  21. Bosco, C.; de Rigo, D.; Dewitte, O.; Poesen, J.; Panagos, P. Modelling soil erosion at European scale: Towards harmonization and reproducibility. Nat. Hazards Earth Syst. Sci. 2015, 15, 225–245. [Google Scholar] [CrossRef] [Green Version]
  22. Van der Knijff, J.; Jones, R.; Montanarella, L. Soil Erosion Risk: Assessment in Europe; European Soil Bureau, European Commission Brussels: Brussels, Belgium, 2000. [Google Scholar]
  23. Jordan, G.; Van Rompaey, A.; Szilassi, P.; Csillag, G.; Mannaerts, C.; Woldai, T. Historical land use changes and their impact on sediment fluxes in the Balaton basin (Hungary). Agric. Ecosyst. Environ. 2005, 108, 119–133. [Google Scholar] [CrossRef]
  24. Hassan, Z.; Shabbir, R.; Ahmad, S.S.; Malik, A.H.; Aziz, N.; Butt, A.; Erum, S. Dynamics of land use and land cover change (LULCC) using geospatial techniques: A case study of Islamabad Pakistan. SpringerPlus 2016, 5, 812. [Google Scholar] [CrossRef] [PubMed] [Green Version]
  25. Nambajimana, J.d.D.; He, X.B.; Zhou, J.; Justine, M.F.; Li, J.L.; Khurram, D.; Mind’je, R.; Nsabimana, G. Land use change impacts on water erosion in Rwanda. Sustainability 2020, 12, 50. [Google Scholar] [CrossRef] [Green Version]
  26. Twagiramungu, F. Environmental profile of Rwanda. Consult. Rep. 2006, 78–254. [Google Scholar]
  27. Clay, D.C.; Lewis, L.A. Land use, soil loss, and sustainable agriculture in Rwanda. Case Stud. Hum. Ecol. 1996, 271–287. [Google Scholar]
  28. Sharma, A.; Tiwari, K.N.; Bhadoria, P. Effect of land use land cover change on soil erosion potential in an agricultural watershed. Environ. Monit. Assess. 2011, 173, 789–801. [Google Scholar] [CrossRef] [PubMed]
  29. Kabirigi, M.; Mugambi, S.; Musana, B.S.; Ngoga, G.T.; Muhutu, J.C.; Rutebuka, J.; Ruganzu, V.; Nzeyimana, I.; Nabahungu, N.L. Estimation of soil erosion risk, its valuation and economic implications for agricultural production in western part of Rwanda. J. Exp. Biol. Agric. Sci. 2017, 5, 525–536. [Google Scholar] [CrossRef]
  30. Karamage, F.; Zhang, C.; Ndayisaba, F.; Shao, H.; Kayiranga, A.; Fang, X.; Nahayo, L.; Muhire Nyesheja, E.; Tian, G. Extent of cropland and related soil erosion risk in Rwanda. Sustainability 2016, 8, 609. [Google Scholar] [CrossRef] [Green Version]
  31. Muhire, I.; Ahmed, F.; Elbasit, M.A. Spatio-temporal variations of rainfall erosivity in Rwanda. J. Soil Sci. Environ. Manag. 2015, 6, 72–83. [Google Scholar]
  32. Kayumba, P.M.; Chen, Y.; Mind’je, R.; Mindje, M.; Li, X.; Maniraho, A.P.; Umugwaneza, A.; Uwamahoro, S. Geospatial land surface-based thermal scenarios for wetland ecological risk assessment and its landscape dynamics simulation in Bayanbulak Wetland, Northwestern China. Landsc. Ecol. 2021, 36, 1699–1723. [Google Scholar] [CrossRef]
  33. Prasannakumar, V.; Vijith, H.; Abinod, S.; Geetha, N.J. Estimation of soil erosion risk within a small mountainous sub-watershed in Kerala, India, using Revised Universal Soil Loss Equation (RUSLE) and geo-information technology. Geosci. Front. 2012, 3, 209–215. [Google Scholar] [CrossRef] [Green Version]
  34. Van Dijk, A.; Bruijnzeel, L.; Rosewell, C. Rainfall intensity–kinetic energy relationships: A critical literature appraisal. J. Hydrol. 2002, 261, 1–23. [Google Scholar] [CrossRef]
  35. Morgan, R. Assessment of soil erosion risk in England and Wales. Soil Use Manag. 1985, 1, 127–131. [Google Scholar] [CrossRef]
  36. Desmet, P.; Govers, G. A GIS procedure for automatically calculating the USLE LS factor on topographically complex landscape units. J. Soil Water Conserv. 1996, 51, 427–433. [Google Scholar]
  37. McCool, D.K.; Brown, L.C.; Foster, G.R.; Mutchler, C.K.; Meyer, L.D. Revised slope steepness factor for the Universal Soil Loss Equation. Trans. ASAE 1987, 30, 1387–1396. [Google Scholar] [CrossRef]
  38. Patil, R.; Sharma, S. Remote Sensing and GIS based modeling of crop/cover management factor (C) of USLE in Shakker river watershed. In Proceedings of the 2nd International Conference on Chemical, Agricultural and Medical Sciences (CAMS-2013), Kuala Lumpur, Malaysia, 29–30 December 2013. [Google Scholar]
  39. Onyia, N.N.; Balzter, H.; Berrio, J.-C. Normalized difference vegetation vigour index: A new remote sensing approach to biodiversity monitoring in oil polluted regions. Remote Sens. 2018, 10, 897. [Google Scholar] [CrossRef] [Green Version]
  40. Aburas, M.M.; Abdullah, S.H.; Ramli, M.F.; Ash’aari, Z.H. Measuring land cover change in Seremban, Malaysia using NDVI index. Procedia Environ. Sci. 2015, 30, 238–243. [Google Scholar] [CrossRef] [Green Version]
  41. Ding, Y.; Zhao, K.; Zheng, X.; Jiang, T. Temporal dynamics of spatial heterogeneity over cropland quantified by time-series NDVI, near infrared and red reflectance of Landsat 8 OLI imagery. Int. J. Appl. Earth Obs. Geoinf. 2014, 30, 139–145. [Google Scholar] [CrossRef]
  42. Ayalew, D.A.; Deumlich, D.; Šarapatka, B.; Doktor, D. Quantifying the sensitivity of NDVI-based C factor estimation and potential soil erosion prediction using Spaceborne earth observation data. Remote Sens. 2020, 12, 1136. [Google Scholar] [CrossRef] [Green Version]
  43. Almagro, A.; Thomé, T.C.; Colman, C.B.; Pereira, R.B.; Junior, J.M.; Rodrigues, D.B.; Oliveira, P.T. Improving cover and management factor (C-factor) estimation using remote sensing approaches for tropical regions. Int. Soil Water Conserv. Res. 2019, 7, 325–334. [Google Scholar] [CrossRef]
  44. Van der Knijff, J.; Jones, R.; Montanarella, L. Soil Erosion Risk Assessment in Italy; CiteSeer: Princeton, NJ, USA, 1999. [Google Scholar]
  45. Shin, S.K.; Noh, H.; Kang, S.W.; Seo, B.J.; Lee, I.H.; Song, H.Y.; Choi, K.H.; Ha, S.K.; Lee, H.Y.; Han, D.S. Risk factors influencing the decline of residual renal function in continuous ambulatory peritoneal dialysis patients. Perit. Dial. Int. 1999, 19, 138–142. [Google Scholar] [CrossRef]
  46. Tanyaş, H.; Kolat, Ç.; Süzen, M.L. A new approach to estimate cover-management factor of RUSLE and validation of RUSLE model in the watershed of Kartalkaya Dam. J. Hydrol. 2015, 528, 584–598. [Google Scholar] [CrossRef]
  47. Jin, X.M.; Zhang, Y.K.; Schaepman, M.E.; Clevers, J.G.; Su, Z.; Cheng, J.; Jiang, J.; van Genderen, J. Impact of elevation and aspect on the spatial distribution of vegetation in the Qilian mountain area with remote sensing data. In Proceedings of the 21st ISPRS Congress, Beijing, China, 3–11 July 2008. [Google Scholar]
  48. Pei, Z.; Fang, S.; Yang, W.; Wang, L.; Wu, M.; Zhang, Q.; Han, W.; Khoi, D.N. The relationship between NDVI and climate factors at different monthly time scales: A case study of grasslands in inner Mongolia, China (1982–2015). Sustainability 2019, 11, 7243. [Google Scholar] [CrossRef] [Green Version]
  49. Koirala, P.; Thakuri, S.; Joshi, S.; Chauhan, R. Estimation of soil erosion in Nepal using a RUSLE modeling and geospatial tool. Geosciences 2019, 9, 147. [Google Scholar] [CrossRef] [Green Version]
  50. Ajibade, F.O.; Nwogwu, N.A.; Adelodun, B.; Abdulkadir, T.S.; Ajibade, T.F.; Lasisi, K.H.; Fadugba, O.G.; Owolabi, T.A.; Olajire, O.O. Application of RUSLE integrated with GIS and remote sensing techniques to assess soil erosion in Anambra State, South-Eastern Nigeria. Journal of Water and Climate Change. 2020 Dec 1;11(S1):407-22. Application of RUSLE integrated with GIS and remote sensing techniques to assess soil erosion in Anambra State, South.-Eastern Nigeria. J. Water Clim. Chang. 2020, 11, 407–422. [Google Scholar]
  51. Thapa, P. Spatial estimation of soil erosion using RUSLE modeling: A case study of Dolakha district, Nepal. Environ. Syst. Res. 2020, 9, 1–10. [Google Scholar] [CrossRef]
  52. Kogo, B.K.; Kumar, L.; Koech, R. Impact of Land Use/Cover Changes on Soil Erosion in Western Kenya. Sustainability 2020, 12, 9740. [Google Scholar] [CrossRef]
  53. Zhidkin, A.; Fomicheva, D.; Ivanova, N.; Dostál, T.; Yurova, A.; Komissarov, M.; Krása, J. A detailed reconstruction of changes in the factors and parameters of soil erosion over the past 250 years in the forest zone of European Russia (Moscow region). Int. Soil Water Conserv. Res. 2021, in press. [Google Scholar] [CrossRef]
  54. Gessesse, B.; Bewket, W.; Bräuning, A. Model.-based characterization and monitoring of runoff and soil erosion in response to land use/land cover changes in the Modjo watershed, Ethiopia. Land Degrad. Dev. 2015, 26, 711–724. [Google Scholar] [CrossRef]
  55. Kidane, M.; Bezie, A.; Kesete, N.; Tolessa, T. The impact of land use and land cover (LULC) dynamics on soil erosion and sediment yield in Ethiopia. Heliyon 2019, 5, e02981. [Google Scholar] [CrossRef] [Green Version]
  56. Mind’je, R.; Li, L.; Amanambu, A.C.; Nahayo, L.; Nsengiyumva, J.B.; Gasirabo, A.; Mindje, M. Flood susceptibility modeling and hazard perception in Rwanda. Int. J. Disaster Risk Reduct. 2019, 38, 101211. [Google Scholar] [CrossRef]
  57. Karimi, V.; Karami, E.; Keshavarz, M. Climate change and agriculture: Impacts and adaptive responses in Iran. J. Integr. Agric. 2018, 17, 1–15. [Google Scholar] [CrossRef] [Green Version]
  58. Rowhani, P.; Lobell, D.B.; Linderman, M.; Ramankutty, N. Climate variability and crop production in Tanzania. Agric. For. Meteorol. 2011, 151, 449–460. [Google Scholar] [CrossRef]
  59. Kagabo, D.M.; Stroosnijder, L.; Visser, S.M.; Moore, D. Soil erosion, soil fertility and crop yield on slow-forming terraces in the highlands of Buberuka, Rwanda. Soil Tillage Res. 2013, 128, 23–29. [Google Scholar] [CrossRef]
  60. Karamage, F.; Shao, H.; Chen, X.; Ndayisaba, F.; Nahayo, L.; Kayiranga, A.; Omifolaji, J.K.; Liu, T.; Zhang, C. Deforestation effects on soil erosion in the Lake Kivu Basin, DR Congo-Rwanda. Forests 2016, 7, 281. [Google Scholar] [CrossRef] [Green Version]
  61. Karamage, F.; Zhang, C.; Kayiranga, A.; Shao, H.; Fang, X.; Ndayisaba, F.; Nahayo, L.; Mupenzi, C.; Tian, G. USLE-based assessment of soil erosion by water in the Nyabarongo River Catchment, Rwanda. Int. J. Environ. Res. Public Health 2016, 13, 835. [Google Scholar] [CrossRef] [Green Version]
  62. Rajbanshi, J.; Bhattacharya, S. Assessment of soil erosion, sediment yield and basin specific controlling factors using RUSLE-SDR and PLSR approach in Konar river basin, India. J. Hydrol. 2020, 587, 124935. [Google Scholar] [CrossRef]
  63. Bagwan, W.A.; Gavali, R.S. Delineating changes in soil erosion risk zones using RUSLE model based on confusion matrix for the Urmodi river watershed, Maharashtra, India. Modeling Earth Syst. Environ. 2021, 7, 2113–2126. [Google Scholar] [CrossRef]
Figure 1. Location of the study area: (a) delimitation of the western province in Rwanda using satellite imagery; (b) digital elevation model with district boundaries of the study area.
Land 10 01056 g001
Figure 2. RUSLE factor maps for the western province of Rwanda: (a) rainfall erosivity (R) factor; (b) soil erodibility (K) factor; (c) slope length and its steepness (LS) factor; (d) support practice (P) factor.
Land 10 01056 g002
Figure 3. Annual mean C-factor comparisons between Cvk and CvkA values among different LULCs for five considered years: (a) 2000, (b) 2005, (c) 2010, (d) 2015 and (e) 2018.
Land 10 01056 g003
Figure 4. Comparison between the RUSLE cover management (C) factor maps: (a) using the formerly used approach (Cvk);and (b) using the adapted approach (CvkA) for the considered years.
Land 10 01056 g004
Figure 5. Correlation between NDVI and C-factor (CvkA) for each year: (a) 2000, (b) 2005, (c) 2010, (d) 2015 and (e) 2018.
Land 10 01056 g005
Figure 6. Impact of soil heterogeneity (classified as 1, K = 0.016 to 0.018; 2, K = 0.018 to 0.019; 3, K = 0. 019 to 0.02 and 4, K ≥ 0.02) on NDVI values for the period of study: (a) 2000, (b) 2005, (c) 2010 (d) 2015 and (e) 2018.
Land 10 01056 g006
Figure 7. Correlation coefficients between NDVI and rainfall for the considered years: (a) 2000, (b) 2005, (c) 2010 (d) 2015 and (e) 2018.
Land 10 01056 g007
Figure 8. The relationships between NDVI and elevation for different considered years: (a) 2000, (b) 2005, (c) 2010, (d) 2010 and (e) 2018.
Land 10 01056 g008
Figure 9. Spatial distribution of estimated soil erosion rates in the study area: (a) 2000, (b) 2005, (c) 2010, (d) 2015 and (e) 2018.
Land 10 01056 g009
Figure 10. Change detection in LULC: (a) 2000, (b) 2005, (c) 2010, (d) 2015 and (e) 2018.
Land 10 01056 g010
Figure 11. Zones with probability of soil erosion.
Land 10 01056 g011
Table 1. Summary of datasets and their sources.
DatasetsSourcesPath and Row
Landsat 7 ETM+/Landsat 8 OLI-TIRSUSGS earth Explorer/ Earthexplorer.usgs.gov accessed on 4 October 2021172-61
DEMEarthexplorer.usgs.gov accessed on 4 October 2021
Meteorological data (Rainfall)Rwanda Meteorological agency
Soil mapFood and Agriculture Organization (FAO)
Table 2. Variables and their description used for regression analysis to investigate their influence on NDVI-derived C-factor (CvkA) values.
VariablesDescription Data Type
Dependent variable
Improved C-factor (CvkA)Adapted cover management factor from equation proposed by Van der Knijff, Jones and Montanarella (2000) derived from satellite images (Equation (3))Continuous
Biophysical variables
Rainfall Rainfall erosivity (R value) (Equation (2))Continuous
ElevationDigital elevation model (30 m spatial resolution, from the USGS) Continuous
Soil Soil erodibility (K value) (Equation (3))Continuous
Table 3. Support practice factor values as per soil conservation practice by Shin and Noh [45].
Slope %Strip-CroppingContouringTerracing
0–7.00.270.550.10
7.0–11.30.300.600.12
11.3–17.60.400.800.16
17.6–26.80.450.900.18
>26.80.501.02.0
Table 4. The rates of estimated soil loss per class (of entire erosive lands of 4,670.8 km2) corresponding to Figure 9.
Severity Categories Soil Loss ClassesArea %Mean Soil Loss Per Class (t ha−1 yr−1)
2000200520102015201820002005201020152018
Very low0–540.711.6645.388.0059.201.612.561.952.651.53
Low5–1016.810.1219.587.5114.607.347.427.247.477.14
Moderate10–2019.416.4916.4712.3910.9014.3514.8214.0714.8914.07
High20–5016.129.9212.1428.918.6031.0432.6331.2333.8431.48
very High50–1005.918.293.8919.593.5067.8970.9667.6371.5568.49
Extremely High>1001.113.522.5423.603.20127.53156.42209.54171.99209.98
Table 5. Statistical changes for LULC (2000–2018).
LULC Types20002005201020152018
Forest land46.521.8442.1423.9925.12
Built up land0.430.60.572.391.8
Wetland0.230.240.240.240.25
Cropland32.2857.2933.7946.1846.7
Grassland3.283.65.769.759.23
Water bodies17.2816.4317.517.4516.9
Table 6. Mean soil erosion (t/ha/yr) per each LULC class.
LULCMean Soil Loss in 2000Mean Soil Loss in 2005Mean Soil Loss in 2010Mean Soil Loss in 2015Mean Soil Loss in 2018
Forestland 14.769.821.4111.722.6
Grassland15.634.312.364.724.1
Cropland15.739.710.445.419.5
Built up 4.745.47.827.54.1
Publisher’s Note: MDPI stays neutral with regard to jurisdictional claims in published maps and institutional affiliations.

