
Forest Restoration at Berenty Reserve, Southern Madagascar: A Pilot Study of Tree Growth Following the Framework Species Method

 ,
,
Abstract
:1. Introduction
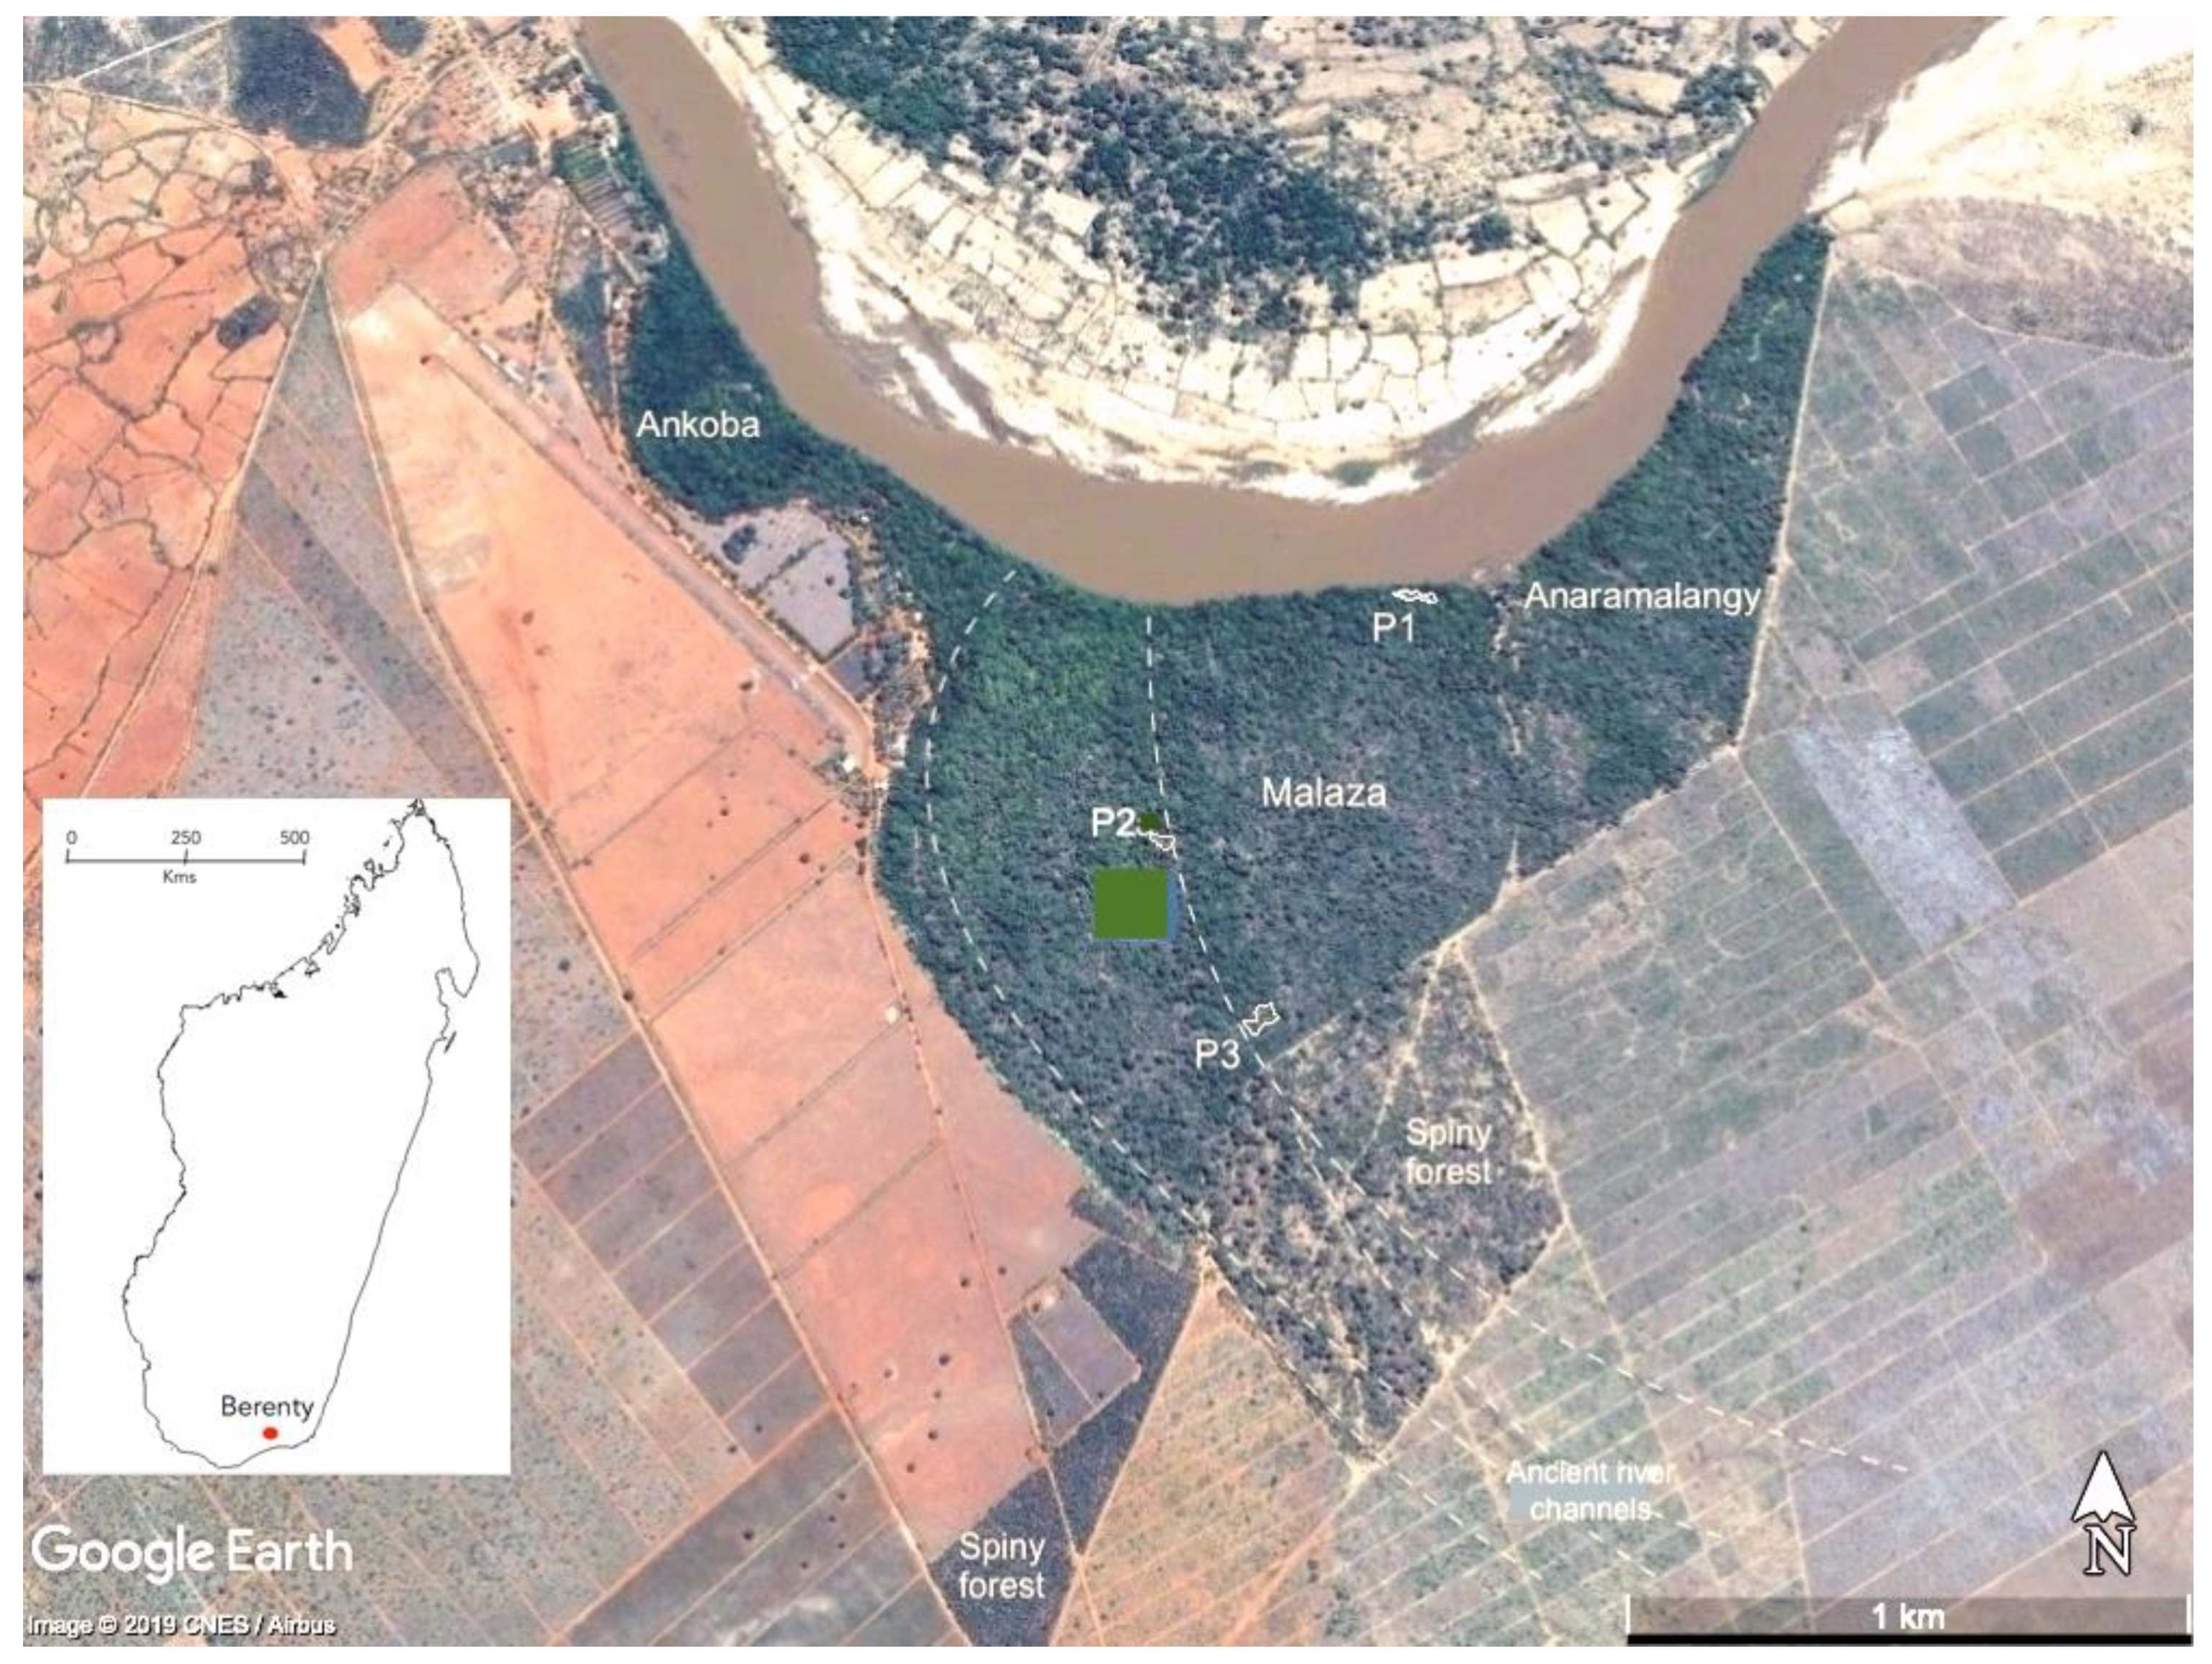
2. Study Area
3. Materials and Methods
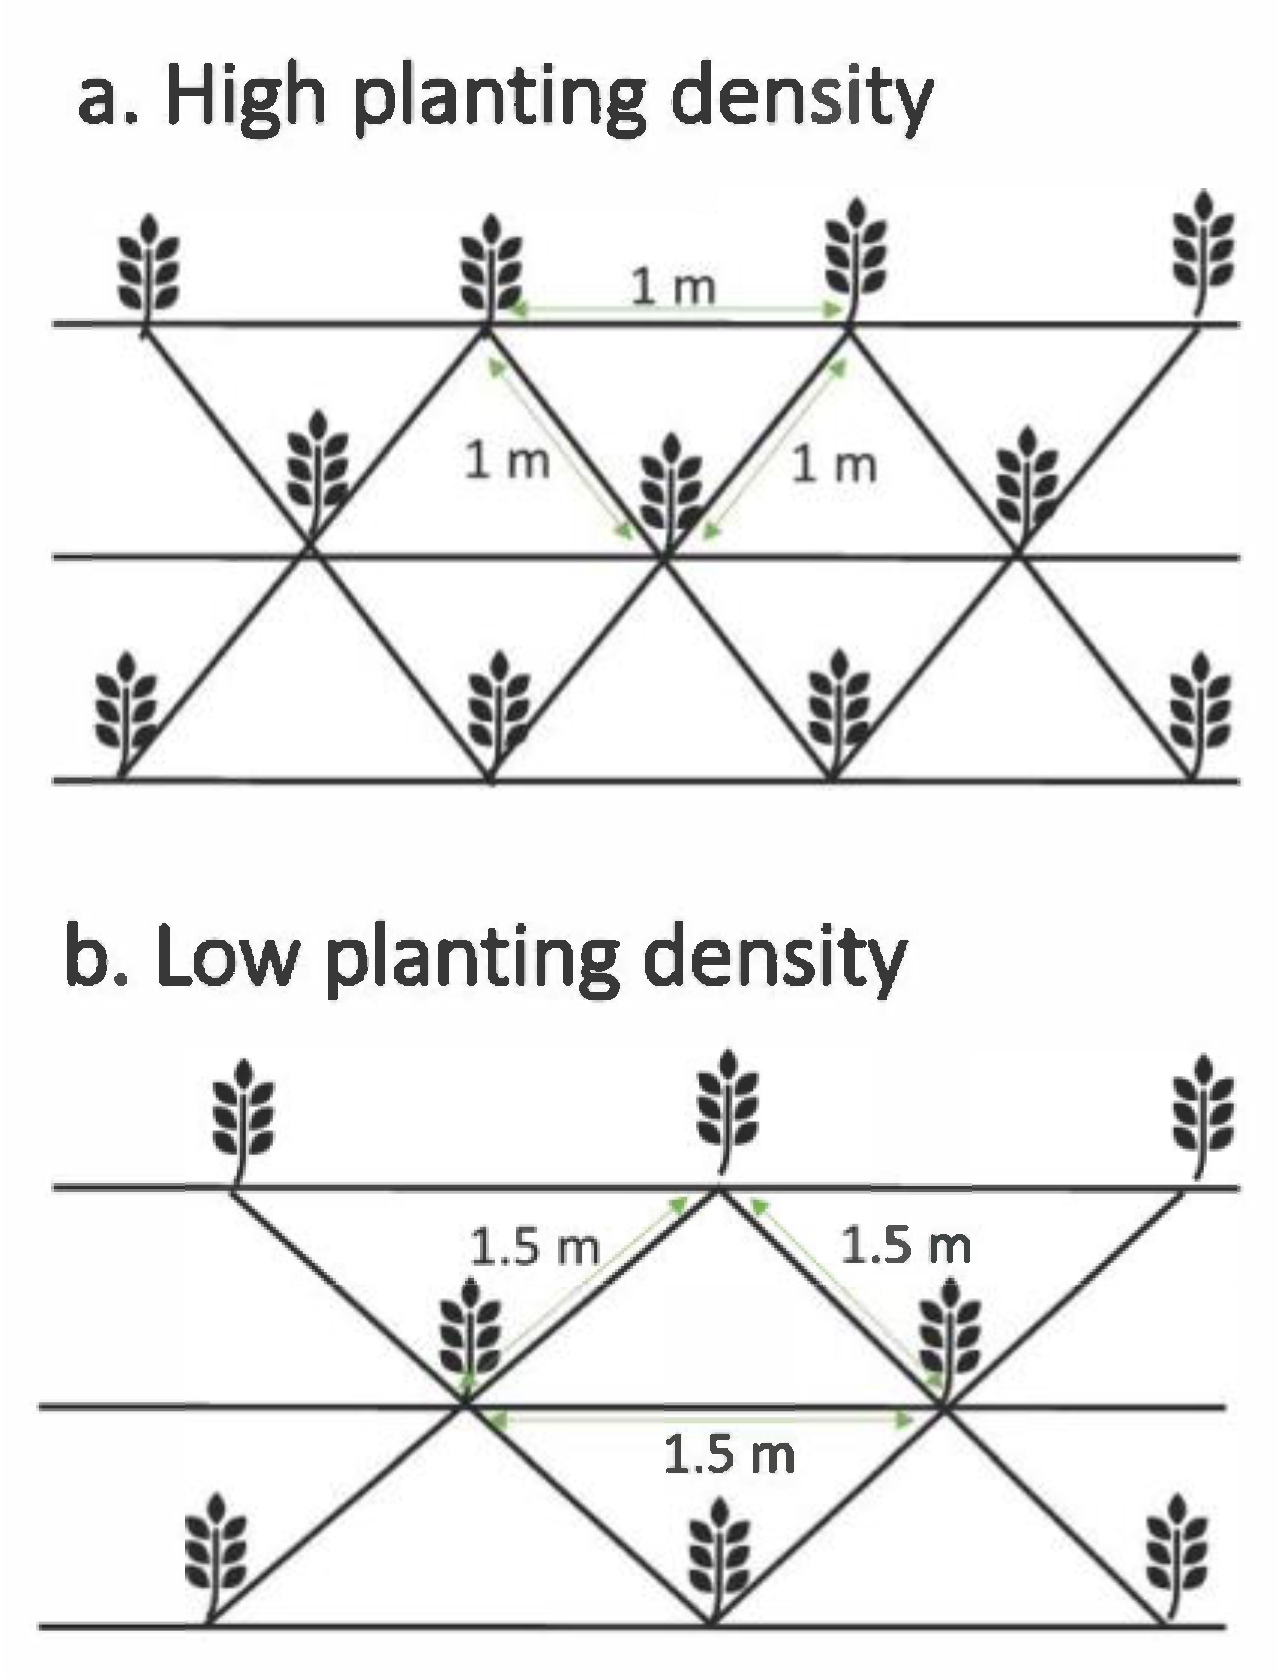
3.1. Restoration Trial Plots
3.2. Species Selection, Planting and Measurement
3.3. Soil Sampling and Plant Identification
3.4. Data Analysis
4. Results
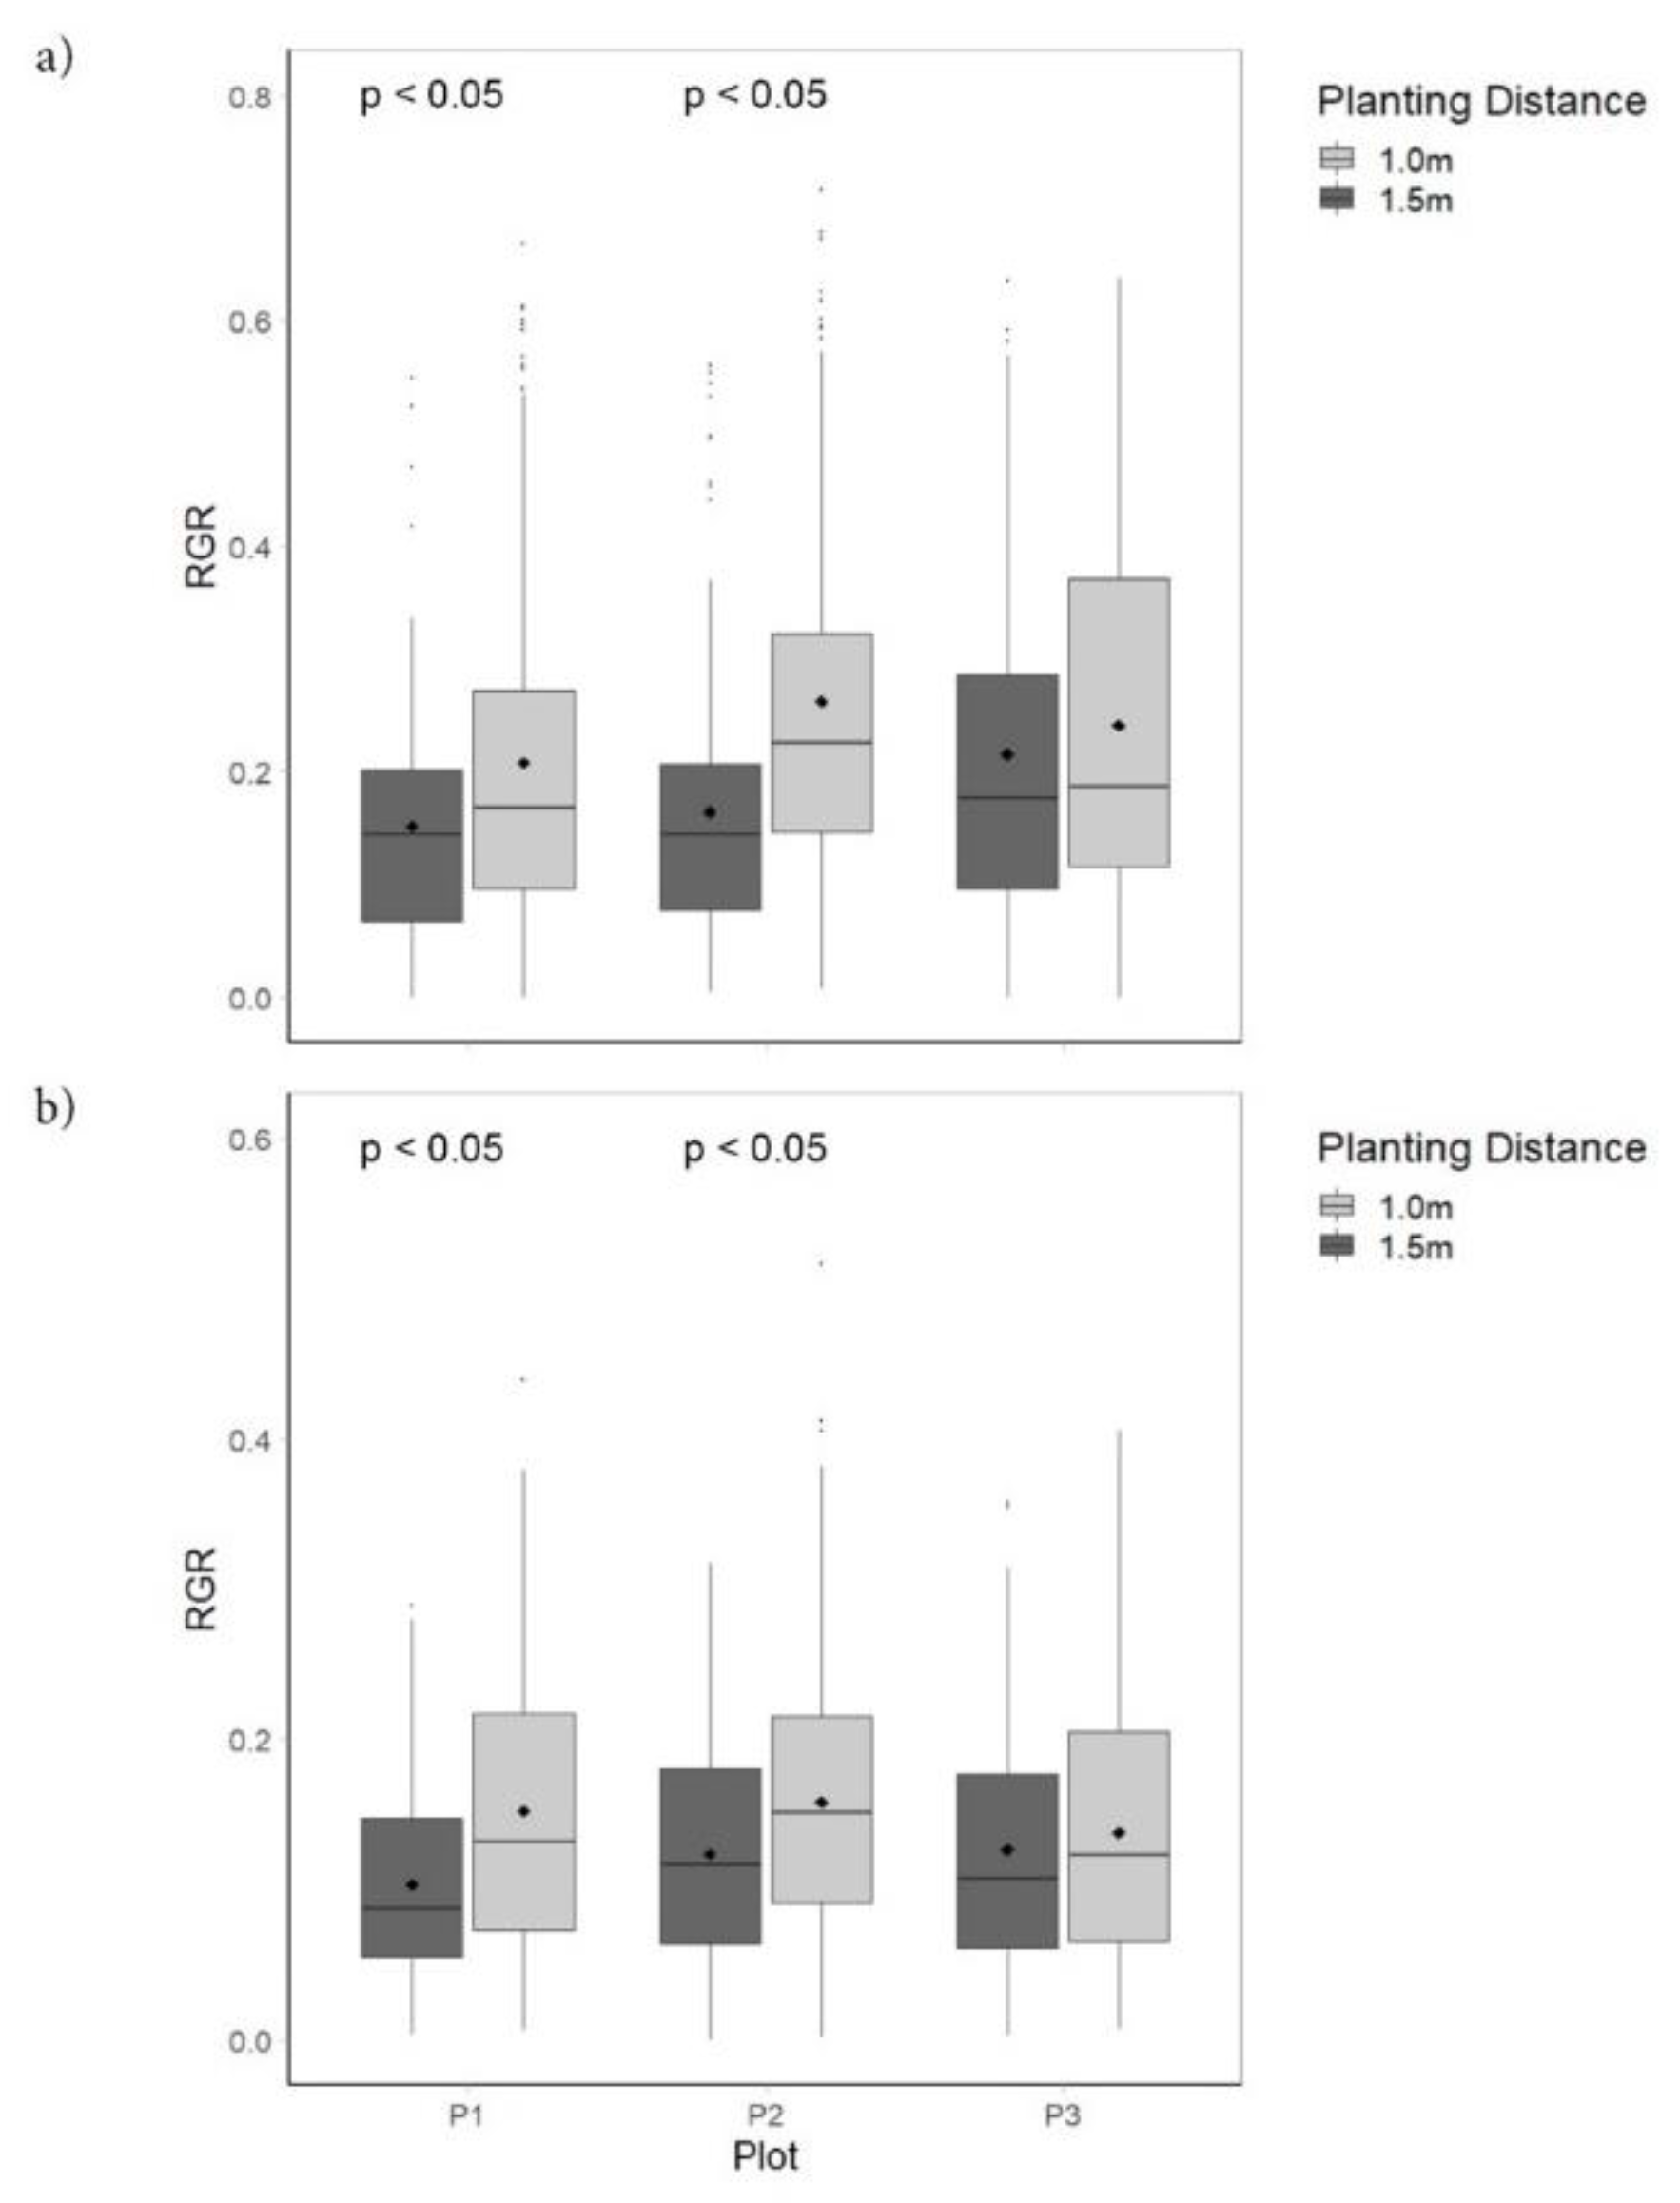
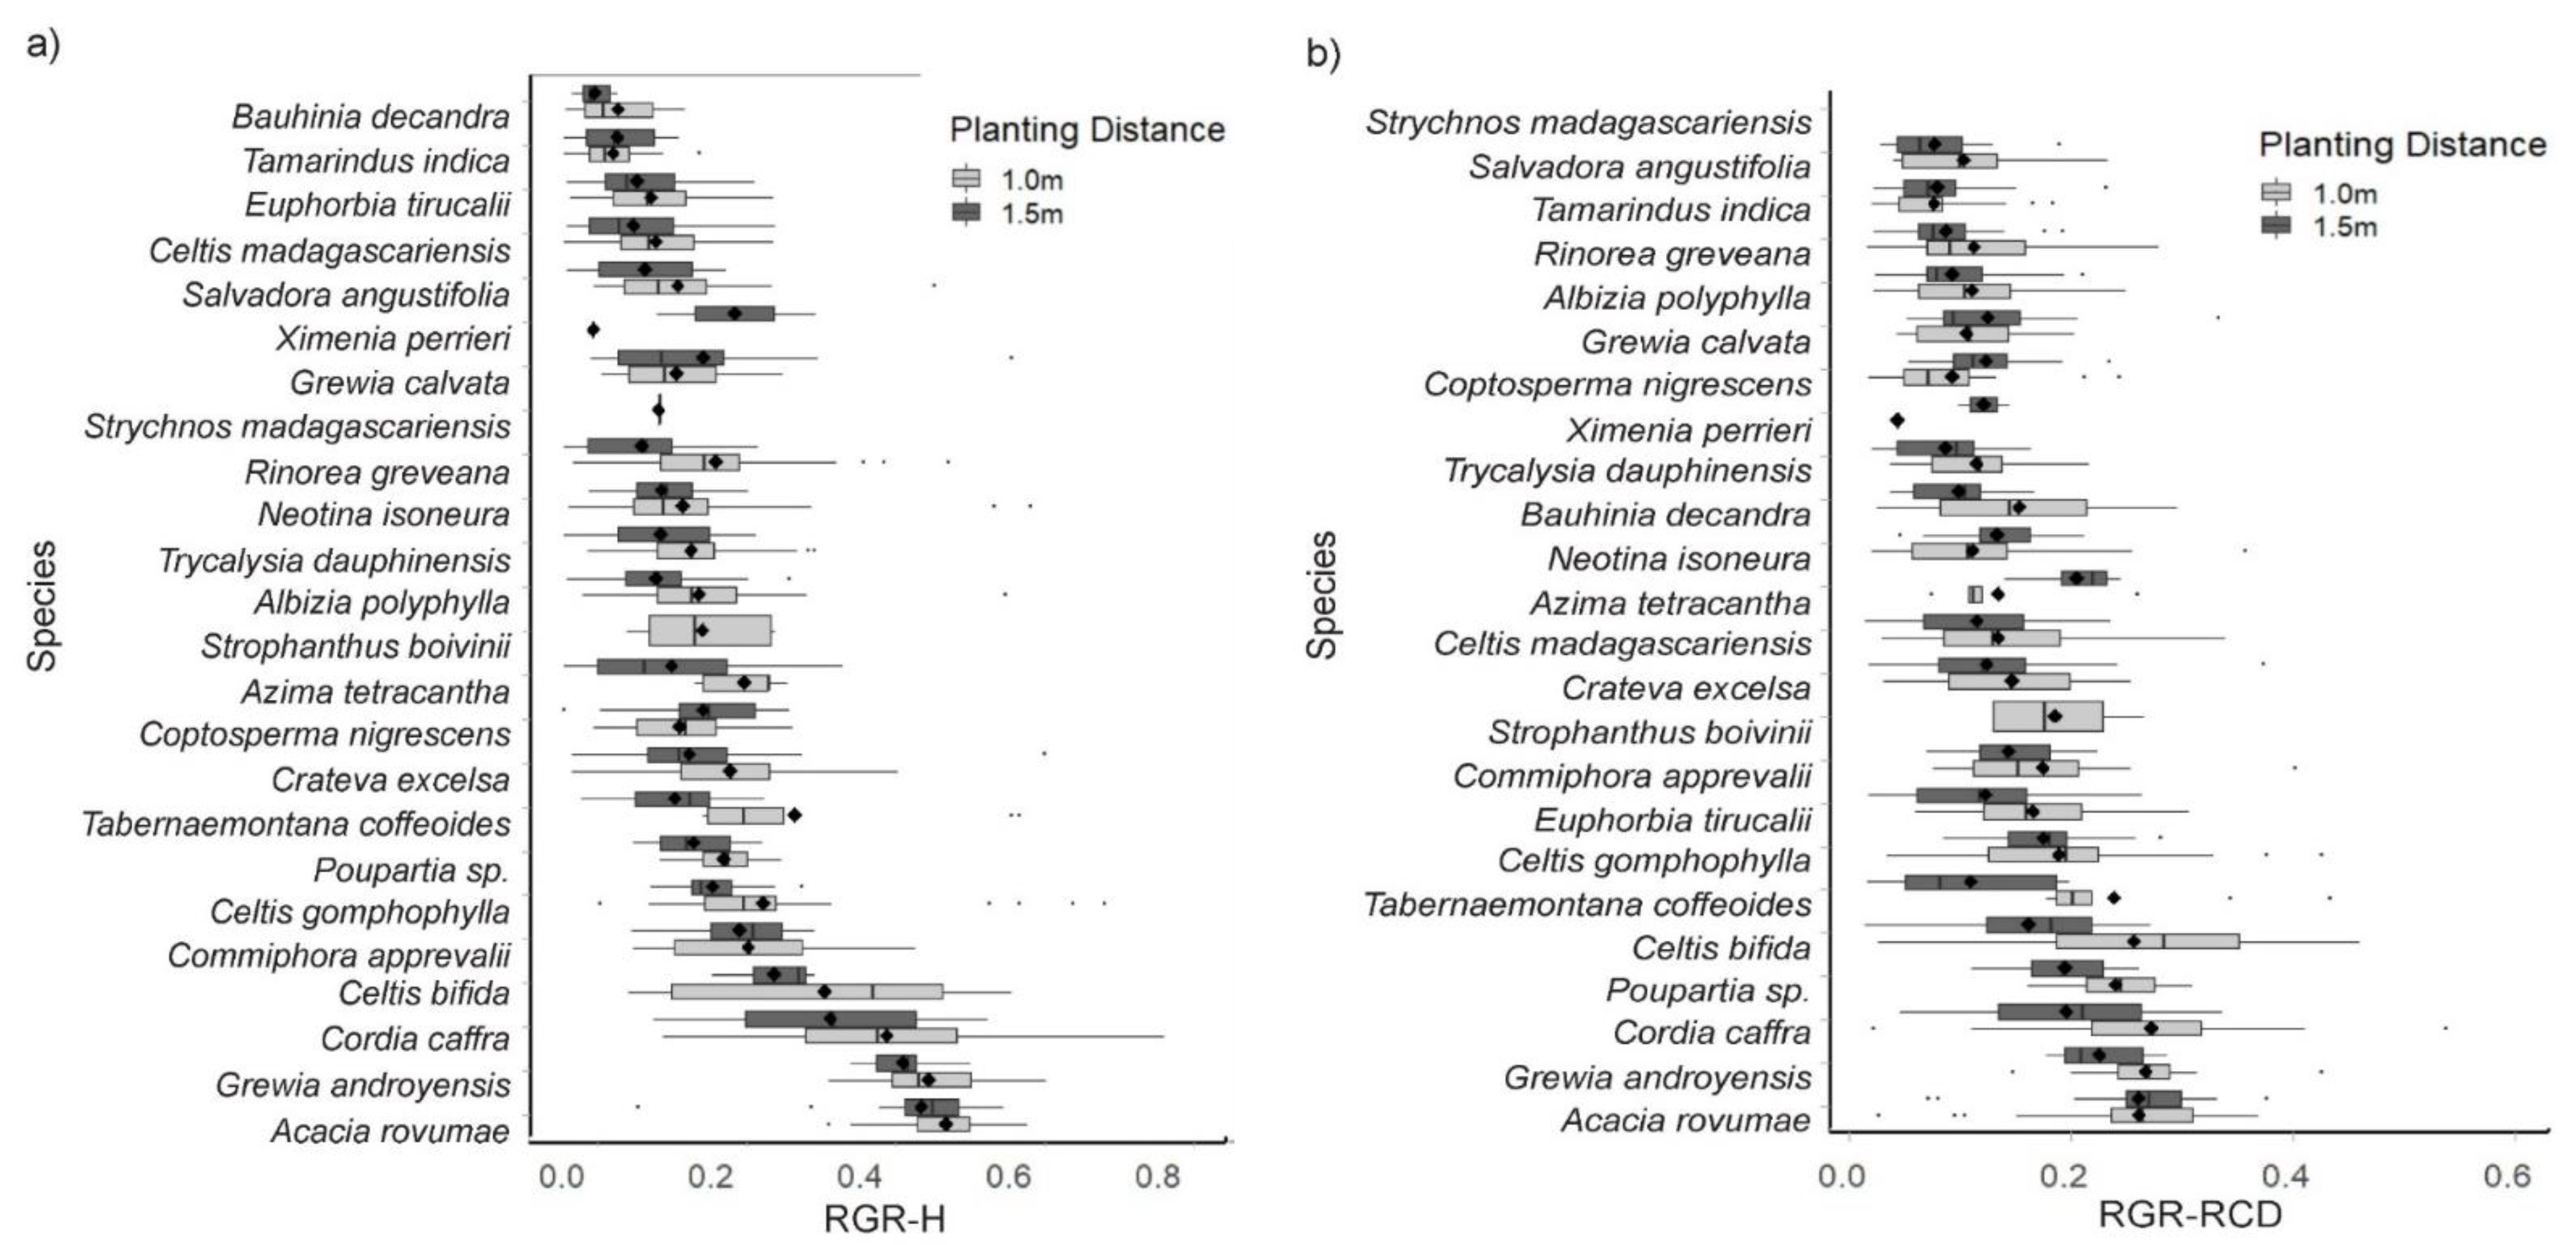
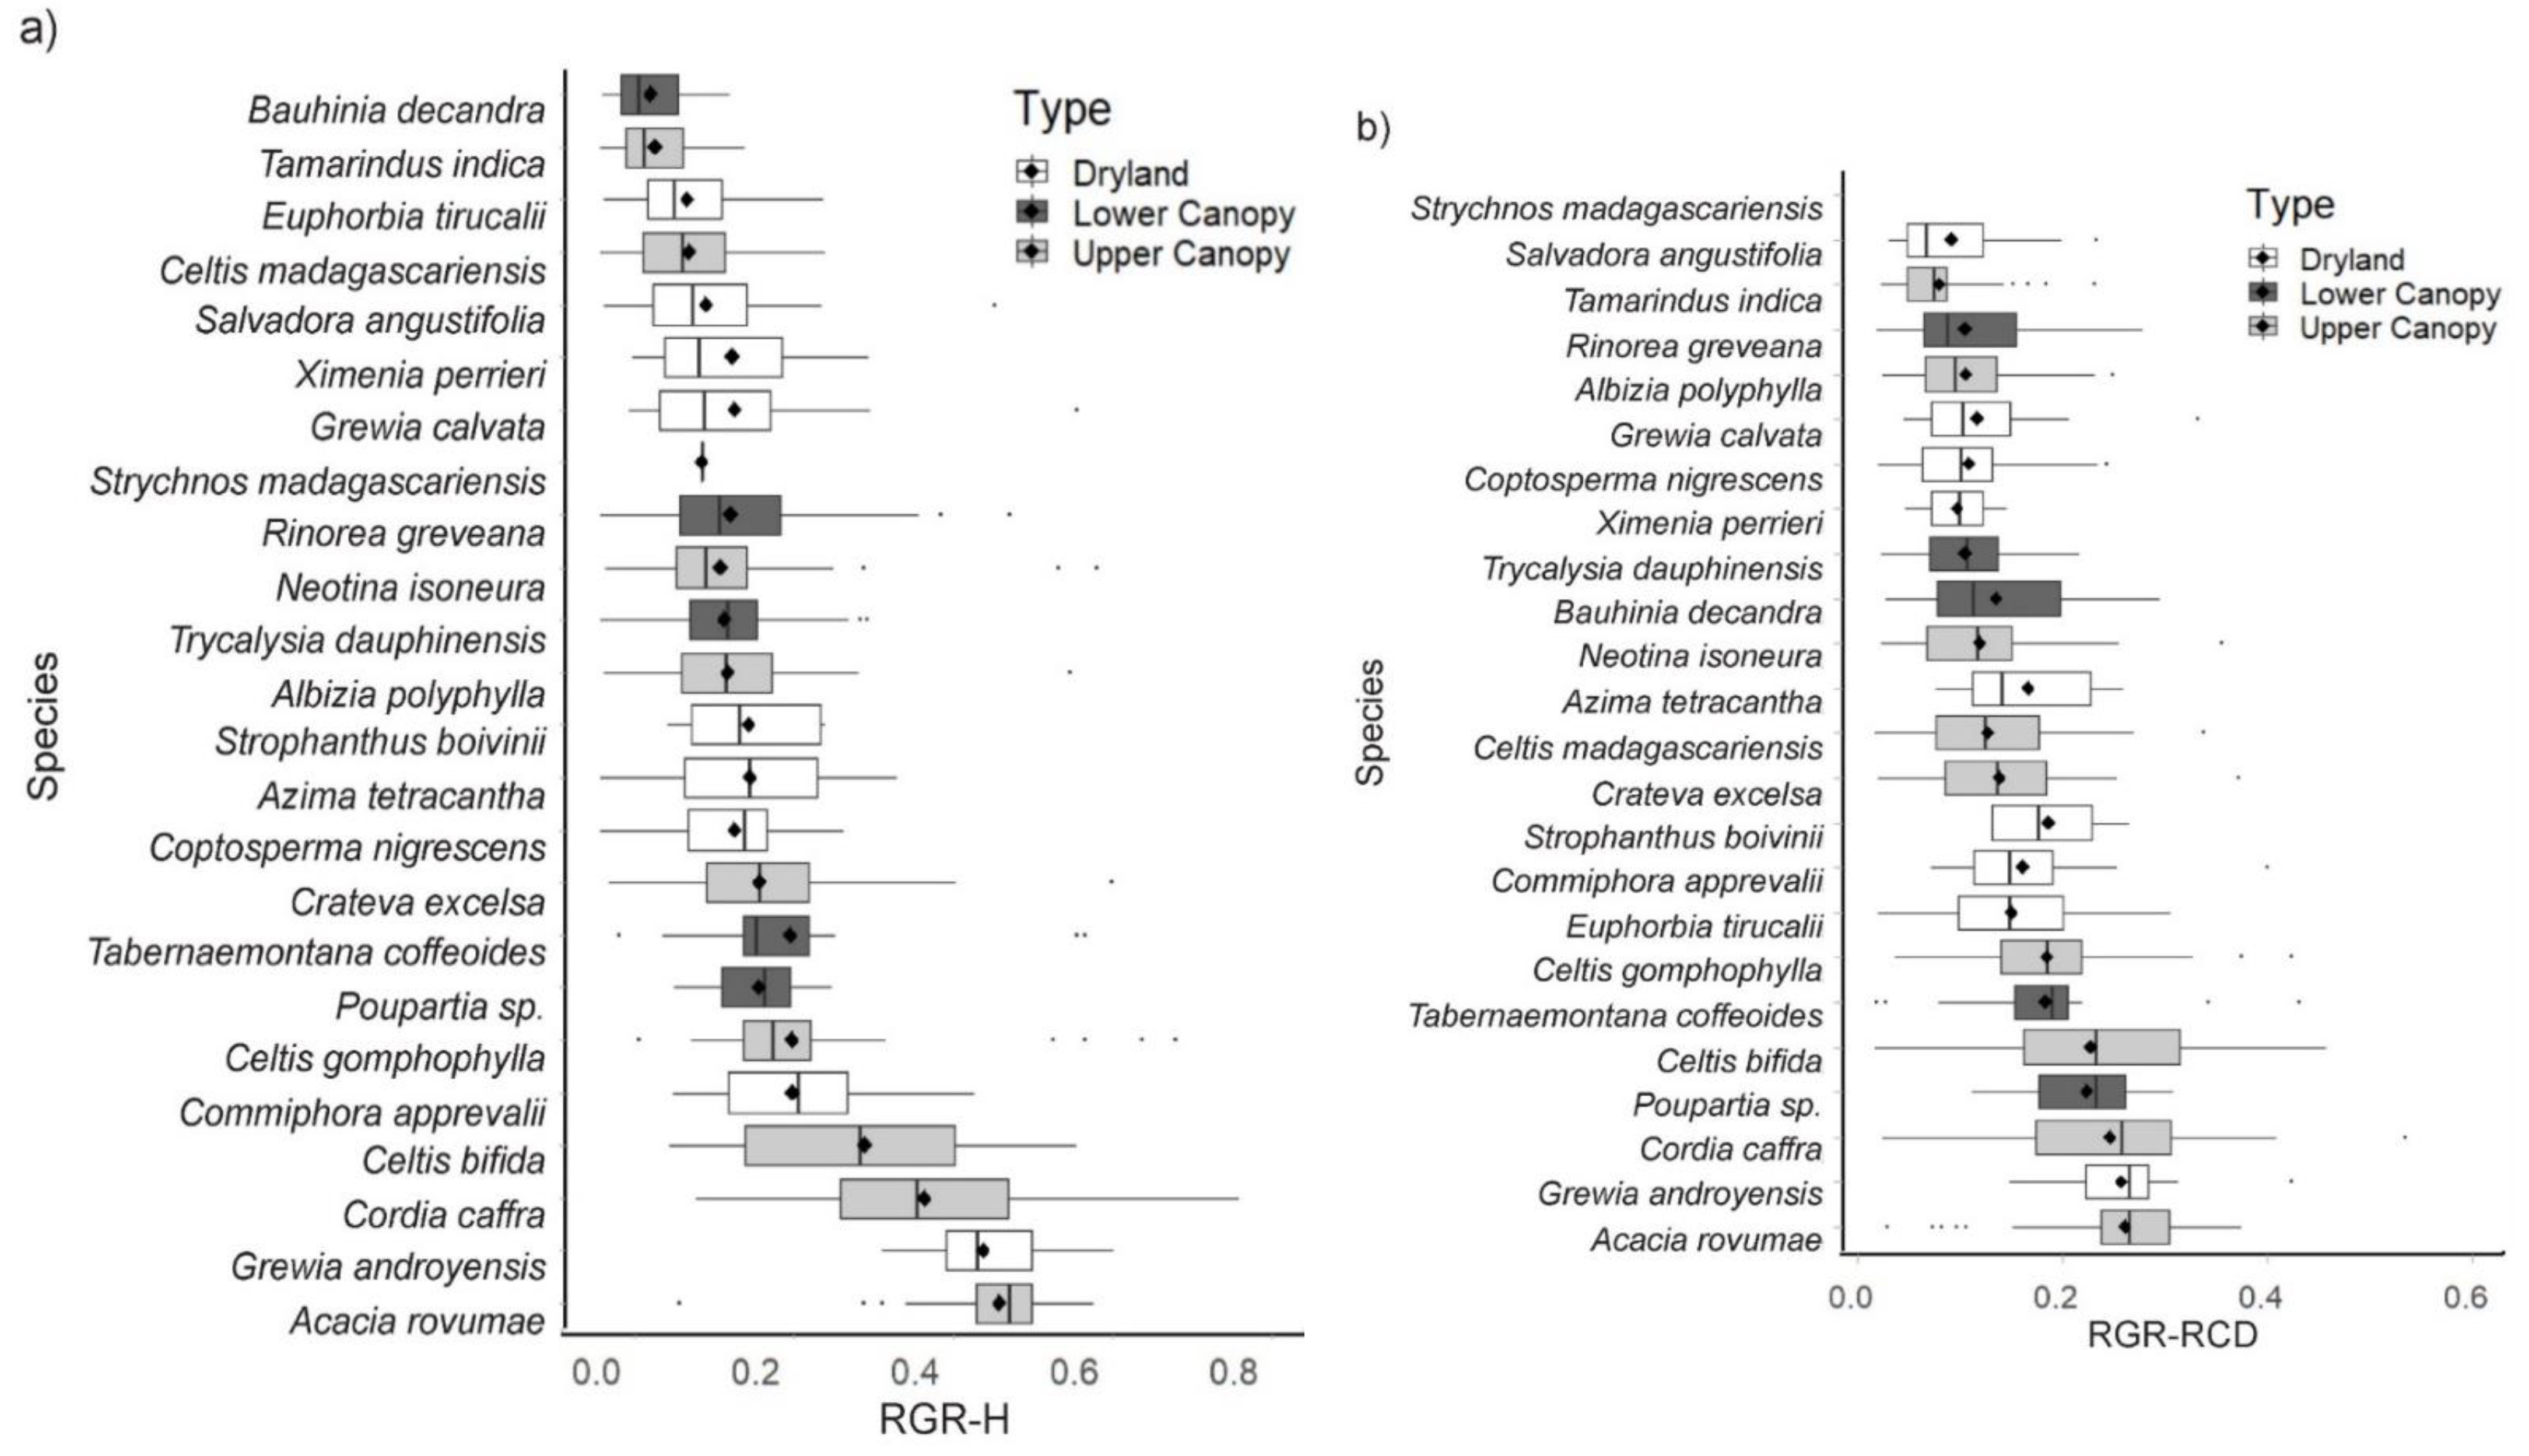
4.1. Relative Growth Rates
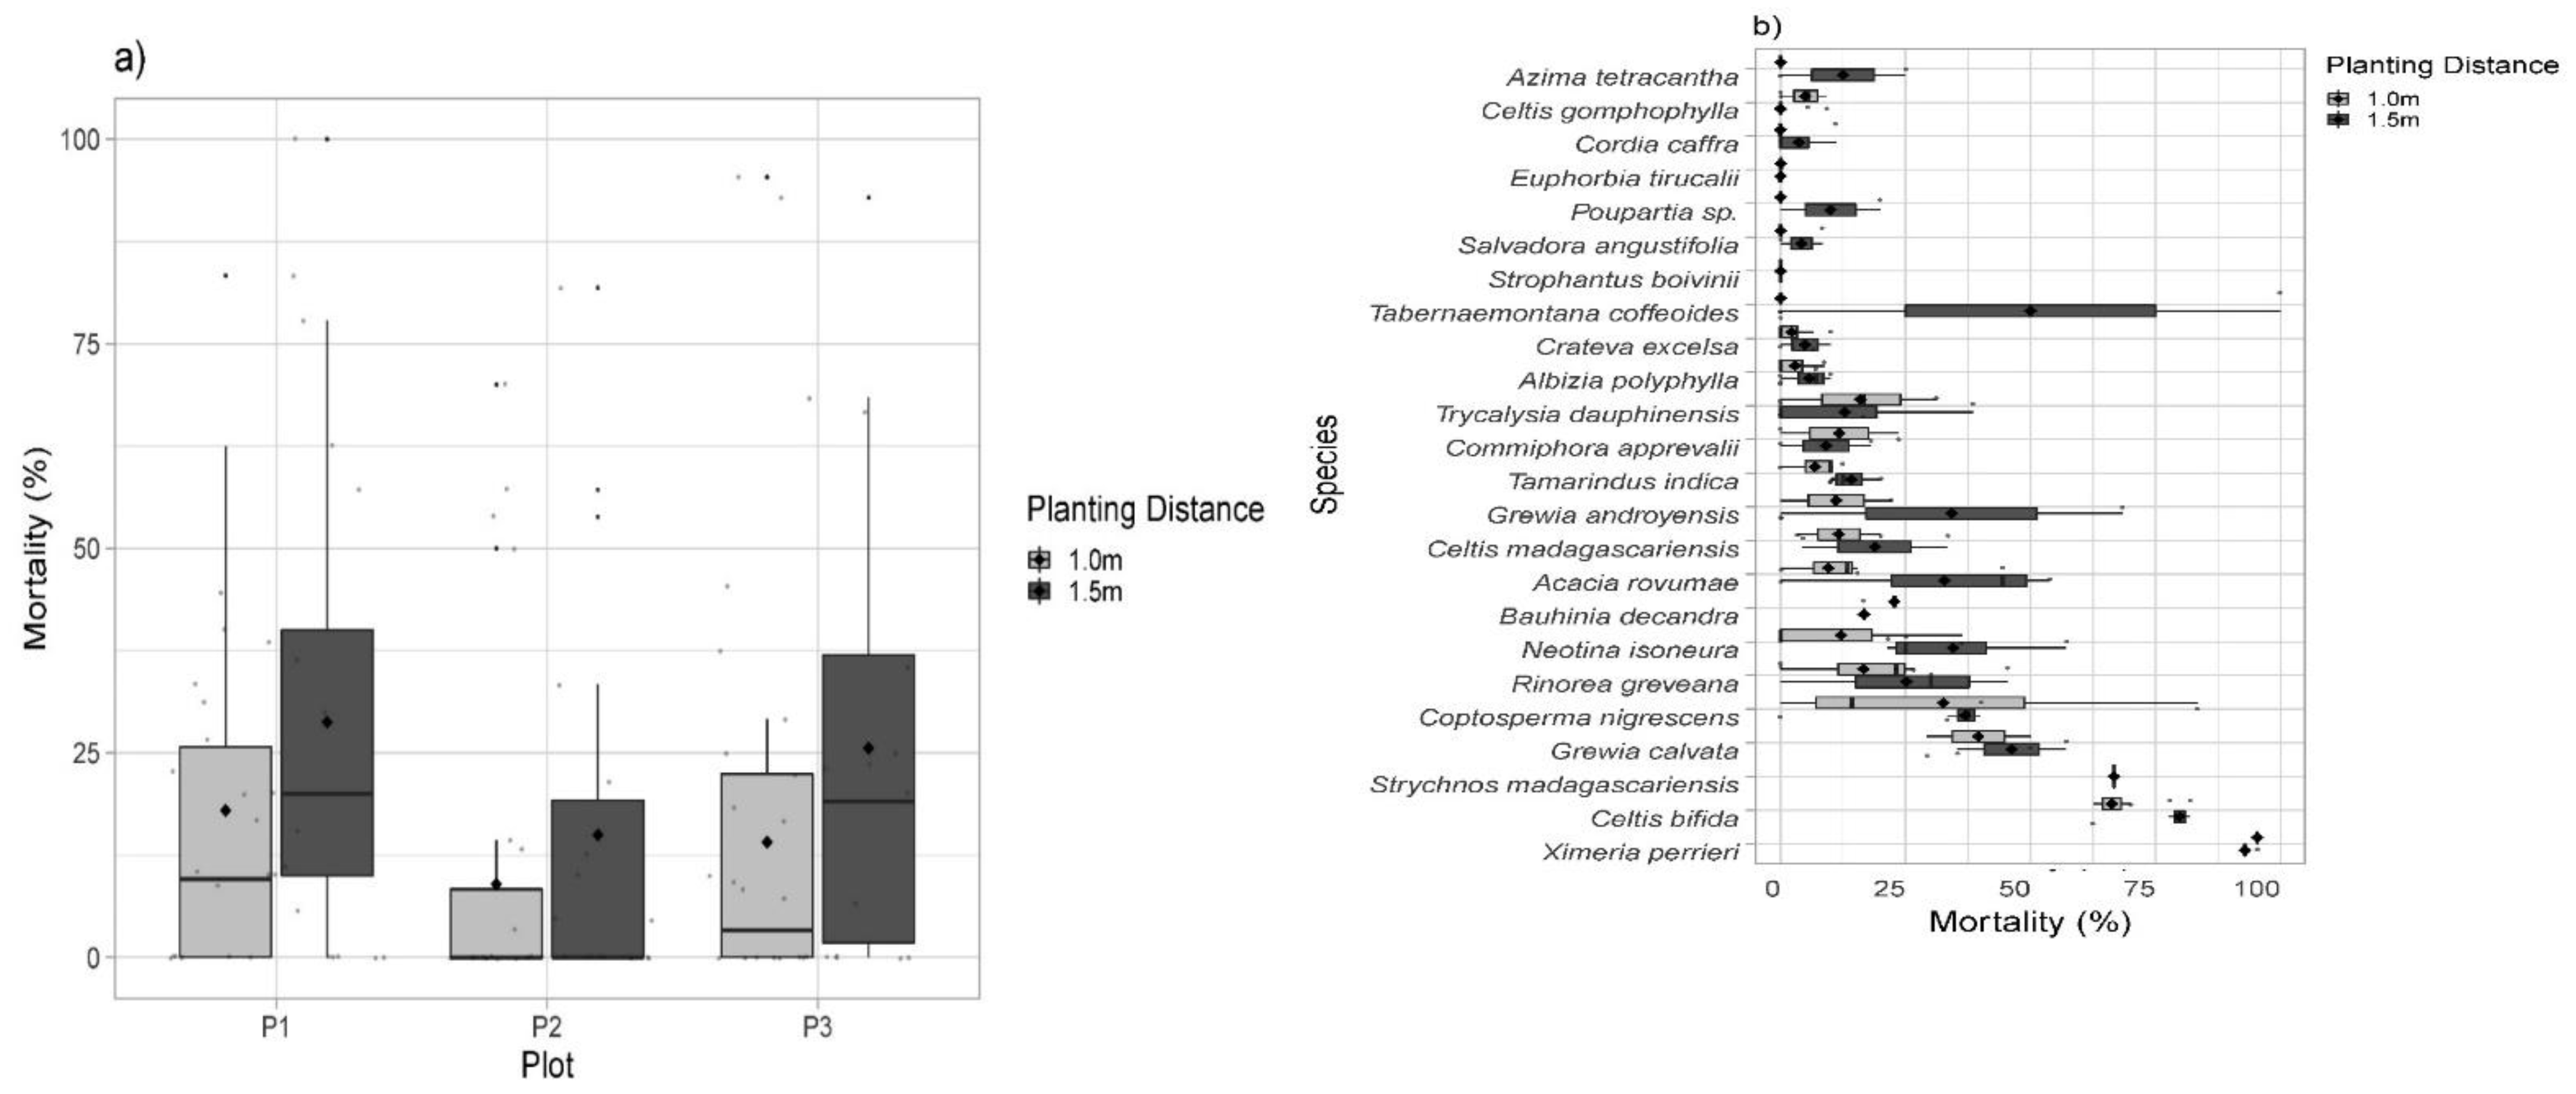
4.2. Mortality Rates
4.3. Recruitment from the Forest
4.4. Soils
5. Discussion
5.1. Berenty Compared with Beza Mahafaly
5.2. Planting Density, Recruitment, and Mortality
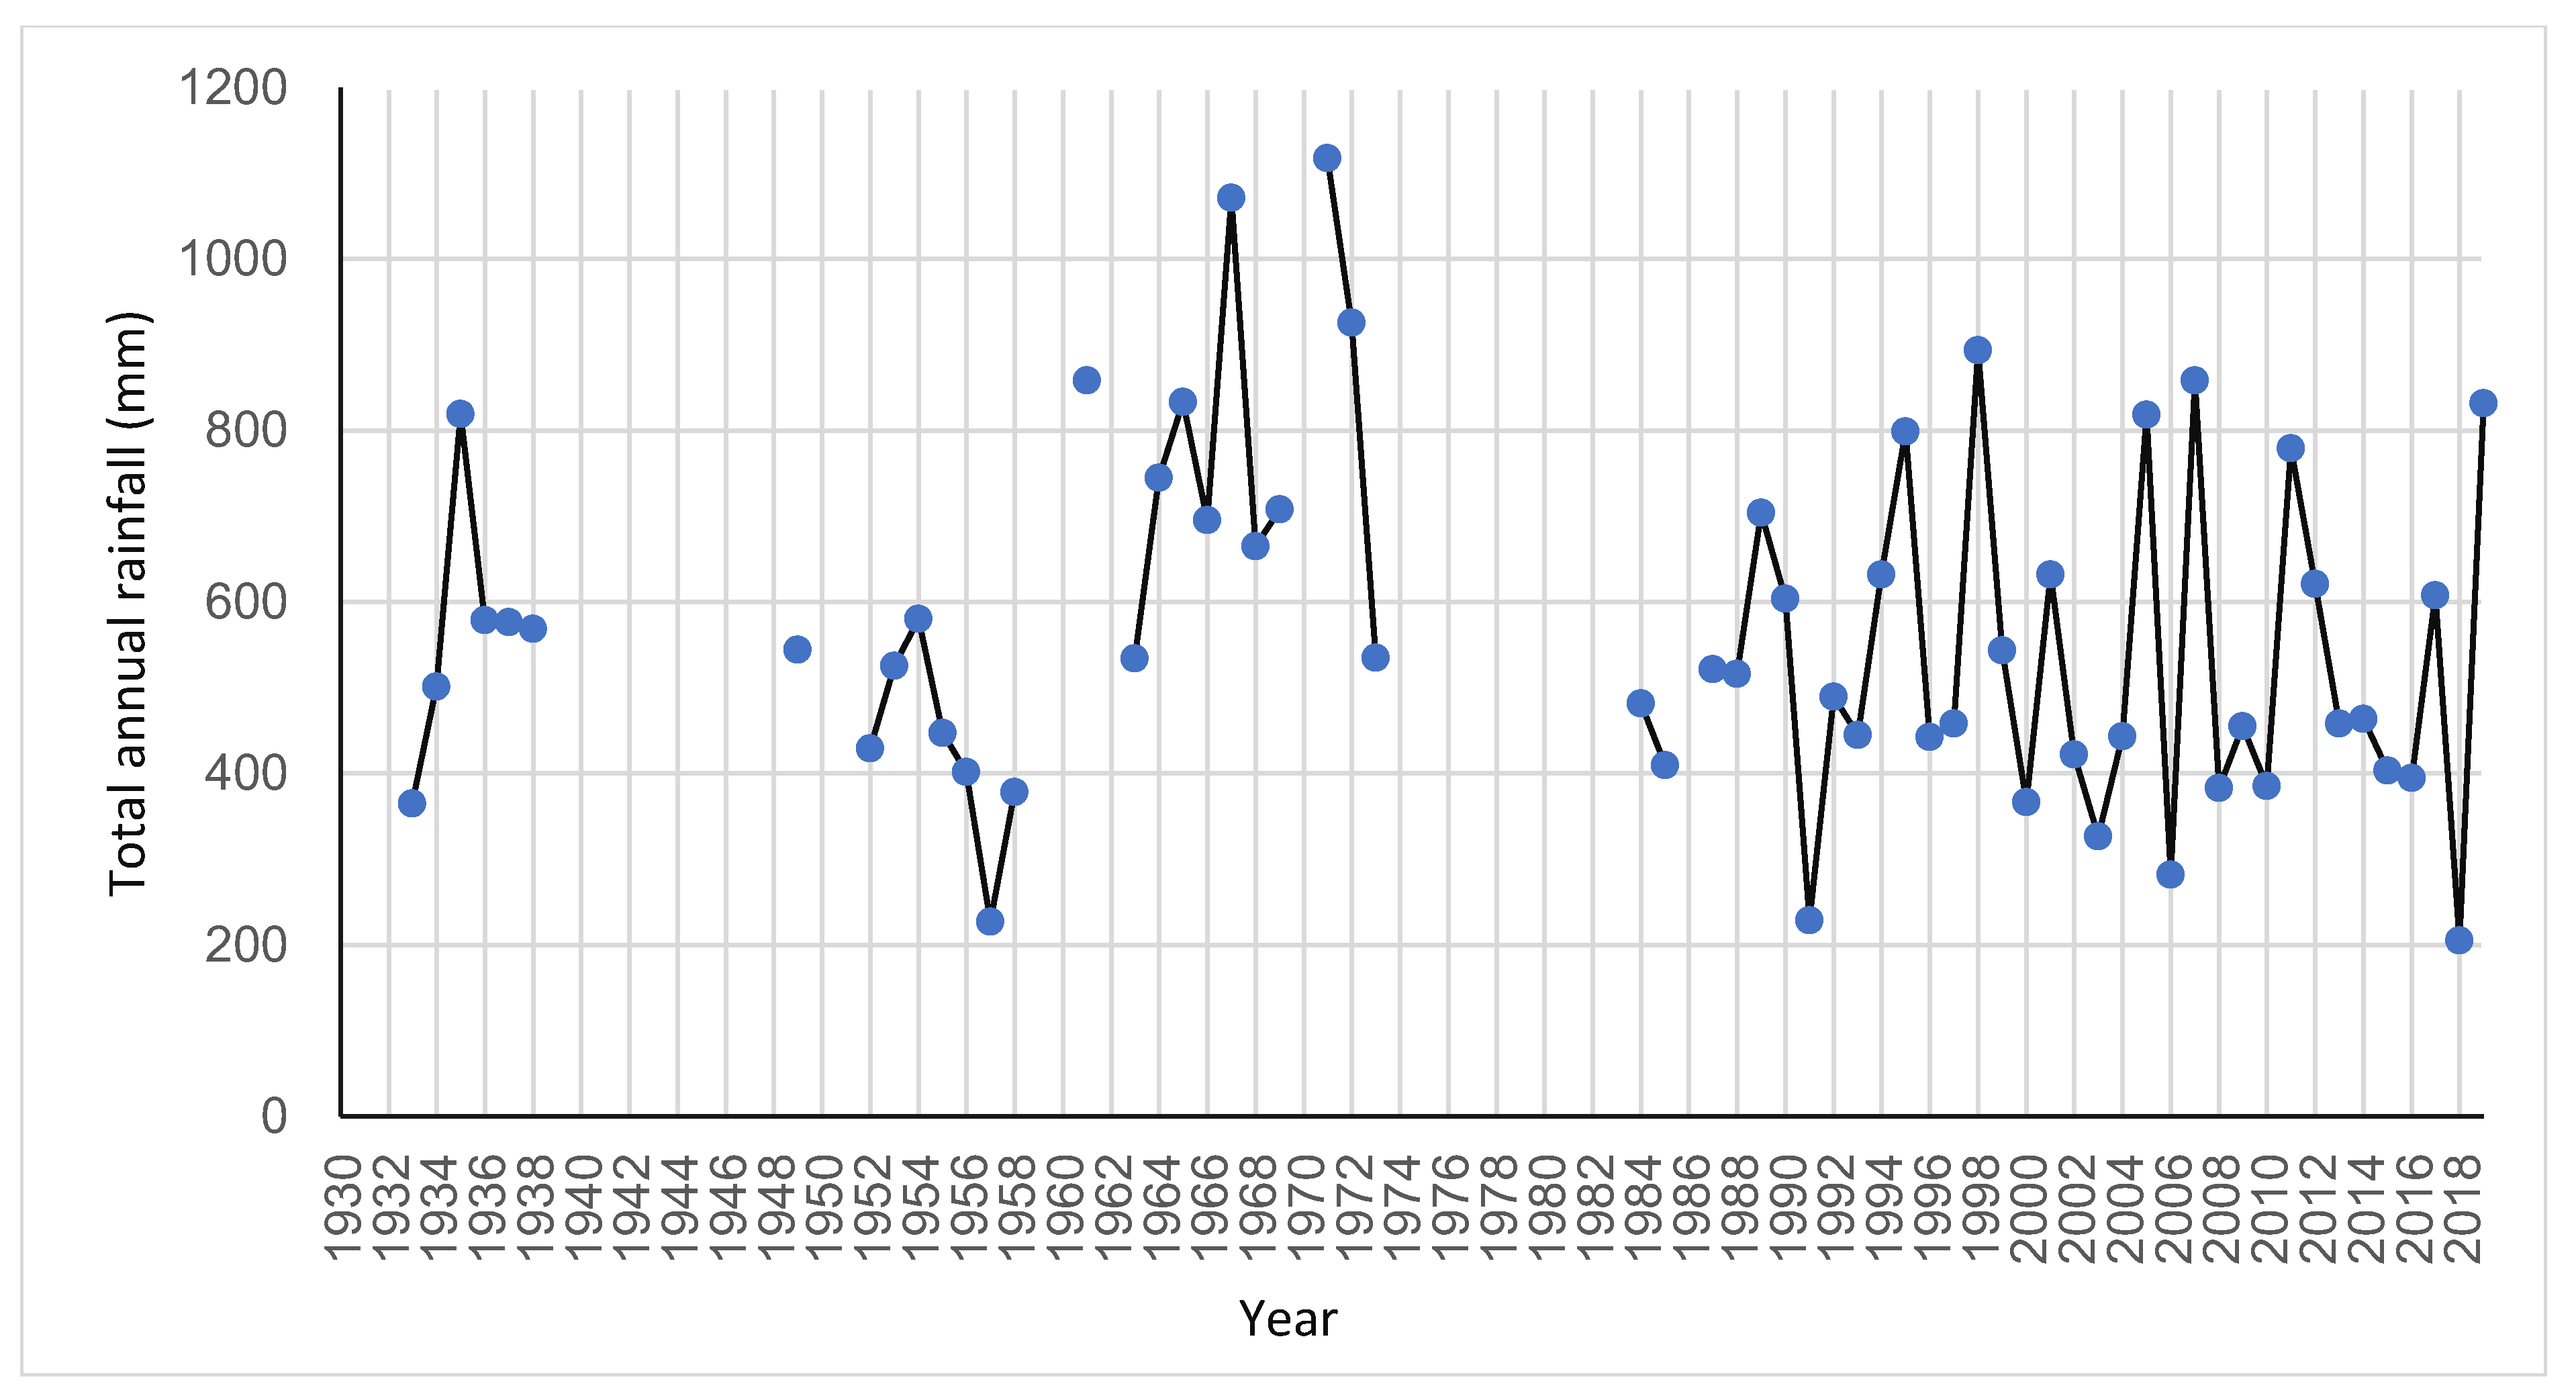
5.3. Climate Change
5.4. Study challenges
5.5. Ongoing Work
6. Conclusions
6.1. Location, Planting Density and Species Performance
6.2. Future Prospects
Supplementary Materials
Author Contributions
Funding
Acknowledgments
Conflicts of Interest
References
- Myers, N.; Mittermeier, R.A.; Mittermeier, C.G.; da Fonseca, G.A.B.; Kent, J. Biodiversity hotspots for conservation priorities. Nature 2000, 403, 853–858. [Google Scholar] [CrossRef]
- Jolly, A.; Oberlé, P.; Albignac, R. Key Environments: Madagscar; Pergamon Press: Oxford, UK, 1984; p. 250. [Google Scholar]
- Jolly, A. Lords and Lemurs: Mad Scientists, Kings with Spears and the Survival of Diversity in Madagascar; Houghton Mifflin Co.: Boston, MA, USA; New York, NY, USA, 2004; p. 310. [Google Scholar]
- Djoudi, H.; Vergles, E.; Blackie, R.R.; Koame, C.K.; Gautier, D. Dry forests, livelihoods and poverty alleviation: Understanding current trends. Int. For. Rev. 2015, 17, 54–69. [Google Scholar] [CrossRef]
- Gardner, C.J.; Nicoll, M.E.; Birkinshaw, C.; Harris, A.; Lewis, R.E.; Rakotomalala, D.; Ratsifandrihamanana, A.N. The rapid expansion of Madagascar’s protected area system. Biol. Conserv. 2018, 220, 29–36. [Google Scholar] [CrossRef]
- Tollefson, J. Madagascar’s forests face an uncertain future. Nature 2019, 565, 407. [Google Scholar] [CrossRef]
- Du Puy, D.J.; Moat, J. A refined classification of the primary vegetation of Madagascar based on the underlying geology: Using GIS to map its distribution and to assess its conservation status. In Biogeography of Madagascar; ORSTOM: Paris, France, 1996; pp. 205–218. ISBN 2-7099-1324-0. ISSN 0767-2896. [Google Scholar]
- Bullock, S.H.; Mooney, H.A.; Medina, E. (Eds.) Seasonally Dry Tropical Forests; Cambridge University Press: Cambridge, UK, 1995; 450p. [Google Scholar]
- Sanchez-Azofeifa, A.; Powers, J.S.; Fernandez, G.W.; Quesada, G.W. Tropical Dry Forests in the Americas: Ecology, Conservation and Management; Routledge, Taylor and Francis Group: London, UK, 2014; p. 538. [Google Scholar]
- Groupe des Spécialistes des Plantes de Madagascar (GSPM). Liste Rouge des Plantes Vasculaires Endémiques de Madagascar. 2011. Available online: https://www.cepf.net (accessed on 2 November 2018).
- Crowley, H. Madagascar spiny thickets. In Terrestrial Ecoregions of Africa and Madagascar: A Conservation Assessment, 2nd ed.; World Wildlife Fund Ecoregion Assessments; Burgess, N., D’Amico Hales, J., Underwood, E., Dinerstein, E., Olson, D., Itoua, I., Schipper, J., Rickketts, T., Newman, K., Eds.; Island Press: Washington, DC, USA, 2004; pp. 415–417. ISBN 978-1559633642. [Google Scholar]
- Aronson, J.C.; Phillipson, P.B.; Le Floc’h, E.; Raminosoa, T. Dryland tree data for the Southwest region of Madagascar: Alpha-level data can support policy decisions for conserving and restoring ecosystems of arid and semiarid regions. Madag. Conserv. Dev. 2018, 13, 1–9. [Google Scholar] [CrossRef]
- Sussman, R.W.; Rakotozafy, A. Plant diversity and structural analysis of a tropical dry forest in southwestern Madagascar. Biotropica 1994, 26, 241–254. [Google Scholar] [CrossRef]
- Jolly, A. Thank You Madagascar; Zed Books: London, UK, 2015; p. 432. [Google Scholar]
- Blumenfeld-Jones, K.; Tahirihasina, M.; Randriamboavonjy, G.W.; Mertl-Millhollen, A.; Pinkus, S.; Rasamimanana, H. Tamarind recruitment and long-term stability in the gallery forest at Berenty, Madagascar. In Ringtail Lemur Biology; Jolly, A., Sussman, R.W., Koyama, N., Rasamimanana, H., Eds.; Springer: Berlin/Heidelberg, Germany, 2006; pp. 69–85. [Google Scholar]
- Koyama, N.; Soma, T.; Ichino, S.; Takahata, Y. Home ranges of ringtailed lemur troops. In Ringtail Lemur Biology; Jolly, A., Sussman, R.W., Koyama, N., Rasamimanana, H., Eds.; Springer: Berlin/Heidelberg, Germany, 2006; pp. 86–101. [Google Scholar]
- Winchester, V.; Hardwick, K.; Rasamimanana, H.; Raharison, S.; Mertl-Millhollen, A.; Gärtner, H.; McCrae, J. Berenty Reserve—A Gallery Forest in Decline in Dry Southern Madagascar: Towards Forest Restoration. Land 2018, 7, 8. [Google Scholar] [CrossRef]
- Arroyo-Rodriguez, V.; Mandujano, S. The importance of tropical rain forest fragments to the conservation of plant species diversity in Los Tuxtlas, Mexico. Biodivers. Conserv. 2006, 15, 4159–4179. [Google Scholar] [CrossRef]
- Lu, Y.; Ranjitkar, S.; Harrison, R.D.; Xu, J.; Ou, X.; Ma, X.; He, J. Selection of native tree species for subtropical forest restoration in southwest China. PLoS ONE 1917. [Google Scholar] [CrossRef]
- Elliott, S.; Navakitbumrunga, P.; Kuaraka, C.; Zangkuma, S.; Anusarnsunthorna, V.; Blakesley, D. Selecting framework tree species for restoring seasonally dry tropical forests in northern Thailand based on field performance. For. Ecol. Manag. 2003, 184, 177–191. [Google Scholar] [CrossRef]
- Di Sacco, A.; Hardwick, K.; Blakesley, D.; Brancalion, P.H.S.; Breman, E.; Rebola, L.C.; Chomba, S.; Dixon, K.; Elliott, S.; Ruyonga, G.; et al. Ten golden rules for tree planting initiatives to optimise carbon sequestration, biodiversity recovery and livelihood benefits. Glob. Chang. Biol. 2021, 27, 1328–1348. [Google Scholar] [CrossRef]
- Virah-Sawny, M.; Gillson, L.; Willis, K.J. How does spatial heterogeneity influence resilience to climatic changes? Ecological dynamics in Southeast Madagascar. Ecol. Monogr. Ecol. Soc. Am. 2009, 79, 557–574. [Google Scholar]
- Mahoney, J.J.; Saunders, A.D.; Storey, M.; Randriamanantenasoa, A. Geochemistry of the Volcan de l’Androy basalt-rhyolite complex, Madagascar Cretaceous igneous province. J. Petrol. 2008, 49, 1069–1096. [Google Scholar] [CrossRef]
- Morat, P. Les Savanes du Sud-Ouest de Madagascar; OSTROM: Paris, France, 1973; Volume 68, p. 236. [Google Scholar]
- Phillipson, P.B. Endemism and Non-Endemism in the Flora of Southwest Madagascar; OSTROM: Paris, France, 1996. [Google Scholar]
- Elliot, S.; Blakesley, D.; Hardwick, K. Restoring Tropical Forests: A Practical Guide; Kew Publishing: Richmond, UK, 2013; p. 332. Available online: https://www.forru.org/library/0000152 (accessed on 29 September 2021).
- Reeves, J.L.; Leibig, M.A. Depth Matters: Soil pH and Dilution Effects in the Northern Great Plains. Soil Sci. Soc. Am. J. 2016, 80, 1424–1427. [Google Scholar] [CrossRef]
- R Core Team. R: A Language and Environment for Statistical Computing Version 3.6.2; R Core Team: Vienna, Austria, 2019; Available online: https://www.R-project.org (accessed on 3 January 2021).
- Wickham, H. ggplot2: Elegant Graphics for Data Analysis; Springer: New York, NY, USA, 2016; ISBN 978-3-319-24277-4. Available online: https://ggplot2.tidyverse.org (accessed on 10 March 2021).
- Wickham, H. Forcats: Tools for Working with Categorical Variables (Fiablesactors). R Package Version 0.4.0. 2021. Available online: https://forcats.tidyverse.org/ (accessed on 3 March 2021).
- Wickham, H.; Averick, M.; Bryan, J.; Chang, W.; McGowan, L.D.; François, R.; Grolemund, G.; Hayes, A.; Henry, L.; Hester, J.; et al. Welcome to the Tidyverse. J. Open Source Softw. 2019, 4, 1686. [Google Scholar] [CrossRef]
- Day, A.D.; Ludeke, K.L. Soil Acidity. In Plant Nutrients in Desert Environments; Adaptations of Desert Organisms; Springer: Berlin/Heidelberg, Germany, 1993. [Google Scholar]
- Feng, J.; Xin-Rong, S.; Feng-Peng, H.; Zhi-You, Y. Increasing aridity, temperature and soil pH induce soil C-N-P imbalance in grasslands. Sci. Rep. 2016, 6, 19601. [Google Scholar]
- Hartley, A.; Barger, N.; Belnap, J.; Okin, G.S. Dryland ecosystems. In Nutrient Cycling in Terrestrial Ecosystems; Soil Biology 10; Marschner, P., Rengel, Z., Eds.; Springer: Berlin/Heidelberg, Germany, 2007; pp. 272–307. [Google Scholar]
- Sussman, R.W.; Green, G.M.; Porton, I.; Andrianasolondraibe, O.L.; Ratsirarson, Z.J. A survey of the habitat of Lemur catta in Southwestern and Southern Madagascar. Primate Conserv. 2003, 19, 32–57. [Google Scholar]
- Ramananjatovo, R. Etude Structurale et Écologique de la Régénération Naturelle de la Flore Dans Deux Zones à Différents Degrés de Perturbation Dans la Réserve Spéciale de Bezà Mahafaly; Mémoire de fin d’étude; ESSA—Eaux et Forêts; Université d’Antananarivo: Antananarivo, Madagascar, 2013. [Google Scholar]
- Miandrimanana, C.; Reid, L.; Rivoharison, T.; Birkinish, C. Planting position and shade enhance native seedling performance in forest restoration for an endangered Mlagasy plant. Plant Divers. 2019, 41, 118–123. [Google Scholar] [CrossRef]
- Certini, G. Effects of fire on properties of forest soils: A review. Oecologia 2005, 143, 1–10. [Google Scholar] [CrossRef]
- Da Silva, L.C.R.; Sternberg, L.; Haridasan, M.; Hoffman, W.A.; Miralles-Willhelm, F.; Franco, A.C. Expansion of gallery forests into central Brazilian savannas. Glob. Chang. Biol. 2008, 14, 2108–2118. [Google Scholar] [CrossRef]
- Tadross, M.; Randriamarolaza, L.; Rabefitia, Z.; Zeng, K.Y. Climate Change in Madagascar: Recent Past and Future; Climate Systems Analysis Group, University of Cape Town: Cape Town, South Africa; World Bank: Washington, DC, USA, 2008; pp. 1–17. [Google Scholar]
- Elmqvist, T.; Pyykönen, M.; Tengö, M.; Rakotondrasoa, F.; Rabakonandrianina, E.; Radimilahy, C. Patterns of loss and regeneration of tropical dry forest in Madagascar: The social institutional context. PLoS ONE 2007, 2, e402. [Google Scholar] [CrossRef]
- Parvez, S.S.; Parvez, M.M.; Nishihara, E.; Gemma, H.; Fujii, Y. Tamarindus indica L. leaf is a source of allelopathic substance. Plant Growth Regul. 2003, 40, 107–115. [Google Scholar] [CrossRef]
- Mangan, S.A.; Schnitzer, S.A.; Herre, E.A.; Keenan, M.L.; Valencia, M.C.; Sanchez, E.I.; Bever, J.D. Negative plant-soil feedback predicts tree-species relative abundance in a tropical forest. Nature 2010, 466, 752–755. [Google Scholar] [CrossRef] [PubMed]
- Mittermeier, R.A.; Mittermeier, C.G.; Brooks, T.M.; Pilgrim, J.D.; Konstant, W.R.; da Fonseca, G.A.B.; Kormos, C. Wilderness and biodiversity conservation. Proc. Natl. Acad. Sci. USA 2003, 100, 10309–10313. [Google Scholar] [CrossRef] [PubMed]


| Plot | P1 | P1 | P2 | P2 | P3 | P3 |
|---|---|---|---|---|---|---|
| Planting distance | 1 m | 1.5 m | 1 m | 1.5 m | 1 m | 1.5 m |
| Area (m2) | 305 | 309 | 278 | 354 | 346 | 556 |
| Seedling numbers | 251 | 142 | 257 | 166 | 268 | 213 |
| Family | Species | Local Name | |
|---|---|---|---|
| 1. | Fabaceae | Acacia rovumae * | Rovontsy |
| 2. | Fabaceae | Albizia polyphylla * | Halomboro |
| 3. | Salvadoraceae | Azima tetracantha * | Filofilo |
| 4. | Fabaceae | Bauhinia decandra | Tangatanganala |
| 5. | Cannabaceae | Celtis bifida | Bemavo |
| 6. | Cannabaceae | Celtis gomphophylla | Hazompotsy |
| 7. | Cannabaceae | Celtis madagascariensis | Tsilikantsifaka |
| 8. | Burseraceae | Commiphora aprevalii * | Daro |
| 9. | Rubiaceae | Coptosperma nigrescens * | Mantsake |
| 10. | Boraginaceae | Cordia caffra | Varogasy |
| 11. | Capparaceae | Crateva excelsa | Keleogny |
| 12. | Euphorbiacae | Euphorbia tirucalii | Famata |
| 13. | Malvaceae | Grewia androyensis | Tabarike |
| 14. | Malvaceae | Grewia calvata var. arbuscula | Andapary |
| 15. | Sapindaceae | Neotina isoneura | Volely |
| 16. | Anacardiaceae | Poupartia sp. | Magoe |
| 17. | Violaceae | Rinorea greveana | Tsatsaky |
| 18. | Salvadoraceae | Salvadora angustifolia | Sasavy |
| 19. | Apocynaceae | Strophanthus boivinii | Kapoke |
| 20. | Loganiaceae | Strychnos madagascariensis | Dagoa |
| 21. | Apocynaceae | Tabernaemontana coffeoides | Feka |
| 22. | Fabaceae | Tamarindus indica * | Kily |
| 23. | Rubiaceae | Tricalysia dauphinensis * | Hazombalala |
| 24. | Ximeniaceae | Ximenia perrieri | Kotro |
| RGR-H | RGR-RCD | ||||
|---|---|---|---|---|---|
| Plot | W Statistic | p-Value | Plot | W Statistic | p-Value |
| P1 | 7324.5 | 0.00048 * | P1 | 7416.5 | 0.00078 * |
| P2 | 23,808 | <0.00001 * | P2 | 19,517 | 0.02212 * |
| P3 | 14,854 | 0.2296 | P3 | 14,486 | 0.4331 |
| Mortality 2017–2018 | ||||||
|---|---|---|---|---|---|---|
| Plot | P1 1 m | P1 1.5 m | P2 1 m | P2 1.5 m | P3 1 m | P3 1.5 m |
| Total seedlings planted | 251 | 142 | 257 | 166 | 268 | 213 |
| Species | ||||||
| Acacia rovumae | 2 | 4 | 4 | 7 | 0 | 0 |
| Albizia polyphylla | 2 | 1 | 0 | 0 | 0 | 1 |
| Azima tetracantha | n/p | n/p | 0 | 0 | n/p | 1 |
| Bauhinia decandra | 5 | 2 | n/p | n/p | n/p | n/p |
| Celtis bifida | 10 | 7 | 7 | 9 | n/p | n/p |
| Celtis gomphophylla | 1 | 0 | 0 | 0 | 1 | 0 |
| Celtis madagscariensis | 4 | 4 | 1 | 1 | n/p | n/p |
| Commiphora aprevalii | n/p | n/p | 0 | 0 | 4 | 2 |
| Coptosperma nigrescens | 10 | 2 | 1 | 2 | 0 | 3 |
| Cordia caffra | 0 | 1 | 0 | 0 | 0 | 0 |
| Crateva excelsa | 0 | 0 | 0 | 1 | 1 | 2 |
| Euphorbia tirucalii | 0 | 0 | n/p | n/p | 0 | 0 |
| Grewia androyensis | 0 | 0 | n/p | n/p | 6 | 13 |
| Grewia calvata | n/p | n/p | 2 | 4 | 7 | 6 |
| Neotina isoneura | 8 | 4 | 0 | 3 | 0 | 1 |
| Poupartia sp. | 0 | 1 | 0 | 0 | n/p | n/p |
| Rinorea greveana | 4 | 3 | 0 | 0 | 3 | 5 |
| Strophantus boivinii | 0 | n/p | n/p | n/p | n/p | n/p |
| Salvadora angustifolia | n/p | n/p | 0 | 0 | 0 | 1 |
| Strychnos madagascariensis | n/p | n/p | n/p | n/p | n/p | 2 |
| Tabernaemontana coffeoides | 0 | 4 | 0 | 0 | n/p | n/p |
| Tamarindus indica | 2 | 1 | 1 | 1 | 0 | 1 |
| Tricalysia dauphinensis | 5 | 5 | 0 | 0 | 3 | 0 |
| Ximenia perrieri | n/p | n/p | n/p | n/p | 41 | 26 |
| Dead plants | 53 | 39 | 16 | 28 | 66 (25 *) | 64 (38 *) |
| Total plot mortality | 92 | 44 | 130 (63 *) | |||
| Mortality/planting distance/plot | 21.1% | 27.5% | 6.2% | 16.9% | 24.6% (9.32% *) | 30.04% (17.84% *) |
| Mortality/plot | 23.4% | 10.4% | 27.03% (13.09%*) | |||
| Total planted = 1297 (1226 *) Total Dead = 266 (199 *) Mortality for all plots = 20.5% (16.23% *) | ||||||
| Species | Number of Recruits | Total Recruits | |||||
|---|---|---|---|---|---|---|---|
| P1 (1 m) | P1 (1.5) | P2 (1 m) | P2 (1.5) | P3 (1 m) | P3 (1.5) | ||
| Tamarindus indica | 3 | 2 | 1 | 6 | |||
| Crateva excelsa | 2 | 4 | 3 | 6 | 15 | ||
| Rinorea greveana | 2 | 1 | 3 | ||||
| Tricalysia dauphinensis | 1 | 1 | |||||
| Allophyllus decaryi | 1 | 1 | 2 | ||||
| Neotina isoneura | 1 | 1 | |||||
| Salvadora angustifolia | 1 | 1 | 2 | ||||
| Tabernaemontana coff. | 4 | 4 | |||||
| Kosteletzkya diplocr. | 1 | 8 | 9 | ||||
| Miagne (shrub) | 13 | 13 | |||||
| Ximenia perrieri (shrub) | 8 | 4 | 12 | ||||
| Albizia polyphylla | 1 | 1 | |||||
| Total recruits per sub- plot planting distance | 5 | 10 | 6 | 12 | 23 (2) | 13 (1) | |
| Total recruits per plot | 15 | 18 | 36(3 *) | ||||
| Percentage of recruits per planting distance | 1.9 | 6.5 | 2.2 | 7.1 | 3.4 (0.7 *) | 6.1 (0.5 *) | |
| Percentage of recruits per plot | 3.3 | 3.9 | 7.4(0.6 *) | ||||
| 2018 at 25 cm | Sand % | Silt % | Clay % | pH | Organics % | Moisture % |
|---|---|---|---|---|---|---|
| 1 Dryland | 52.6 | 47.4 | 2.3 | 9.1 | 4.4 | 6.1 |
| 2 Dryland | 31.2 | 68.8 | 3.3 | 9 | 10.8 | |
| 3 Dryland | 35.6 | 64.4 | 3.3 | 7.5 | 7.2 | |
| 4 Dryland-regrown spiny | 31.1 | 68.9 | 3.6 | 8.6 | 9.3 | |
| Riverside | 45.5 | 54.5 | 3.5 | 7.1 | 2.5 | 11.9 |
| Paleochannel by10 m bank | 38.1 | 61.9 | 3.7 | 8.5 | 9.1 | |
| 2016 at 25 cm | ||||||
| P1-1 | 68.6 | 31.4 | 2.3 | 5.8 | 2.5 | 1.85 |
| P1-2 | 48.2 | 51.8 | 2.9 | 5.4 | 6 | 2.1 |
| P1-3 | 44.5 | 55.5 | 2.9 | 5.4 | 8 | 4.5 |
| P1-4 (GF) | 5.8 | 7.4 | 5.8 | |||
| P2-1 | 44.9 | 55.1 | 3.8 | 5.9 | 10.5 | 26.0 |
| P2-2 | 48.9 | 51.1 | 3.7 | 6.0 | 8.5 | 16.4 |
| P3-1 | 35.6 | 64.4 | 3.7 | 5.7 | 11.5 | 5.9 |
| P3-2 | 39.0 | 61.0 | 3.3 | 5.8 | 14 | 6.5 |
| P3-3 | 66.2 | 33.8 | 1.8 | 6 | 6.5 | 10.6 |
| 2014 at 5 cm | ||||||
| T1 C3 | 33.3 | 66.7 | 3.0 | 7.5 | 17 | |
| T1 C4 | 37.0 | 63 | 3.6 | 7.5 | 16 | |
| T2 C1 (GF) | 74 | 26 | 1.3 | 7.1 | 6 | |
| T3 C1 (GF) | 62.6 | 37.4 | 1.9 | 7.4 | 16 | |
| T3 C5 (GF) | 63.2 | 36.8 | 2.0 | 7.0 | 6 | |
| T3 C9 (GF) | 75.4 | 24.6 | 1.3 | 7.3 | 7 | |
| T5 C4 (P) | 40.6 | 59.4 | 3.8 | 7.3 | 21 | |
| T6 C3 (GF) | 85.8 | 14.2 | 0.7 | 6.5 | 4 | |
| T7 C8 (GF) | 70.4 | 29.6 | 1.7 | 7.6 | 10 | |
| T8 C2 | 47.4 | 52.6 | 2.7 | 7.3 | 14 | |
| T9 C2 (P) | 53.8 | 46.2 | 2.4 | 7.3 | 38 | |
| T12 C6 (D) | 61.3 | 38.7 | 2.2 | 6.6 | 8 | |
| T13 C6 (D) | 54.7 | 45.3 | 2.4 | 7.1 | 6 | |
| T14 C9 (PD) | 33.3 | 66.7 | 3.7 | 7.0 | 6 | |
| T15 C7 (PD) | 46.3 | 53.7 | 3.2 | 7.4 | 11 | |
| T16 C1 | 72.3 | 27.7 | 1.4 | 4.4 * | 13 | |
Publisher’s Note: MDPI stays neutral with regard to jurisdictional claims in published maps and institutional affiliations. |
© 2021 by the authors. Licensee MDPI, Basel, Switzerland. This article is an open access article distributed under the terms and conditions of the Creative Commons Attribution (CC BY) license (https://creativecommons.org/licenses/by/4.0/).
Share and Cite
Sagar, R.; Mondragon-Botero, A.; Dolins, F.; Morgan, B.; Vu, T.P.; McCrae, J.; Winchester, V. Forest Restoration at Berenty Reserve, Southern Madagascar: A Pilot Study of Tree Growth Following the Framework Species Method. Land 2021, 10, 1041. https://doi.org/10.3390/land10101041
Sagar R, Mondragon-Botero A, Dolins F, Morgan B, Vu TP, McCrae J, Winchester V. Forest Restoration at Berenty Reserve, Southern Madagascar: A Pilot Study of Tree Growth Following the Framework Species Method. Land. 2021; 10(10):1041. https://doi.org/10.3390/land10101041
Chicago/Turabian StyleSagar, Rubin, Ariadna Mondragon-Botero, Francine Dolins, Bryn Morgan, Thuy Phuong Vu, Janet McCrae, and Vanessa Winchester. 2021. "Forest Restoration at Berenty Reserve, Southern Madagascar: A Pilot Study of Tree Growth Following the Framework Species Method" Land 10, no. 10: 1041. https://doi.org/10.3390/land10101041