Article

Impact of Sustainable Land Management Practices on Soil Properties: Example of Organic and Integrated Agricultural Management

1
Department of Agronomy, Biotechnical Faculty, University of Ljubljana, Jamnikarjeva 101, 1000 Ljubljana, Slovenia
2
Regional Unit Slovenj Gradec, Slovenia Forest Service, Vorančev trg 1, 2380 Slovenj Gradec, Slovenia
*
Author to whom correspondence should be addressed.
Submission received: 20 November 2020 / Revised: 21 December 2020 / Accepted: 22 December 2020 / Published: 23 December 2020
(This article belongs to the Section Landscape Ecology)

Abstract

:
Maintaining good soil quality is crucial for the sustainability of agriculture. This study aimed to evaluate the effectiveness of the visual soil assessment (VSA) method by testing it on two soil types and two agricultural management practices (AMP) (organic and integrated) that are considered to protect soil quality. We selected two farms with plots on two river terraces with different soil properties. The test was based on the modified method Annual Crops Visual Quality Assessment developed by the Food and Agriculture Organization of the United Nations and supported by a standardized soil physical and chemical analysis. This study showed that the assessed score is highly dependent on the type of farming practice and how soils are managed. The soil type also plays an important role. The results for Calcaric Fluvisol showed that the effects of selected agricultural management practices on the visual assessment of soil quality could be almost undetectable. The time of assessment also plays a significant role in VSA scoring. Different crops and agricultural activities with significant impacts on the soil occur throughout the year (especially in vegetable production). It was observed that a higher score for the soil cover indicator had a beneficial effect on the total VSA rating.

1. Introduction

Three factors that influence an ecosystem’s vitality and productivity are water quality, air quality, and soil quality. When defining the quality of water and air, there are standards by which both qualities can be quantitatively determined, usually by assessing the degree of pollution [1]. The definition of soil quality is complicated because it is linked to the degree of pollution (excess or deficiency of a specific parameter) and the composition and proportions of three states of matter—liquid, gaseous, and solid. Due to the complexity of soil and its various uses and interests, several different soil quality definitions have been developed to assess many different quality indicators [2].
Soil quality can easily be defined as “suitability of the soil for a particular use or management”, but the definition is much more complex [3]. Soil quality depends on external factors such as soil management, ecosystem and environmental interactions, socio-economic, political, and policy priorities, and climate change [4]. Taking these factors into account, a definition has been developed that defines soil quality as “the ability of soil to function within an ecosystem and with respect to the land use by maintaining biological productivity, maintaining environmental quality and promoting plant and animal vitality” [5,6].
Recently, there has been more focus on developing methods for determining soil quality as compared to developing definitions of soil quality. Methods and tools for soil quality assessment are increasingly developing into practical and easy-to-use methods and tools, primarily aimed at farmers and agricultural extension services. The main objectives of international projects such as LandPKS [7], iSQAPER [8], and LandMark [9] were to provide stakeholders with (visual) soil quality assessment methods as an easy-to-use tool for continuous monitoring of soil quality and soil changes [2,10].
The main objective of soil protection is to reduce or prevent soil quality degradation, which implies a deterioration or loss of soil capacity to perform ecosystem functions. There are four interdependent types of soil degradation: physical, chemical, biological, and ecological [11]. The main soil degradation processes are erosion, loss of biodiversity, reduction of soil organic carbon, acidification, salinization, loss of soil fertility, nutrient imbalance, compaction, and sealing [12]. Soil degradation processes are further divided into naturally occurring or man-made factors [13,14].
Maintaining optimal soil quality is crucial for the environmental and economic sustainability of agriculture. Soil degradation affects plant growth, crop yield, quality, production costs, and increases soil erosion and nutrient leaching [15,16]. Improving the soil’s physical properties is particularly challenging, requiring considerable time and financial resources. The combination of soil type (texture: sandy, loamy, silty, and clayey) and soil management (tillage, crop rotation, and fertilization) has a significant impact on the long-term economic impact on farms [17]. Farmers, therefore, need reliable, quick, and easy-to-use tools to assess the condition of the soil and make recommendations for improving agricultural practices [15]. Visual soil quality assessment (VSA) is a quick and easy way to assess the soil’s condition and the plants growing in it [16]. It was developed by the United Nations Food and Agriculture Organization (FAO). VSA can also help assess the suitability of soils to cultivate certain crop species [18]. Top-quality soils generally promote production with the lowest initial and running costs. Except for soil texture, all soil indicators are dynamic, which means that they change under the influence of different crop production systems, cultivation methods, or crop species. Since indicators are responsive to change, they can be used as an early warning system to monitor soil changes [15].
To determine whether the VSA method can assess the level of nutrient availability in the soil and whether it detects differences between agricultural management practices (organic and integrated farms), we conducted a two-factor experiment with four independent variables. Soil type and agricultural practice were determined as factors. The independent variables were the VSA soil quality index points, plant-available potassium (K2O) and phosphorus (P2O5), pH, and soil organic matter content. The set statistical model data were presented using the R-Statistics program, where diagrams were drawn using the XYplot function. When setting up the two-factor experiment, we divided 20 assessments into four groups (organic-cambisol, organic-fluvisol, integrated-cambisol, and integrated-fluvisol) of five samples (fields) per group.
This study aimed to evaluate the effectiveness of the visual soil assessment (VSA) method by testing it on two soil types (Eutric Cambisol soil and Calcaric Fluvisol) and two agricultural management practices (AMP) (organic and integrated) that are considered to protect soil quality. Standard soil fertility tests for pH, organic matter, phosphorus, and potassium were compared with the VSA protocol. The results will show whether the VSA is applicable or valuable for farmers or their advisors.

2. Materials and Methods

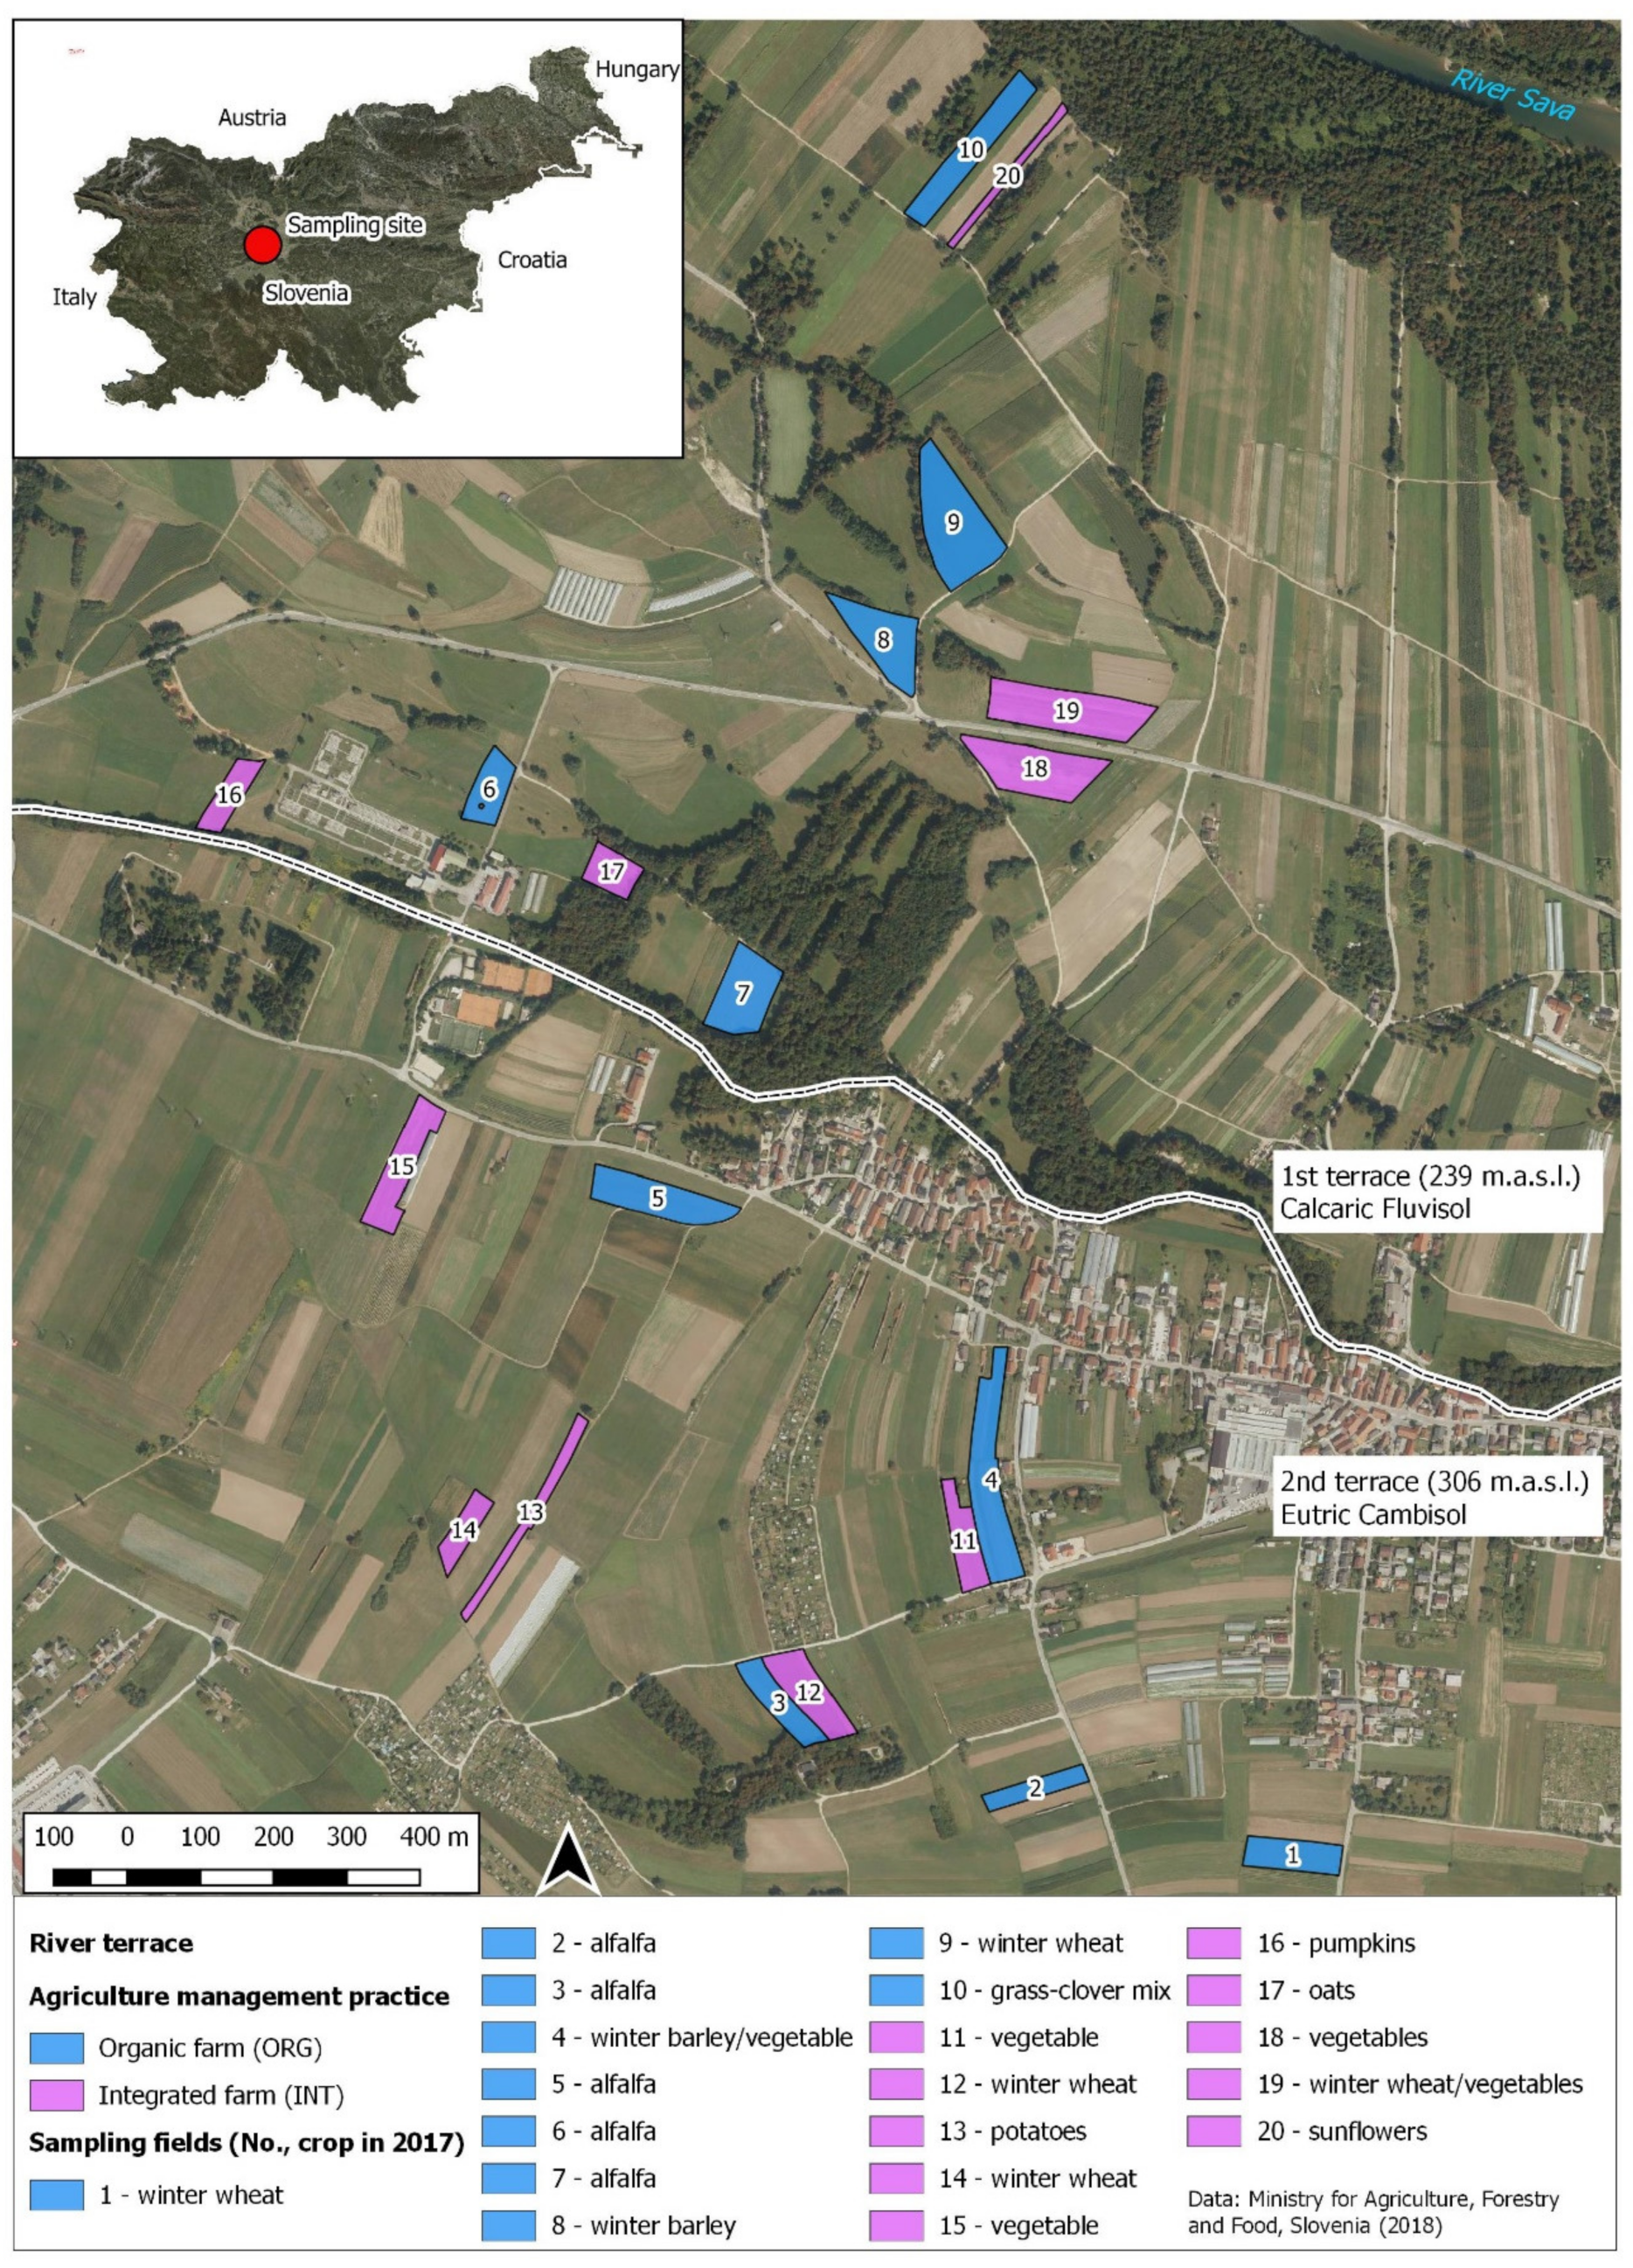
2.1. Case Study Area

The study area is located in the Ljubljansko polje area on two alluvial terraces of the Sava River (293–306 m.a.s.l.) on the northern side of the city of Ljubljana (Figure 1). The terraces were formed by river deposits of glacial and river material during the Pleistocene and Holocene. The upper layer of the source material consists mainly of permeable sand and gravel, below which is a layer of a conglomerate.
The soil type in the area of the second (upper) terrace (306 m.a.s.l.) is eutric brown soil (Eutric Cambisol). These soils are mostly shallow, moderately developed, and formed on ice-age gravel and sandy river deposits. The soil texture is loamy to silty loam (clay, 16–26%; silt, 35–60%; sand, 34–46%). The soil type in the area of the first (lower) terrace (293 m.a.s.l.) is calcareous soil on river sediments (Calcaric Fluvisol) with shallow to deep young soil formed on sandy gravel alluvium. The soil texture is mostly silty loam to sandy loam (clay, 10–20%; silt, 30–64%; sand, 36–60%). Erosion has an insignificant influence on the soil, as the study area has a negligible gradient and low wind speeds and is located outside the floodplains.
A water protection zone (WPZ) was established in the area due to the soil’s high permeability on the sandy gravel parent material. The shallow groundwater in the area is the primary source of drinking water for the Slovenian capital Ljubljana. The WPZ regulations prescribe the type of fertilizer, the timing of application, and the type of plant protection products that agricultural producers can use in the area [19].
According to Environmental Agency, the Ljubljana-Bežigrad Meteorological Station (299 m above sea level), located 1 km to the south, has an average annual air temperature of 10.2 °C. The average vegetation period above 5 °C is 245 days, above 8 °C 210 days, and above 10 °C 184 days. The average annual precipitation is 1362 mm (1981–2010). The average annual water balance in the area is positive (606 mm), while in July and the first half of August, there is occasionally a negative water balance (temporary drought).
The organic farm (ECO) has been regularly involved in certified organic farming since 2010. The conversion began in 2008. On 25 hectares of cultivated arable land, only fertilizers approved for organic farming are used. On average, the farmer uses 20–30 tons/ha of cattle farmyard manure per year. In vegetable production, imported certified organic fertilizers (organic guano) are used. The fields are mainly used to produce grain, green fodder, and vegetables. Livestock production is dominated by 20 head of cattle (suckler cows and milk production), some pigs, chickens, and horses.
The integrated farm (INT) was transformed into an integrated production site in 2004. The essential prerequisite for integrated production is the sustainable use of plant protection products and fertilizers. On 10 hectares of cultivated farmland, the farmer produces vegetables as well as some cereals and berries. Livestock production was abandoned in 2010. Only inorganic fertilizers and composted plant residues are used for fertilization.
Both farmers carry out soil cultivation every year and plow the soil to a depth of 20 cm. They plow to prevent weed growth and reduce the use of herbicides. They use different types of rotary harrows and cultivators to prepare the soil beds. In the growth phase, crops and vegetables are additionally cultivated with mechanical weed-killers. Restrictions are linked to organic production and water protection areas; plant protection products are limited. The organic farmer has further restrictions as he may only use products that are registered for organic production.
The five-year crop rotation on an organic farm (ORG) consists of alfalfa/alfalfa/vegetables (potatoes)/winter wheat (barley)/other cereals (rye, millet, buckwheat, and maize). The five-year crop rotation on an integrated farm (INT) consists of vegetables/vegetables/potatoes/vegetables/winter wheat (barley). The organic farm has a higher proportion of legumes in the crop rotation (approx. 25–30%) than the integrated farm, where legumes are used as cover crops or green manure. Vegetables are often grown as a second crop after winter cereals. Figures S1 and S2 in the Supplementary Materials show the crops grown on plots in the VSA analysis year (2017). No data on harvest volumes (yields) were collected and used in the data analysis because the cereals are not additionally fertilized on the integrated farm (transitional crop). Different vegetable types and varieties are grown in different periods.

2.2. Experimental Design and Data Measurement

The experiment’s research and design were conducted under the European Union H2020 iSQAPER project [8,12]. The experiment was designed as a comparative observational study. The experimental units were actual fields managed by two farmers, each with ten replications (fields). Fixed factors were the soil type (Eutric Cambisol, Calcaric Fluvisol) and the agricultural management practice (organic, integrated). Random factors were VSA score, soil pH (CaCl2), soil organic matter, P2O5, and K2O.
We analyzed 20 fields: 10 on the second or upper terrace (Eutric Cambisol) and 10 on the first or lower terrace (Calcaric Fluvisol) (Figure 1). The sampling fields numbered 1 to 10 are involved in organic production (ECO) (blue). The sampling fields numbered 11 to 20 are involved in integrated production (INT) (purple) (Figure 1). All fields are less than 1.3 ha, which is typical for farms in the area. The work was carried out in collaboration with the farmers who own the plots. We carried out various visual tests on the soil quality of individual fields falling within the scope of the VSA method (structure, porosity, color, aggregate stability, and earthworm density) (Table 1).
Using the selected method, we determined the VSA values of the selected sampling fields three times during the growing season (2 June 2017, 25 July 2017, and 9 September 2017). We took three samples to reduce the temporal impact of different factors on soil quality assessment (plant type, plant development stage, tillage, and harvest). To assess the effectiveness of VSA of soils, we took soil samples for standard chemical analysis of soil fertility with a soil probe to a depth of 20 cm (tillage depth). Sampling was carried out after the growing season, during the winter (4 January 2018). Twenty randomly distributed sub-samples per field were collected and combined to one representative sample per field.
The laboratory analysis determined the soil texture, soil organic matter, and soil pH. Plant available phosphorus (P2O5) and potassium (K2O) were analyzed using the calcium acetate lactate method (CAL) [20,21]. Soil organic carbon (SOC) was obtained by oxidation of organic matter with a known amount of chromate in the presence of sulphuric acid. The remaining chromate was determined spectrophotometrically at 600 nm. The calculation of organic carbon is based on organic matter containing 58% carbon [22]. The pH values were determined in a suspension of 0.01 M CaCl2 according to the standard [23].

2.3. Visual Soil Assessment (VSA)

The FAO developed the visual soil assessment (VSA) method. We have used the method for the soil assessment of annual crops [15]. This method evaluates various soil quality indicators such as texture, structure, porosity, color, anaerobic soil condition, rooting depth, surface ponding, soil crusting, plant cover, earthworms count, wind erosion, and water erosion (Table 1). Except for soil texture, all soil quality indicators are variable so that that different agrotechnological measures can influence the result of the evaluation. All soil quality indicators were defined in three repetitions to reduce uncertainty. The VSA is based on a visual assessment of the soil condition and soil quality-dependent plant growth. In the process, a visual score (VS) is assigned to each soil quality indicator as 0 (poor), 1 (medium good), or 2 (good) (Table 1). Scores are determined by comparing the sampled soils with the example photo from the VSA Field Guide. If the sampled soils do not match the example given, one may assign intermediate scores of 0.5 or 1.5. As some soil quality indicators are more important than others, they are weighted according to their importance. Overall, the ranking delivers a soil quality index score (poor, moderate, or good soil conditions; Table 1).
For the VSA to be carried out, the soil must be adequately moist. According to the instructions, the appropriate soil moisture is checked by the “worm test”, by rolling a worm of soil 40 mm long and 5 mm in diameter. Soils are suitable for quality assessment if they do not form rolls or cracks (for sandy soils). If it is possible to form a roll of soil, it is a sign that the soils are too moist and unsuitable for assessment. The samples were taken at a representative location of the sampling field, in the middle of the field, avoiding pathways, roads, field edges, and machinery turning areas.
A soil sample was excavated during sampling in a 20 cm deep × 20 cm wide × 20 cm high cube. For each sampling hole, the soil profile’s homogeneity was checked up to a depth of 30 cm to observe if differences in the excavated profile could be detected. As the plowing depth in the study area is 25 cm, only one layer was scored.
The soil texture was determined with a finger test described in the VSA Field Guide for annual crops. The spade test was used to determine the soil structure. Soil aggregates were ranked by size from coarsest to the finest according to their size. The slaking test was used to assess the structural stability of the soil aggregates. Soil compaction, soil crusting, and rill erosion potential should also be estimated using other methods to observe soil aggregates’ decomposition [24].
The number of earthworms was estimated by counting the individual specimens in the excavated soil sample cube after the soil structure test. To assess the earthworm number, we had to adapt the criterion from VSA to our climate conditions and soil type. According to the criterion set out in the VSA guide, at least two types of earthworms and a total of at least 15 earthworms should be in the sample to assess the score 1. This would mean that all our soil samples would be rated 0. To give the earthworm indicator more weight, the rating was adopted as follows: a score of 0 assigned to soil samples with less than two earthworms found; a score of 1 was given to samples with two to three earthworms; a score of 2 was assigned to samples with more than three earthworms found.
For each indicator assessment, we assigned the total weighted VSA points to the sampled soil. Soils that score less than 15 points are rated as poor, soils that score between 15–30 points are rated as moderately good, and soils that score more than 30 points are rated as good. The maximum number of VSA points attained by soil planted with annual crops is 48 [15].

2.4. Statistical Methods

Defined field-specific VSA soil quality index and annual averages for the three field assessments were included in other statistical estimates. The data collected were statistically analyzed with ANOVA and the R Statistics program. Statistical processing of the VSA results was performed to determine whether any statistically significant differences exist between soil management practices on different soil types.

3. Results and Discussion

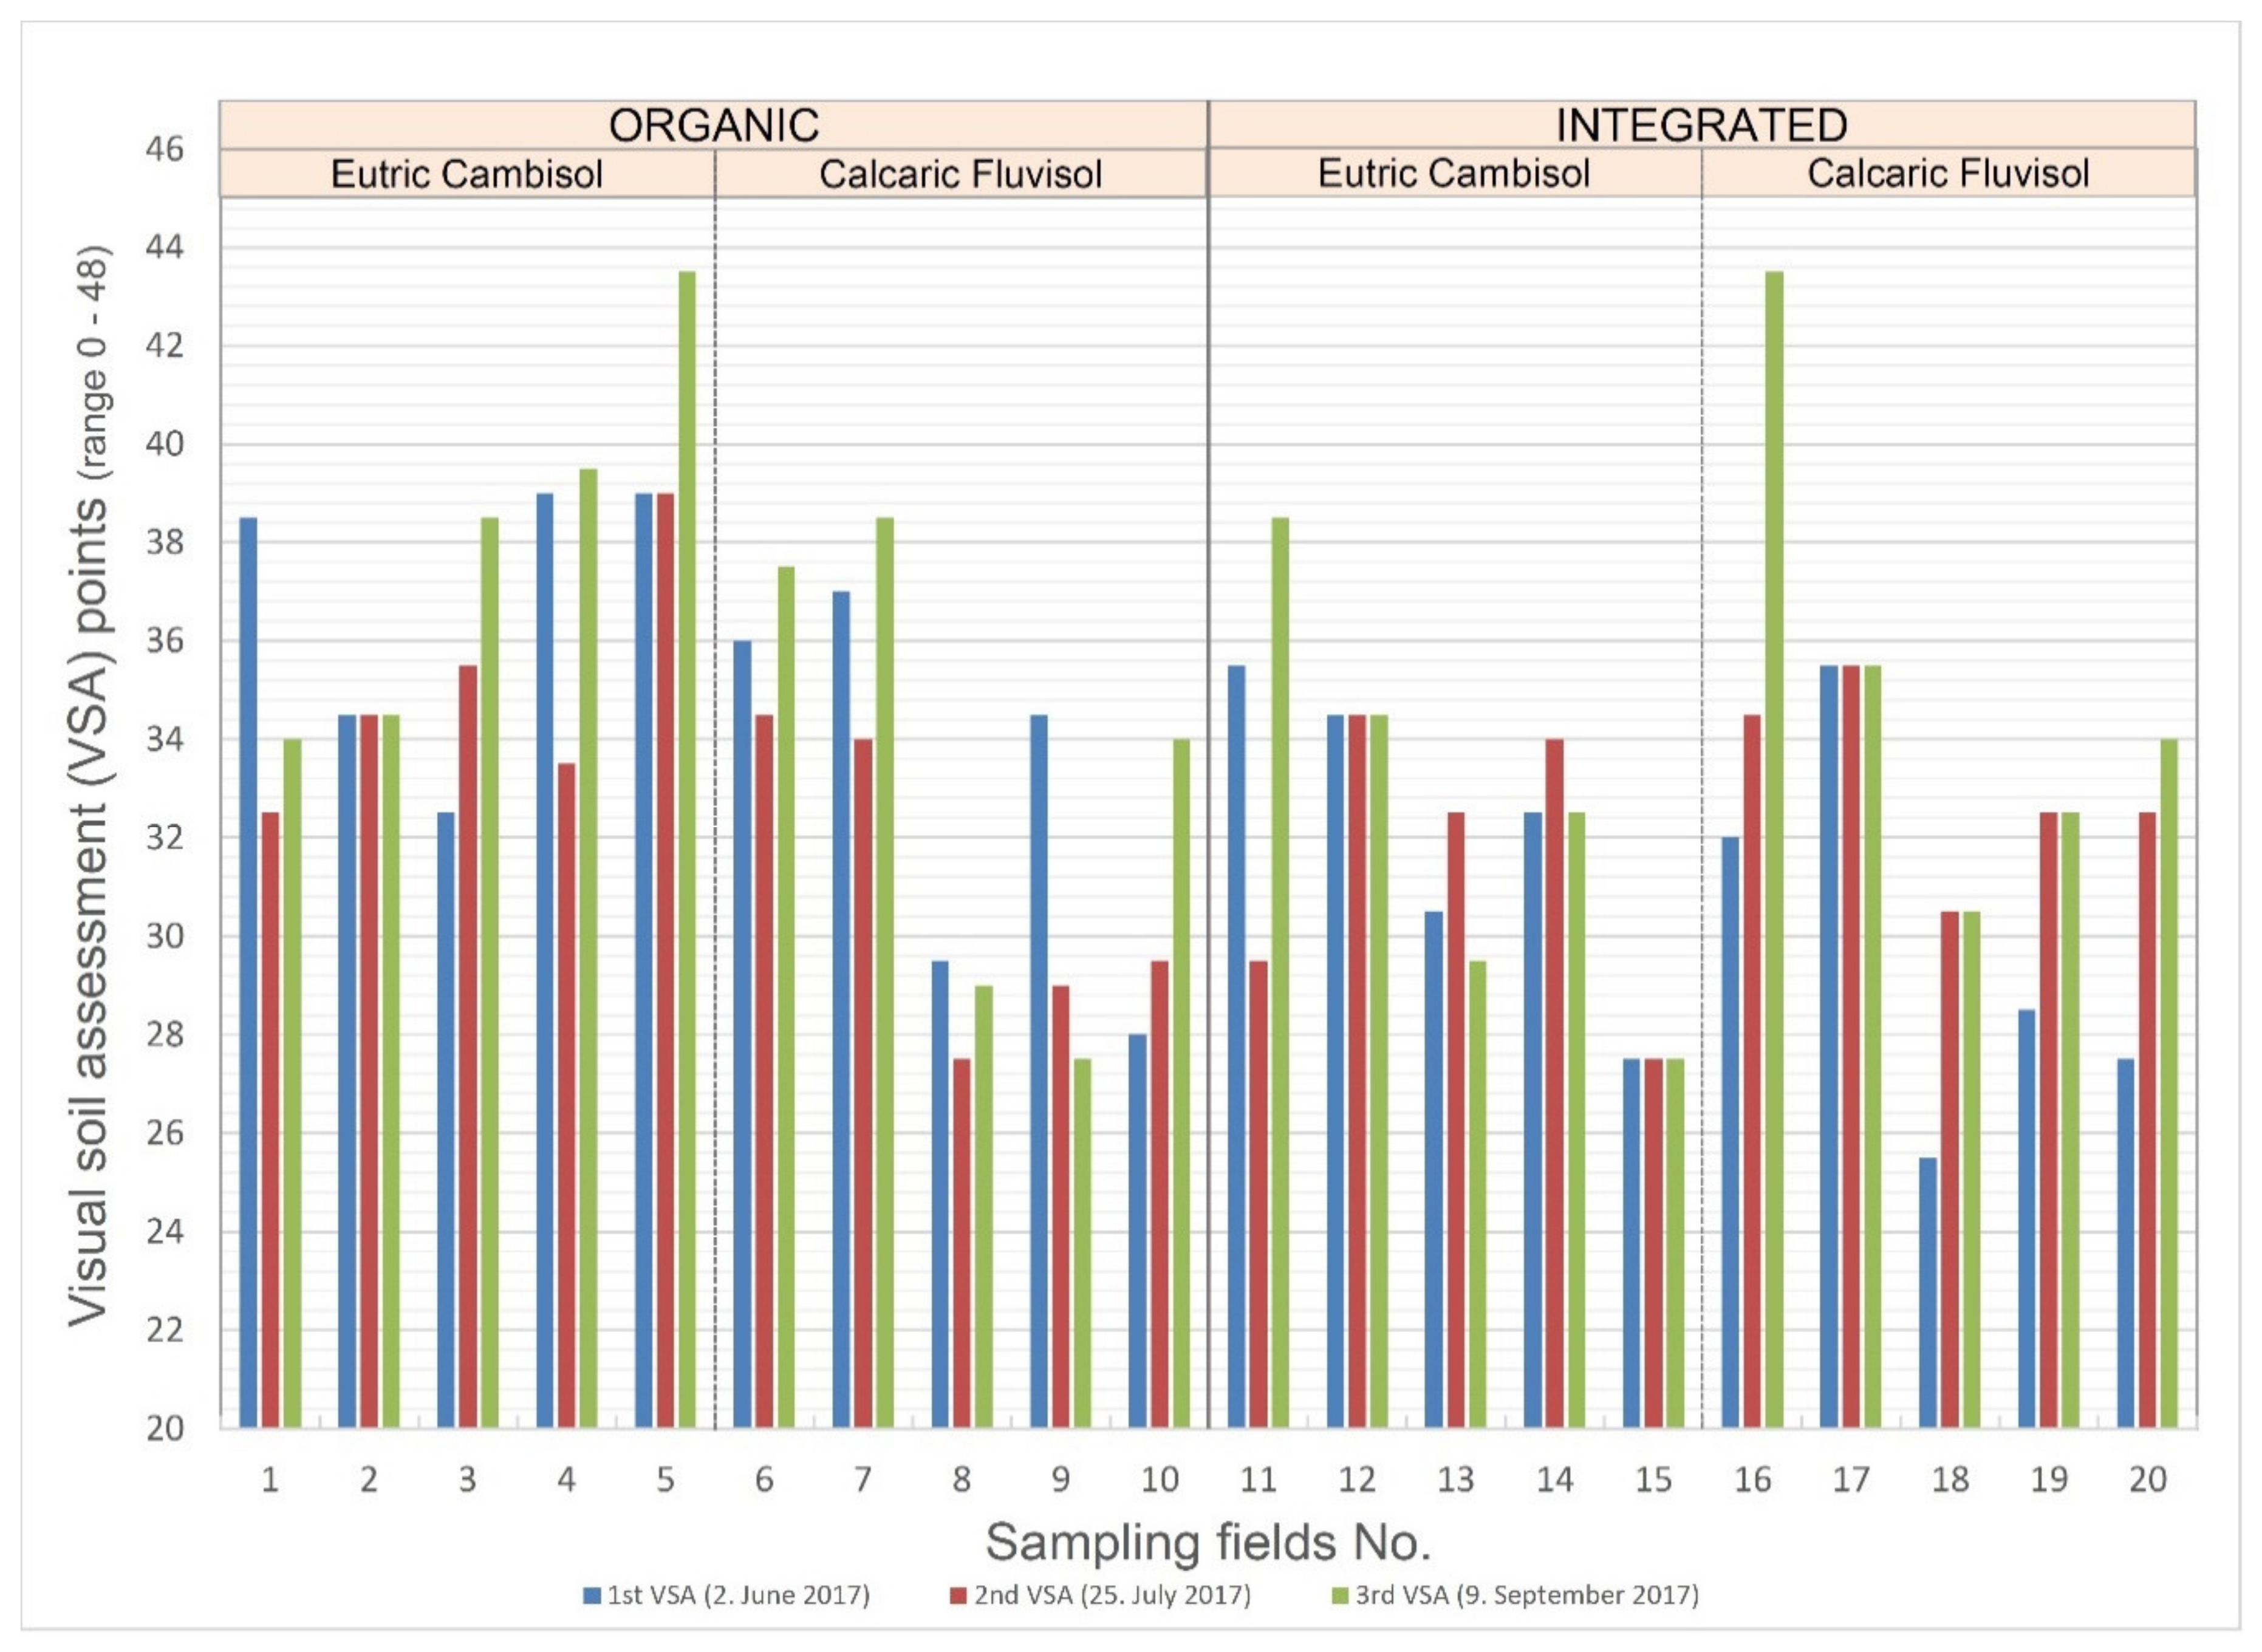
3.1. Visual Soil Assessment and Chemical Soil Analysis Data

The results of the VSA soil quality index are presented in Figure 2 and Table 2 and Table 3. Detailed scoring of individual indicators (Table 1) for each sampling field and time is presented in the Supplementary Materials (Table S1). Most of the sampled field soils were rated as good, with an average result of over 30 points. None of the sampled fields were rated as poor quality (less than 15 points) (Figure 2, Table 3). The highest VSA score was 43.5, which was obtained during the third sampling (September) for field 5 (organic, alfalfa) and the weed-covered field 16 (integrated, pumpkins). The maximum variability in VSA points was observed in field 16, which exhibited between 32 and 44 points among the three consecutive sampling sessions. The VSA soil quality index improved gradually with each subsequent sampling session. The improvement was mainly aided by the growing plants and weeds, filling spaces between plants, and covering the soil. This mainly improved the scores for the soil structure and porosity. Soils completely covered with vegetation often improved the results of the earthworm indicator.
The least points (25.5) and moderate soil quality were obtained from sampling field 18 (integrated, vegetables) during the first sampling in June. At this time of year, vegetable plants were in an early development phase, meaning a low proportion of plant-soil cover was present (absence of earthworms).
The highest drop (for 4.5) in VSA points in the growing period from June to September was observed for sampling field 1 (organic, winter wheat). The absence of earthworms influenced soil samples’ scoring results in the second and third assessments and the lower plant-soil cover indicator results of the third sampling.
Table 3 presents the VSA soil quality index points for each sampling field, sampling dates, and the standard chemical analysis results. Data are presented separately for organic production, integrated production, Eutric Cambisol soils, and Calcaric Fluvisol soils. On average, the VSA points were higher in organic farm fields and Eutric Cambisol soils. The soil structure and earthworm abundance VSA were significantly lower for the integrated farm than the organic farm. Comparison of VSA points of sampling dates showed that, on average, soil samples were best rated at the third assessment at the beginning of September, regardless of the farm type or soil type.

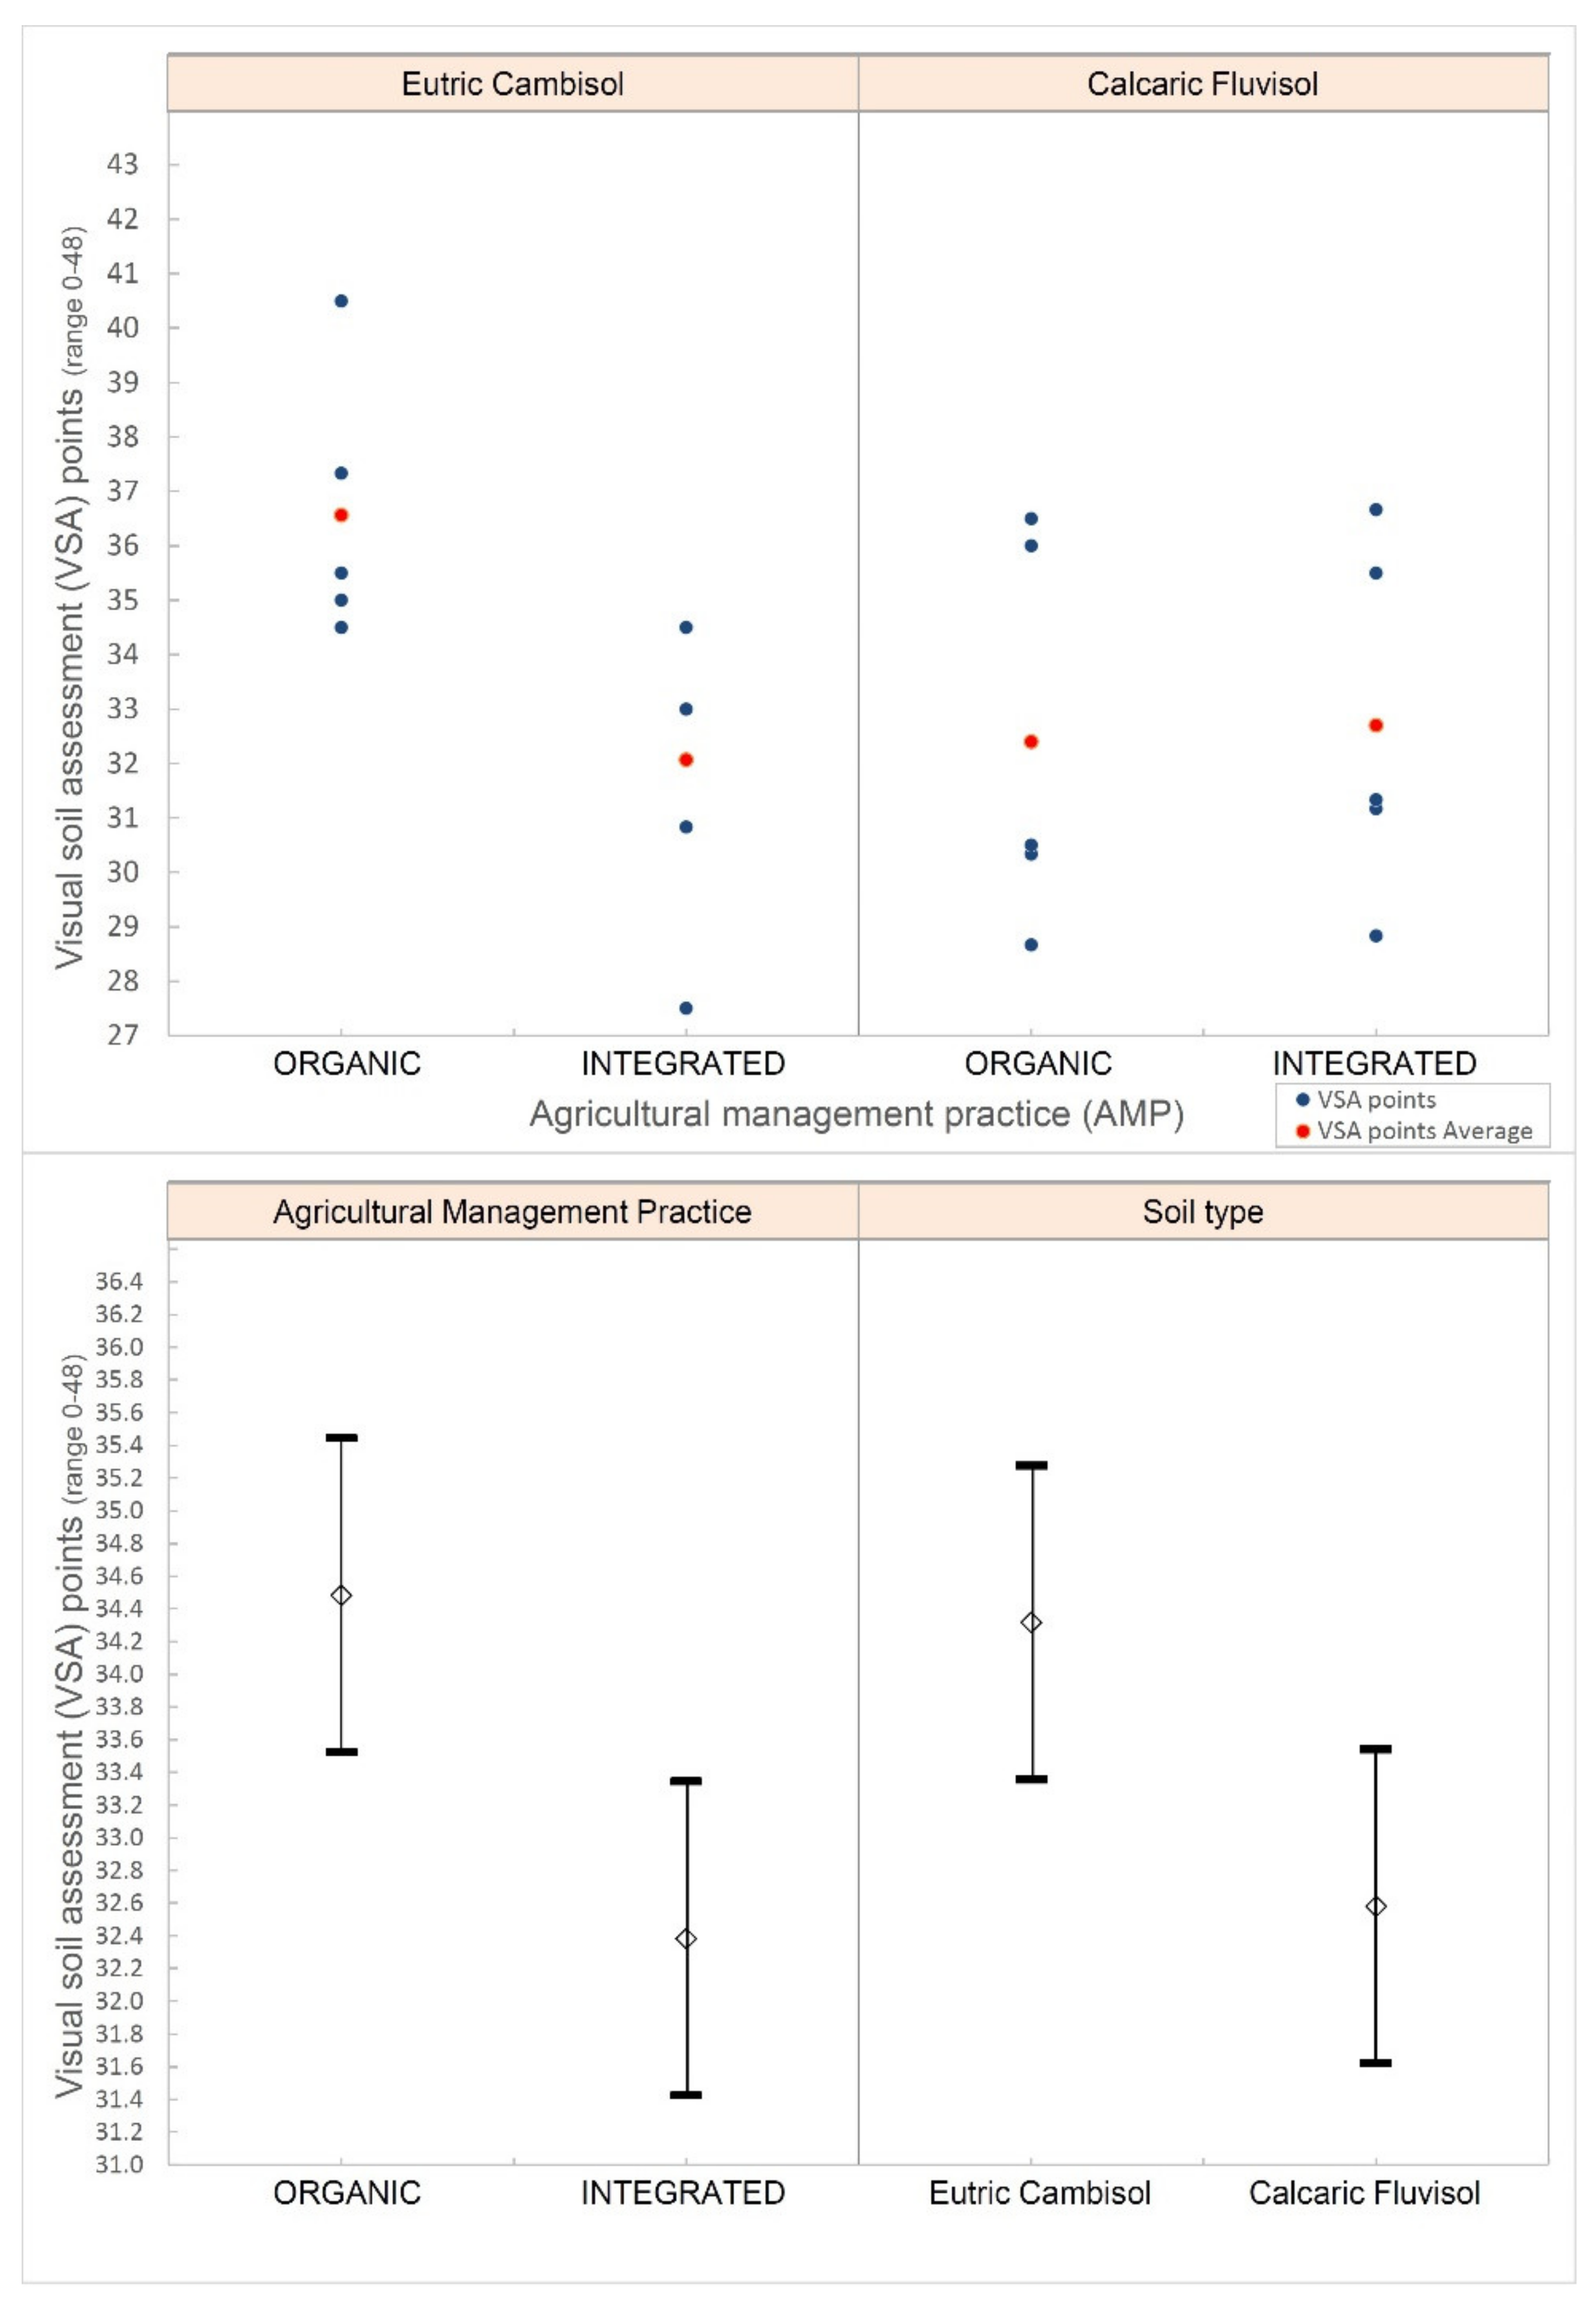
3.2. Statistical Analysis

3.2.1. Visual Soil Assessment

The ANOVA analysis showed that the VSA scores obtained were statistically significantly higher in organic production than integrated production (p = 0.04; Figure 3). The differences for management are significant at the 95% confidence level, tested by Tukey’s honestly significant difference (HSD) procedure. The effect of soil type was visible, though not significant; Eutric Cambisol produced a higher VSA sum score than Cambic Fluvisol, by two points (p = 0.08; Table 2) to its better soil porosity. Interestingly, the combination of soil type × soil management produced a highly significant effect (p = 0.01). The organic farming of Eutrical Cambisol had a significant positive effect on the soil porosity, earthworm count, and less soil crusting, which leads to better infiltration and soil aeration. These results can be associated with the positive effect of organic fertilizers and crop rotation with a higher proportion of legumes (alfalfa). The results show that despite the same soil management on the organic farm, the VSA score did not increase for the Calcaric Fluvisol soils, in contrast to the Eutric Cambisol soils.
Nevertheless, the input of farmyard manure in Calcaric Fluvisol resulted in a higher organic matter content of 0.3% in organic management (4.8%) in comparison to integrated management (4.5%). Although this difference looks small, it offers a different perspective when translated into the mass per ha. A share of 0.3% means 7800 kg/ha more humus in the 0–20 cm layer. According to the Association of German Agricultural Analytic and Research Institutes (VDLUFA) humus balance model, 57.8 tons/ha of cereal straw would be needed to build such an amount of humus in the soil [25]. A farmer would need several years, or even decades, to produce and incorporate enough organic matter into the soil to build humus. This shows that soil humus is built up slowly over several years or even decades. Calcaric Fluvisol soils contain a smaller amount of fine soil particles (clay). Therefore, they are more limited in storing soil organic carbon (SOC) in stable humus than Eutric Cambisol. The equation for SOC saturation in temperate climate zone is Csat = 4.09 + 0.37 × fine soil fraction (particle size <20 µ) [26]. Calcaric Fluvisol (less clay) is closer to the saturation limit and, therefore, in a better SOC condition than the Eutric Cambisol [26].

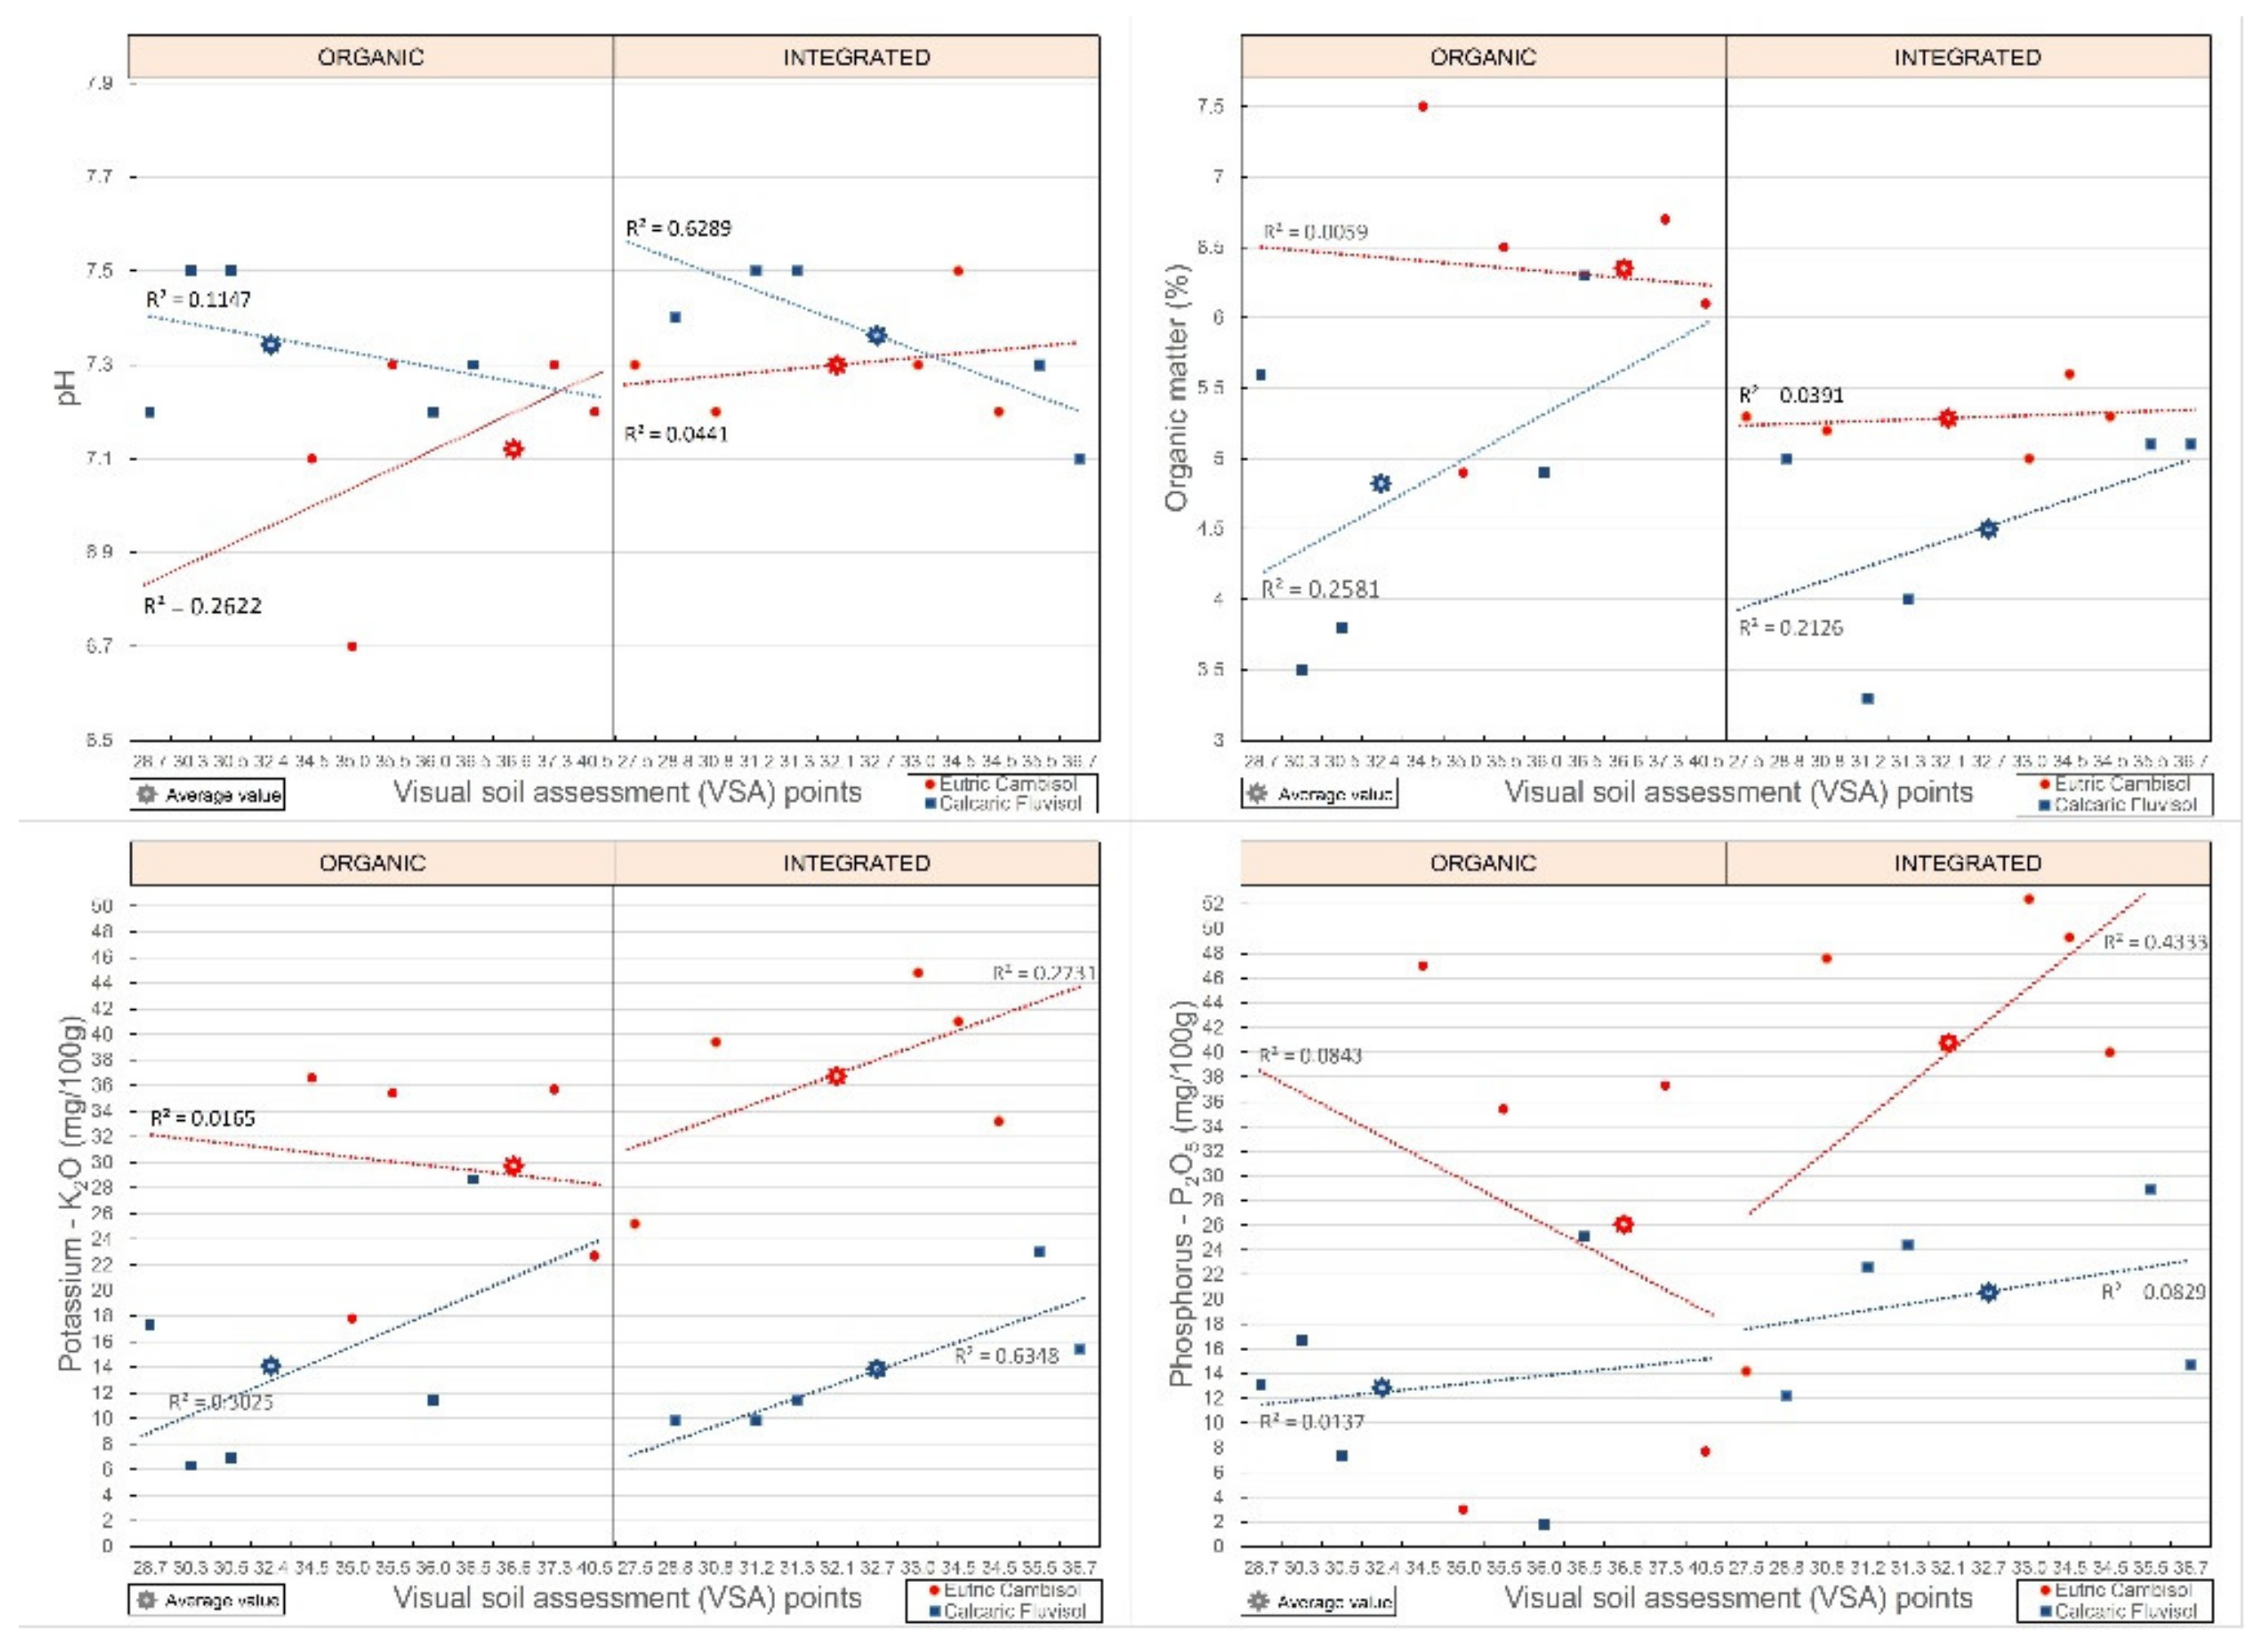
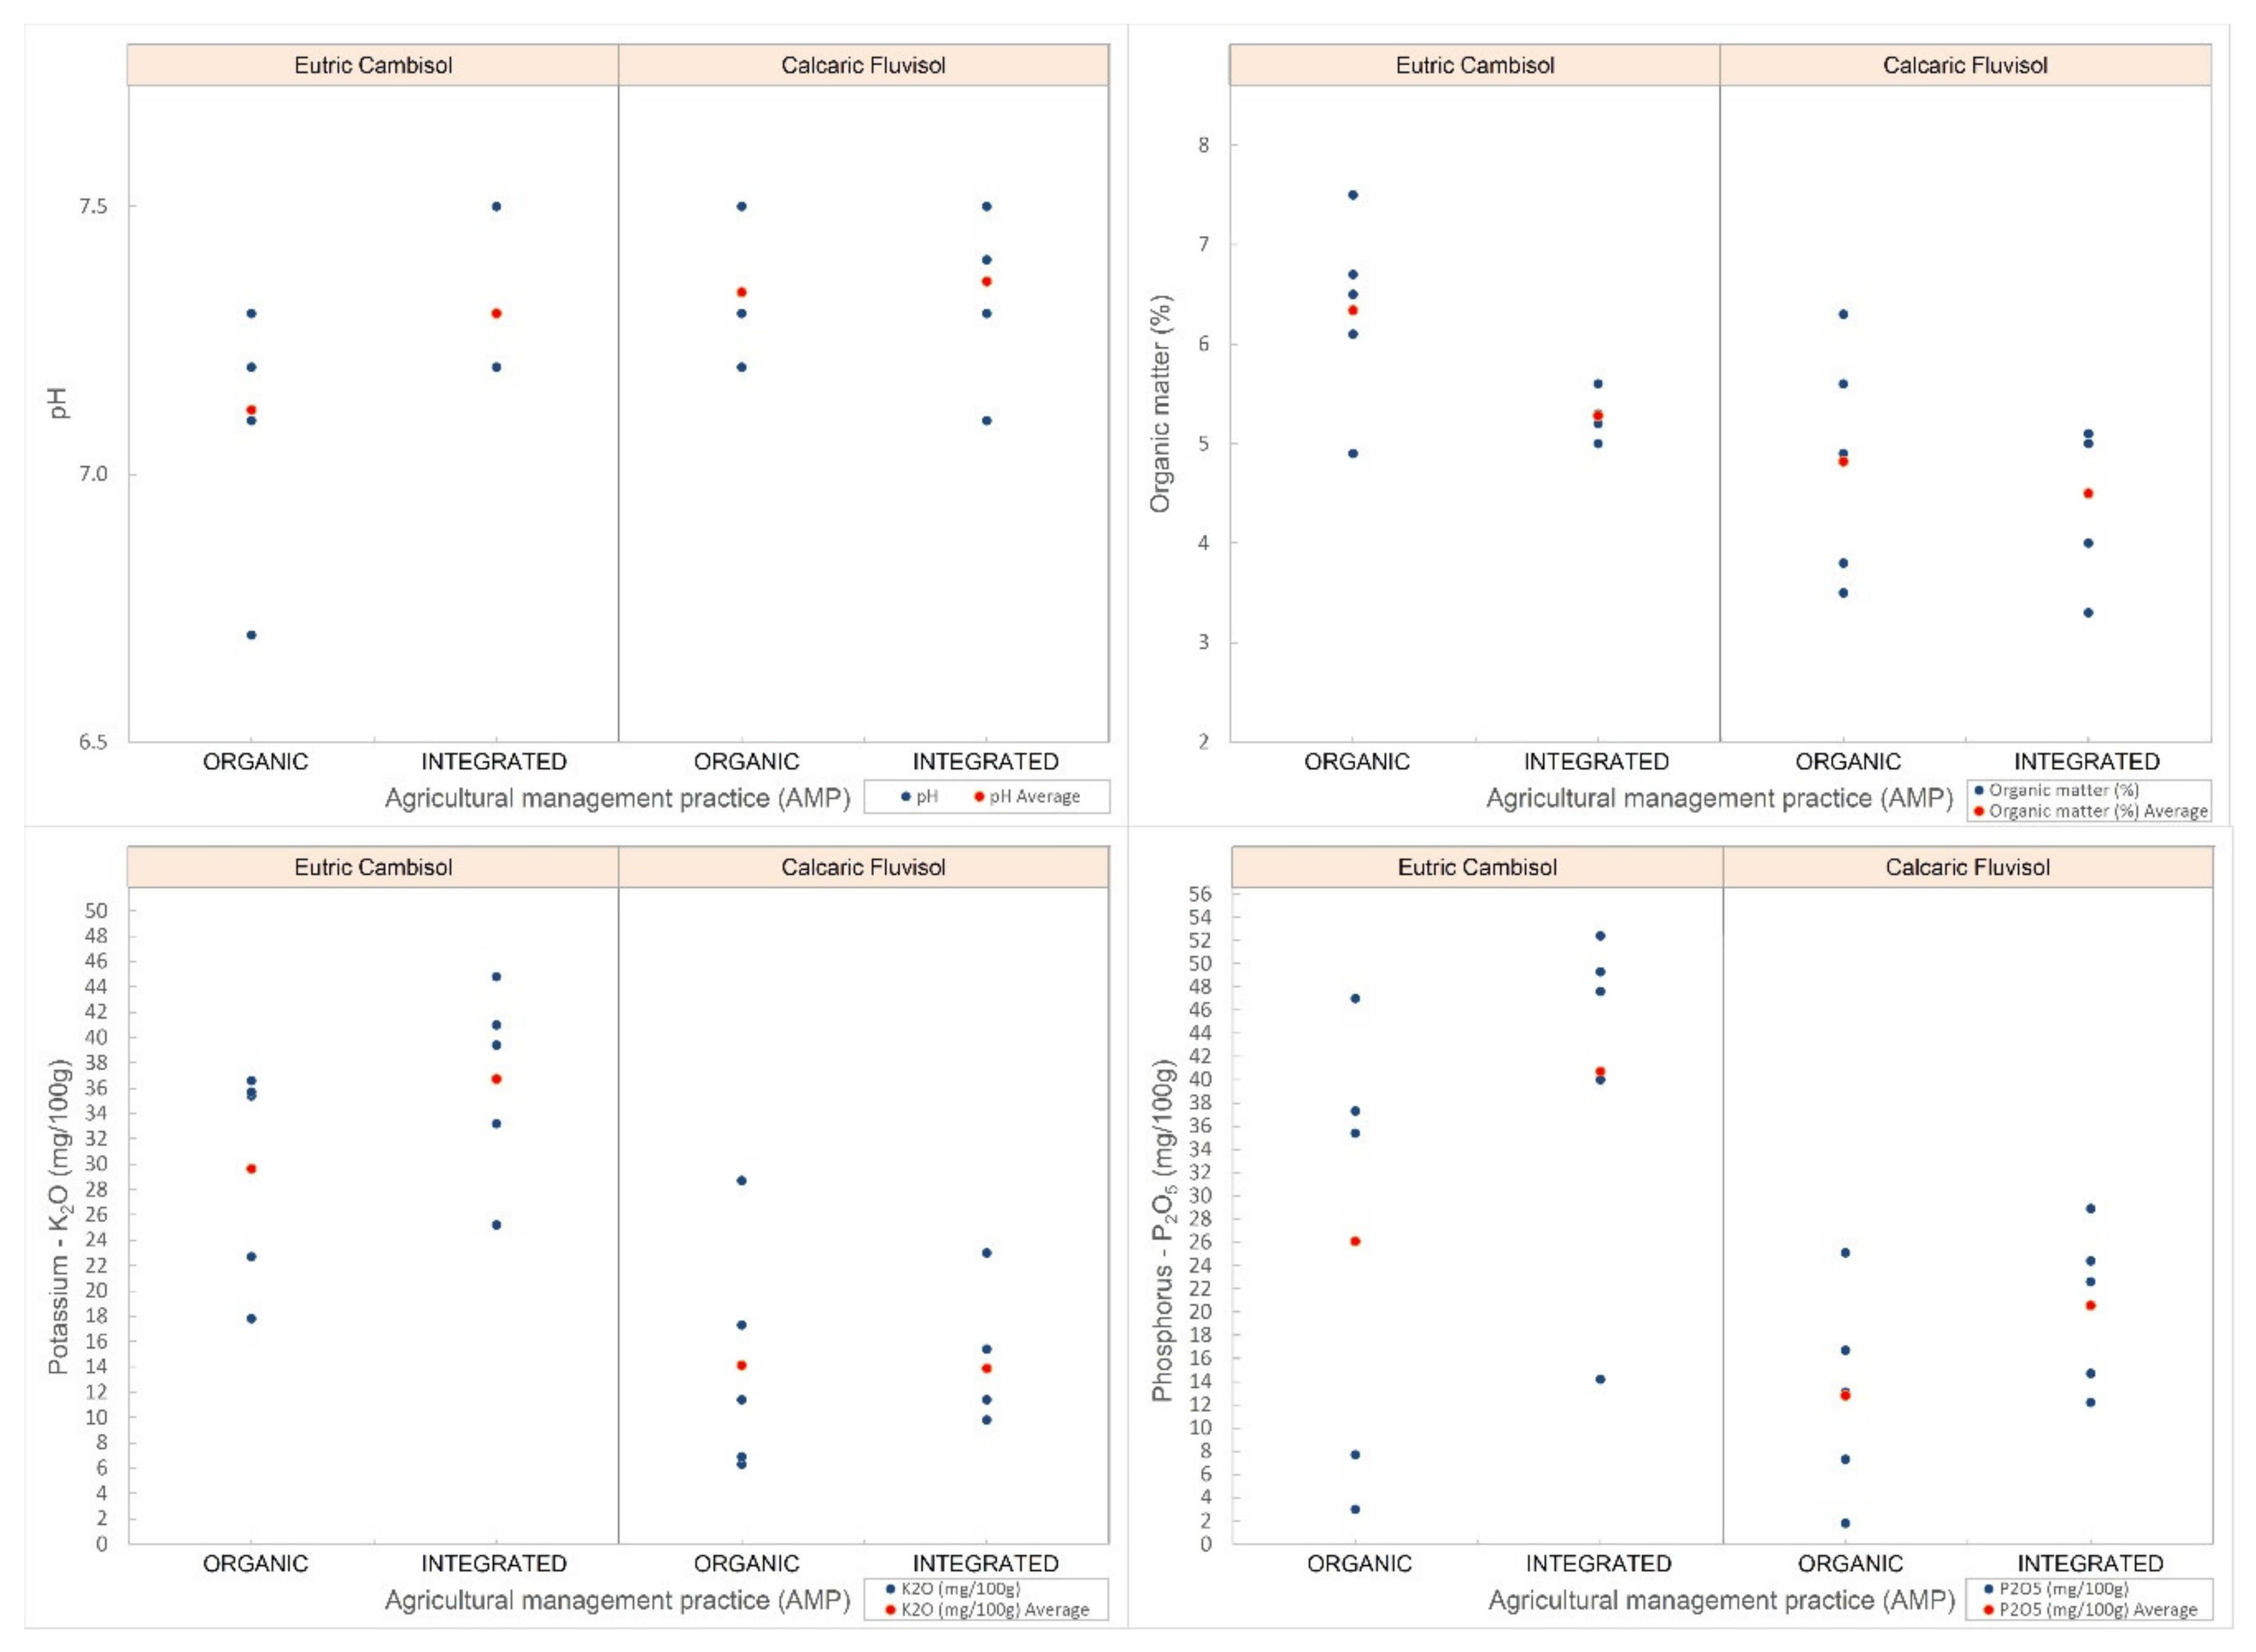
3.2.2. Chemical Soil Analysis

Figure 4 presents a comparison of the VSA points and laboratory-measured soil pH, organic matter, and plant-available potassium and phosphorus. Data are presented separately by soil type (Eutric Cambisol, red; Calcaric Fluvisol, blue) and agriculture management practice type (organic production, left; integrated production, right). The results show that, on average, closer to optimal results for pH (7), SOC (5%), K2O (20–30 mg/100 g soil), and P2O5 (13–25 mg/100 g soil) are results obtained for the more developed (soil genesis) Eutric Cambisol (red color) (Figure 4). This applies to both organic and integrated farming practices.
All of the average VSA soil quality indices results fall into the good soil quality category (Table 3). The comparison of soil chemical analysis and average VSA soil quality index points shows that, for Eutric Cambisol with organic farming (36.6 VSA points), we can expect a better result (+4.2 VSA points) than for Calcaric Fluvisol (32.4 VSA points) (Table 3). The difference between the agricultural practices relative to Calcaric Fluvisol is not significant (only 0.3 VSA points; 32.7 vs. 32.1). Good soil chemical analysis results have a minor positive impact on VSA points (R2 values) (Figure 4). Although the samples were small, we found a strong correlation between VSA and the pH (R2 = 0.63) and potassium (R2 = 0.63) in integrated production for Calcaric Fluvisol soil (Figure 4, Table 3).
There are two crucial differences between the two farms: the addition of composted farmyard manure (cow manure) and crop rotation with a higher proportion of legumes (alfalfa and clover) on the organic farm. While synthetic plant protection products are limited due to the water protection zone, matured manure within defined time frames is permitted. Results of this study show that Eutric Cambisol soil is highly susceptible to the addition of manure and a higher proportion of forage legumes, which enrich the soil organic matter and improve the soil structure [27]. The considerable responsiveness of Eutric Cambisol to manure is attributed to the higher clay fraction [28,29].
Figure 5 compares the agricultural practice and the measured pH, organic matter, potassium, and phosphorus values in the different soil types. Concerning the soil pH, it can be seen that the average pH of Calcaric Fluvisol is higher than that of Eutric Cambisol (Figure 5). This is mainly due to the higher content of crushed parent material (sand and coarse silt) of the lower (first) terrace, which contains high levels of free calcareous carbonates that increase the pH. Differences in the average pH between agricultural practices are visible for both soil types but are especially pronounced on more developed Eutric soils. The results show that higher pH (CaCl2) values are expected for Calcaric Fluvisol. Lower values are expected for Eutric Cambisol (closer to neutral), especially when composted farmyard manure is added to the soil. Manure contains nutrients (e.g., nitrogen) and other buffering agents (e.g., carbonates) in an inorganic and organic form, for which an overextended period contributes to buffering of the soil pH. At the same time, most of the mineral fertilizers have an acidifying effect [30].
The distribution of measured values shows that organic practice results in a higher organic matter content, regardless of the soil type (Figure 5). This difference mainly stems from the fact that an organic farm uses many organic fertilizers (cow manure, guano), while an integrated farm mostly uses mineral fertilizers. We conducted a one-way variance analysis of the soil organic matter content (SOM), taking into account the agricultural management practice and soil type. Both factors significantly influenced the SOM. The calculation employed can be found in the Supplementary Materials (Table S2).
The measured potassium and phosphorus values in Calcaric Fluvisol are mostly lower than those in Eutric Cambisol due to the higher content of CaCO3 (Figure 5). This implies that Eutric brown soils can retain the plant-available potassium and phosphorus due to their finer texture (more clay). We can argue that differences between the cultivation methods under the same soil type are minimal. The data reveal that the integrated farm uses mineral fertilizers, which is reflected in the higher average measured value of plant-available potassium and phosphorus in soil samples. Between agricultural practices, we did not observe a statistically significant difference (potassium p = 0.350; phosphorus, p = 0.086). On the other hand, we observed a significant statistical difference between soil types for both potassium (p = 5.95 × 10⁻⁵) and phosphorus (p = 0.0092). The results show that, on average, higher levels of plant-available potassium and phosphorus are expected in Eutric Cambisol (clayey texture) and integrated soil management (mineral fertilizers).

3.3. Evaluation of the VSA Process and Recommendation

At the beginning of this study, we faced defining soil quality and how to assess it. The literature review shows that the definition of soil quality is being supplemented and transformed over time. Simultaneously, the definition of soil quality indicators is also changing. It makes sense that the definition of soil quality includes the performance level of the desired functions and the ability to maintain the desired functions and level of performance [3,4,12]. It is crucial that, in addition to the definition, we create a model that can also display soil quality assessment and give us comparable results. The models must include quality indicators that show us the state of physical, biological, and chemical processes in the soil [10]. For soil quality assessment methods to be useful, they must be as time-, process-, and cost-effective as possible. The final soil quality assessment should also be adequately presented.
The soil quality assessment method used in this study [15] primarily focuses on identifying and monitoring soil production functions. The model used in evaluating soil quality indicators and calculating soil quality index points produces comparable results. Quality indicators of soil physical, biological, and chemical processes are included in the model [12]. The method of determining soil quality is cost-effective and supported with guide materials. To execute the soil quality assessment, one needs a shovel, plastic container, knife, plastic foil, water bottle, soil pH rapid test kit, instructions, and data entry tables.
Some authors have evaluated the practical applicability of different VSA methods and rated the Annual Crops Field Manual method [6,17,31,32] as slow (60 to 120 min/field measurement). In our case, the experiences gained and many assessments performed reduced the work time for each sampling field to half an hour, which is estimated to be rapid. The method described is often rated as too demanding for the average user to perform independently. Despite a good description of the soil quality indicator assessment presented in the manual, a user with limited knowledge may misinterpret the technical terminology. An individual assessor gives a subjective assessment, so the same assessor must assess all of the samples to be compared. Soil quality assessment is also affected by sampling time, so comparisons of samples must be made within the same period, often on the same day, due to rapid changes in soil properties related to weather conditions [3,10,31]. To improve the interpretation and understanding of the process, we suggest supplementing the field guide with a vocabulary of professional terms and expressions. The subject of discussion is also the supposedly low distinction in estimating soil quality indicator scores due to the narrow range of scores. This is solvable by the use of intermediate scores. It is important to note that the assessment of quality indicators with grades from 0 to 2 is only meaningful when used to calculate overall weighted soil quality index points. This method cannot be used to compare and interpret individual soil quality indicators.
In assessing soil quality indicators, we spent most of the time assessing soil texture and structure, which are essential indicators of soil quality for understanding soil processes and soil conditions. It is impossible to determine them indirectly by other indicators, so they should be the base indicators of each soil quality model [33].
Researchers have used a similar VSA model to investigate individual soil quality indicators’ different influences on assessment scores [32]. They concluded that the VSA results conditionally correlated with the measured results of chemical analyses by soil type and that soil quality indicators should be assessed differently for different soil types. The results of this study support the conclusion of the abovementioned study. They also found that some quality indicators were affected by soil moisture. This is closely correlated with our finding that soils with plant cover score higher VSA points. It is interesting to note that, in six of the seven assessments, farmers gave a similar assessment to soil scientists [32]. Other studies have found that, despite their broad potential, biological and biochemical indicators are under-represented [2,5].
The Annual Crops Field Guide VSA method should be further upgraded as a tool for detecting soil quality properties and their changes [15,16]. It would be reasonable to include a soil moisture indicator and diversify the assessment of different soil types [4,12,32]. For ease of understanding, it is essential to remember that soil threats, functions, and soil ecosystem services should be identified during soil quality assessment [2]. A proper database is needed to develop a tool for the ongoing monitoring of soil quality. The database needs to be as extensive as possible, containing data from completed soil quality indicator assessments determined by visual assessment and chemical analysis or other methods [5,10,33]. With the help of the shared database, the soil quality model could be calibrated. Individual soil quality indicators should be better weighted, and an improved description of the real situation in the sampling site (soil class, climate conditions, and altitude) should be sought. Simultaneously, the popularization of interactive tools and phone applications should be ensured to reach broad audiences, both professional and general [2].
The statistical analysis is an integral part of the results. Literature suggests that statistics with a more significant number of sample plots (repetitions) would return more accurate and reliable summary statistics in experimental work [34,35]. Although the literature does not offer any standard number of repetitions, professionals often suggest concentrating more on experimental design quality than quantity [12,36]. However, we were limited by the number of fields in possession of farmers. Furthermore, mastering such a large number of fields that have to be assessed by the same assessor over a given time frame and in stable weather conditions is labor-intensive and demanding. Additionally, the parcels should be in relative proximity and have similar soil properties.
We found that some of the indicators (earthworms, surface ponding, and erosion) were not adequately designed or weighted for our climate, soil type, and landscape conditions during the soil quality indicators’ evaluation process. The study assessed the quality of fertile soils not exposed to erosion, floods, or shallow groundwater. Therefore, we had soil quality indicators that were equally scored in all sampling fields. This is also one reason why we did not detect very significant differences in the VSA ranking. The main drawback in terms of the statistical analysis was the limited number of sampling fields. The selection of sampling fields was limited by the number of fields owned by the farmers. To assess the quality of the earthworm quality indicator, we slightly adjusted the evaluation criterion. We established that the criterion did not address the situation appropriately for our climate and soil type condition.

4. Conclusions

In this study, we thoroughly tested the VSA from the Annual Crops Field Guide developed by FAO. The study specifically focused on identifying differences between two different agricultural management practices (organic and integrated) for two texturally different soil types (Eutric Cambisol and Calcaric Fluvisol).
This study’s results are relevant to the scientific community as they highlight the importance of selecting soil quality indicators in the design of visual soil assessment (VSA) methods. Universal methods and easy-to-use tools are essential for developing the research field and spreading knowledge about soil quality among the general population. This study showed that the assessed score is highly dependent on the type of farming practice and how soils are managed. The soil type also plays an important role. The results for Calcaric Fluvisol showed that the effects of selected agricultural management practices on the visual assessment of soil quality could be almost undetectable. The time of assessment also plays a significant role in VSA scoring. Different crops and agricultural activities with significant impacts on the soil occur throughout the year (especially in vegetable production). It was observed that a higher score for the soil cover indicator had a beneficial effect on the total VSA rating.
The results show policymakers that agricultural policy should promote different agricultural soil management practices for specific soil types. It is also evident that the use of weathered farmyard manure has a positive impact on enhancing soil organic matter. The results are useful for planning agriculture–climate–environment measures within individual water protection zones and river basin management plans. The results show that farmers who farm similar soil types can adapt their techniques, processes, and type of fertilizer to optimize natural resources management while maintaining the optimal soil quality.
Future development should promote a model for determining soil quality that will better detect differences and processes among a wide variety of soil types. It would be beneficial for a utilitarian and user-friendly model to develop a worldwide database of derived soil assessment estimates. Such a model would enable farmers using a time series to compare the quality of their soil through time, under different crops or cultivation techniques, and provide a comparison and benchmark with other farmers in an area with a similar soil type. Finally, the model would permit farmers, extension services, and policymakers to understand better the soil functions and the importance of keeping soil in a good quality state.

Supplementary Materials

The following are available online at https://www.mdpi.com/2073-445X/10/1/8/s1: Figure S1: Presentation of typical crops grown on an organic farm; Figure S2: Presentation of typical crops grown on an integrated farm; Figure S3: Spade test of selected fields on an organic farm performed on 2 June 2020; Figure S4: Spade test of selected fields on an integrated farm performed on 2 June 2020; Table S1: Results of scores of visual indicators for visual soil assessment (VSA); Table S2: Analysis of variance for soil organic matter (SOM)—Type III Sums of Squares.

Author Contributions

Conceptualization, R.M., M.G., and J.P.; methodology, R.M., and M.G.; formal analysis, J.P.; investigation, J.P.; resources, M.G.; data curation, J.P.; writing—original draft preparation, R.M., and J.P.; writing—review and editing, M.G.; visualization, J.P.; supervision, M.G.; project administration, M.G.; funding acquisition, M.P. All authors have read and agreed to the published version of the manuscript.

Funding

The European Union funded this research under the Horizon-2020 Programme grant agreement No. 635750 (iSQAPER project, http://www.isqaper-project.eu/).

Data Availability Statement

The data presented in this study are available in supplementary material of this article.

Acknowledgments

We would like to thank farmers Anton and Filip Čemažar, and Pavel Zatler from Kleče, Ljubljana, Slovenia, who allowed us to perform the research on their fields.

Conflicts of Interest

The authors declare no conflict of interest. The funders had no role in the study’s design; in the collection, analyses, or interpretation of data; in the writing of the manuscript; or in the decision to publish the results.

References

  1. Doran, J.W.; Parkin, T.B. Quantitative Indicators of Soil Quality: A Minimum Data Set. In Methods for Assessing Soil Quality; Doran, J.W., Ed.; Soil Science Society of America: Minneapolis, MN, USA, 2015; pp. 25–37. [Google Scholar]
  2. Bünemann, E.K.; Bongiorno, G.; Bai, Z.; Creamer, R.E.; De Deyn, G.; de Goede, R.; Fleskens, L.; Geissen, V.; Kuyper, T.W.; Mäder, P.; et al. Soil quality—A critical review. Soil Biol. Biochem. 2018, 120, 105–125. [Google Scholar] [CrossRef]
  3. Santos-Francés, F.; Martínez-Graña, A.; Ávila-Zarza, C.; Criado, M.; Sánchez, Y. Comparison of methods for evaluating soil quality of semiarid ecosystem and evaluation of the effects of physico-chemical properties and factor soil erodibility (Northern Plateau, Spain). Geoderma 2019, 354, 113872. [Google Scholar] [CrossRef]
  4. Juhos, K.; Czigány, S.; Madarász, B.; Ladányi, M. Interpretation of soil quality indicators for land suitability assessment—A multivariate approach for Central European arable soils. Ecol. Indic. 2019, 99, 261–272. [Google Scholar] [CrossRef]
  5. Bakhshandeh, E.; Francaviglia, R.; Renzi, G. A cost and time-effective method to evaluate soil microbial respiration for soil quality assessment. Appl. Soil Ecol. 2019, 140, 121–125. [Google Scholar] [CrossRef]
  6. De Laurentiis, V.; Secchi, M.; Bos, U.; Horn, R.; Laurent, A.; Sala, S. Soil quality index: Exploring options for a comprehensive assessment of land use impacts in LCA. J. Clean Prod. 2019, 215, 63–74. [Google Scholar] [CrossRef] [PubMed]
  7. Fan, Z.; Wills, S.A.; Herrick, J.E.; Nauman, T.W.; Brungard, C.W.; Beaudette, D.E.; Levi, M.R.; O’Geen, A.T. Approaches for Improving Field Soil Identification. Soil Sci. Soc. Am. J. Soil 2018, 82, 871–877. [Google Scholar] [CrossRef]
  8. Bai, Z.; Caspari, T.; Gonzalez, M.R.; Batjes, N.H.; Mäder, P.; Bünemann, E.K.; de Goede, R.; Brussaard, L.; Xu, M.; Ferreira, C.S.S.; et al. Effects of agricultural management practices on soil quality: A review of long-term experiments for Europe and China. Agric. Ecosyst. Environ. 2018, 265, 1–7. [Google Scholar] [CrossRef]
  9. Debeljak, M.; Trajanov, A.; Kuzmanovski, V.; Schröder, J.; Sandén, T.; Spiegel, H.; Wall, D.P.; Van de Broek, M.; Rutgers, M.; Bampa, F.; et al. A Field-Scale Decision Support System for Assessment and Management of Soil Functions. Front. Environ. Sci. 2019, 7, 115. [Google Scholar] [CrossRef] [Green Version]
  10. Valani, G.P.; Vezzani, F.M.; Cavalieri-Polizeli, K.M.V. Soil quality: Evaluation of on-farm assessments in relation to analytical index. Soil Tillage Res. 2020, 198, 104565. [Google Scholar] [CrossRef]
  11. Lal, R. Restoring Soil Quality to Mitigate Soil Degradation. Sustainability 2015, 7, 5875–5895. [Google Scholar] [CrossRef] [Green Version]
  12. Alaoui, A.; Barão, L.; Ferreira, C.S.S.; Schwilch, G.; Basch, G.; Garcia-Orenes, F.; Morugan, A.; Mataix-Solera, J.; Kosmas, C.; Glavan, M.; et al. Visual Assessment of the Impact of Agricultural Management Practices on Soil Quality. Agron. J. 2020. [Google Scholar] [CrossRef]
  13. Bogunovič, I.; Fernández, M.P.; Kisic, I.; Marimón, M.B. Chapter Two—Agriculture and grazing environments. In Advances in Chemical Pollution, Environmental Management and Protection; Pereira, P., Ed.; Elsevier: Amsterdam, The Netherlands, 2019; Volume 4, pp. 23–70. [Google Scholar]
  14. Lasanta, T.; Arnáez, J.; Nadal-Romero, E. Chapter Three—Soil degradation, restoration and management in abandoned and afforested lands. In Advances in Chemical Pollution, Environmental Management and Protection; Pereira, P., Ed.; Elsevier: Amsterdam, The Netherlands, 2019; Volume 4, pp. 71–117. [Google Scholar]
  15. Shepherd, T.G.; Stagnari, F.; Pisante, M.; Benites, J. Annual Crops. Visual Soil Assessment—Field Guides. Available online: http://www.fao.org/3/i0007e/i0007e00.htm (accessed on 10 September 2019).
  16. Ball, B.C.; Guimarães, R.M.L.; Cloy, J.M.; Hargreaves, P.R.; Shepherd, T.G.; McKenzie, B.M. Visual soil evaluation: A summary of some applications and potential developments for agriculture. Soil Tillage Res. 2017, 173, 114–124. [Google Scholar] [CrossRef]
  17. Mueller, L.; Kay, B.D.; Hu, C.; Li, Y.; Schindler, U.; Behrendt, A.; Shepherd, T.G.; Ball, B.C. Visual assessment of soil structure: Evaluation of methodologies on sites in Canada, China and Germany: Part I: Comparing visual methods and linking them with soil physical data and grain yield of cereals. Soil Tillage Res. 2009, 103, 178–187. [Google Scholar] [CrossRef]
  18. Mueller, L.; Kay, B.D.; Deen, B.; Hu, C.; Zhang, Y.; Wolff, M.; Eulenstein, F.; Schindler, U. Visual assessment of soil structure: Part II. Implications of tillage, rotation and traffic on sites in Canada, China and Germany. Soil Tillage Res. 2009, 103, 188–196. [Google Scholar] [CrossRef]
  19. Decree on the Water Protection Area for the Ljubljansko Polje Aquifer. Official Gazette of the RS, No. 43/15. Available online: http://www.pisrs.si/Pis.web/pregledPredpisa?id=URED7006 (accessed on 10 September 2019).
  20. Egner, H.; Riehm, H.; Domingo, W.R. Untersuchungen über die chemische Bodenanalyse als Grundlage für die Beurteilung des Nahrstoffzustandes der Boden, II: Chemische Extractionsmetoden zu Phosphorund Kaliumbestimmung. Kungliga Lantbrukshügskolans Annaler 1960, 26, 199–215. [Google Scholar]
  21. ONORM L 1087: Chemical Analysis of Soils—Determination of “Plant Available” Phosphorus and Potassium by the Calcium-Acetate Lactate (CAL)-Method. 2012. Available online: https://infostore.saiglobal.com/en-us/standards/onorm-l-1087-2012-899966_saig_on_on_2132488/ (accessed on 10 September 2019).
  22. Nelson, D.W.; Sommers, L.E. Total carbon, organic carbon and organic matter. In Methods of Soil Analysis: Part 2. Chemical and Microbiological Properties; ASA Monograph Number 9; Page, A.L., Miller, R.H., Keeney, D.R., Eds.; Soil Science Society of America, Inc.: Fitchburg, WI, USA, 1982; pp. 539–579. [Google Scholar]
  23. ISO. ISO 10390: Soil Quality—Determination of pH; ISO: Geneve, Switzerland, 2006; Available online: https://www.iso.org/standard/40879.html (accessed on 10 September 2019).
  24. Le Bissonnais, Y. Aggregate stability and assessment of soil crustability and erodibility: I. Theory and methodology. Eur. J. Soil Sci. 1996, 47, 425–437. [Google Scholar] [CrossRef]
  25. VDLUFA Humusbilanzierung. Eine Methode zur Analyse und Bewertung der Humusversorgung von Ackerland; Eigenverlag Verband Deutscher Landwirtschaftlicher Untersuchungs- und Forschungsanstalten/Association of German Agricultural Analytic and Research Institutes (VDLUFA): Speyer, Germany, 2004. [Google Scholar]
  26. Hassink, J. The capacity of soils to preserve organic C and N by their association with clay and silt particles. Plant Soil 1997, 191, 77–87. [Google Scholar] [CrossRef]
  27. Zhang, W.; Wang, Q.; Wu, Q.; Zhang, S.; Zhu, P.; Peng, C.; Huang, S.; Wang, B.; Zhang, H. The response of soil Olsen-P to the P budgets of three typical cropland soil types under long-term fertilization. PLoS ONE 2020, 15, e0230178. [Google Scholar] [CrossRef] [Green Version]
  28. Maltas, A.; Kebli, H.; Oberholzer, H.R.; Weisskopf, P.; Sinaj, S. The effects of organic and mineral fertilizers on carbon sequestration, soil properties, and crop yields from a long-term field experiment under a Swiss conventional farming system. Land Degrad. Dev. 2018, 29, 926–938. [Google Scholar] [CrossRef]
  29. Parmar, D.K.; Thakur, D.R.; Jamwal, R.S. Effect of long term organic manure application on soil properties, carbon sequestration, soil-Plant carbon stock and productivity under two vegetable production systems in Himachal Pradesh. J. Environ. Biol. 2016, 37, 333–339. [Google Scholar]
  30. Faissal, A.; Ouazzani, N.; Parrado, J.R.; Dary, M.; Manyani, H.; Morgado, B.R.; Barragán, M.D.; Mandi, L. Impact of fertilization by natural manure on the microbial quality of soil: Molecular approach. Saudi J. Biol. Sci. 2017, 24, 1437–1443. [Google Scholar] [CrossRef] [PubMed]
  31. Lončar, J.; Suhadolc, M.; Mihelič, R. Terenska Ocena Kakovosti tal glede na Intenziteto Obdelave tal/Soil Quality Field Assessment Relating to Tillage Intensity; University of Ljubljana: Ljubljana, Slovenia, 2018. [Google Scholar]
  32. Van Leeuwen, M.M.W.J.; Heuvelink, G.B.M.; Wallinga, J.; de Boer, I.J.M.; van Dam, J.C.; van Essen, E.A.; Moolenaar, S.W.; Verhoeven, F.P.M.; Stoorvogel, J.J.; Stoof, C.R. Visual soil evaluation: Reproducibility and correlation with standard measurements. Soil Tillage Res. 2018, 178, 167–178. [Google Scholar] [CrossRef]
  33. Guimarães, R.M.L.; Lamandé, M.; Munkholm, L.J.; Ball, B.C.; Keller, T. Opportunities and future directions for visual soil evaluation methods in soil structure research. Soil Tillage Res. 2017, 173, 104–113. [Google Scholar] [CrossRef]
  34. Casler, M.D. Fundamentals of Experimental Design: Guidelines for Designing Successful Experiments. Agron. J. 2015, 107, 692–705. [Google Scholar] [CrossRef] [Green Version]
  35. Campbell, K.G.; Thompson, Y.M.; Guy, S.O.; McIntosh, M.; Glaz, B. “Is, or is not, the two great ends of Fate”: Errors in Agronomic Research. Agron. J. 2015, 107, 718–729. [Google Scholar] [CrossRef] [Green Version]
  36. Blainey, P.; Krzywinski, M.; Altman, N. Replication. Nat. Methods 2014, 11, 879–880. [Google Scholar] [CrossRef]
Figure 1. Research area with experimental fields under organic (blue colored fields) or integrated management (purple colored fields) in the subalpine river Sava alluvial plain in central Slovenia (data source: Ministry for Agriculture, Forestry and Food, Slovenia).
Land 10 00008 g001
Figure 2. The visual soil assessment (VSA) soil quality index points by individual experimental fields and assessment time.
Land 10 00008 g002
Figure 3. Graphic presentation of the VSA points concerning the agricultural management practice type for different soil types (red dots represent the blue dots’ mean). The box plot shows the visual soil assessment score (VSA) means by management system (organic (ORG) or integrated (INT)), or by soil type. The differences for management are significant at the 95% confidence level, tested by Tukey’s honestly significant difference (HSD) procedure (ANOVA).
Land 10 00008 g003
Figure 4. Relationship between the measured soil pH, soil organic matter (%), potassium (K2O), phosphorus (P2O5), and VSA points of sampled fields in terms of the agricultural management practice type and soil type.
Land 10 00008 g004
Figure 5. Graphic presentation of the measured soil pH (CaCl2), organic matter, potassium (K2O), and phosphorus (P2O5) of sampled fields concerning the agricultural management practice type and soil type (red dots represent the mean of the blue dots).
Land 10 00008 g005
Table 1. List of visual indicators for the visual soil assessment (VSA) of soil quality in annual crops [15].
Visual Indicators of Soil QualityVisual Scores (VS) **WeightingVS Ranking
(Points)
Soil texture0–2x30–6
xSoil structure0–2x20–4
Soil porosity0–2x30–6
Soil color0–2x30–6
Anaerobic state of soil
(number and color of soil mottles)
0–2x20–4
Earthworms (number, size)0–2x30–6
Potential rooting depth (m)0–2x30–6
Surface ponding0–2x10⁻²
Surface crusting and surface cover0–2x20–4
Soil erosion (wind/water)0–2x20–4
VSA soil quality index (sum of VS ranking) *0–48
* VSA soil quality index: <15 = poor soil quality assessment; 15–30 = moderate soil quality assessment; >30 = good soil quality assessment; max sum of of VS ranking = 48 points; ** 0 = poor condition, 1 = moderate condition, 2 = good condition.
Table 2. Results of visual indicator scores for visual soil assessment (VSA) as an average weighted score and sum of scores of all assessments for organic and integrated farms and Eutric Cambisol and Calcaric Fluvisol in the year 2017.
Visual Indicators of Soil Quality
(Score Range) *
Visual Scores (Average Weighted per)
Organic FarmIntegrated FarmECCFTotal Scores
ECCFAvg.ECCFAvg.
Soil texture (0-3-6)5.43.64.55.05.05.05.24.34.7
Soil structure (0-2-4)3.63.63.62.02.82.42.83.23.0
Soil porosity (0-3-6)5.84.65.25.85.65.75.85.15.5
Soil color (0-3-6)4.84.84.84.84.24.54.84.54.7
Anaerobic state of soil (0-2-4)4.04.04.04.04.04.04.04.04.0
Earthworms (0-3-6)1.81.31.60.90.80.81.41.11.2
Potential rooting depth (0-3-6)1.51.51.51.51.51.51.51.51.5
Surface ponding
(0-2-4)
2.02.02.02.02.02.02.02.02.0
Surface crusting and surface cover (0-2-4)3.52.83.12.53.12.83.02.93.0
Soil erosion (0-2-4)4.04.04.04.04.04.04.04.04.0
SUM of scores
(Soil quality index)
36.432.234.332.533.032.834.432.633.5
* Weighted visual scores range (VS): poor conditions–moderate conditions–good condition; Weighting of visual indicators presented in Table 1: EC, Eutric Cambisol; CF, Calcaric Fluvisol; VSA soil quality index, <15 = poor soil quality assessment; 15–30 = moderate soil quality assessment; >30 = good soil quality assessment; maximum = 48 points.
Table 3. Visual soil assessment (soil quality index) points per field for sampling date 2 June 2017, 25 July 2017, and 9 September 2017, and chemical soil analysis of plant-available potassium (K2O) and phosphorus (P2O5), pH, and organic matter (%) sampled after harvesting outside of the growing period (4 January 2018).
AMP *Soil TypeSampling FieldVisual Soil Assessment (VSA) PointsChemical Soil Analysis
VSA 1VSA 2VSA 3AverageK2O (mg/100 g)P2O5 (mg/100 g)Soil Organic Matter (SOC %)pH (CaCl2)
OrganicEutric Cambisol138.532.534.035.017.83.04.96.7
234.534.534.534.536.647.07.57.1
332.535.538.535.535.435.46.57.3
439.033.539.537.335.737.36.77.3
539.039.043.540.522.77.76.17.2
Average36.735.038.036.629.626.16.37.1
Calcaric Fluvisol636.034.537.536.011.41.84.97.2
737.034.038.536.528.725.16.37.3
829.527.529.028.717.313.15.67.2
934.529.027.530.36.316.73.57.5
1028.029.534.030.56.97.33.87.5
Average33.030.933.332.414.112.84.87.3
Average34.933.035.734.521.919.45.67.2
IntegratedEutric Cambisol1135.529.538.534.541.049.35.67.5
1234.534.534.534.533.240.05.37.2
1330.532.529.530.839.447.65.27.2
1432.534.032.533.044.852.45.07.3
1527.527.527.527.525.214.25.37.3
Average32.131.632.532.136.740.75.37.3
Calcaric Fluvisol1632.034.543.536.715.414.75.17.1
1735.535.535.535.523.028.95.17.3
1825.530.530.528.89.812.25.07.4
1928.532.532.531.29.822.63.37.5
2027.532.534.031.311.424.44.07.5
Average29.833.135.232.713.920.64.57.4
Average31.032.433.932.425.330.64.97.3
Average Eutric Cambisol34.433.335.334.333.233.45.87.2
Average Calcaric Fluvisol31.432.034.332.614.016.74.77.4
Average Total32.932.734.833.423.625.05.27.3
* AMP, agricultural management practice; VSA points, minimum 0–maximum 48; VSA 1, assessment on 2 June 2017; VSA 2, assessment on 25 July 2017; VSA 3, assessment on 9 September 2017.
Publisher’s Note: MDPI stays neutral with regard to jurisdictional claims in published maps and institutional affiliations.

