Article

Winter Irrigation Effects in Cotton Fields in Arid Inland Irrigated Areas in the North of the Tarim Basin, China

1
College of Hydraulic and Civil Engineering, Xinjiang Agricultural University, Urumqi 830052, China
2
Institute of Agricultural Engineering, Tropics and Subtropics Group, Universität Hohenheim, Garbenstraße 9, Stuttgart 70593, Germany
3
State Key Laboratory of Desert and Oasis Ecology, Xinjiang Institute of Ecology and Geography, Chinese Academy of Sciences, Urumqi 830000, China
*
Author to whom correspondence should be addressed.
Water 2016, 8(2), 47; https://doi.org/10.3390/w8020047
Submission received: 24 November 2015 / Accepted: 21 January 2016 / Published: 2 February 2016
(This article belongs to the Special Issue Water Resources Assessment and Management in Drylands)

Abstract

:
Winter irrigation is one of the water and salt management practices widely adopted in arid irrigated areas in the Tarim Basin located in the Xinjiang Uygur Autonomous Region in the People’s Republic of China. A winter irrigation study was carried out from November 2013 to March 2014 in Korla City. A cotton field was divided into 18 plots with a size of 3 m × 3 m and five winter irrigation treatments (1200 m3/ha, 1800 m3/ha, 2400 m3/ha, 3000 m3/ha, and 3600 m3/ha) and one non-irrigation as a control were designed. The results showed that the higher winter irrigation volumes allowed the significant short-term difference after the irrigation in the fields with the higher soil moisture content. Therefore, the soil moisture in the next sowing season could be maintained at the level which was slightly lower than field capacity and four times that in the non-irrigation treatment. The desalination effect of winter irrigation increased with the increase of water irrigation volume, but its efficiency decreased with the increase of water irrigation volume. The desalination effect was characterized by short-term desalination, long-term salt accumulation, and the time-dependent gradually decreasing trend. During the winter irrigation period, air temperature was the most important external influencing factor of the soil temperature. During the period of the decrease in winter temperatures from December to January, soil temperature in the 5-cm depth showed no significant difference in all the treatments and the control. However, during the period of rising temperatures from January to March, soil temperature in the control increased significantly, faster than that in all treatments. Under the same irrigation volume, the temperature difference between the upper soil layer and the lower soil layer increased during the temperature drop period and decreased during the temperature rise period. In this paper, we proposed the proper winter irrigation volume of 1800–3000 m3/ha and suggested that the irrigation timing should be delayed to early December or performed in several stages in the fields with the drainage system. Under the current strict water management and fixed water supply quota situation, the methods are of great practical significance.

1. Introduction

Cotton is one of the most important economic crops in Xinjiang Uygur Autonomous Region, China. The average annual planting area of cotton in Xinjiang is 1,564,000 ha, accounting for nearly 1/3 of total crop area in Xinjiang. The cotton production in Xinjiang ranks first in China and accounts for 10% of global cotton production [1]. The cotton planting mode commonly used is winter or spring irrigation plus drip irrigation under plastic mulch. Under this cropping pattern, drip irrigation ensures the crop water requirement which can leach the salinity of the root zone. However, due to the lesser water quantity in drip irrigation, salinity mainly accumulates at the edge of the wet zone, thus reducing the rate of emergence in the coming year. To solve this problem, flood irrigation is applied to leach salt from October to November every year. Flood irrigation is now considered as the pre-requisite for a high yield, and it is generally believed that winter irrigation has more beneficial impacts. For example, it leaches the salts from the plant root zone, and stores winter water for spring. Flood irrigation in winter, namely winter irrigation, is often considered as the “improvement irrigation”, which can improve cotton sprouting rate and survival rate. Regular winter irrigation volume is generally between 3000 and 4500 m3/ha and accounts for 75% of cotton water consumption [2]. It leads to a situation of efficient water utilization in the development stage and inefficient water utilization in the non-development stage. Under the current strict water management and fixed water supply quota situation, it is necessary to improve the inefficient water utilization in winter irrigation.
Since the 1950s, winter irrigation has been widely applied in cotton, wheat, and fruit trees in Xinjiang and has become one of the routine measures of water management and soil improvement. Chen et al. [3] studied the impacts of different winter irrigation modes of cotton fields in northern Xinjiang on soil moisture content, soil salinity, and temperature distribution. They concluded that both drip irrigation of high discharge rate and flood irrigation could reduce salinity. Moreover, drip irrigation of 3000 m3/ha was more beneficial to moisture retention and desalination. Sun et al. [4] analyzed the effects of winter irrigation on salt transport and proposed that winter irrigation of the larger quota allowed the better salt leaching effect. However, at the same time, the high water volume applied during winter irrigation may increase the soil pH and the concentration of HCO3, thus causing the rise of underground water level and accelerating salt return. Therefore, Sun recommended the winter irrigation volume of 3500 m3/ha. Feng Cao et al. [5] studied the effects of leaching salts and alkali reduction of different irrigation modes in No. 30 Regiment, Xinjiang Agricultural Reclamation No. 2 Division and proposed that winter irrigation allowed the higher sprouting rate and yield than spring irrigation.
The above results were mainly focused on the winter irrigation volume, which was relatively high. Moreover, the transport mechanisms of water and salt under freeze-thaw conditions were explored. Guisheng Fan et al. [6] carried out moisture infiltration tests of naturally frozen soil in the fields with different groundwater depths under the freeze-thaw conditions and analyzed the influence of groundwater depth on soil moisture infiltration capability and relatively stable infiltration rate. Similarly, Jihong Jing et al. [7] conducted water transport tests in the fields with artificially controlled groundwater at various depths on the plain in the northern foot of the Tianshan Mountains. Jing found that soil water transport towards the frozen layer led to groundwater evaporation and resulted in the decline in the groundwater level.
With the increase in the drip irrigation planting years of cotton under film covering in Xinjiang, the groundwater level declined and the mode and intensity of salt accumulation in fields began to differ from those formed under the ditch irrigation mode. As the area under plastic mulch drip irrigation increases in Xinjiang, the irrigation method of groundwater resulted in the decline in the groundwater level. The traditional flood irrigation requires a large amount of water and will be restricted by limited resources. Therefore, the water-saving irrigation schedule and the management of salt has become a hot issue in the cotton fields. In order to save water resources, leach salts, reduce alkali and improve farmland soil environment without increasing the pressure on the ecological environment, it is necessary to further study winter irrigation effects and applicability in cotton fields. The paper not only aims to find suitable irrigation time and water quantity of winter irrigation but to provide experimental evidence for farmers to change traditional irrigation methods gradually.

2. Materials and Methods
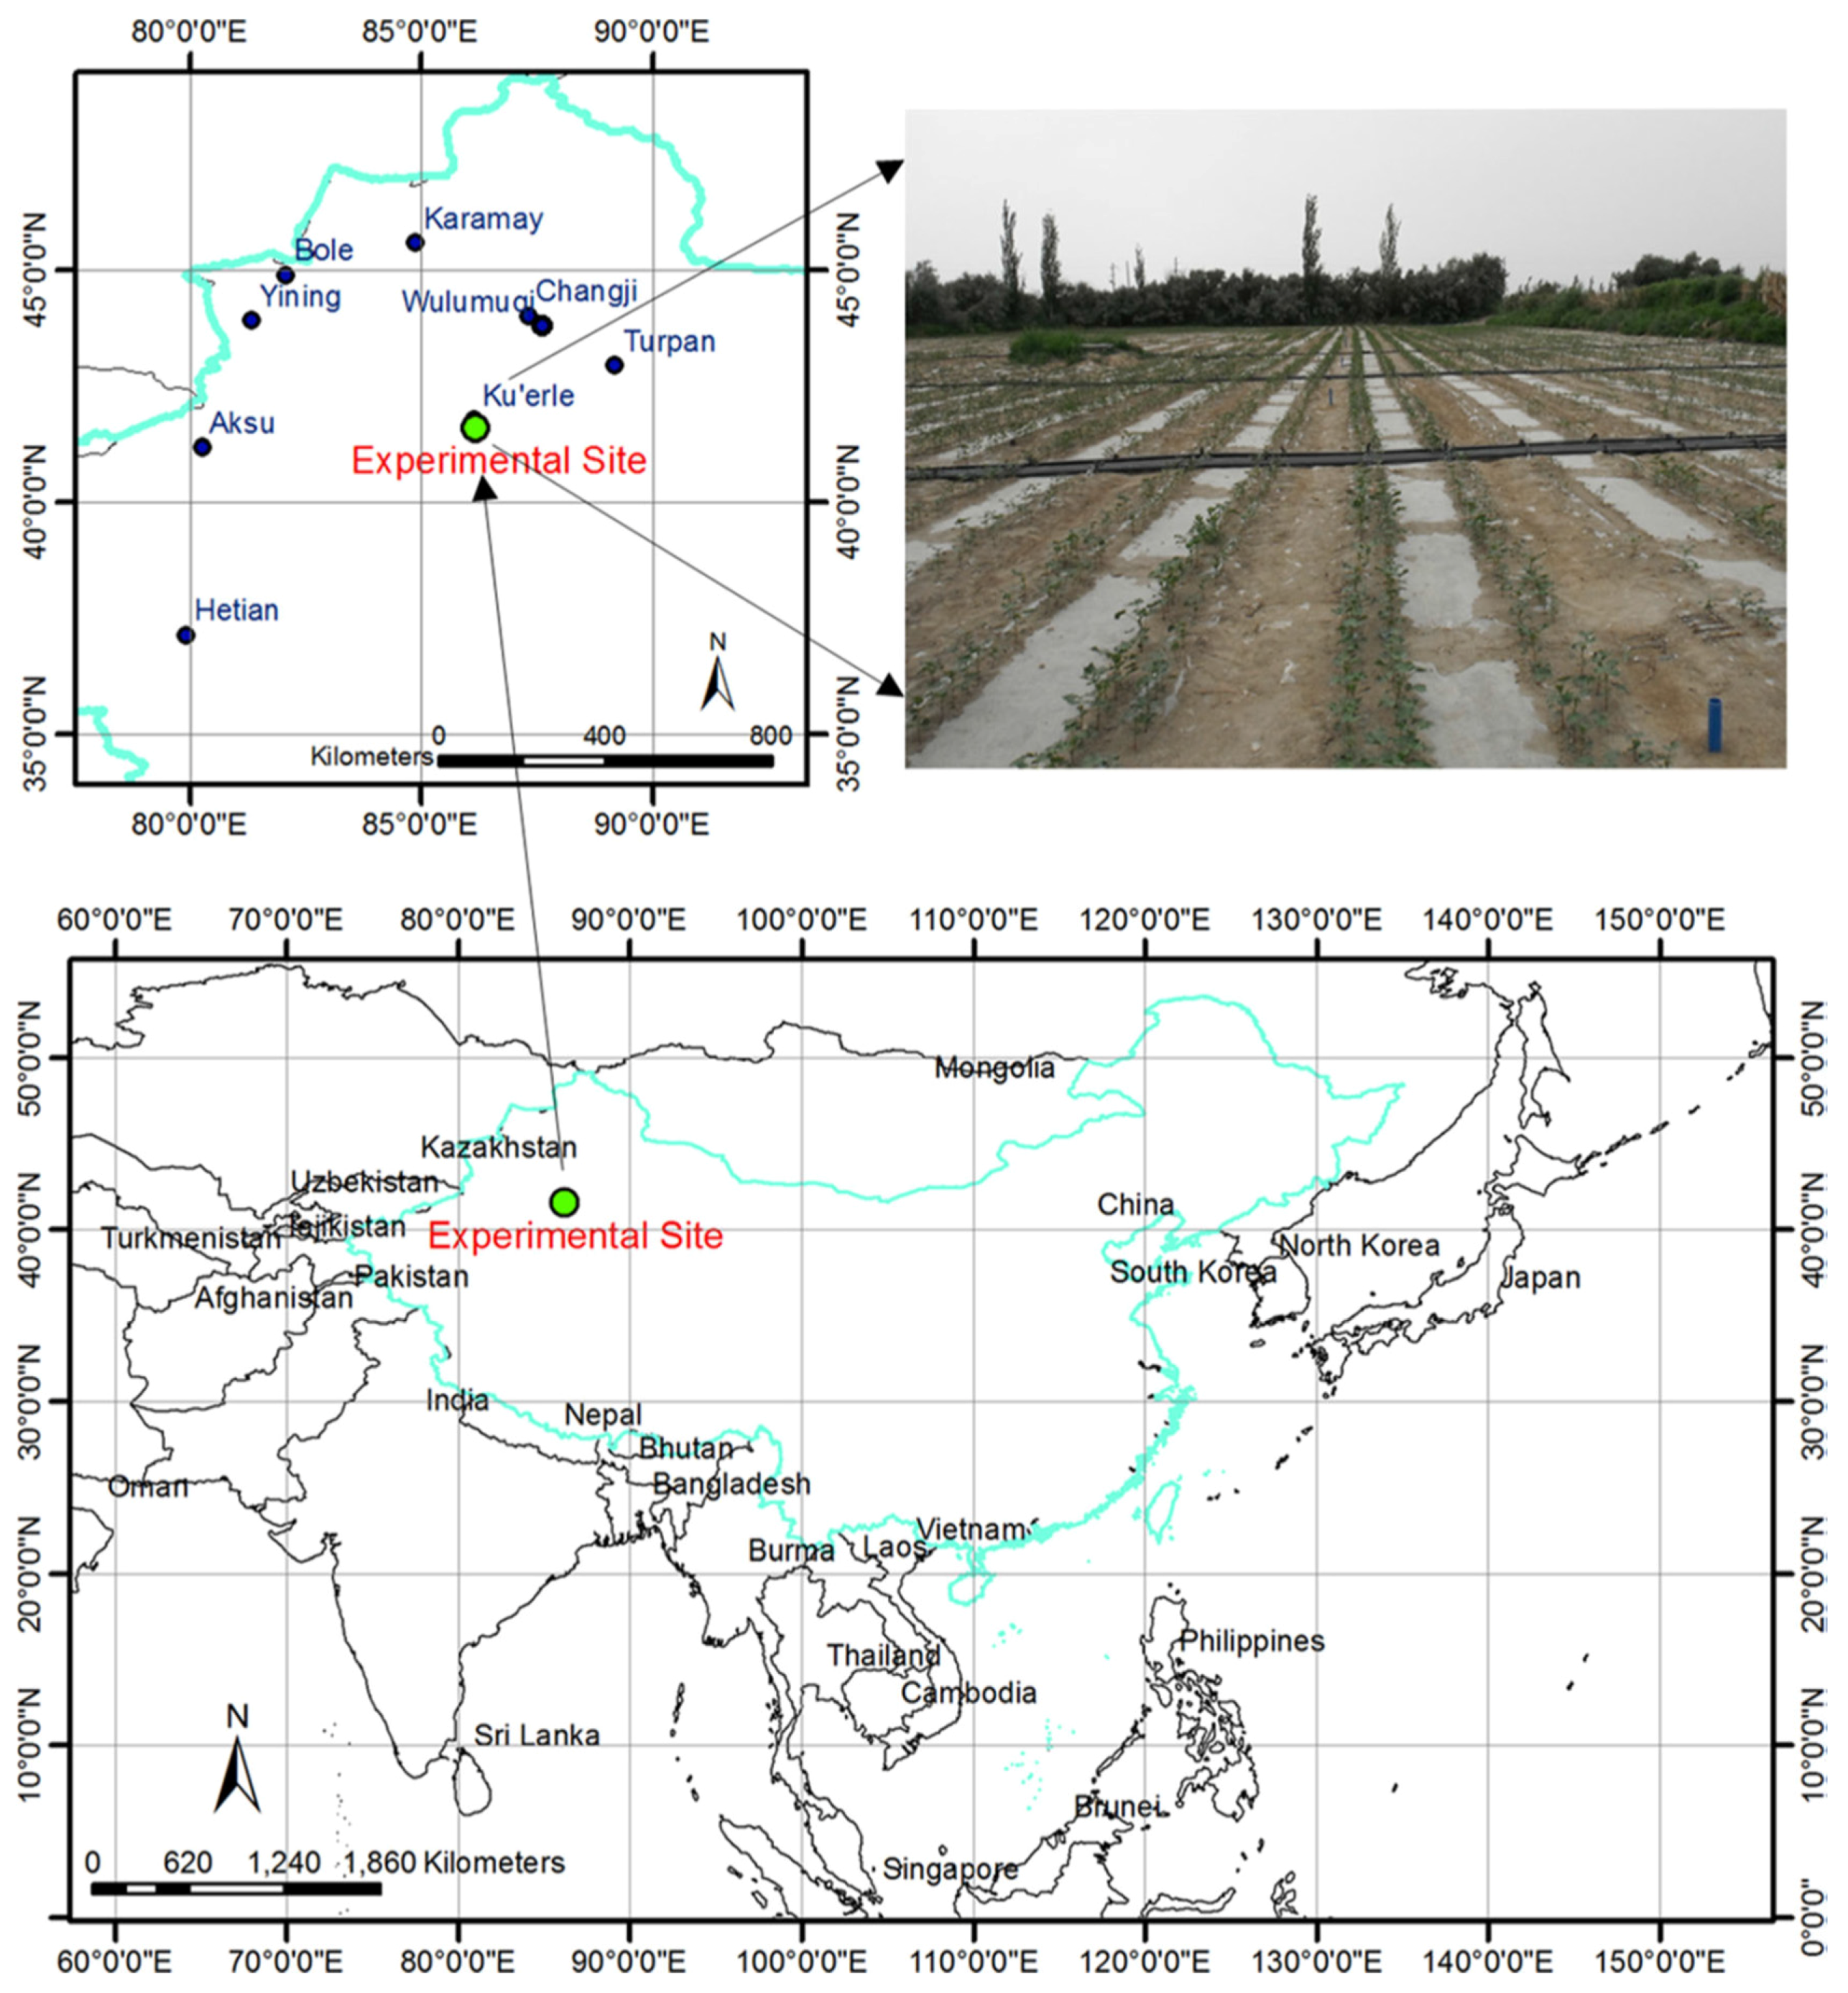
2.1. Study Area

The study area is Korla Irrigation Experiment Station which belongs to the Xinjiang Agricultural University located in Xi’ni’er Town of Korla City (Figure 1). Its geographic coordinates are 41°35′ N–41°37′ N and 86°09′ E–86°12′ E. The study area is characterized by arid conditions, less precipitation, and large temperature differences. Average annual precipitation is 53.3–62.7 mm and average annual evaporation is 2273–2788 mm (obtained with the evaporation pan with a diameter of 20 cm). The evaporation-precipitation ratio reaches 43.6. The altitude is between 895 m and 903 m. The climate in the study area belongs to warm temperate continental desert climate. Soil texture is loamy sand soil with lower soil fertility [8].
Figure 1. Geographic location of the study area.
Water 08 00047 g001

2.2. Experimental Design

Winter irrigation tests were performed from 5 November 2013 to 20 March 2014. A total of five irrigation treatments and one control were respectively designed as 1200 m3/ha, 1800 m3/ha, 2400 m3/ha, 3000 m3/ha, 3600 m3/ha, and 0 m3/ha (control). Total dissolved solid and electrical conductivity in the irrigation water was 1185.1 mg/L and 1935 μs/cm, respectively. The pH value was 7.3. The size of the experimental plot was 3 m × 3 m. Irrigation was performed from 10 November to 11 November. Soil samples were obtained before and after winter irrigation to determine soil moisture content and soil electrical conductivity. Sampling depth was 1.0 m. Four soil samples were obtained on 6 November, 21 November, 5 December and 9 March up to a depth of 1.0 m. The total duration was 119 days after irrigation. To avoid spatial heterogeneity, two soil sampling methods were adopted. First, in order to acquire undisturbed soil samples, a small gouge with the small borehole diameter (φ = 3.0 cm) was used to acquire soil samples. Second, more soil samples were obtained. In the first and last soil sampling, 6 samples were obtained. In the second and third sampling, 3 samples were obtained. To determine soil moisture content and salt content, soil samples were obtained for every 10-cm soil depth. The soil profile in the experimental field showed two soil texture classes. According to the particle analysis results, soil from the ground to the depth of 60–80 cm was silt and the soil below the depth of 60–80 cm was the transition silt sand. The field capacity (mass) in the field was between 16.0% and 18.0%.
Soil moisture content was measured gravimetrically with the drying method. The water–soil solution mixture was prepared according to the ratio of 1:5 and then the electrical conductivity values were measured by Leici DDS-307 conductivity meter ((DDS-307, INESA Scientific Instrument Co., Ltd., Shanghai, China)). Soil temperature was measured by installing the Micro Lite U-disc temperature data loggers (Fourier Co. Tel Aviv, Israel) at the depths of 5 cm, 15 cm and 25 cm in two treatments (1200 m3/ha and 3600 m3/ha) and control treatment. The sensor’s logging interval was 2 h. The resolution of the instrument was 0.06 °C and the accuracy was 0.3 °C. Air temperature, relative humidity, wind speed, and solar radiation were monitored by Davis Vantage Pro 2 automatic weather station ((Davis Instruments, CA, USA,). Groundwater depth was measured twice during the experiment period. Groundwater depths at 4.5 m and 4.6 m were observed on 5 December 2013 and 9 March 2014 and showed no change or little change.

3. Results and Analysis

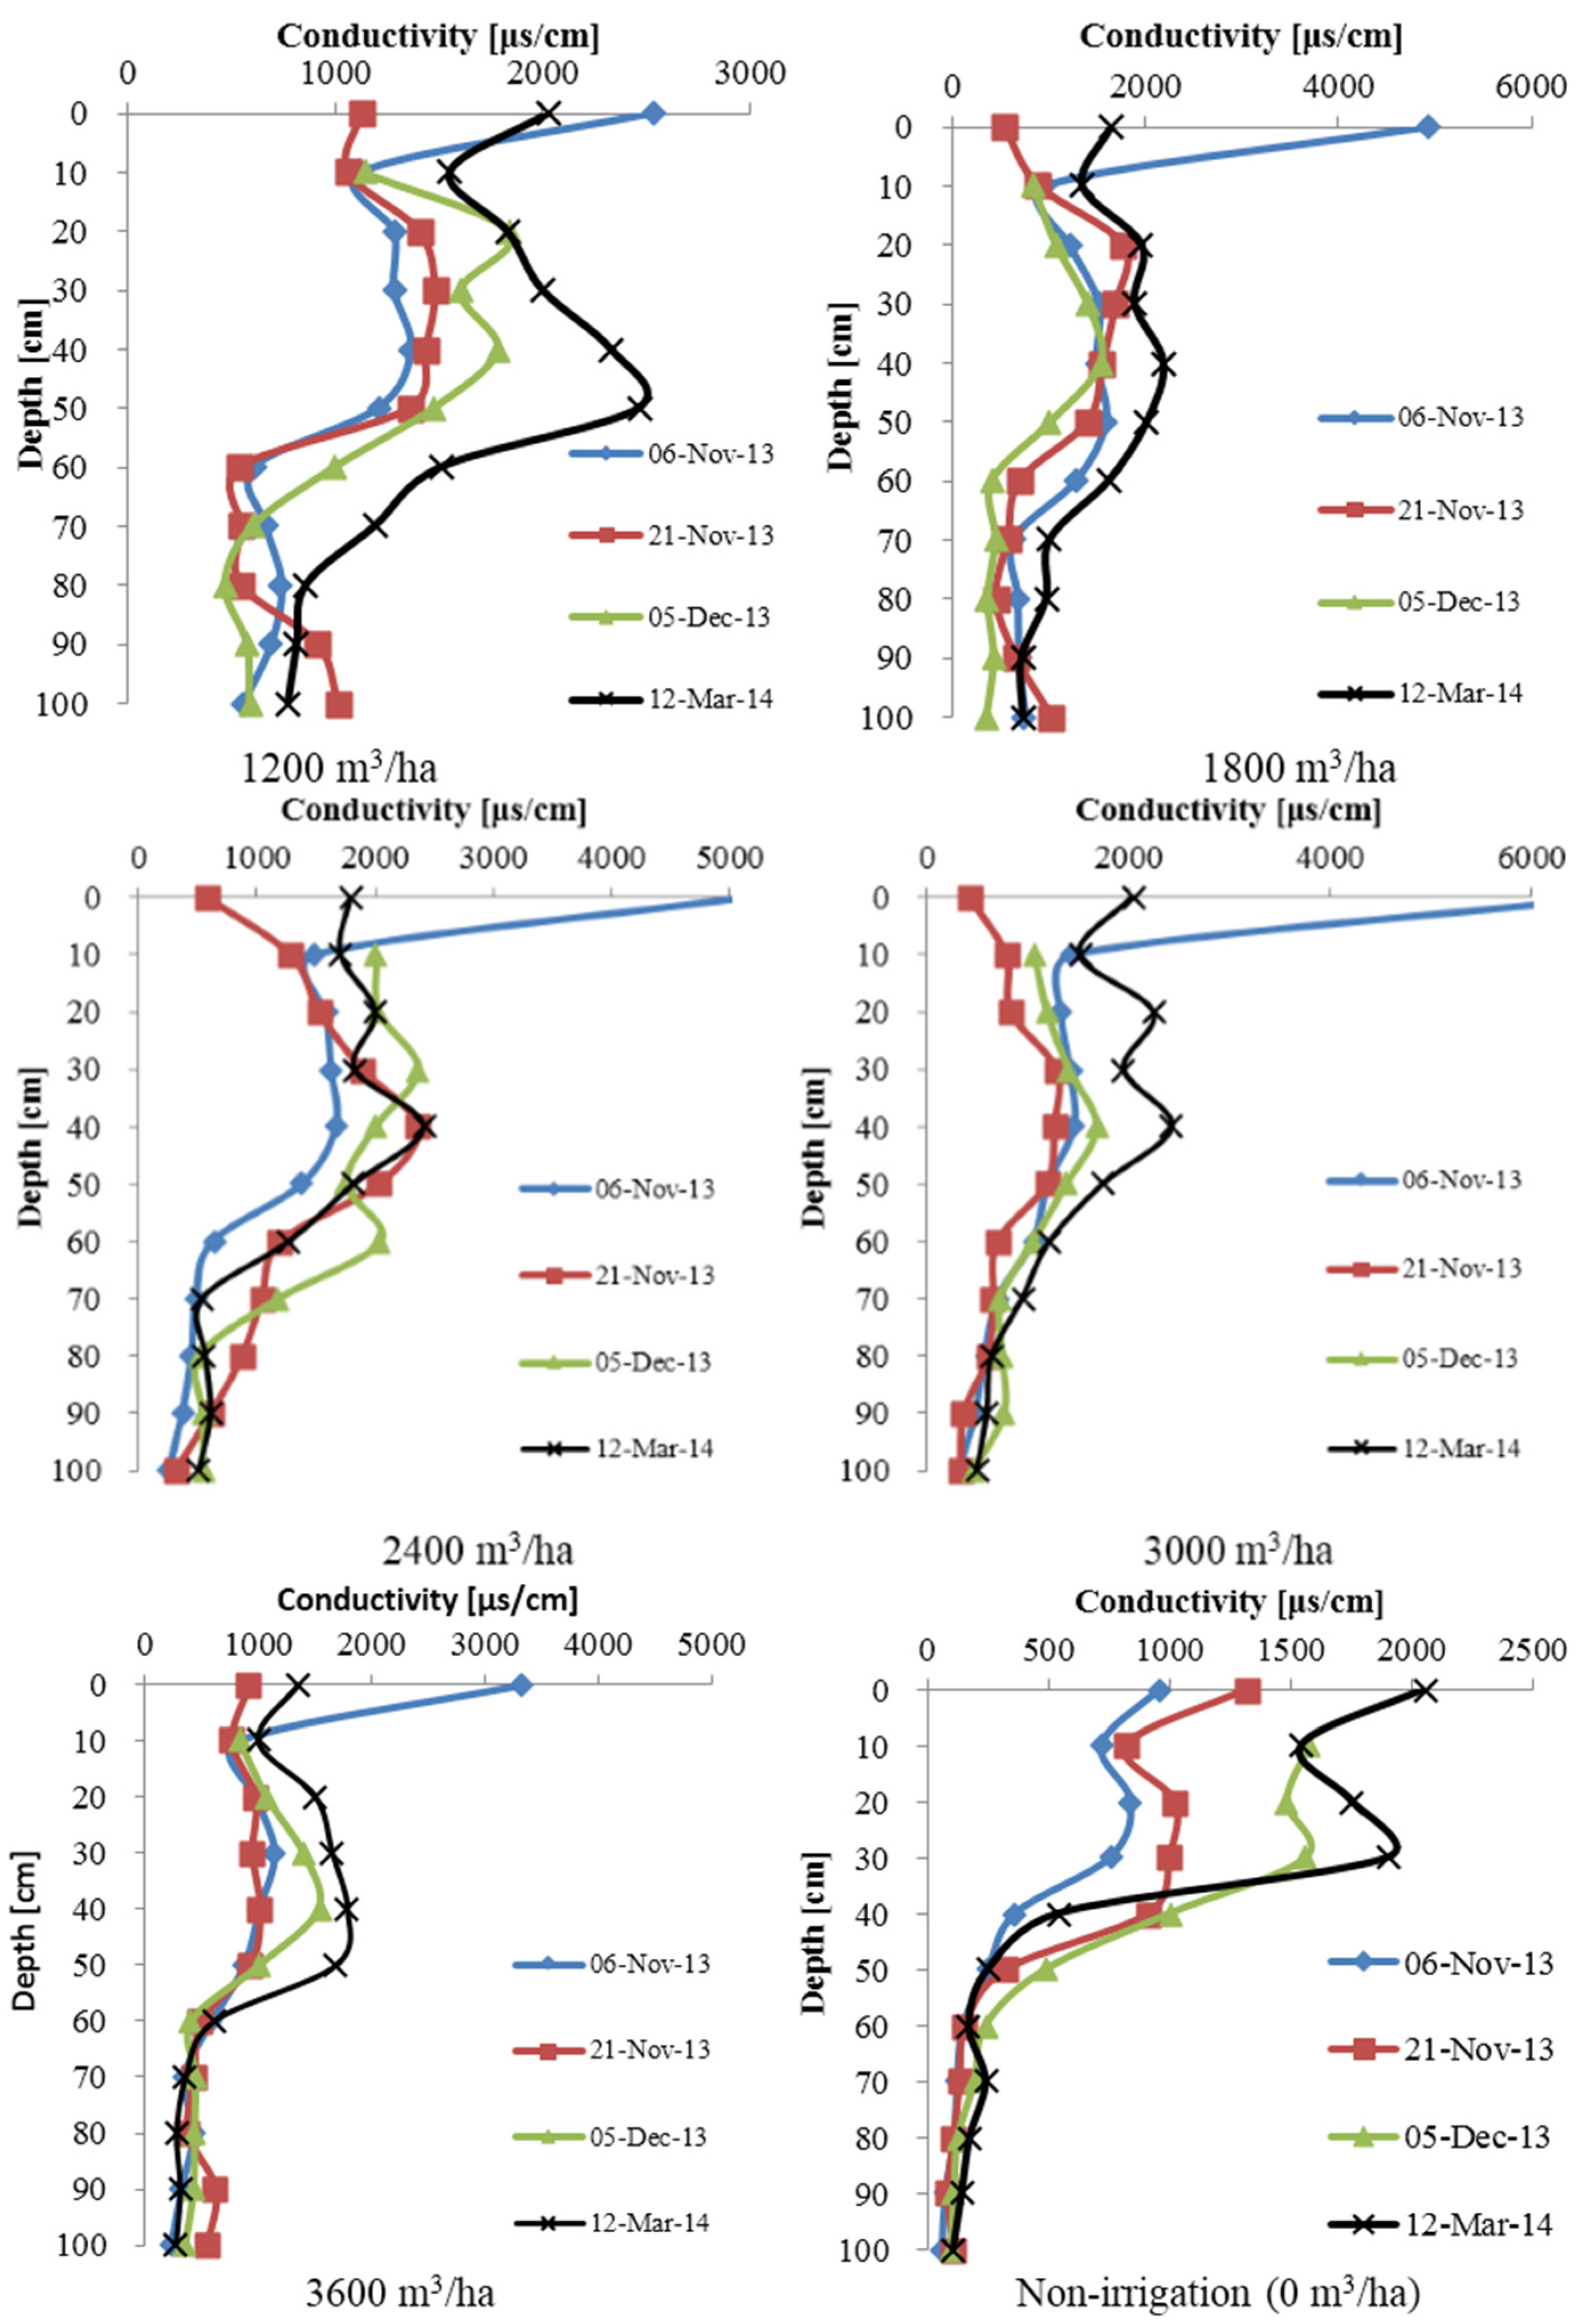
3.1. Relationship between Total Salt Content and Conductivity Values

According to the analysis results of 103 soil samples collected from the experimental plots in December 2011, the correlation between total salt content and the conductivity of the extraction solution prepared according to the ratio of 1:5 is expressed as: Y = 0.3911x − 0.0227 (R2 = 0.9), where Y is total salt content in soils (g/100 g) and x is the conductivity of soil solution (mS/cm). It can be seen from the above formula that when the conductivity of soil solution (soil-water ratio = 1:5) is increased by 1 dS/m, total salt content is increased by 0.37%. We established the corresponding relationship between the conductivity value and total dissolved solids and found that the salt content in soils could be indicated by the conductivity value, which could be easily measured. According to the method by B·A·Kovda [9] the chemical types of soil salts can be classified based on anions. The salt type in surface soil belongs to Mg-Na-SO4, and the salt type in the soils with the depth of 10–30 cm is Mg-Na-Cl-SO4 or Ca-Na-Cl-SO4.

3.2. Environmental Effects of Winter Irrigation

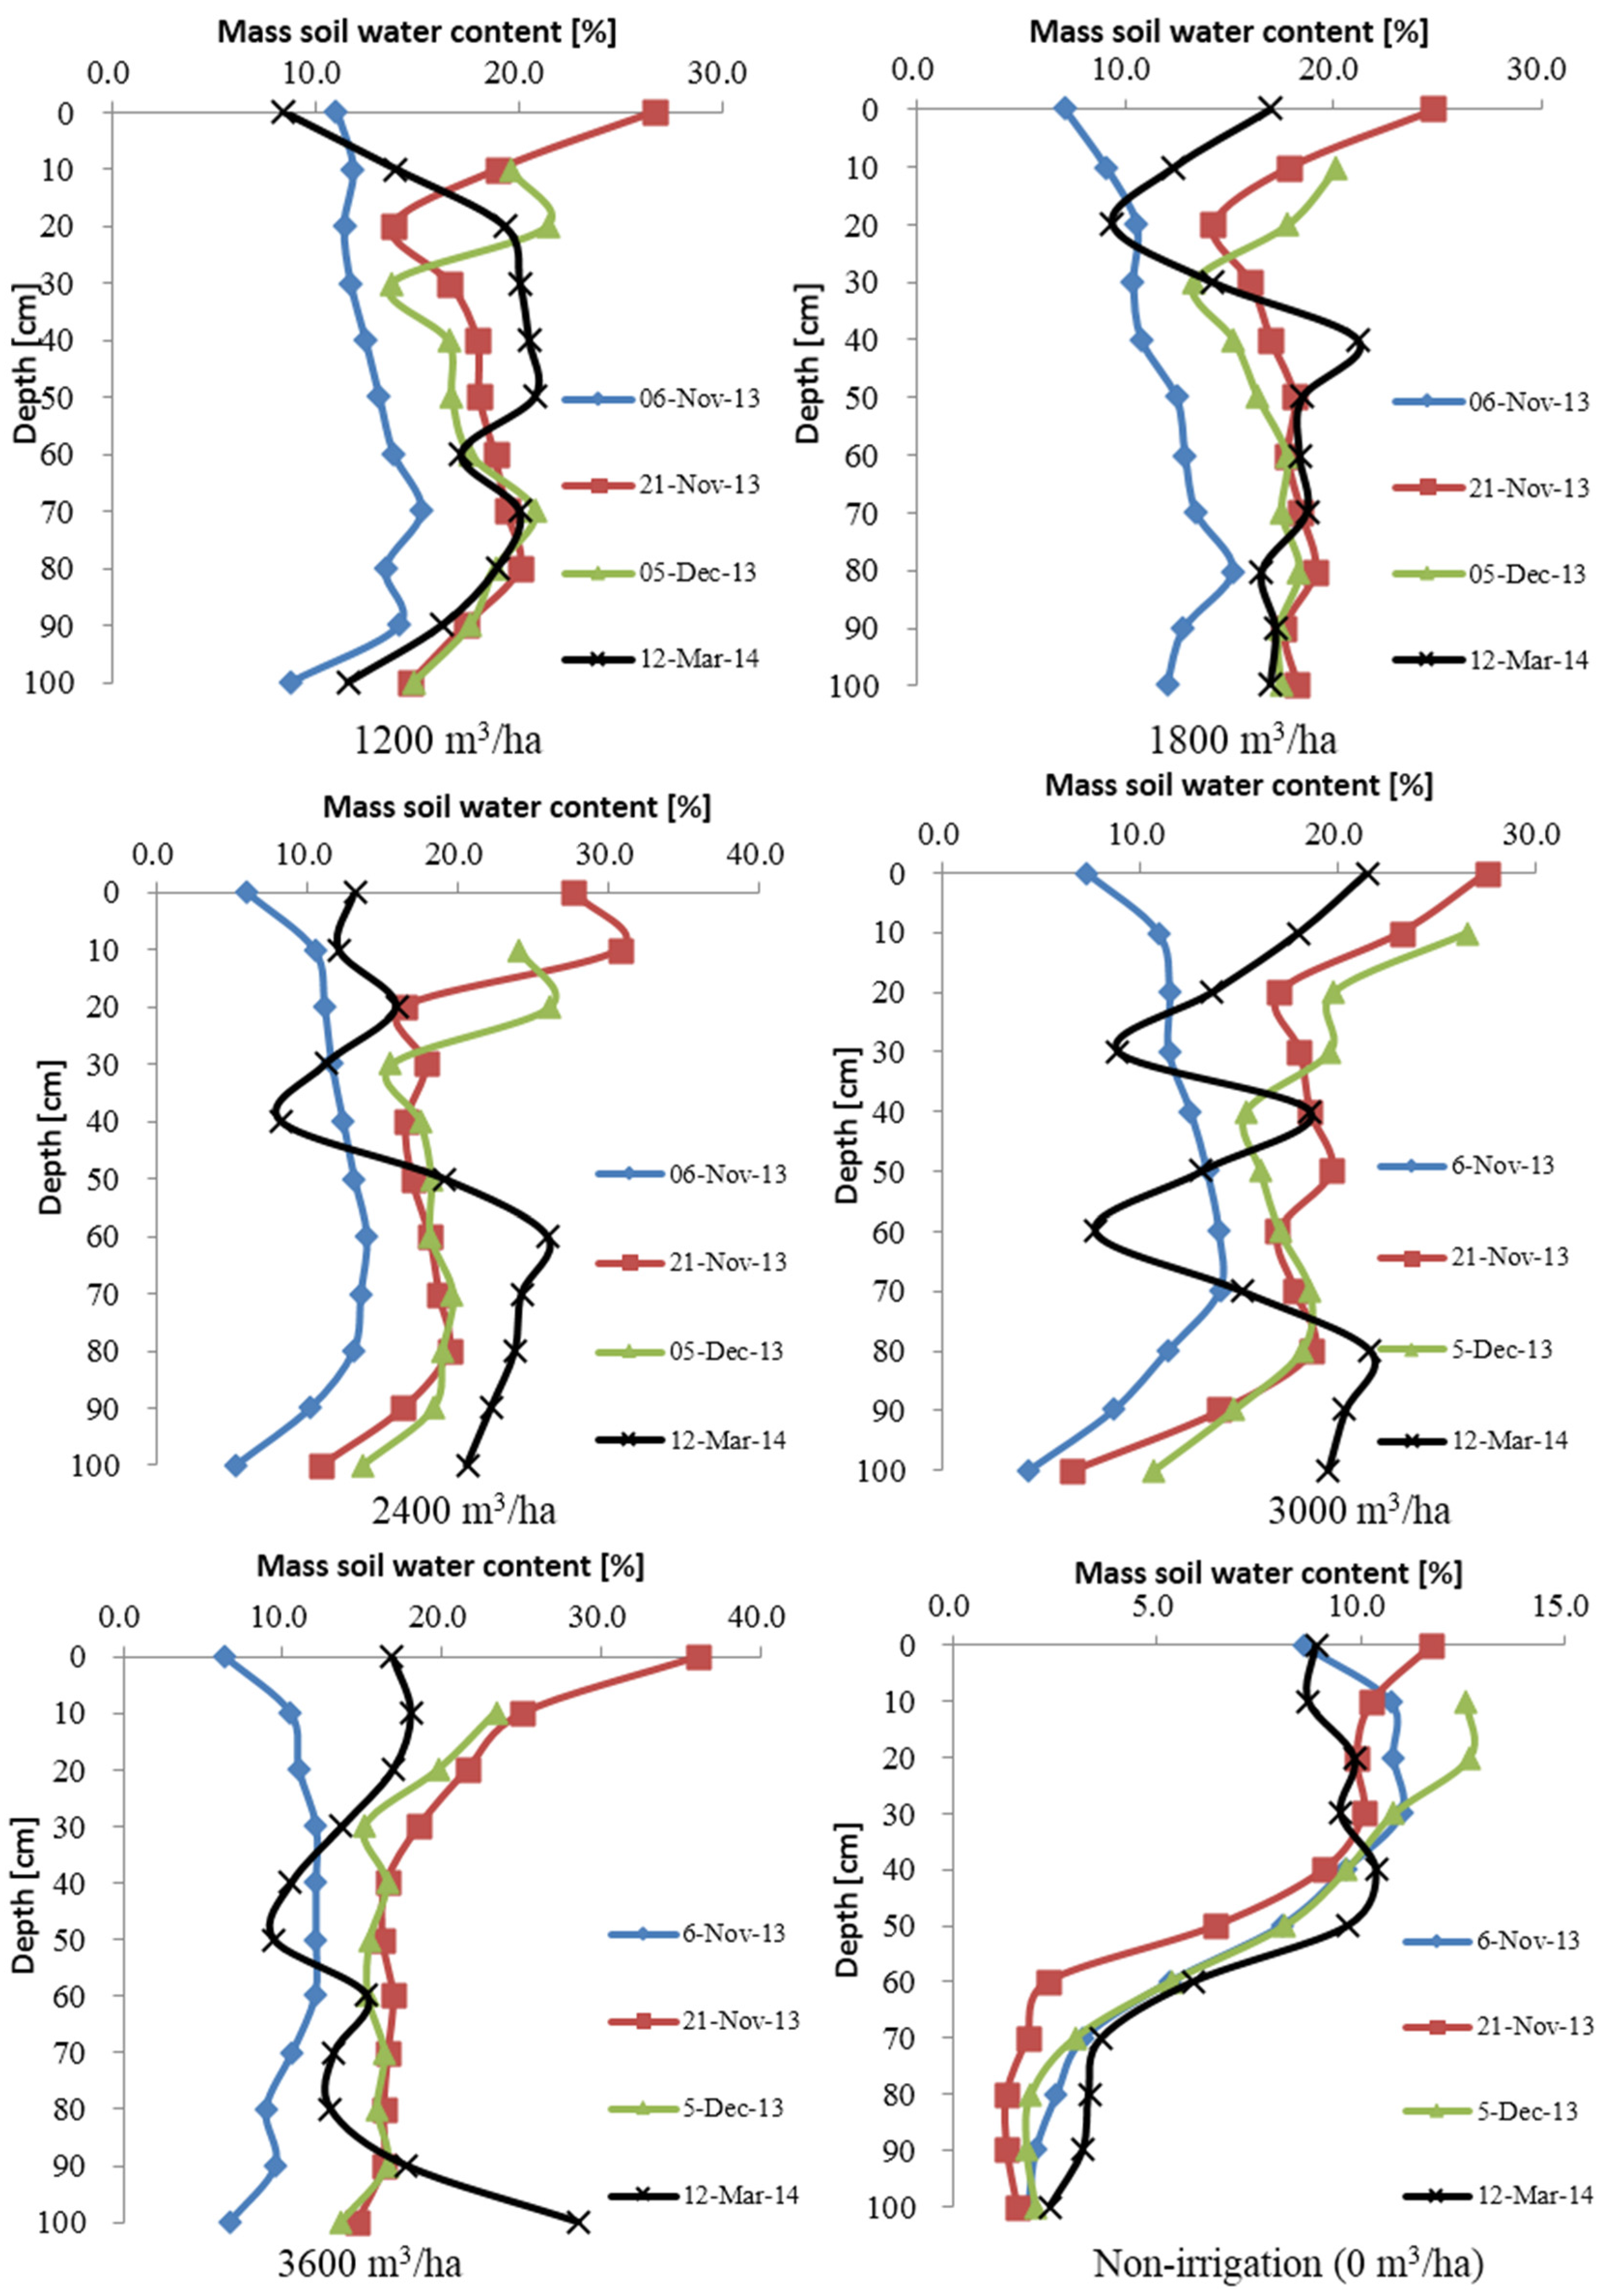
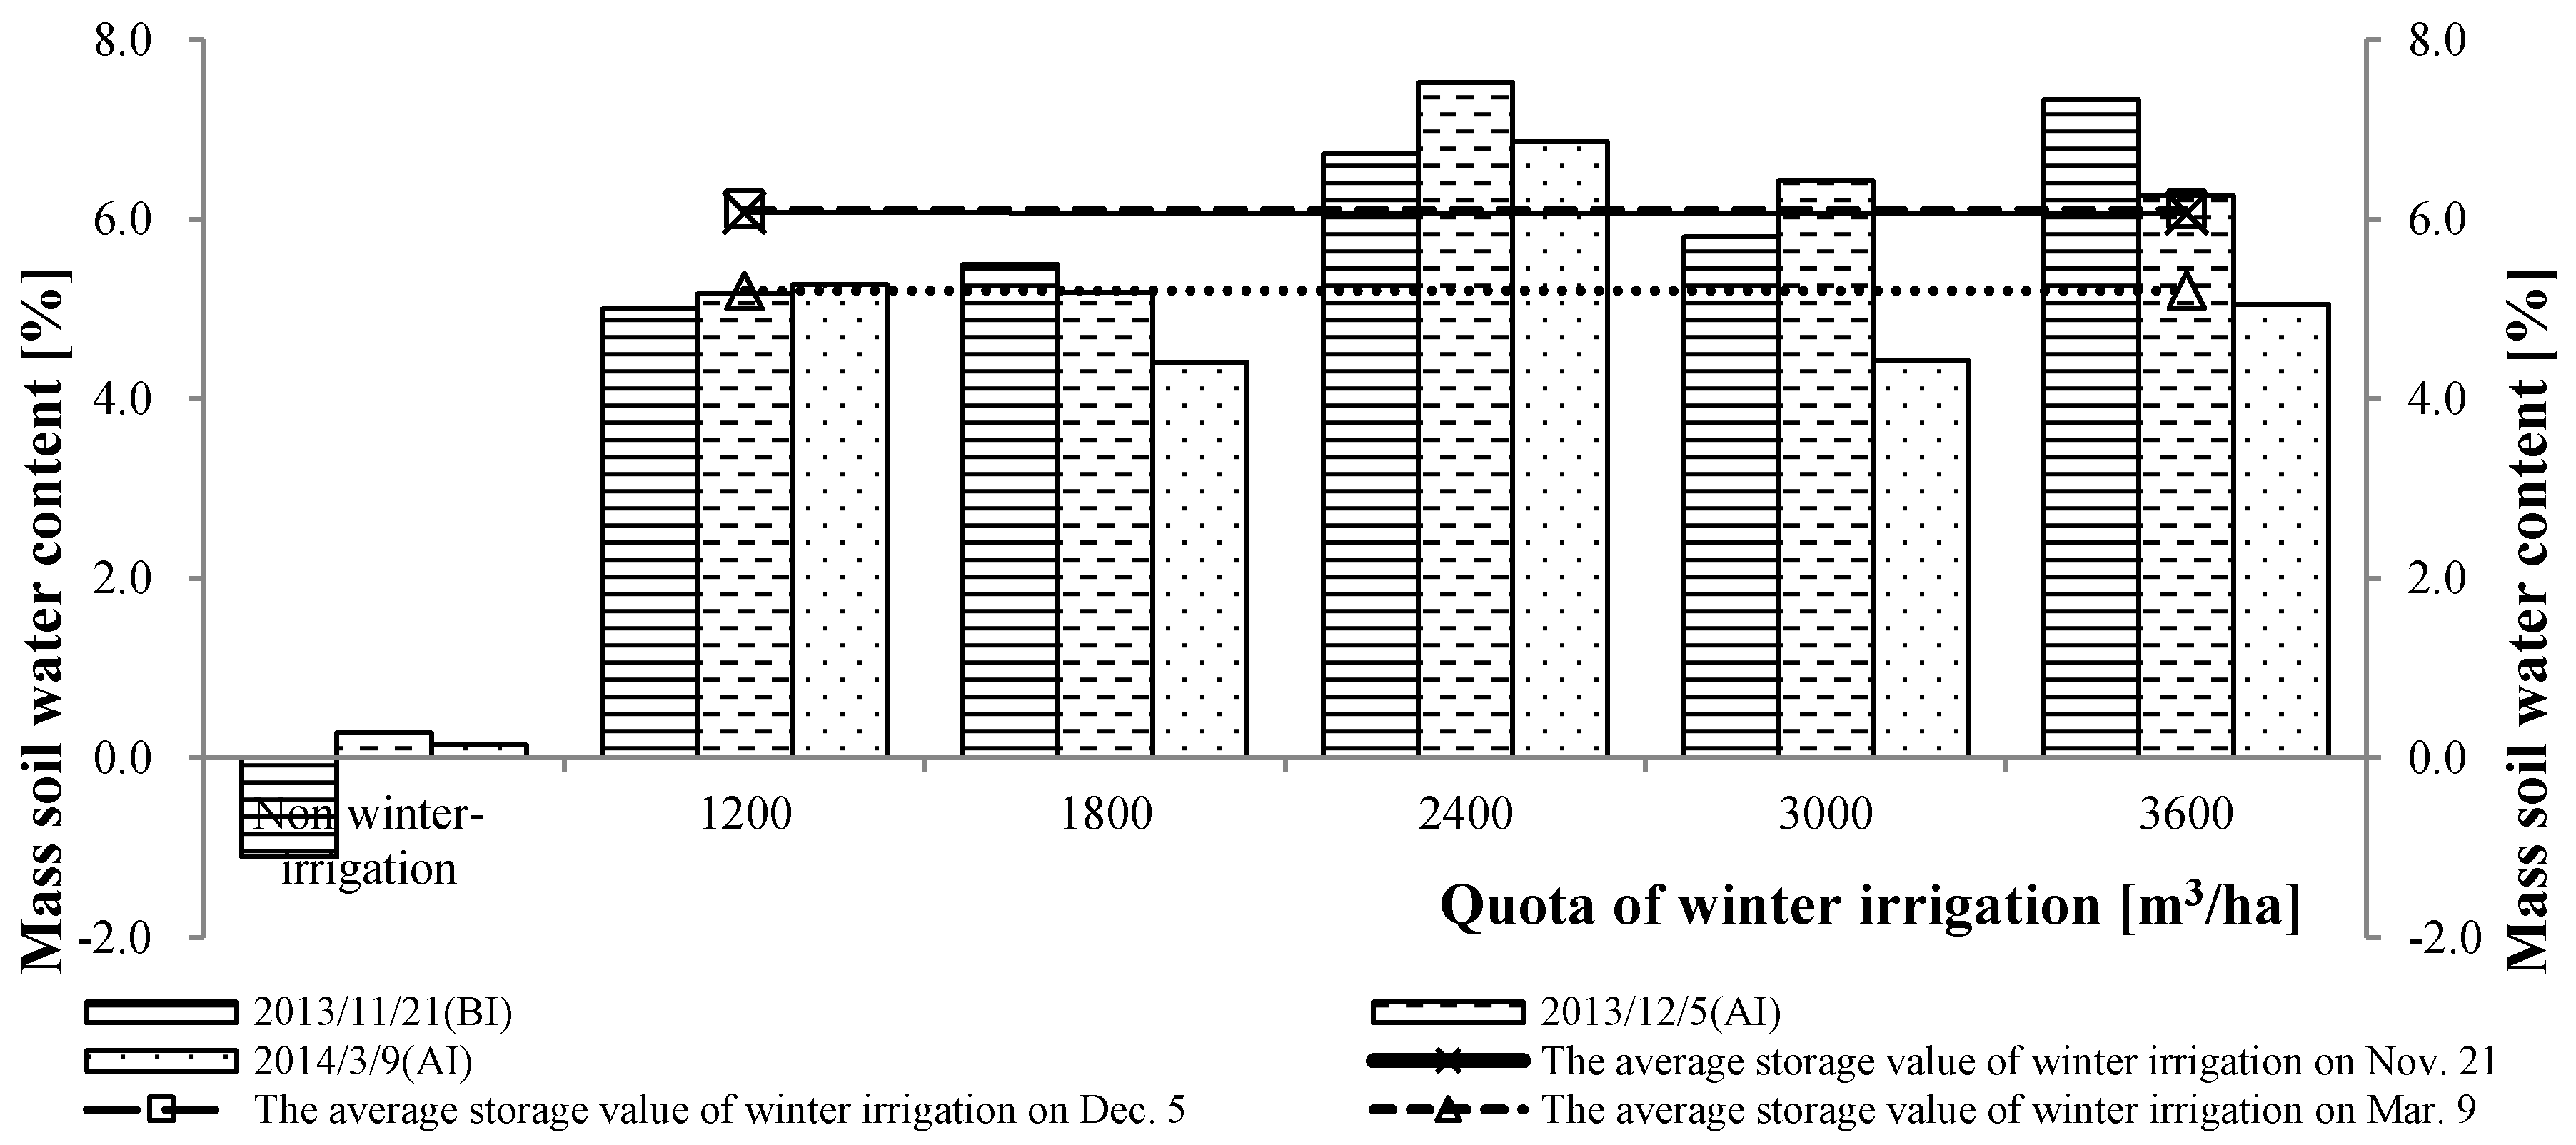
3.2.1. Effect of Winter Irrigation on Water Storage

Winter irrigation can be completed within several days. After that, it is followed by a long winter period. Under the influences of gravity and thermal potential, soil moisture firstly continuously moves towards the frozen layer to form the maximum frozen layer depth. In the subsequent thawing period, under the influence of temperature rise, soil moisture in the frozen layer moves upward and downward. The results showed that the soil moisture content profile varied with time. This variation could be considered as the subsequent effect of winter irrigation. The variations of soil moisture contents are shown in Figure 2.
Figure 2. The dynamic soil profile of soil moisture content of all treatments under winter irrigation.
Water 08 00047 g002
As shown in the profile curves (Figure 2), soil moisture content increased significantly after irrigation but gradually subsided with time. For the former two, post-irrigation determinations of soil moisture content were taken within 1 month after winter irrigation. The determination results were highly affected by irrigation. The last determination was taken on the 118th day after irrigation. Soil moisture experienced long-term freezing and was largely changed in the soil profile. With the obtained results, we calculated the average soil moisture content within 40 cm and 100 cm depth in different treatments (Table 1). Up until 9 March, soil moisture contents in different treatments were basically the same and slightly lower than field moisture capacity, indicating that the subsequent effect of winter irrigation was maintained at the field water capacity level and was nearly four times that of the non-irrigation blank control.
Table 1. The dynamics of average soil moisture content in soil depths of 0–40 cm and 0–1.0 m cm before and after winter irrigation (unit: %).
Dates6 November 2013 (BI)21 November 2013 (AI)5 December 2013 (AI)9 March 2014 (AI)
Non-irrigation10.6/3.89.8/2.511.4/3.79.6/4.7
Volume of winter irrigation (m3/ha)120011.9/13.116.9/18.117.8/17.718.5/17.5
180010.2/13.116.3/18.216.6/17.514.3/17.7
240011.4/11.520.4/16.720.8/17.811.9/22.6
300011.6/11.019.2/15.620.3/15.914.8/16.2
360011.4/10.020.4/16.218.7/15.614.8/16.2
Average of winter treatment11.3/11.718.6/17.018.9/16.914.8/18.1
Notes: Slash (/) indicates the average quantity of water content of 0–0.4 m and 0–1.0 m depth; BI indicates that the data are obtained before irrigation; AI indicates that the data are obtained after irrigation.
In the non-irrigation treatment, in the whole overwintering period, the soil moisture content remained stable. The background moisture contents in each treatment were different. In order to avoid the interference from different background values among different treatments, we subtracted corresponding average soil moisture content obtained before irrigation from that obtained after irrigation. The calculation results could be considered to be the indications of the water storage effect of winter irrigation. We subtracted the background value obtained in 6 November, respectively, from the soil moisture contents obtained on 21 November, 5 December, and 9 March and obtained the increased soil moisture content in the 1.0-m deep soil after winter irrigation, which could be used to quantify winter irrigation effects, as shown in Figure 3.
Figure 3. The comparison chart of water storage effects of winter irrigation in 1.0-m deep soil in six treatments.
Water 08 00047 g003
As shown in Figure 3, in the non-fertility stage, soil moisture shows three distinct characteristics. Firstly, the variation of soil moisture content in the non-irrigation treatment was less than 1%. Therefore, it is considered that soil moisture content is essentially unchanged in the overwintering period. Secondly, the increase of soil moisture content in the winter irrigation treatments was significantly higher than that in the non-irrigation treatment, indicating a water storage effect of winter irrigation. With the increase of winter irrigation quota, the soil moisture content was also increased (21 November). Thirdly, the water storage effect of winter irrigation gradually decreased with time. Even the higher quota had no effect on the higher water storage in the later winter irrigation stage which could be used for groundwater supply. Therefore, water utilization efficiency was reduced the following spring [10].

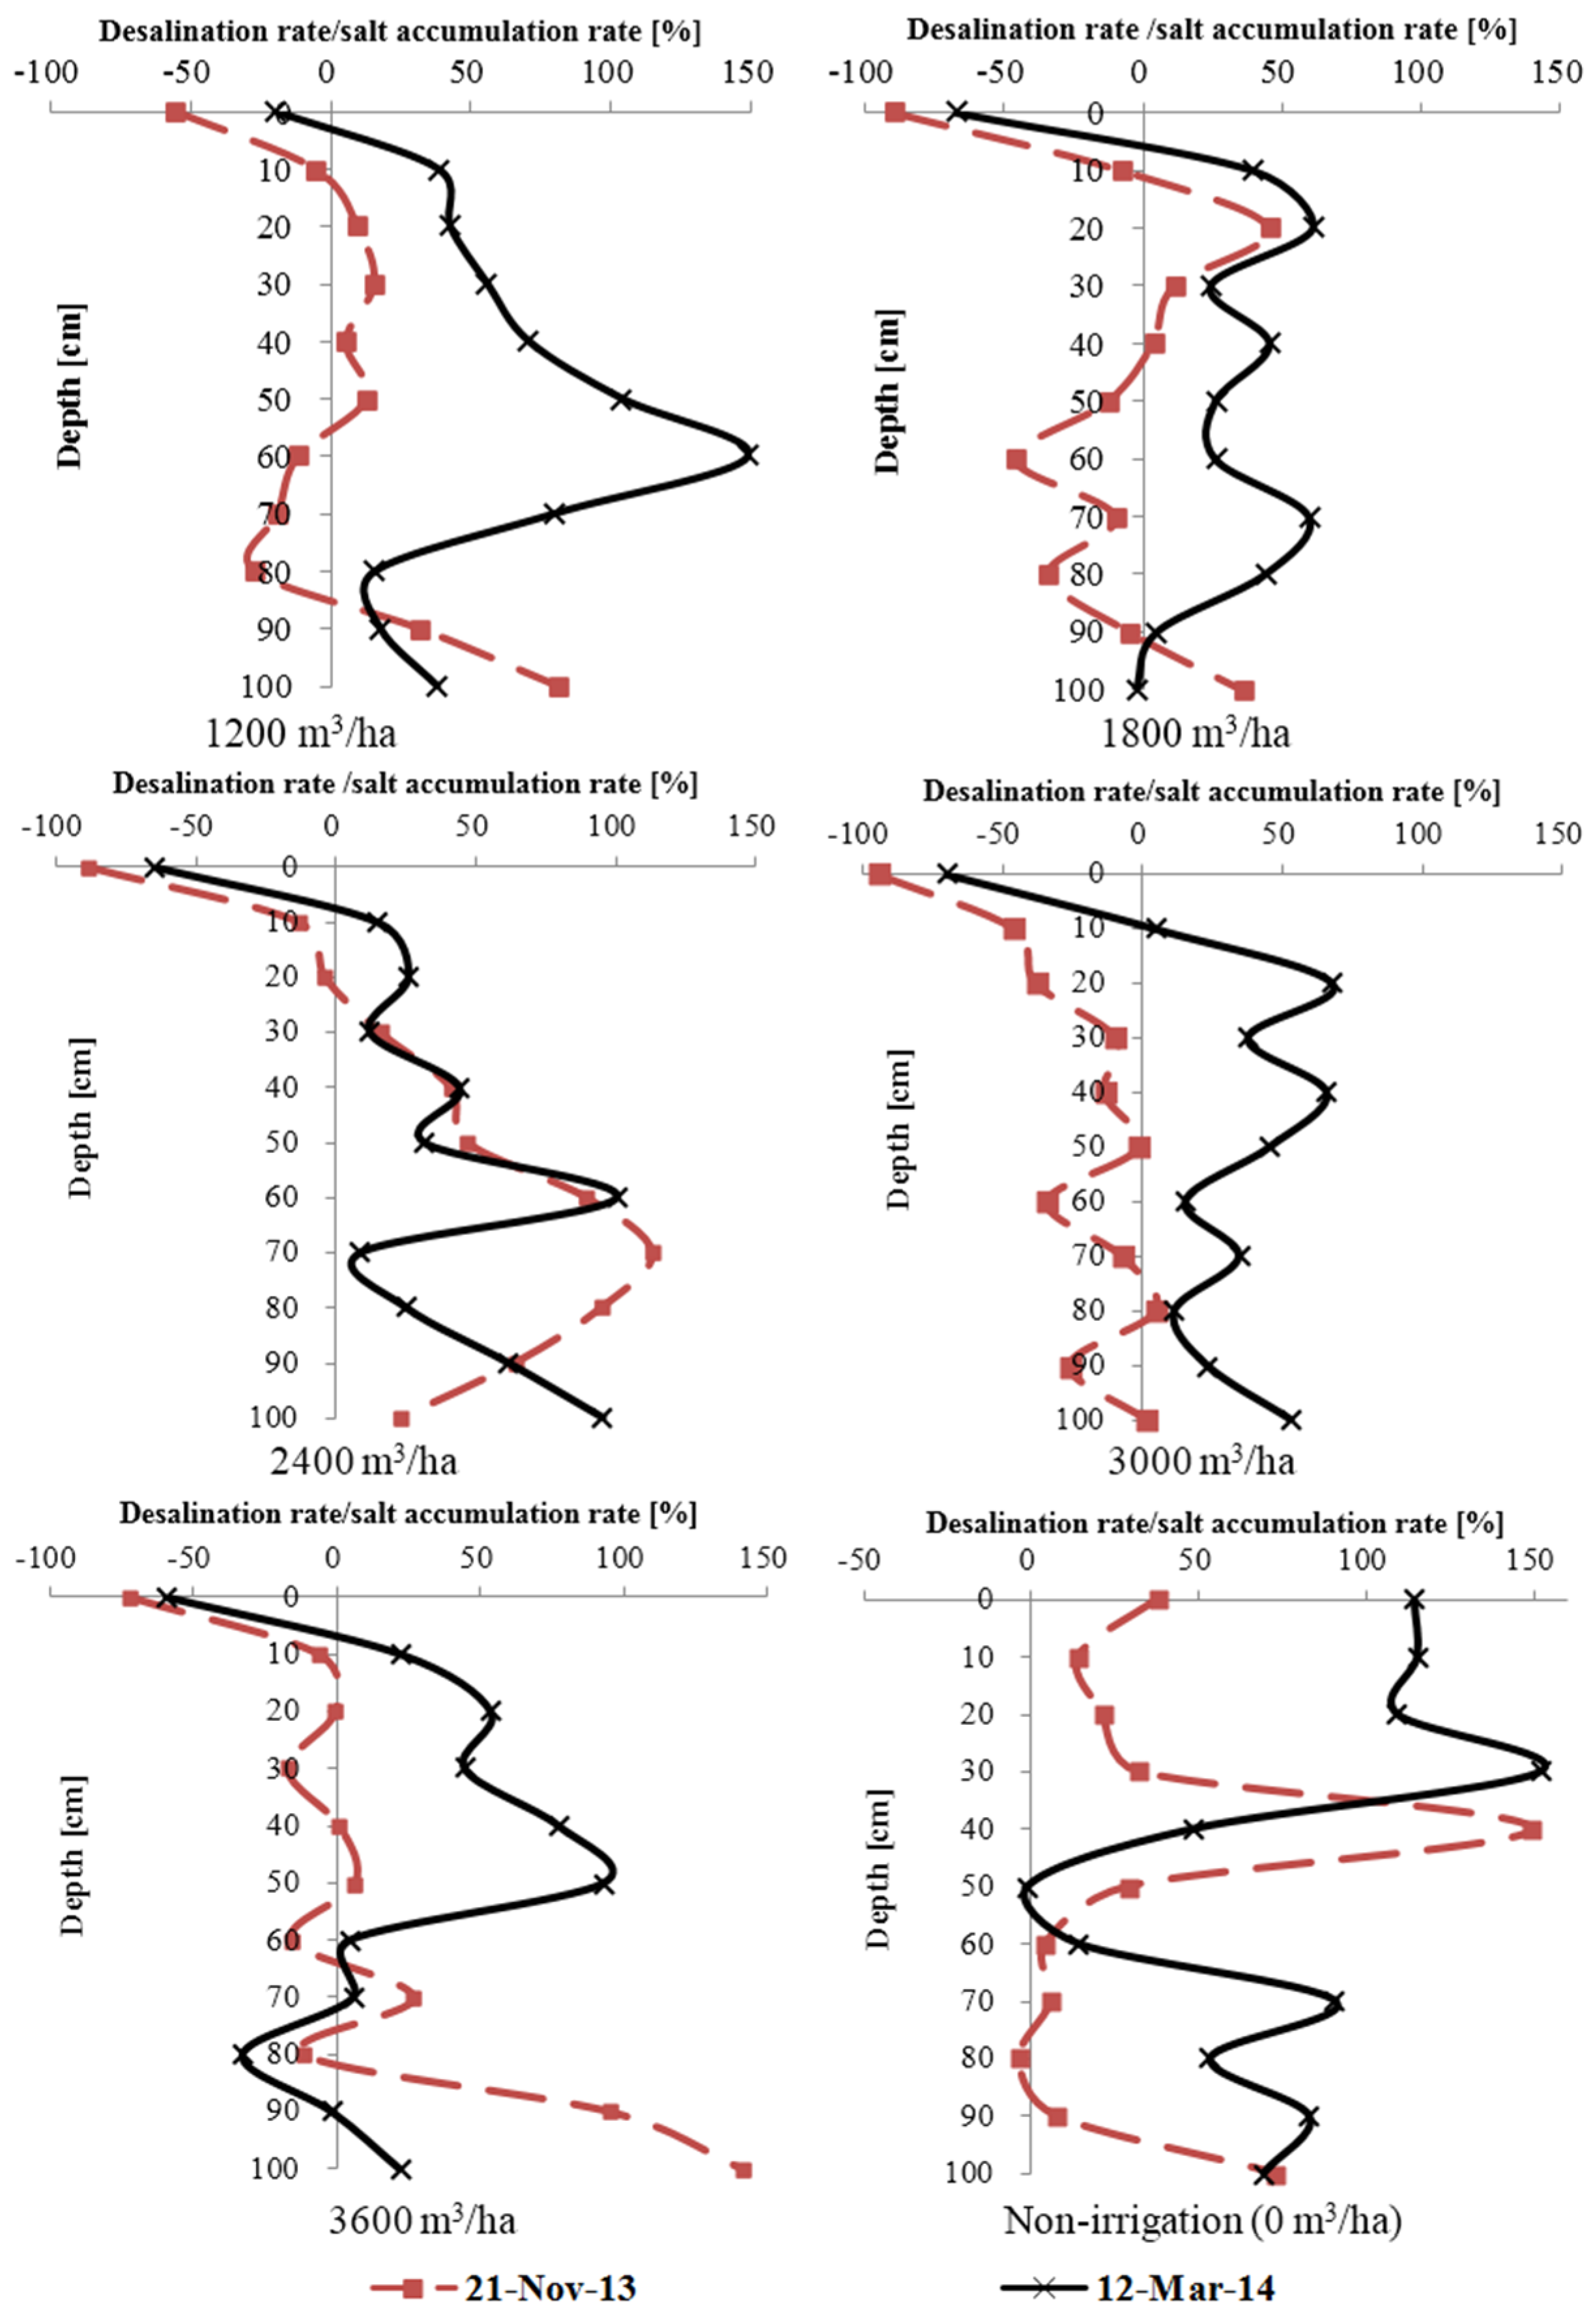
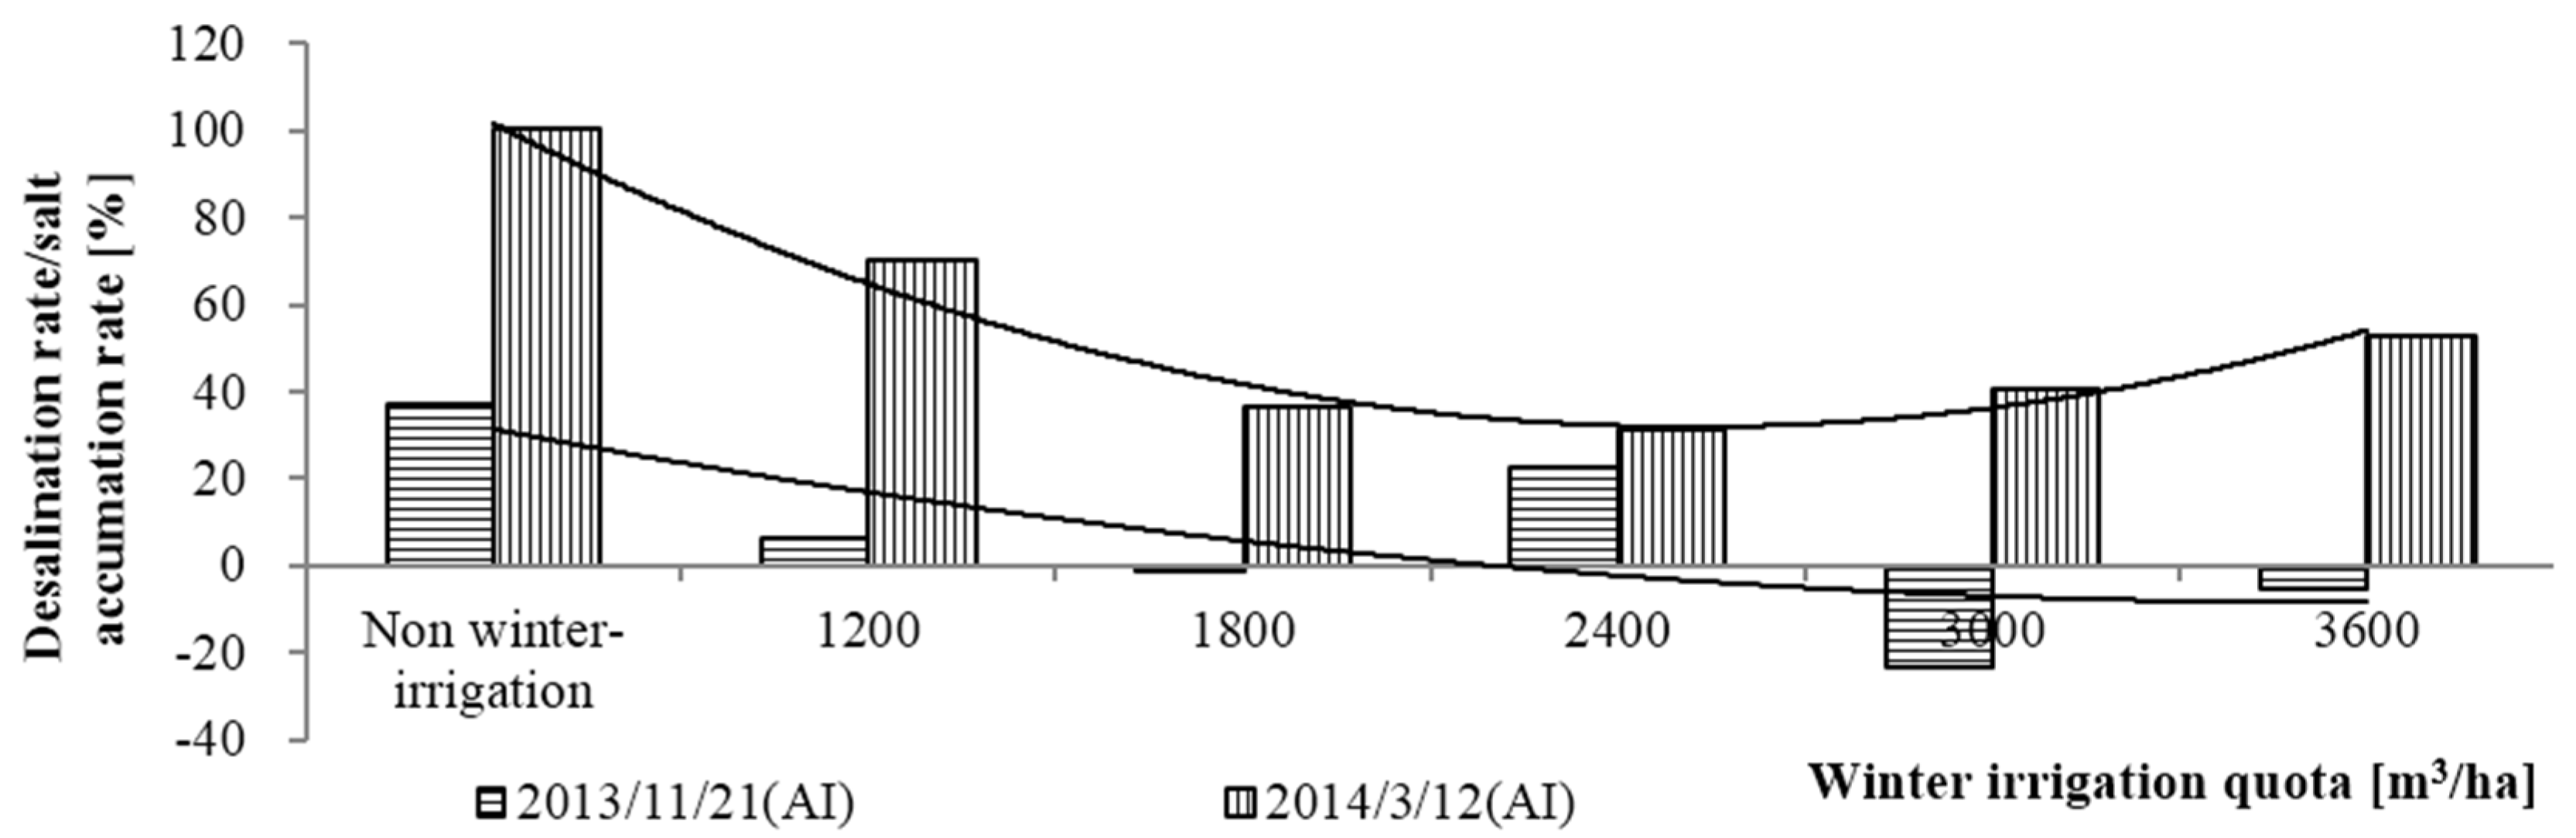
3.2.2. Desalination Effect of Winter Irrigation

The dynamic variation of salt contents in the soil profiles in different treatments after winter irrigation is shown in Figure 4.
Figure 4. The dynamic variation of salt contents in the soil profiles in six treatments.
Water 08 00047 g004
As shown in Figure 4, the variation of salt contents in soil profile shows three characteristics. Firstly, the significant surface accumulation phenomenon was observed. The salt content was very high in the 0–2 cm depth and decreased abruptly in the depth below 2 cm. With the increase of soil depth, salt content was decreased. Secondly, salt content in soil profile showed the significant boundary at 60-cm depth. The depth above 60 cm could be named as the drastically changed zone and the depth below 60 cm named as the stable zone of salt content. The salt leaching effect of winter irrigation was decreased with the increase of soil depth (0–60 cm). Thirdly, during the winter irrigation, salt content was increased gradually.
According to the traditional calculation method of salt leaching rate, the leaching rate was calculated by dividing the salt content difference before and after irrigation by the salt content before irrigation. If the leaching rate is a positive value, winter irrigation shows the salt accumulation effect; if the leaching rate is a negative value, winter irrigation shows the desalination effect. The salt content variations in soil profiles of different treatments were shown in Figure 5.
Figure 5. The dynamic variation of salt content in soil profiles in six treatments.
Water 08 00047 g005
According to the analysis results of the samples obtained in the short term (10 day) after winter irrigation, the desalination depth was increased with the increase of the irrigation volume. When irrigation volume was 1800 m3/h, the desalination depth reached 10.0 cm. When it was 2400 m3/h, the desalination depth reached 20.0 cm. When irrigation volume was larger than 3000 m3/h, the desalination depth was larger than 40.0 cm.
However, after 119 days of winter irrigation, desalination depths in all the treatments were about 10 cm. The soil depth below 10 cm mainly showed the salt accumulation effect. The soil depth between 10 cm and 60 cm was the main salt accumulation depth. The average desalination rates obtained respectively on 21 November 2013 and 12 March 2014 are shown in Figure 6.
Figure 6. Average desalination rate/salt accumulation rate in the soil profile of 0.1–0.6 m in 6 treatments after winter irrigation.
Water 08 00047 g006
Figure 6 shows the following two characteristics. Firstly, according to the short-term trend from winter irrigation to 21 November, the larger winter irrigation volume indicates the more significant desalination effect. When the irrigation volume was lower than 2400 m3/ha, the desalination effect at the depth of 10–60 cm was not significant even though salt accumulation effect could be observed. However, when irrigation volume was higher than 2400 m3/ha, the desalination effect at the depth of 10–60 cm depth was observed. Secondly, in the later winter irrigation stage (12 March), salt accumulation was evident in all the treatments, indicating the salt accumulation process during the winter period. The salt accumulation rate in the control treatment was the highest, while it was relatively lower in other treatments except in the 1200 m3/ha to 3600 m3/ha treatments.
Desalination effect of winter irrigation can be divided into short-term effect and long-term effect. It was found that the short-term desalination effect was significant and that the long-term desalination effect gradually became weak and salt accumulation was observed. Therefore, even the larger winter irrigation volume would not prevent salt accumulation effect in the next year. On the contrary, the high irrigation volume resulted in high water consumption, raised the groundwater level, and led to the loss of nitrate nitrogen. It is important to note that salt accumulation after winter irrigation has a great influence on the cotton sprouting rate. As shown in Figure 6, treatments of 1800 m3/ha, 2400 m3/ha and 3000 m3/ha have lower salt contents in soil in spring. Therefore, the proper winter irrigation volume should be within this range. In addition, arid zone climatic characteristics also determine salt accumulation trends on the soil surface. Irrigation is an important means to adjust this trend. Owing to the role of winter irrigation, unidirectional salt migration towards the surface is interrupted and then re-distributed at the depth range of 0–60 cm, thus decreasing the salt accumulation on the surface. However, due to the influences of freezing and thawing, the upper soil profile shows a certain degree of salt accumulation effect, but it is still lower than that before irrigation, indicating a subsequent effect of winter irrigation. In this way, the inhibition effect on cotton sprouting caused by continuous salt accumulation in the overwintering stage can be avoided [11].

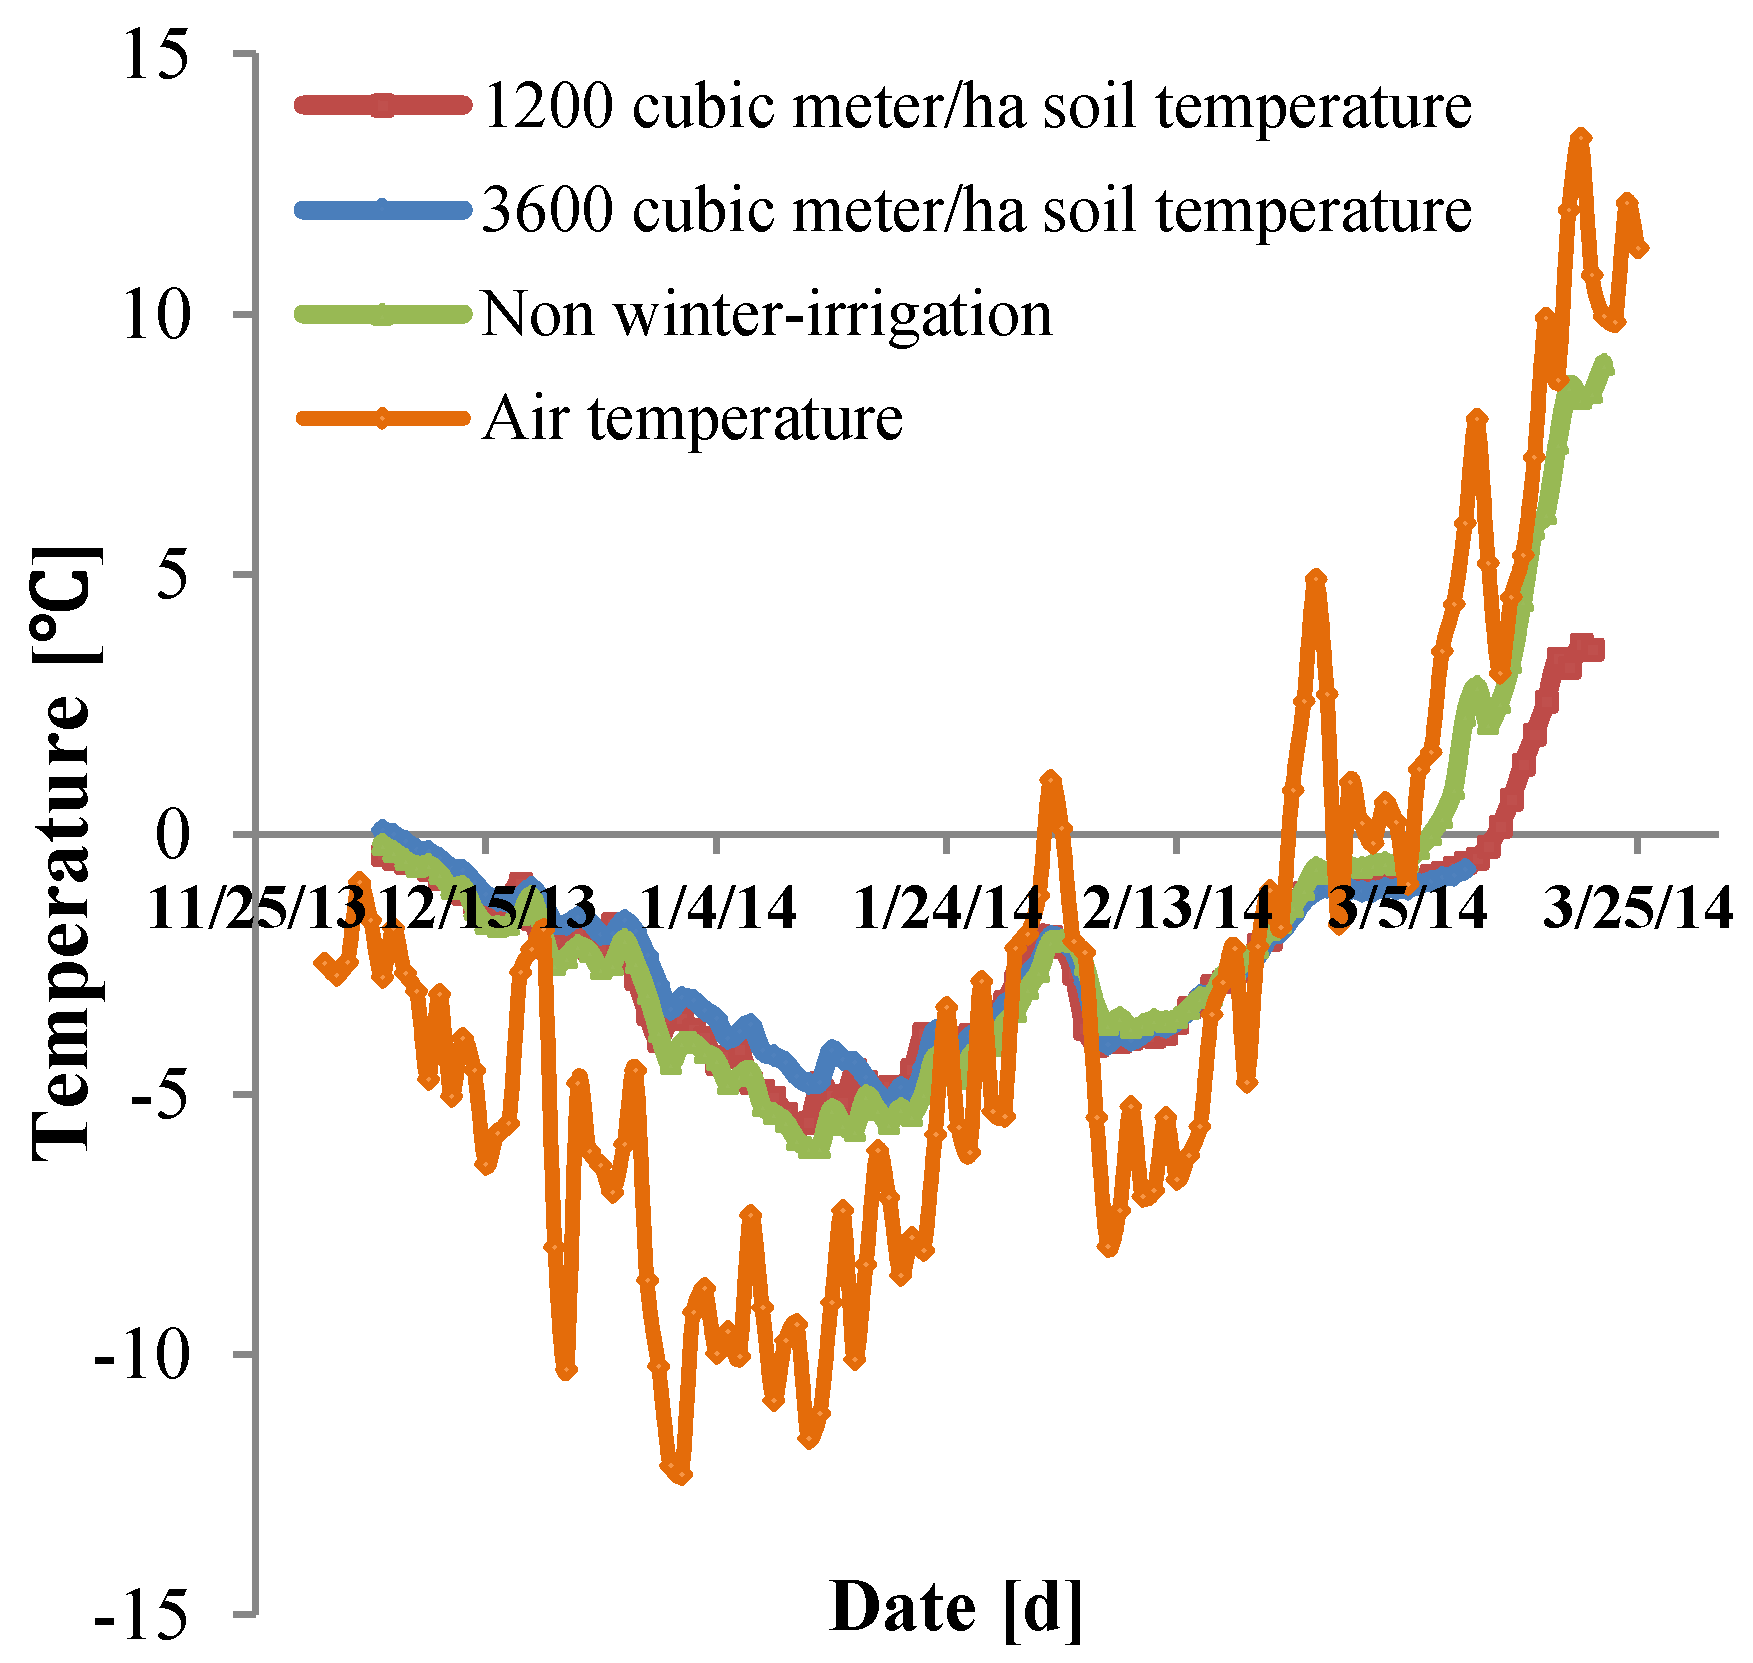
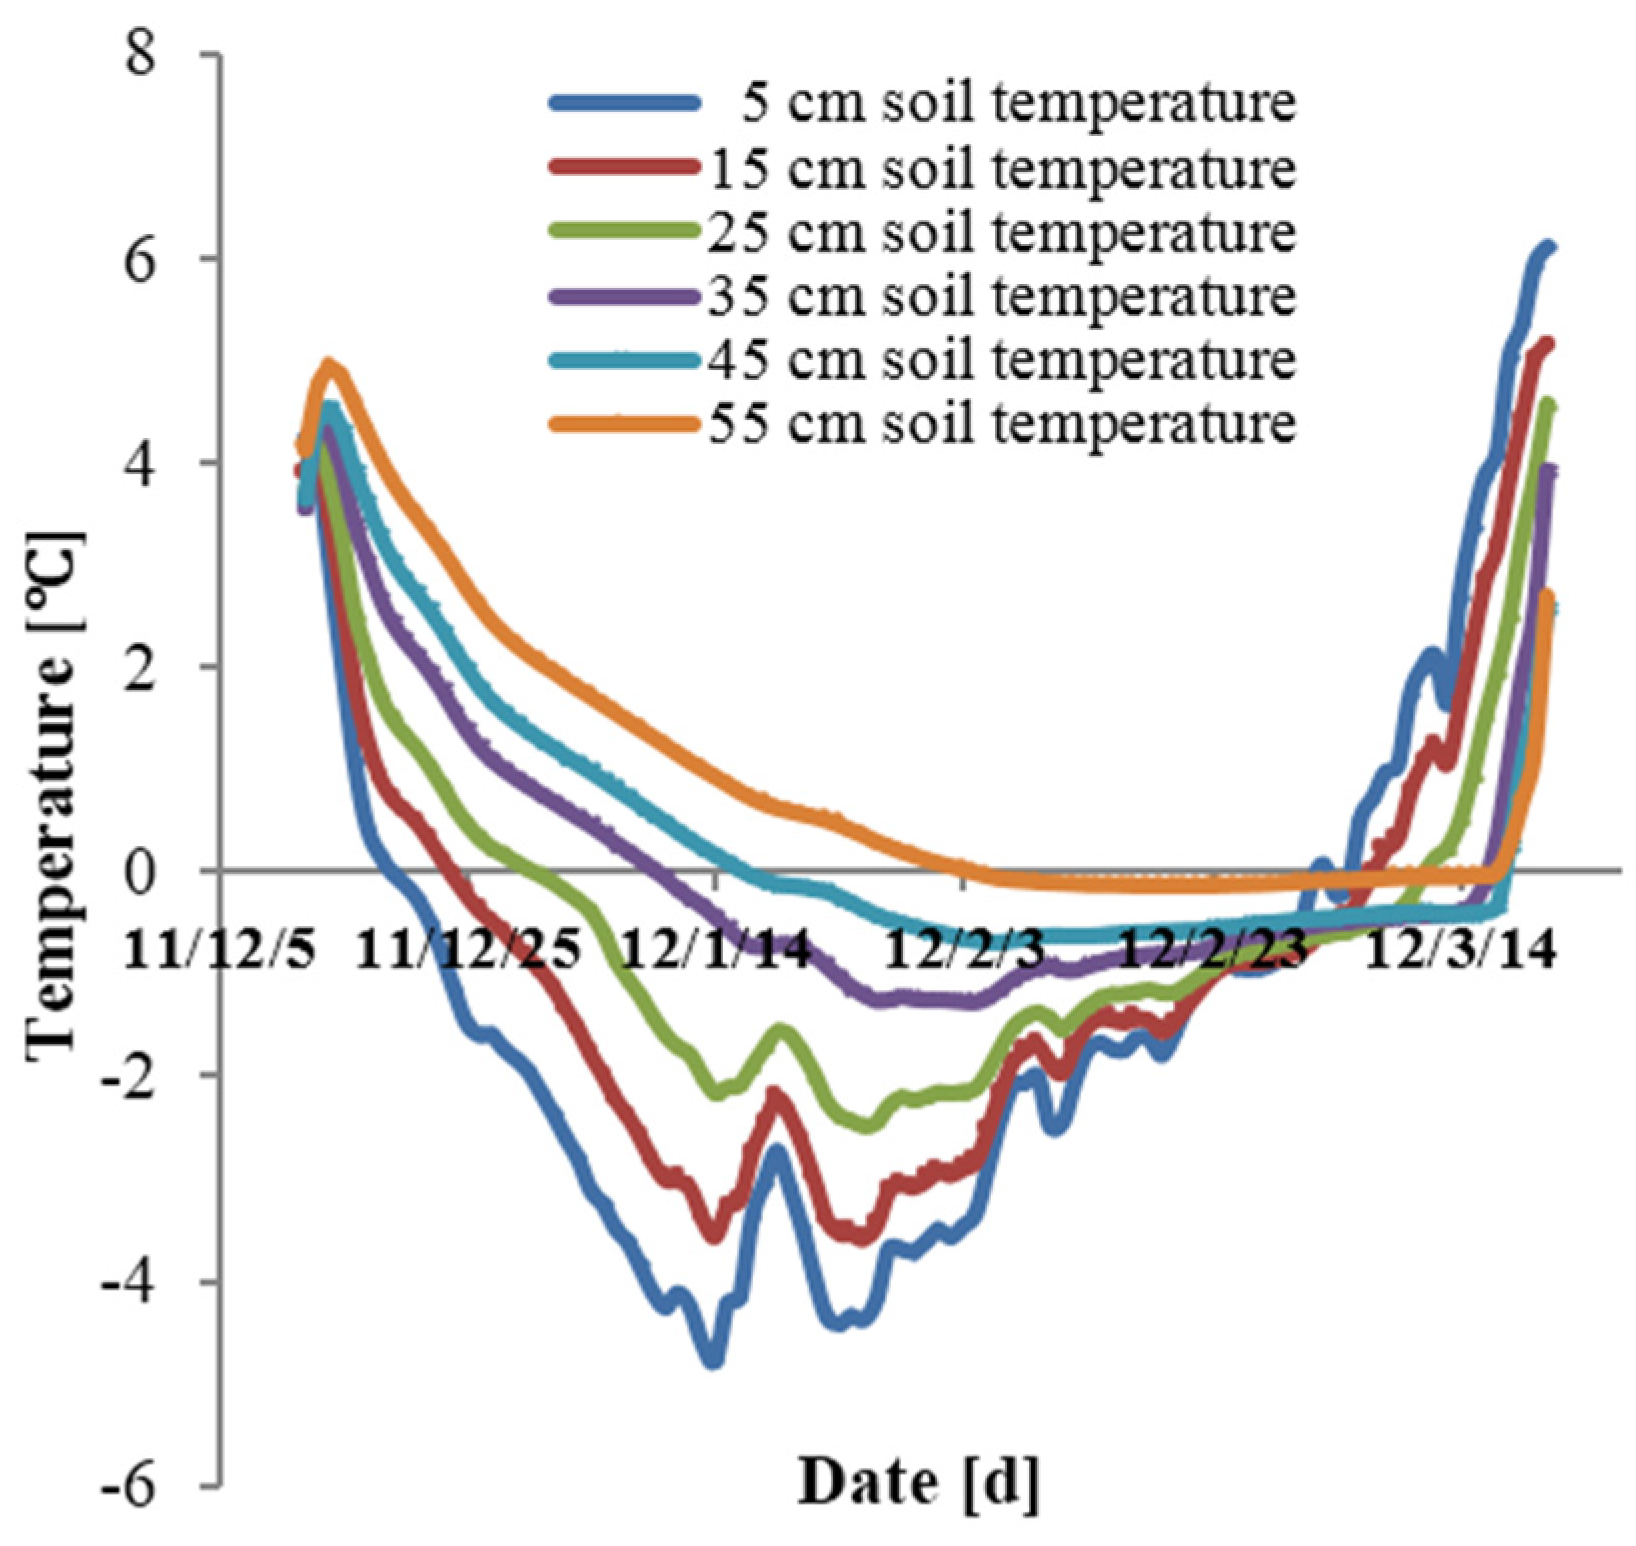
3.3. The Dynamic Characteristics of Soil Temperature during the Wintering Period

Soil temperature was monitored in different treatments at the depth of 5 cm from 10 November 2013 to 11 March 2014. This is shown in Figure 7. However, soil temperature dynamics at different depths in the same irrigation treatment measured from 11 December 2011 to 21 March 2012. Monitoring depths were respectively 5 cm, 15 cm, 25 cm, 35 cm, 45 cm, and 55 cm. The soil temperature dynamics in different depths is shown in Figure 8. The soil temperature recorded every 2 h. Therefore, 12 sets of temperature data were available in a day. The 12 sets of temperature data could be averaged and used as the daily average soil temperature.
Figure 7. Soil temperature dynamics in the depth of 5 cm in different winter irrigation treatments.
Water 08 00047 g007
Figure 8. Soil temperature dynamics in different depths in the same winter irrigation treatment.
Water 08 00047 g008
As shown in Figure 7, three soil temperature curves showed a V-shaped synchronous variation characteristic. The lowest soil temperature at the 5-cm depth recorded on 12 January 2014 was −6 °C. From this time point, the graph could be divided into two parts. The left part of the graph shows a temperature drop. The non-irrigation treatment had the lowest soil temperature and irrigation treatment of 3600 m3/ha has the highest soil temperature. However, the temperature difference among different treatments was small, indicating that the influence of winter irrigation on soil temperature was not apparent. The right part of the graph showed the increasing trend of temperature. Soil temperature in the non-irrigation treatment was the highest and attained a positive value five days earlier than that in other treatments. It was observed that when the soil temperature in the non-irrigation treatment was above 0 °C, the temperature differences between the non-irrigation treatment and other treatments became more significant. However, the temperature differences among winter irrigation treatments were not significant. Similarly, it was also found that the influence of air temperature on soil temperature in the non-irrigation treatment was more significant than that in other treatments. This might be ascribed to the difference of soil thermal capacity caused by winter irrigation [12].
As shown in Figure 8, in different depths of certain treatment, the dynamic soil temperature drop process showed the characteristics of the lower surface temperature and the higher temperature in the deep. In the temperature drop process, temperature potential was gradually enhanced and the potential of water and soil was also in the increasing distribution from top to bottom. Therefore, the potential allowed the upward movement of soil moisture. During the temperature rise process, the temperature difference was gradually decreased. In early March, soil temperatures in all the soil layers were concentrated in the vicinity of −1 °C and were maintained for several days. Thereafter, temperature in all the soil layers rose quickly. Therefore, the temperature difference was increased gradually and showed the gradient distribution which was opposite to that in the temperature drop process. After this, the frozen soil entered the thawing state [13].

3.4. Appropriate Timing of Winter Irrigation

In southern Xinjiang, cotton winter irrigation was generally performed during the period from late October to late November. The irrigation time was selected according to the following two factors. Firstly, in order to minimize evaporation, irrigation time should be postponed as far as possible. Secondly, in order to ensure the canal engineering security, the selected irrigation deadline should prevent the freezing failure of the main ditches network. The two above factors should be considered in the cotton planting area, which relies on surface water irrigation. However, in the planting areas where wells and supporting pipeline networks were available, well water could flow into the fields through underground pipeline networks. Therefore, the second factor might be omitted and winter irrigation time may be adjusted. Winter irrigation may start after surface soil is frozen and be extended to the end of the overwintering period. The adjustment allows winter irrigation time with greater flexibility and maneuverability, thus improving water utilization efficiency.
In the paper, it is recommended that winter irrigation time can be postponed to early December. The advice on winter irrigation time shows the following three advantages. Firstly, according to the foregoing temperature monitoring results (Figure 7 and Figure 8) that surface soil has frozen in early December, water infiltration loss is small and irrigation time can be shortened. Secondly, the irrigation uniformity is improved under such conditions. Thirdly, for the overwintering period after irrigation is shortened greatly, water storage and desalination effects are enhanced. Moreover, it is recommended that the irrigation volume is 1800 m3/ha, which is 1200 m3/ha lower than the commonly adopted surface irrigation volume, 3000 m3/ha. Water conservation effect is significant. The effect of improving soil structure by relying on freezing still exists [14].

4. Discussion

According to the results obtained at deeper groundwater depth, winter irrigation showed a significant effect on groundwater storage. However, subsequent water storage effect of winter irrigation showed a decreasing trend in winter. Soil moisture content obtained under different irrigation treatments were basically the same in spring. After the long winter, soil moisture could be maintained at the relatively high level, which was slightly lower than field water holding capacity and four times that in the non-irrigation treatment. The soil moisture content can meet the requirements of spring sowing.
The desalination effect of winter irrigation was also gradually decreased in winter. Salt leaching effect of winter irrigation was increased with the increase of water irrigation volume. Meanwhile, the salt content in soils before sowing was the most important indicator for cotton planting. When the irrigation volume was higher than 2400 m3/ha, the desalination efficiency was decreased. Therefore, the recommended reasonable winter irrigation volume should be between 1800 m3/ha and 3000 m3/ha. Similar results were reported by Sun Sanmin [4], who conducted experiments on a loamy soil field in Akesu Prefecture, Xinjiang and concluded an irrigation water volume of 3500 m3/ha. Chen Yanmei [15] recommended 2700 m3/ha quota for winter irrigation after conducting tests on sandy loamy soil in the Hetao Irrigation of Inner Mongolia. Another researcher, Li Ruiping [14] pointed out that 1500–2000 m3/ha of irrigation water volume was suitable in the same area. The primary role of winter irrigation is to store water and leach the salt. However, its effects continue weakening over time. Hence, irrigation timing plays an important role in long-term water storage as well as leaching the salt at deeper depth.
After the winter irrigation, soil temperature is mainly affected by the change of air temperature with a certain lag. Once the frozen layer is formed, soil water and salt move to the lower surface of the layer continuously and the maximum frozen soil depth is formed. Li Bang [16] concluded that soil moisture and salt content between 0 and 60 cm were increased after water irrigation in Anjihai Irrigation Area, Manas River Basin, Xinjiang. Guo Zhanrong [17] conducted the underground water balance test in Changji City, Xinjiang and found that the formation process of the freezing layer was accompanied by the increase in soil water content. However, the soil salinity may return in the spring of the second year. Li Ruiping [13] concluded that the change of soil temperature lagged behind that of air temperature. The geothermal gradient is the reason for the movement of moisture and salinity.
Soil temperature during the winter irrigation period showed the following two characteristics. Firstly, during the temperature drop process from December to January in the next year, the difference of soil temperature in the 5-cm depth between the non-irrigation treatment and the winter irrigation treatments was not significant. Secondly, during the temperature rise process from January to March, soil temperature rise velocity in the non-irrigation treatment was significantly faster than that in the winter irrigation treatments [18].
In different soil depths in the treatment of certain irrigation amounts, the temperature difference between the upper soil layer and the lower soil layer increased during the temperature drop process and decreased during the temperature rising process. Soil temperature in all the layers was maintained at −1 °C for a certain period in early March and then the soil layer entered the quick melting period.

5. Conclusions

As one of the water and salt management measures, winter irrigation is widely adopted in the north of the Tarim Basin. In this study, during the five-month winter period from November to April, the effects of water storage and desalination among different irrigation treatments were studied. It was concluded that the effects of winter irrigation on water storage and salinity control in all the treatments decreased gradually as time passed. The low temperature in winter and the fast temperature rise in spring are the main parameters which accelerate the upward transport of salts. In the meantime, ice covering formed after irrigation leads to thermal insulation which reduces the thickness of the frozen layer and the boundary temperature gradient between soil surface and atmosphere, thus decreasing the upward transport of salts or water in soils.
In the paper, we found that the best results were obtained when the winter irrigation water quantity was reduced to 1800–3000 m3/ha. The winter irrigation time should be postponed to early December, which is two months later than traditional winter irrigation time. Therefore, excessive evaporation and upward salt transport caused by earlier winter irrigation can be avoided. Under the current strict water management and fixed water supply quota situation, the selection of the winter irrigation method presented in this paper is of great practical significance.
In most of the area with the drip irrigation system, groundwater is used as irrigation water supply. Therefore, it is not required to consider the freezing failure of the open ditches network during the selection of winter irrigation time. With the implementation of the most stringent water management policy, the fixed water supply quota will become a normal management measure. It is impossible to continue to implement the present flooding irrigation mode at the cost of ecological water loss. The moderate and reasonable winter irrigation will become an irrigation development trend in the future [19,20].

Acknowledgments

This work was funded by the Public Projects of Ministry of Water Resources, PRC (No. 201301102), SuMaRiO, the National Natural Science Foundation (No. 51369030), Major Science and Technology Projects of Xinjiang Uygur Autonomous Region (No. 201130103-3), and Key Disciplines of the Hydrology and Water Resources of Xinjiang (No. 20101202).

Author Contributions

Pengnian Yang designed the experiment, guidance throughout the field experiment and finished writing this article finally. Shamaila Zia-Khan analyzed the data and wrote the first draft of the manuscript. Guanghui Wei elaborated the statistical analysis, data collection and gave input on the draft of the manuscript. Ruisen Zhong and Miguel Aguila provided their support and guidance throughout the field experiment. Their timely suggestions during the experiment and writing have greatly improved the experiment design and the manuscript. All authors reviewed the final manuscript.

Conflicts of Interest

The authors declare no conflict of interest.

References

  1. Huo, Y.; Zhang, M.; Wang, H. Cost and economic benefit of cotton in Xinjiang. Arid Land Geogr. 2011, 34, 838–842. (In Chinese) [Google Scholar]
  2. Wang, J.S.; Wang, Y. Effect of dry seeding and wet budding of cotton with drip irrigation under plastic film. J. Tarim Univ. 2006, 18, 77–78, 81. (In Chinese) [Google Scholar]
  3. Chen, X.Q.; Wang, Z.H.; He, X.L.; Li, W.H.; Jiang, G.J. Effects of winter irrigation method on soil moisture, salt and temperature distribution on cotton fields of north Xinjiang. J. Soil Water Conserv. 2014, 28, 132–137. (in Chinese). [Google Scholar]
  4. Sun, S.M.; An, Q.X. Effects of salt movement after winter irrigation in Tarim irrigation area. J. Tarim Univ. 2008, 20, 24–37. (In Chinese) [Google Scholar]
  5. Cao, F.; Xu, X.; He, Y.M. Autumn irrigation in cotton fields and salt pressure alkali technical survey. China Cotton 2002, 5, 31–32. (In Chinese) [Google Scholar]
  6. Fan, G.S.; Zheng, X.Q.; Pan, G.Z. Experimental study on the influence of the buried depth of groundwater. J. Hydraul. Eng. 1999, 3, 22–27. (In Chinese) [Google Scholar]
  7. Jing, J.H.; Han, S.P.; Wang, X.Z.; Bai, M. The Mechanism of Water Movement in the Freezing-Thawing Process. Acta Geosci. Sin. 2007, 28, 50–54. (In Chinese) [Google Scholar]
  8. Li, X.W.; Jin, M.G.; Huang, J.O.; Yuan, J.J. The soil-water flow system beneath a cotton field in arid north-west China, serviced by mulched drip irrigation using brackish water. Hydrogeology. J. 2015, 23, 35–46. [Google Scholar] [CrossRef]
  9. Li, L.Q. Basic Knowledge of Saline Soil; Science Press: Beijing, China, 1986; pp. 58–62. (In Chinese) [Google Scholar]
  10. Shang, S.H.; Lei, Z.D.; Yang, S.X.; Wang, Y.; Zhao, D.M. Study on Soil Water Movement with Changeable Groundwater Level During Soil Freezing and Thawing. Trans. CSAE 1999, 15, 70–74. (In Chinese) [Google Scholar]
  11. Zhang, D.F.; Zheng, Q.H.; Dong, Z.Y. Mechanism of Soil Salt-moisture Transfer Under Freeze-thawing Condition. Bull. Soil Water Conserv. 2005, 25, 14–18. (In Chinese) [Google Scholar]
  12. Chen, N.J.; Song, P.Y.; Li, J.R. Research on soil water and salt transportation characteristics under the effect of frozen and thawing. Water Sav. Irrig. 2014, 5, 52–54, 58. (In Chinese) [Google Scholar]
  13. Li, R.P.; Shi, H.B.; Takeo, A.; Zhang, Y.Q. Characteristics of air temperature and water-salt transfer during freezing and thawing period. Trans. CSAE 2007, 23, 70–74. (In Chinese) [Google Scholar]
  14. Li, R.P.; Shi, H.B.; Wang, C.S.; Dai, J.X.; Zhang, X.Z. Effect of Autumn Irrigation on Soil Water and Salt Transfer for Freezing and Thawing Period. J. Irrig. Drain. 2010, 29, 43–46. (In Chinese) [Google Scholar]
  15. Chen, Y.M.; Wang, S.L.; Gao, Z.Y.; Guan, X.Y.; Hu, Y.Q. Modeling effects of different irrigation managements on root-zone soil salinity. J. Drain. Irrig. Mach. Eng. 2014, 32, 263–270. (In Chinese) [Google Scholar]
  16. Li, B.; Yang, Y.; Wang, S.M.; Tu, J.N.; Zhu, H.W.; Xia, J.; Cao, G.-D. Water temperature and salinity disturbing rules of the drip irrigation cotton field soil during freezing-thaw season in arid region. Xinjiang Agric. Sci. 2011, 48, 528–532. (In Chinese) [Google Scholar]
  17. Guo, Z.R.; Jing, E.C.; Nie, Z.L.; Jiao, P.C.; Dong, H. Analysis on the characteristics of soil moisture transfer during freezing and thawing period. Adv. Water Sci. 2002, 48, 298–302. (In Chinese) [Google Scholar]
  18. Chen, W.; Hou, Z.; Wu, L.; Liang, Y.; Wei, C. Evaluating salinity distribution in soil irrigated with saline water in arid regions of northwest China. Agric. Water Manag. 2010, 97, 2001–2008. (In Chinese) [Google Scholar] [CrossRef]
  19. Burt, C.M.; Isbell, B. Leaching of accumulated soil salinity under drip irrigation. Am. Soc. Agric. Eng. 2005, 48, 1–5. [Google Scholar]
  20. Hu, H.C.; Tian, F.Q.; Hu, H.P. Soil particle size distribution and its relationship with soil water and salt under mulched drip irrigation in Xinjiang of China. Sci. China Technol. Sci. 2011, 54, 1568–1574. (In Chinese) [Google Scholar] [CrossRef]

