
Impact of the Municipal Solid Waste Łubna Landfill on Environmental Pollution by Heavy Metals

 , and
, and
Abstract
:
1. Introduction
- -
- What is the impact of the long-term use of an uncontrolled landfill on environmental pollution by heavy metals in groundwater, soil, and plants?
- -
- Do installed protection systems effectively reduce environmental pollution by heavy metals around landfills?
2. Materials and Methods
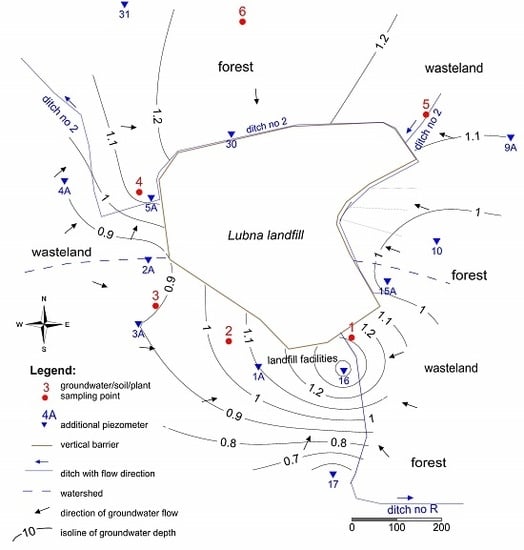
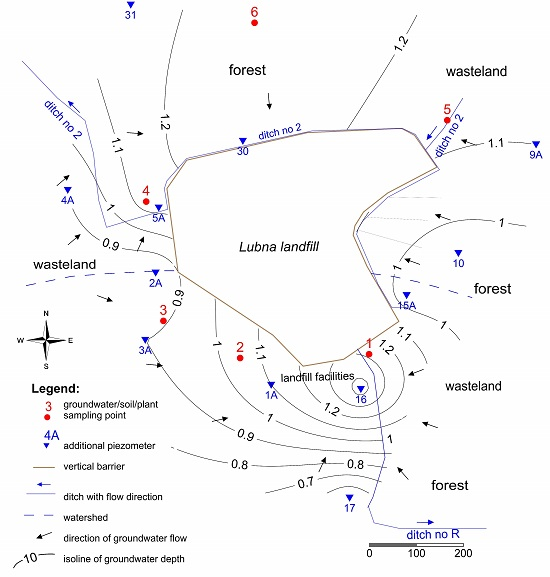
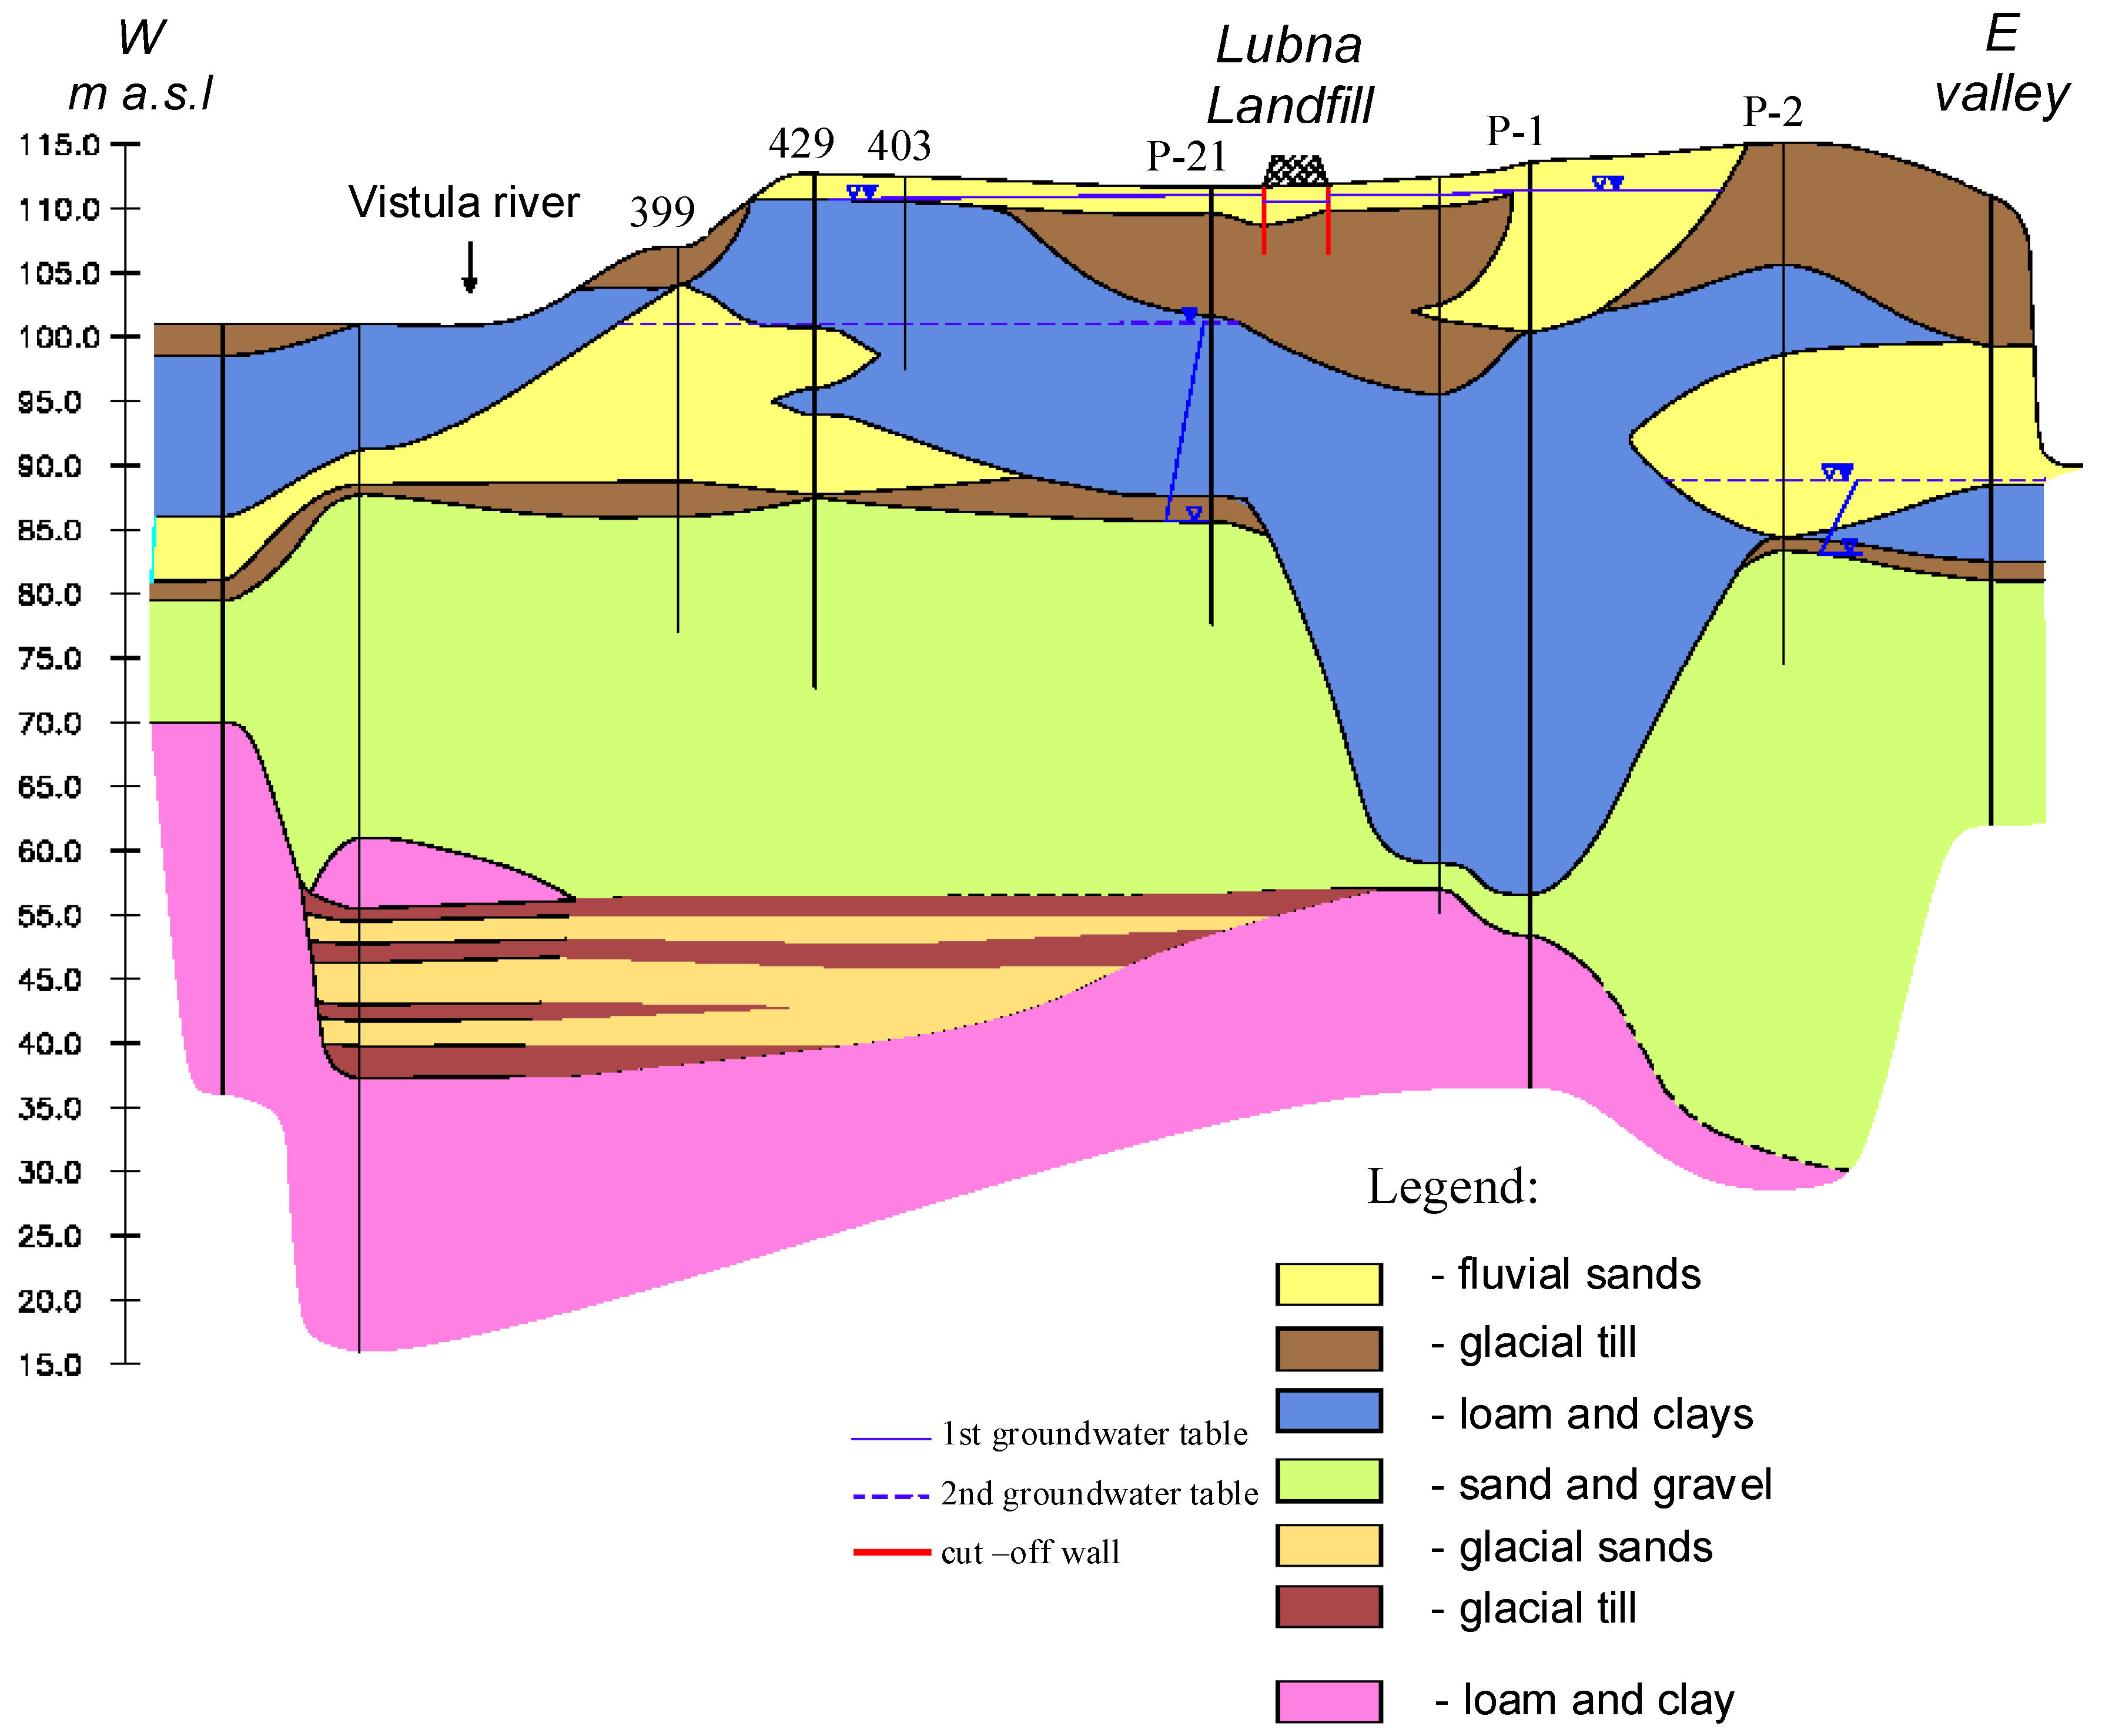
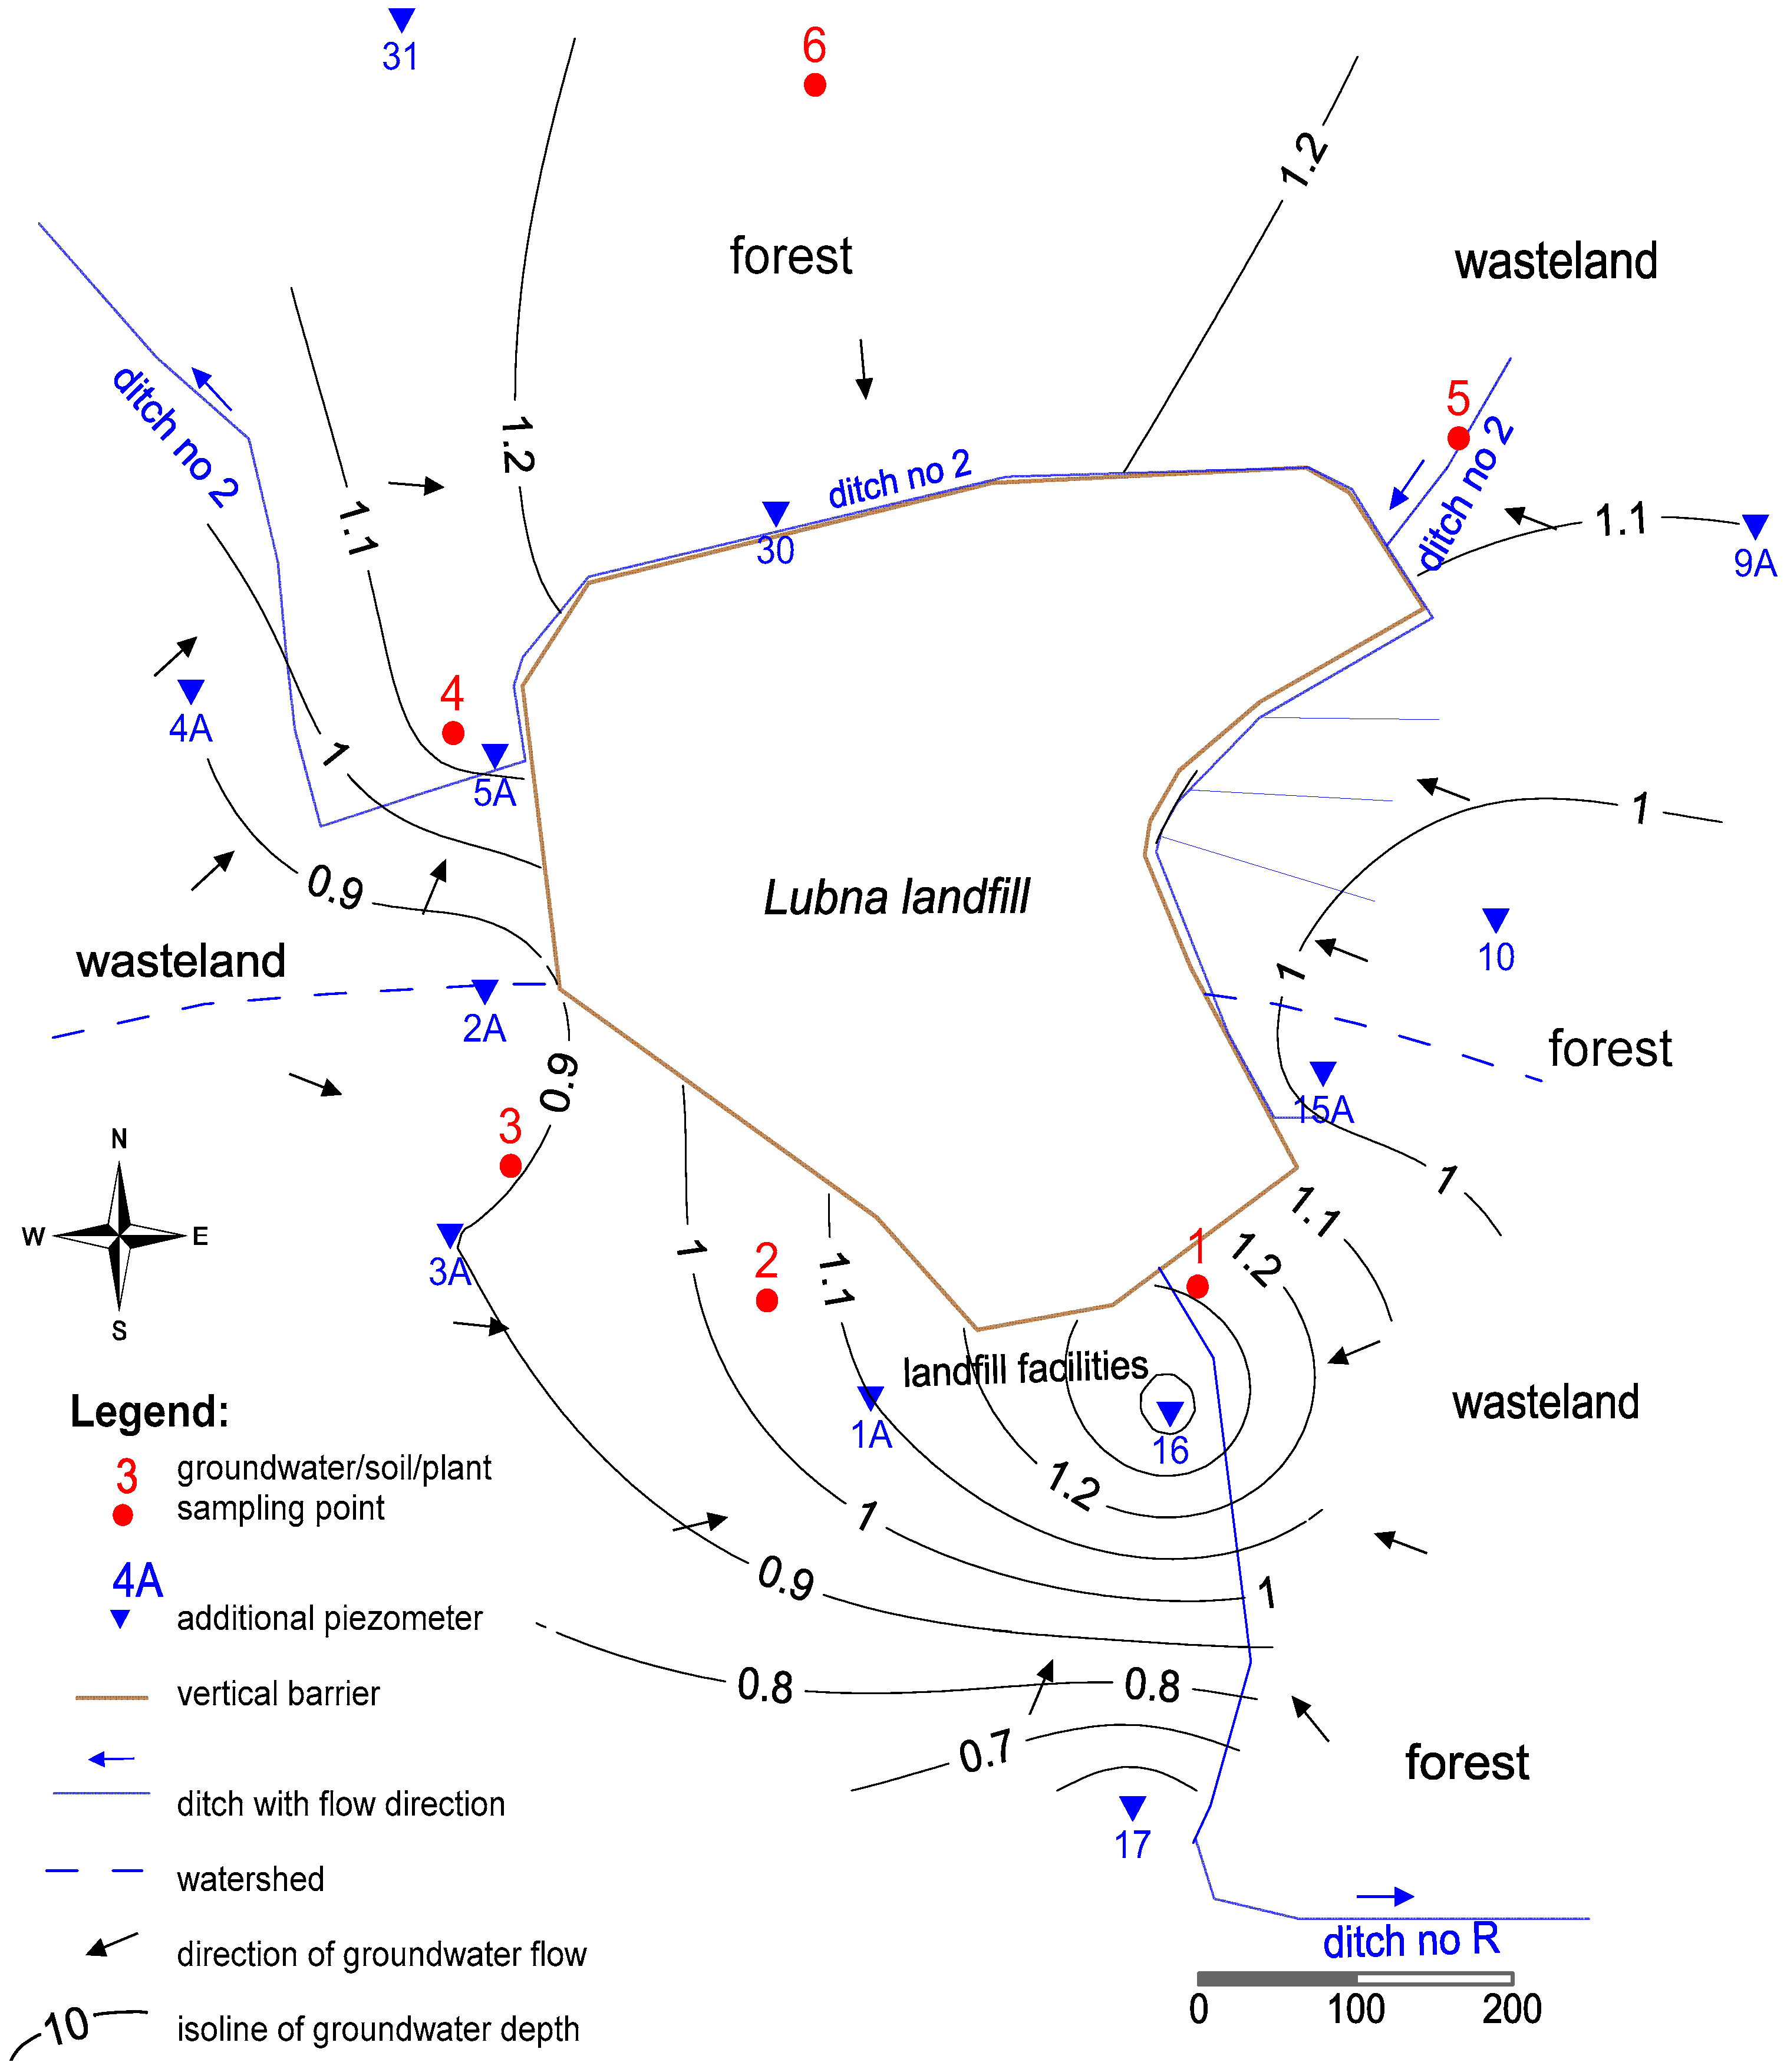
2.1. Geological Structure and Hydrogeological Conditions of the Study Area
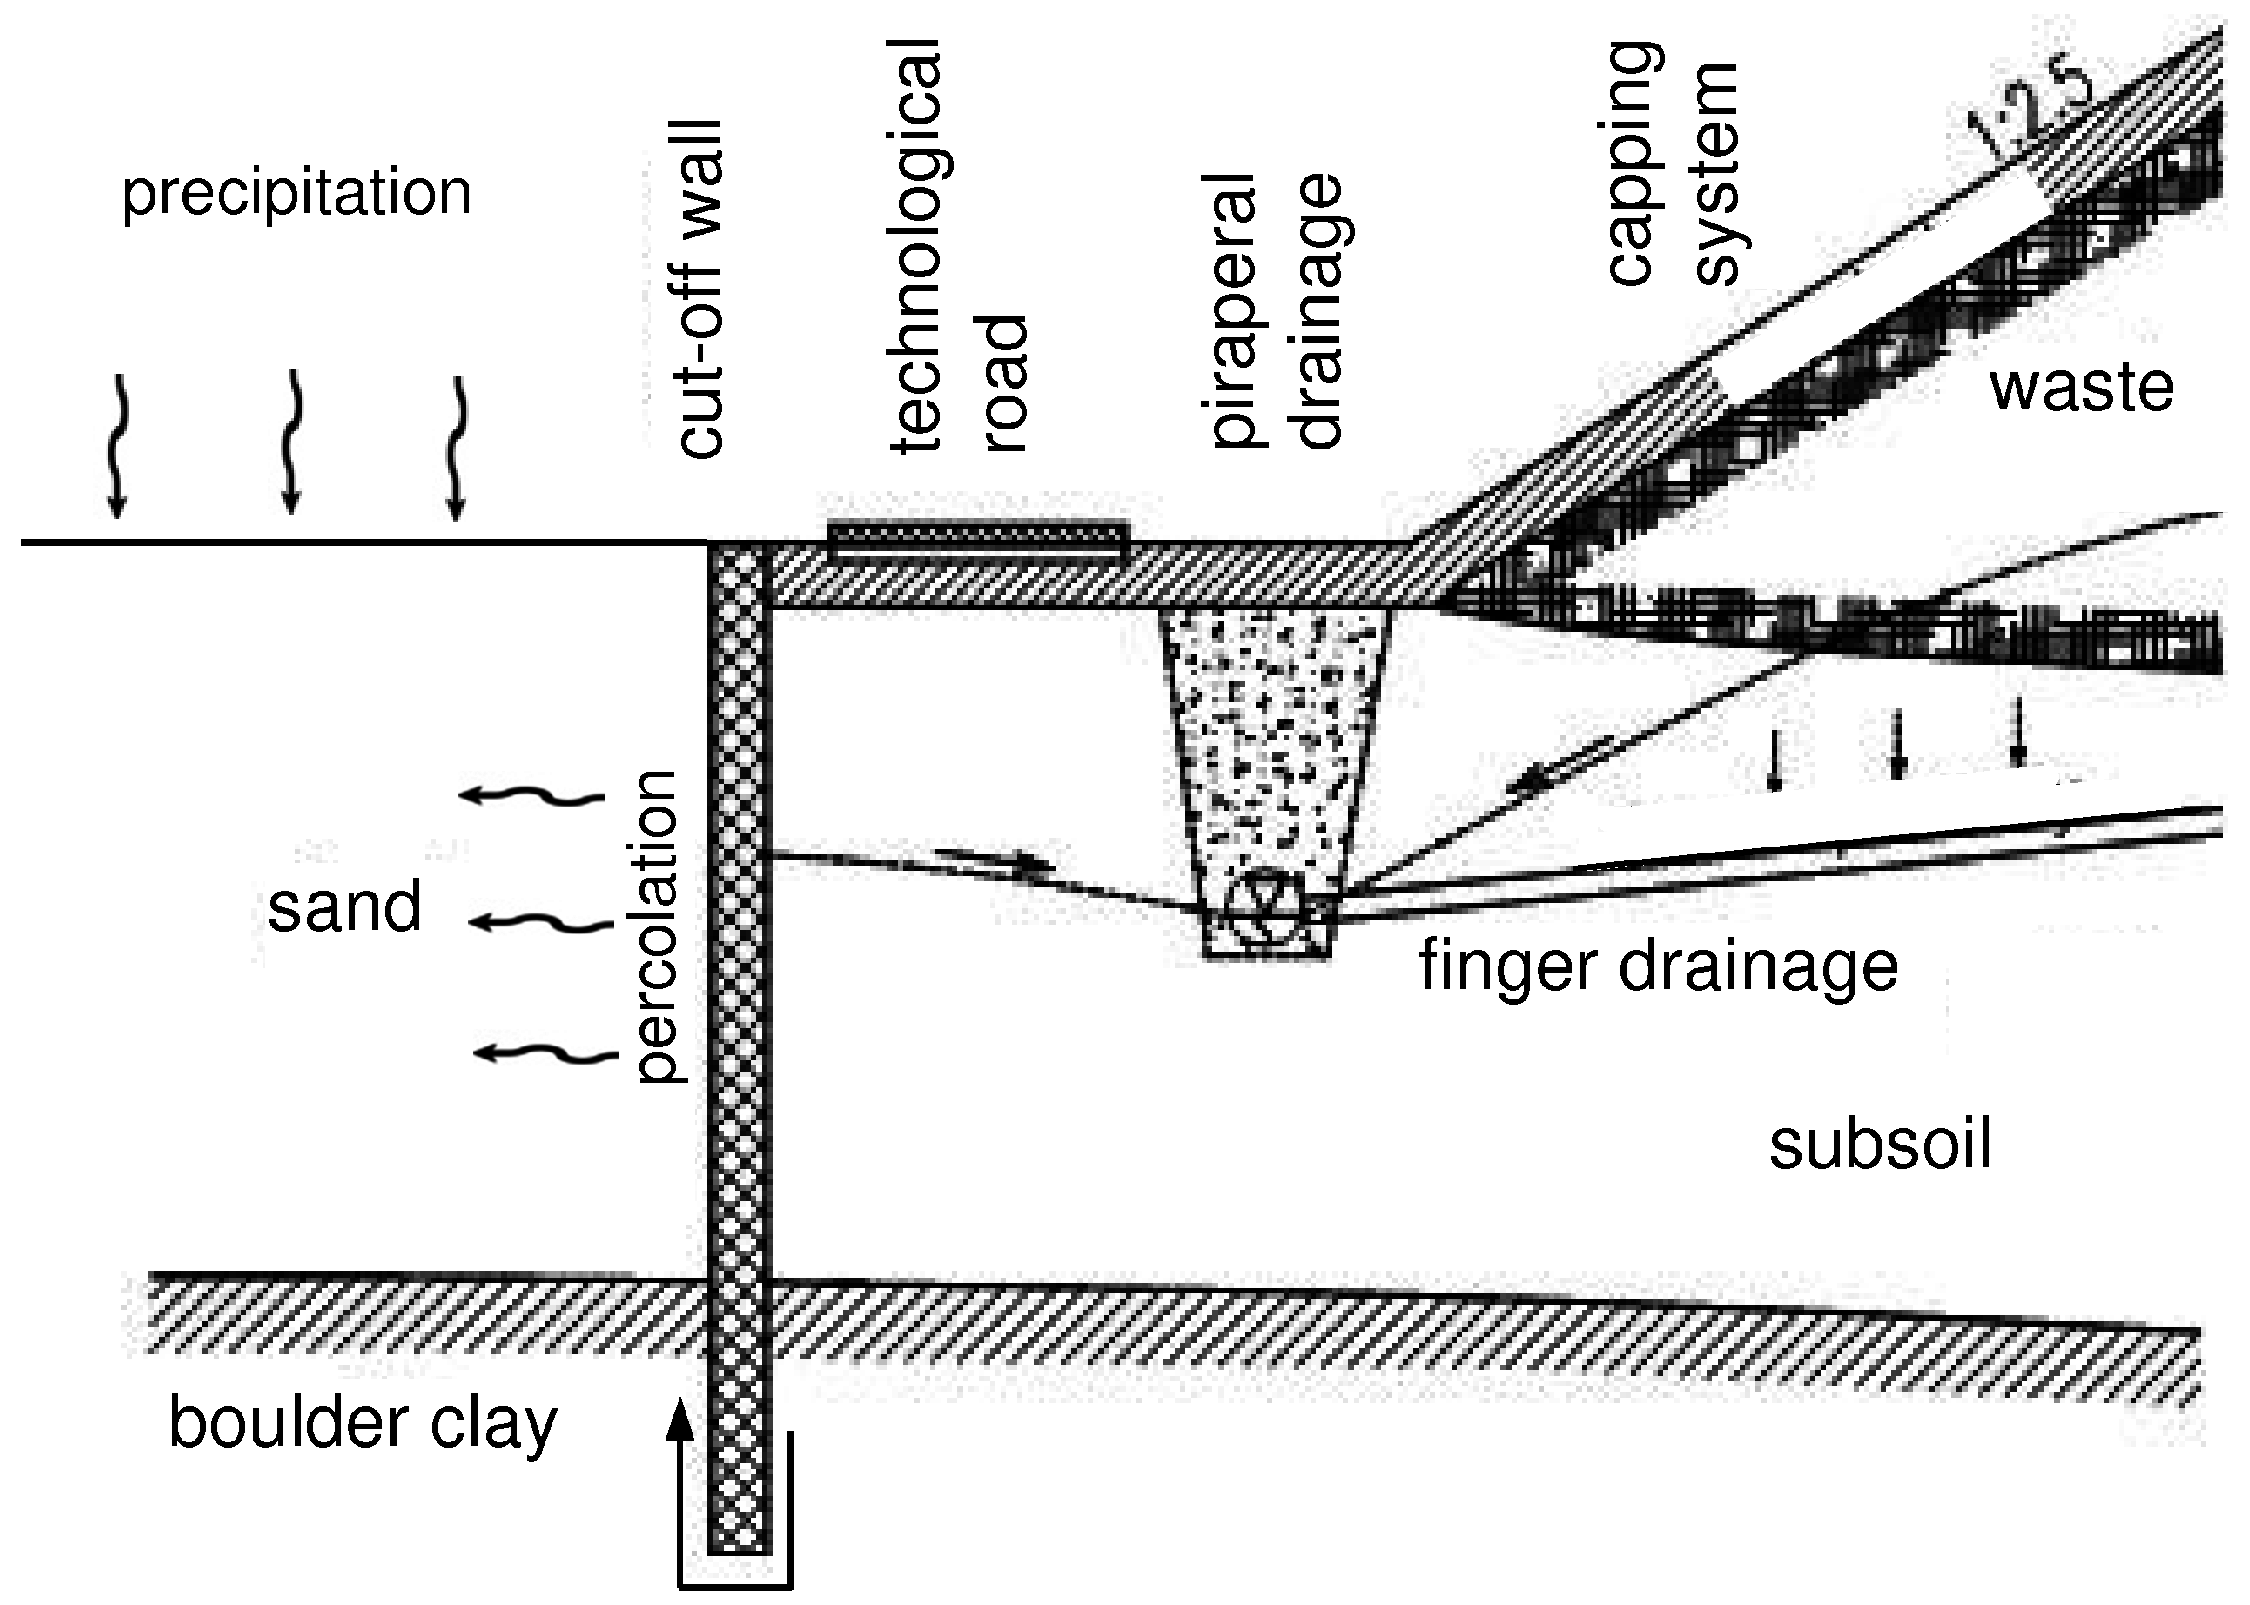
2.2. History and Condition of the Landfill
2.3. Methodology of the Study
- -
- Biological Accumulation Coefficient (BAC), which expresses the ratio of metal concentration in plants to its concentration in soil (0–0.25 m):BAC = Meplant/Mesoil(0–25 cm)
- -
- Mobility Ratio, which expresses the ratio of metal concentration in soil (0–0.25 m) to its concentration in groundwater:MR = Mesoil(0–25 cm)/Megroundwater
3. Results and Discussion
4. Conclusions
Author Contributions
Conflicts of Interest
References
- El-Fadel, M.; Findikakis, A.N.; Leckie, J.O. Environmental impacts of solid waste landfilling. J. Environ. Manag. 1997, 50, 1–25. [Google Scholar] [CrossRef]
- Adamczyk, I.; Różańska, B.; Sobczyk, M. Infrastruktura Komunalna w 2014 r. Environment; Central Statistical Office: Warsaw, Poland, 2015.
- Slack, R.J.; Gronow, J.R.; Voulvoulis, N. Household hazardous waste in municipal landfills: Contaminants in leachate. Sci. Total Environ. 2005, 337, 119–137. [Google Scholar] [CrossRef] [PubMed]
- Baumann, T.; Fruhstorfer, P.; Klein, T.; Niessner, R. Colloid and heavy metal transport at landfill sites in direct contact with groundwater. Water Res. 2006, 40, 2776–2786. [Google Scholar] [CrossRef] [PubMed]
- Prechthai, T.; Parkpian, P.; Visvanathan, C. Assessment of heavy metal contamination and its mobilization from municipal solid waste open dumping site. J. Hazard. Mater. 2008, 156, 86–94. [Google Scholar] [CrossRef] [PubMed]
- Xie, S.; Ma, Y.; Strong, P.J.; Clarke, W.P. Fluctuation of dissolved heavy metal concentrations in the leachate from anaerobic digestion of municipal solid waste in commercial scale landfill bioreactors: The effect of pH and associated mechanisms. J. Hazard. Mater. 2015, 299, 577–583. [Google Scholar] [CrossRef] [PubMed]
- Adhikari, K.; Pal, S. Assessment of Pollution Potential of Soil and Groundwater in a Non-Engineered MSW Landfill Site. Intern. J. Environ. Sci. Dev. 2016, 7, 207–210. [Google Scholar] [CrossRef]
- Tałałaj, I.A. Release of Heavy Metals on Selected Municipal Landfill during the Calendar Year. Ann. Set. Environ. Prot. 2014, 16, 404–420. [Google Scholar]
- Council Directive 99/31/EC of 26 April 1999 on the Landfill of Waste Entered. Available online: http://eur-lex.europa.eu/legal-content/en/TXT/?uri=CELEX:31999L0031 (accessed on 18 October 2016).
- Kurniawan, T.A.; Lo, W.H. Removal of refractory compounds from stabilized landfill leachate using an integrated H2O2 oxidation and granular activated carbon (GAC) adsorption treatment. Water Res. 2009, 43, 4079–4091. [Google Scholar] [CrossRef] [PubMed]
- Alagić, S.Č.; Šerbula, S.S.; Tošić, S.B.; Pavlović, A.N.; Petrović, J.V. Bioaccumulation of Arsenic and Cadmium in Birch and Lime from the Bor Region. Arch. Environ. Contam. Toxicol. 2013, 65, 671–682. [Google Scholar] [CrossRef] [PubMed]
- Troschinetz, A.M.; Mihelcic, J.R. Sustainable recycling of municipal solid waste in developing countries. Waste Manag. 2009, 29, 915–923. [Google Scholar] [CrossRef] [PubMed]
- Othman, E.; Yusoff, M.S.; Aziz, H.A.; Adlan, M.N.; Bashir, M.J.; Hung, Y.T. The effectiveness of silica sand in semi-aerobic stabilized landfill leachate treatment. Water 2009, 2, 904–915. [Google Scholar] [CrossRef]
- Koda, E.; Osiński, P.; Kołanka, T. Flow numerical modeling for efficiency assessment of vertical barriers in landfills. In Coupled Phenomena in Environmental Geotechnics; Manassero, M., Dominijanni, A., Foti, S., Musso, G., Eds.; Taylor & Francis Group: London, UK, 2013; pp. 693–697. [Google Scholar]
- Koda, E.; Osinski, P.; Sieczka, A.; Wychowaniak, D. Areal Distribution of Ammonium Contamination of Soil-Water Environment in the Vicinity of Old Municipal Landfill Site with Vertical Barrier. Water 2015, 7, 2656–2672. [Google Scholar] [CrossRef]
- Gworek, B.; Dmuchowski, W.; Gozdowski, D.; Koda, E.; Osiecka, R.; Borzyszkowski, J. Influence of a Municipal Waste Landfill on the Spatial Distribution of Mercury in the Environment. PLoS ONE 2015, 10. [Google Scholar] [CrossRef] [PubMed]
- Koda, E.; Pachuta, K.; Osiński, P. Potential of plants application in the initial stage of landfill reclamation process. Pol. J. Environ. Stud. 2013, 22, 1731–1739. [Google Scholar]
- Koda, E. Influence of vertical barrier surrounding old sanitary landfill on eliminating transport of pollutants on the basis of numerical modelling and monitoring results. Pol. J. Environ. Stud. 2012, 21, 929–935. [Google Scholar]
- Golimowski, J.; Koda, E. Assessment of remedial works effectiveness on water quality in the vicinity of Łubna landfill based on monitoring research. Ann. Wars. Agric. Univ. Land Reclam. 2001, 32, 17–30. [Google Scholar]
- Allen, S.E.; Grimsha, W.H.N.; Parkinson, J.A.; Quarmby, C. Chemical Analysis of Ecological Materials; Blackwell Scientific Publications: Osney Mead, UK, 1974. [Google Scholar]
- Ahmed, A.M.; Sulaiman, W.N. Evaluation of groundwater and soil pollution in a landfill area using electrical resistivity imaging survey. Environ. Manag. 2001, 28, 655–663. [Google Scholar]
- Jain, P.; Kim, H.; Townsend, T.G. Heavy metal content in soil reclaimed from a municipal solid waste landfill. Waste Manag. 2005, 25, 25–35. [Google Scholar] [CrossRef] [PubMed]
- Amusan, A.A.; Ige, D.V.; Olawale, R. Characteristics of Soils and Crops’ Uptake of Metals in Municipal Waste Dump Sites in Nigeria. J. Hum. Ecol. 2005, 17, 167–171. [Google Scholar]
- Kasassi, A.; Rakimbei, P.; Karagiannidis, A.; Zabaniotou, A.; Tsiouvaras, K.; Nastis, A.; Tzafeiropoulou, K. Soil contamination by heavy metals: Measurements from a closed unlined landfill. Bioresour. Technol. 2008, 99, 8578–8584. [Google Scholar] [CrossRef] [PubMed]
- Mari, M.; Nadal, M.; Schuhmacher, M.; Domingo, J.L. Exposure to heavy metals and PCDD/Fs by the population living in the vicinity of a hazardous waste landfill in Catalonia, Spain: Health risk assessment. Environ. Intern. 2009, 35, 1034–1039. [Google Scholar] [CrossRef] [PubMed]
- Aucott, M. The Fate of Heavy Metals in Landfills: A Review; New Jersey Department of Environmental Protection: Trenton, NJ, USA, 2006.
- Regulation of the Minister of Health Dated 13 November 2015, on the Quality of Water Intended for Human Consumption. Journal of Laws 2015, item 1989. Available online: http://isap.sejm.gov.pl/DetailsServlet?id=WDU20150001989 (accessed on 18 October 2016).
- Øygard, J.K.; Måge, A.; Gjengedal, E. Estimation of the mass-balance of selected metals in four sanitary landfills in Western Norway, with emphasis on the heavy metal content of the deposited waste and the leachate. Water Res. 2004, 38, 2851–2858. [Google Scholar] [CrossRef] [PubMed]
- Mor, S.; Ravindra, K.; Dahiya, R.P.; Chandra, A. Leachate characterization and assessment of groundwater pollution near municipal solid waste landfill site. Environ. Monit. Assess. 2006, 118, 435–456. [Google Scholar] [CrossRef] [PubMed]
- Longe, E.O.; Balogun, M.R. Groundwater quality assessment near a municipal landfill, Lagos, Nigeria. Int. J. Environ Sci. Dev. 2010, 2, 39–44. [Google Scholar]
- Singh, U.K.; Kumar, M.; Chauhan, R.; Jha, P.K.; Ramanathan, A.L.; Subramanian, V. Assessment of the impact of landfill on groundwater quality: A case study of the Pirana site in western India. Environ. Monit. Assess. 2008, 141, 309–321. [Google Scholar] [CrossRef] [PubMed]
- Biswas, A.K.; Kumar, S.; Babu, S.S.; Bhattacharyya, J.K.; Chakrabarti, T. Studies on environmental quality in and around municipal solid waste dumpsite. Resour. Conserv. Recycl. 2010, 55, 129–134. [Google Scholar] [CrossRef]
- Al Sabahi, E.; Rahim, S.A.; Wan Zuhairi, W.Y.; Nozaily, F.A.; Alshaebi, F. The characteristics of leachate and groundwater pollution at municipal solid waste landfill of Ibb City, Yemen. Am. J. Environ. Sci. 2009, 5, 256–266. [Google Scholar] [CrossRef]
- Olivero-Verbel, J.; Padilla-Bottet, C.; De la Rosa, O. Relationships between physicochemical parameters and the toxicity of leachates from a municipal solid waste landfill. Ecotoxicol. Environ. Saf. 2008, 70, 294–299. [Google Scholar] [CrossRef] [PubMed]
- Christensen, T.H.; Kjeldsen, P.; Albrechtsen, H.-J.; Heron, G.; Nielson, P.H.; Bjerg, P.L.; Holm, P.E. Attenuation of landfill leachate pollutants in aquifers. Crit. Rev. Environ. Sci. Technol. 1994, 24, 119–202. [Google Scholar] [CrossRef]
- Fatta, D.; Papadopoulos, A.; Loizidou, M. A study on the landfill leachate and its impact on the groundwater quality of the greater area. Environ. Geochem. Health 1999, 21, 175–190. [Google Scholar] [CrossRef]
- Mikac, N.; Cosovic, B.; Ahel, M.; Andreis, S.; Toncic, Z. Assessment of groundwater contamination in the vicinity of a municipal solid waste landfill (Zagreb, Croatia). Water Sci. Technol. 1998, 37, 37–44. [Google Scholar] [CrossRef]
- Kabata-Pendias, A.; Pendias, H. Trace Elements in Soils and Plants, 3rd ed.; CRC Press: Boca Raton, FL, USA, 2001. [Google Scholar]
- Regulation of the Ministry of Environment of 09 September 2002 Concerning Soil Quality Standards and Quality Standards of Soil. Journal of Laws 2002, No 165, item 1359. Available online: http://isap.sejm.gov.pl/DetailsServlet?id=WDU20021651359 (accessed on 18 October 2016).
- Kondras, M.; Czepinska-Kaminska, D.; Chodkowska, A.; Chrzanowska, A. The ecotoxicological assessment of the soil in the area of Lubna waste landfill. Rocz. Gleb. 2010, 61, 105–112. (In Polish) [Google Scholar]
- Dmuchowski, W.; Gazdowski, D.; Brągoszewska, P.; Baczewska, A.H.; Suwara, I. Phytoremediation of zinc contaminated soils using silver birch (Betula pendula Roth). Ecol. Eng. 2014, 71, 32–35. [Google Scholar] [CrossRef]
- Kołodziej, B. Goldenrod (Solidago virgaurea L. ssp. virgaurea) reaction to foliar fertilization. Ann. UMCS Agric. 2008, 63, 1–9. [Google Scholar]
- Łaszewska, A.; Kowol, J.; Wiechuła, D.A.; Kwapuliński, J. Bioaccumulation of metals in selected species of medicinal plants in the Silesian and Żywiec Beskids. Problemy Ekologii 2007, 11, 285–291. (In Polish) [Google Scholar]


| Element | Polish Standard [27] | Average Concentration in Groundwater (mg/L) during Monitoring Period | ||||||
|---|---|---|---|---|---|---|---|---|
| (mg·dm−3) | 1 | 2 | 3 | 4 | 5 | 6 | All Piezometers | |
| 1994–1998 | ||||||||
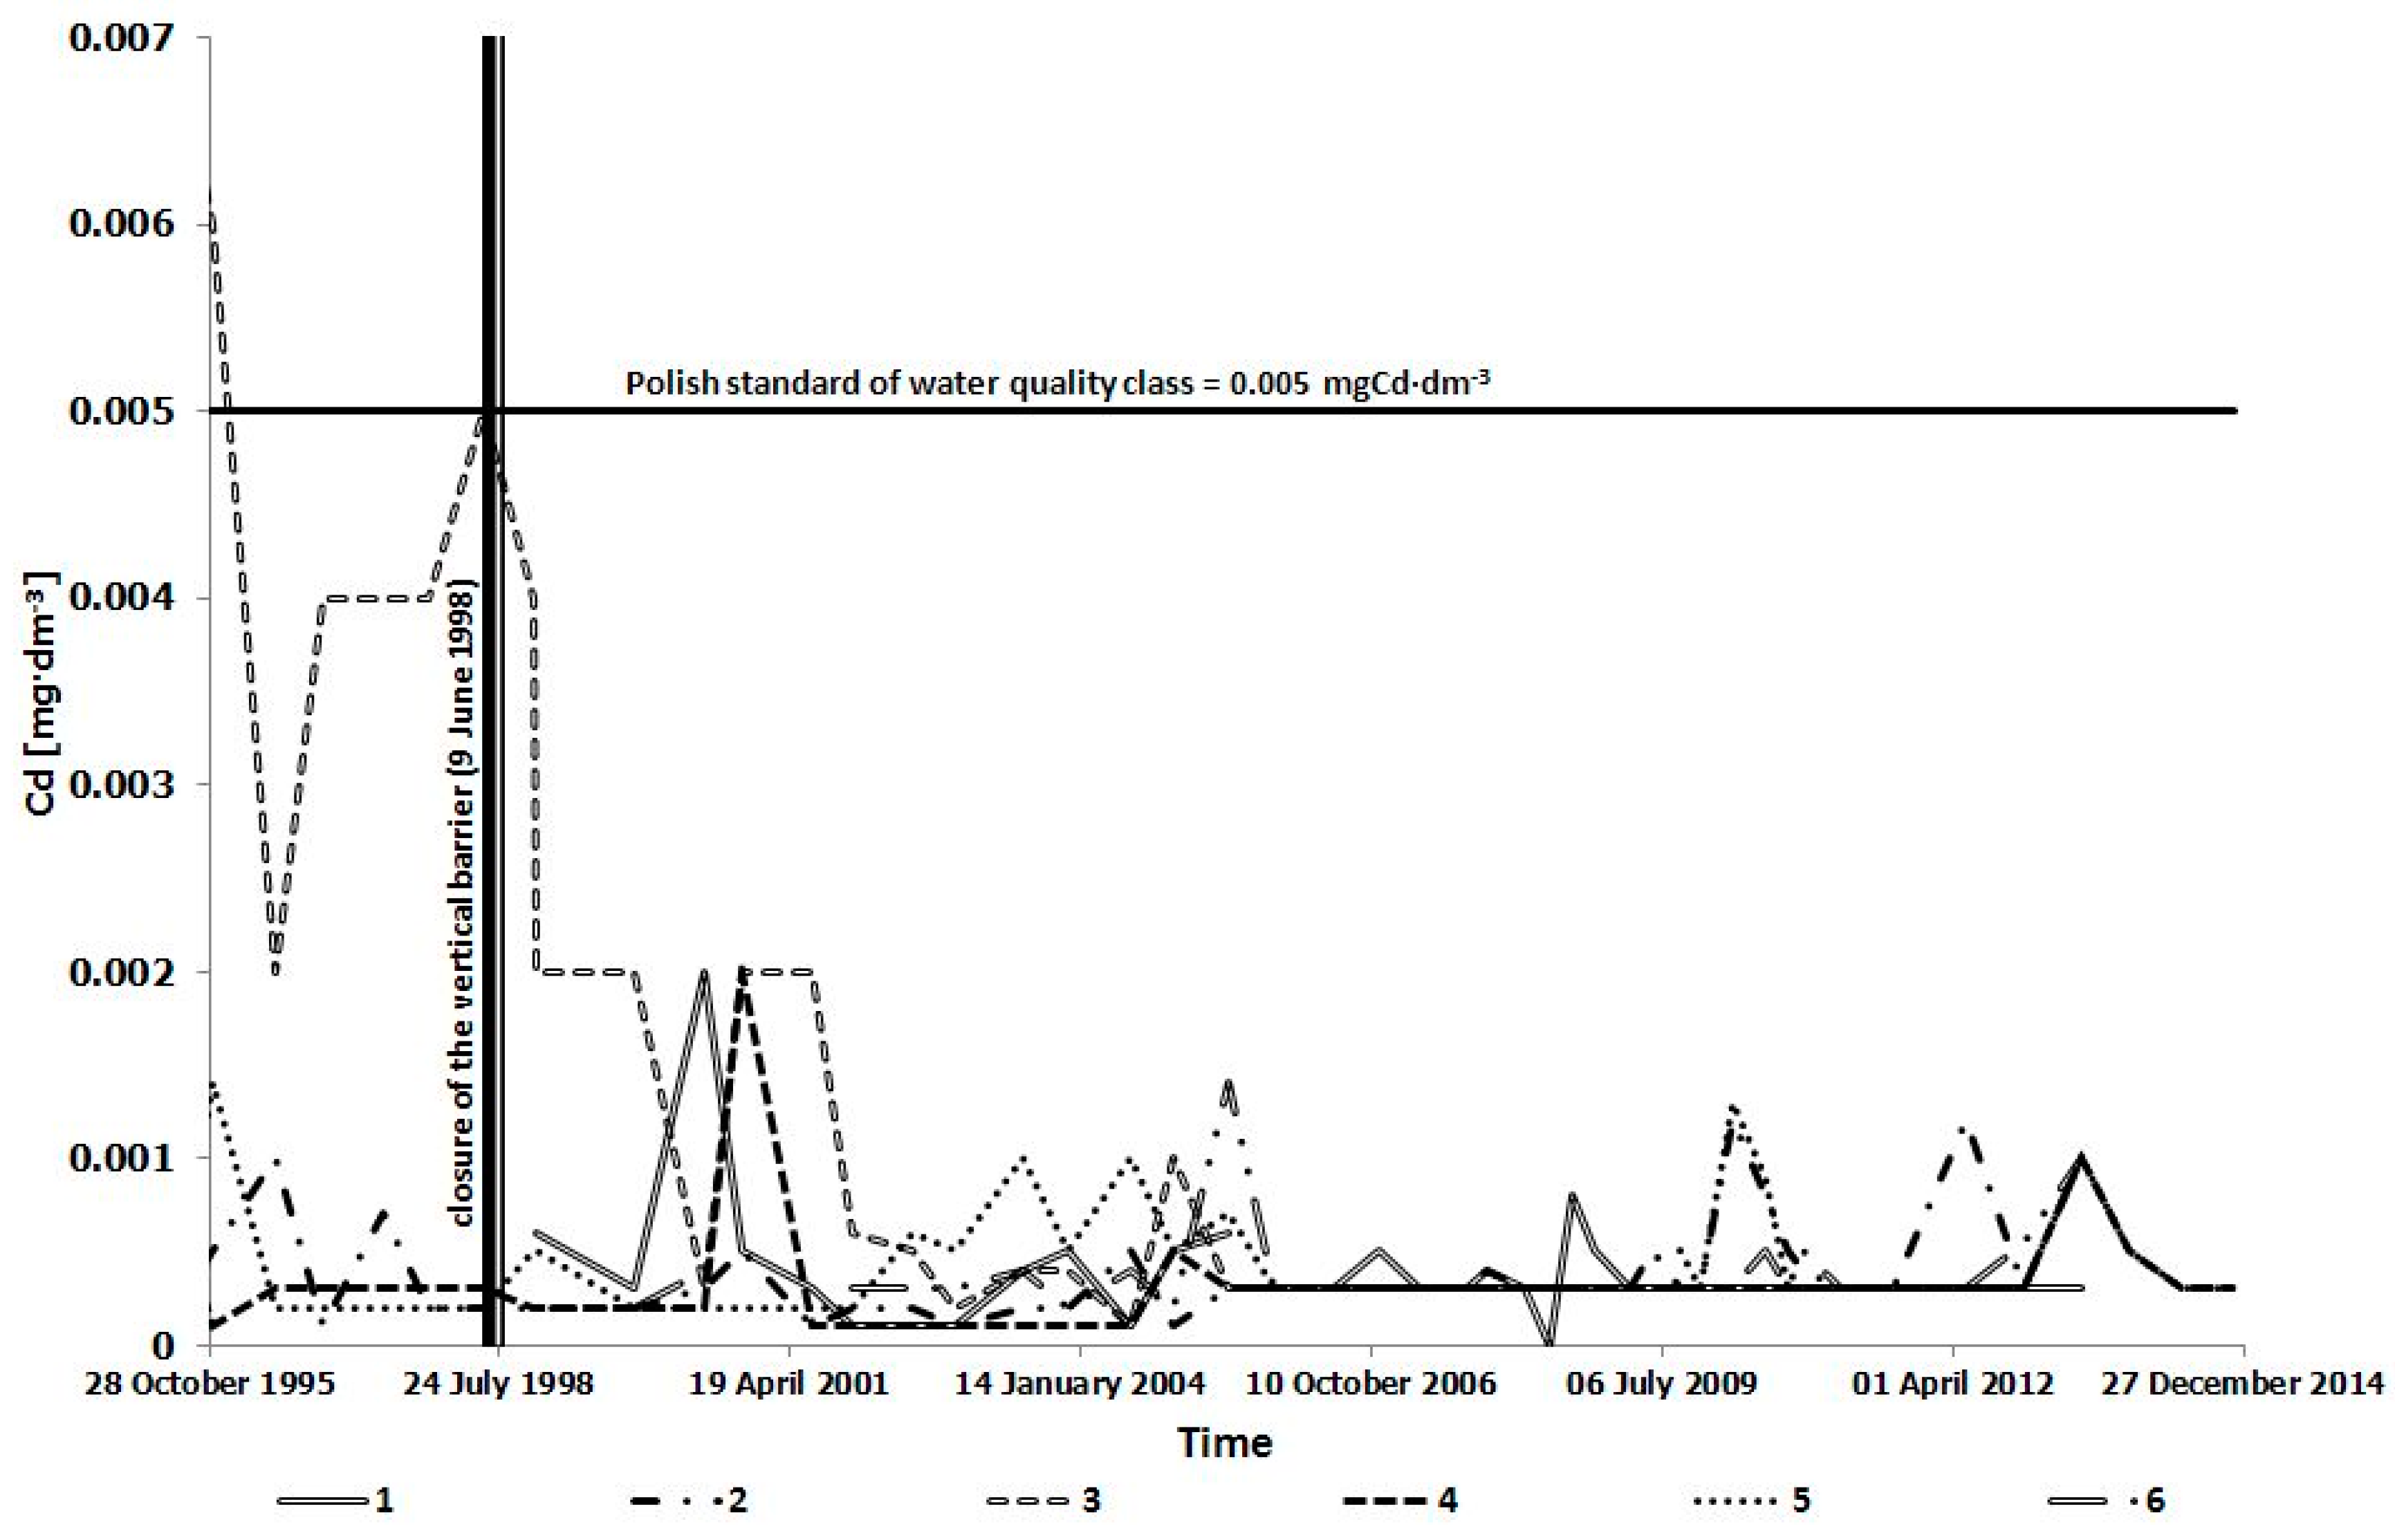
| Cd | 0.005 | - | 0.0008 ± 0.0009 | 0.007 ± 0.003 | 0.0005 ± 0.0003 | 0.0008 ± 0.0007 | - | 0.0023 ± 0.0012 |
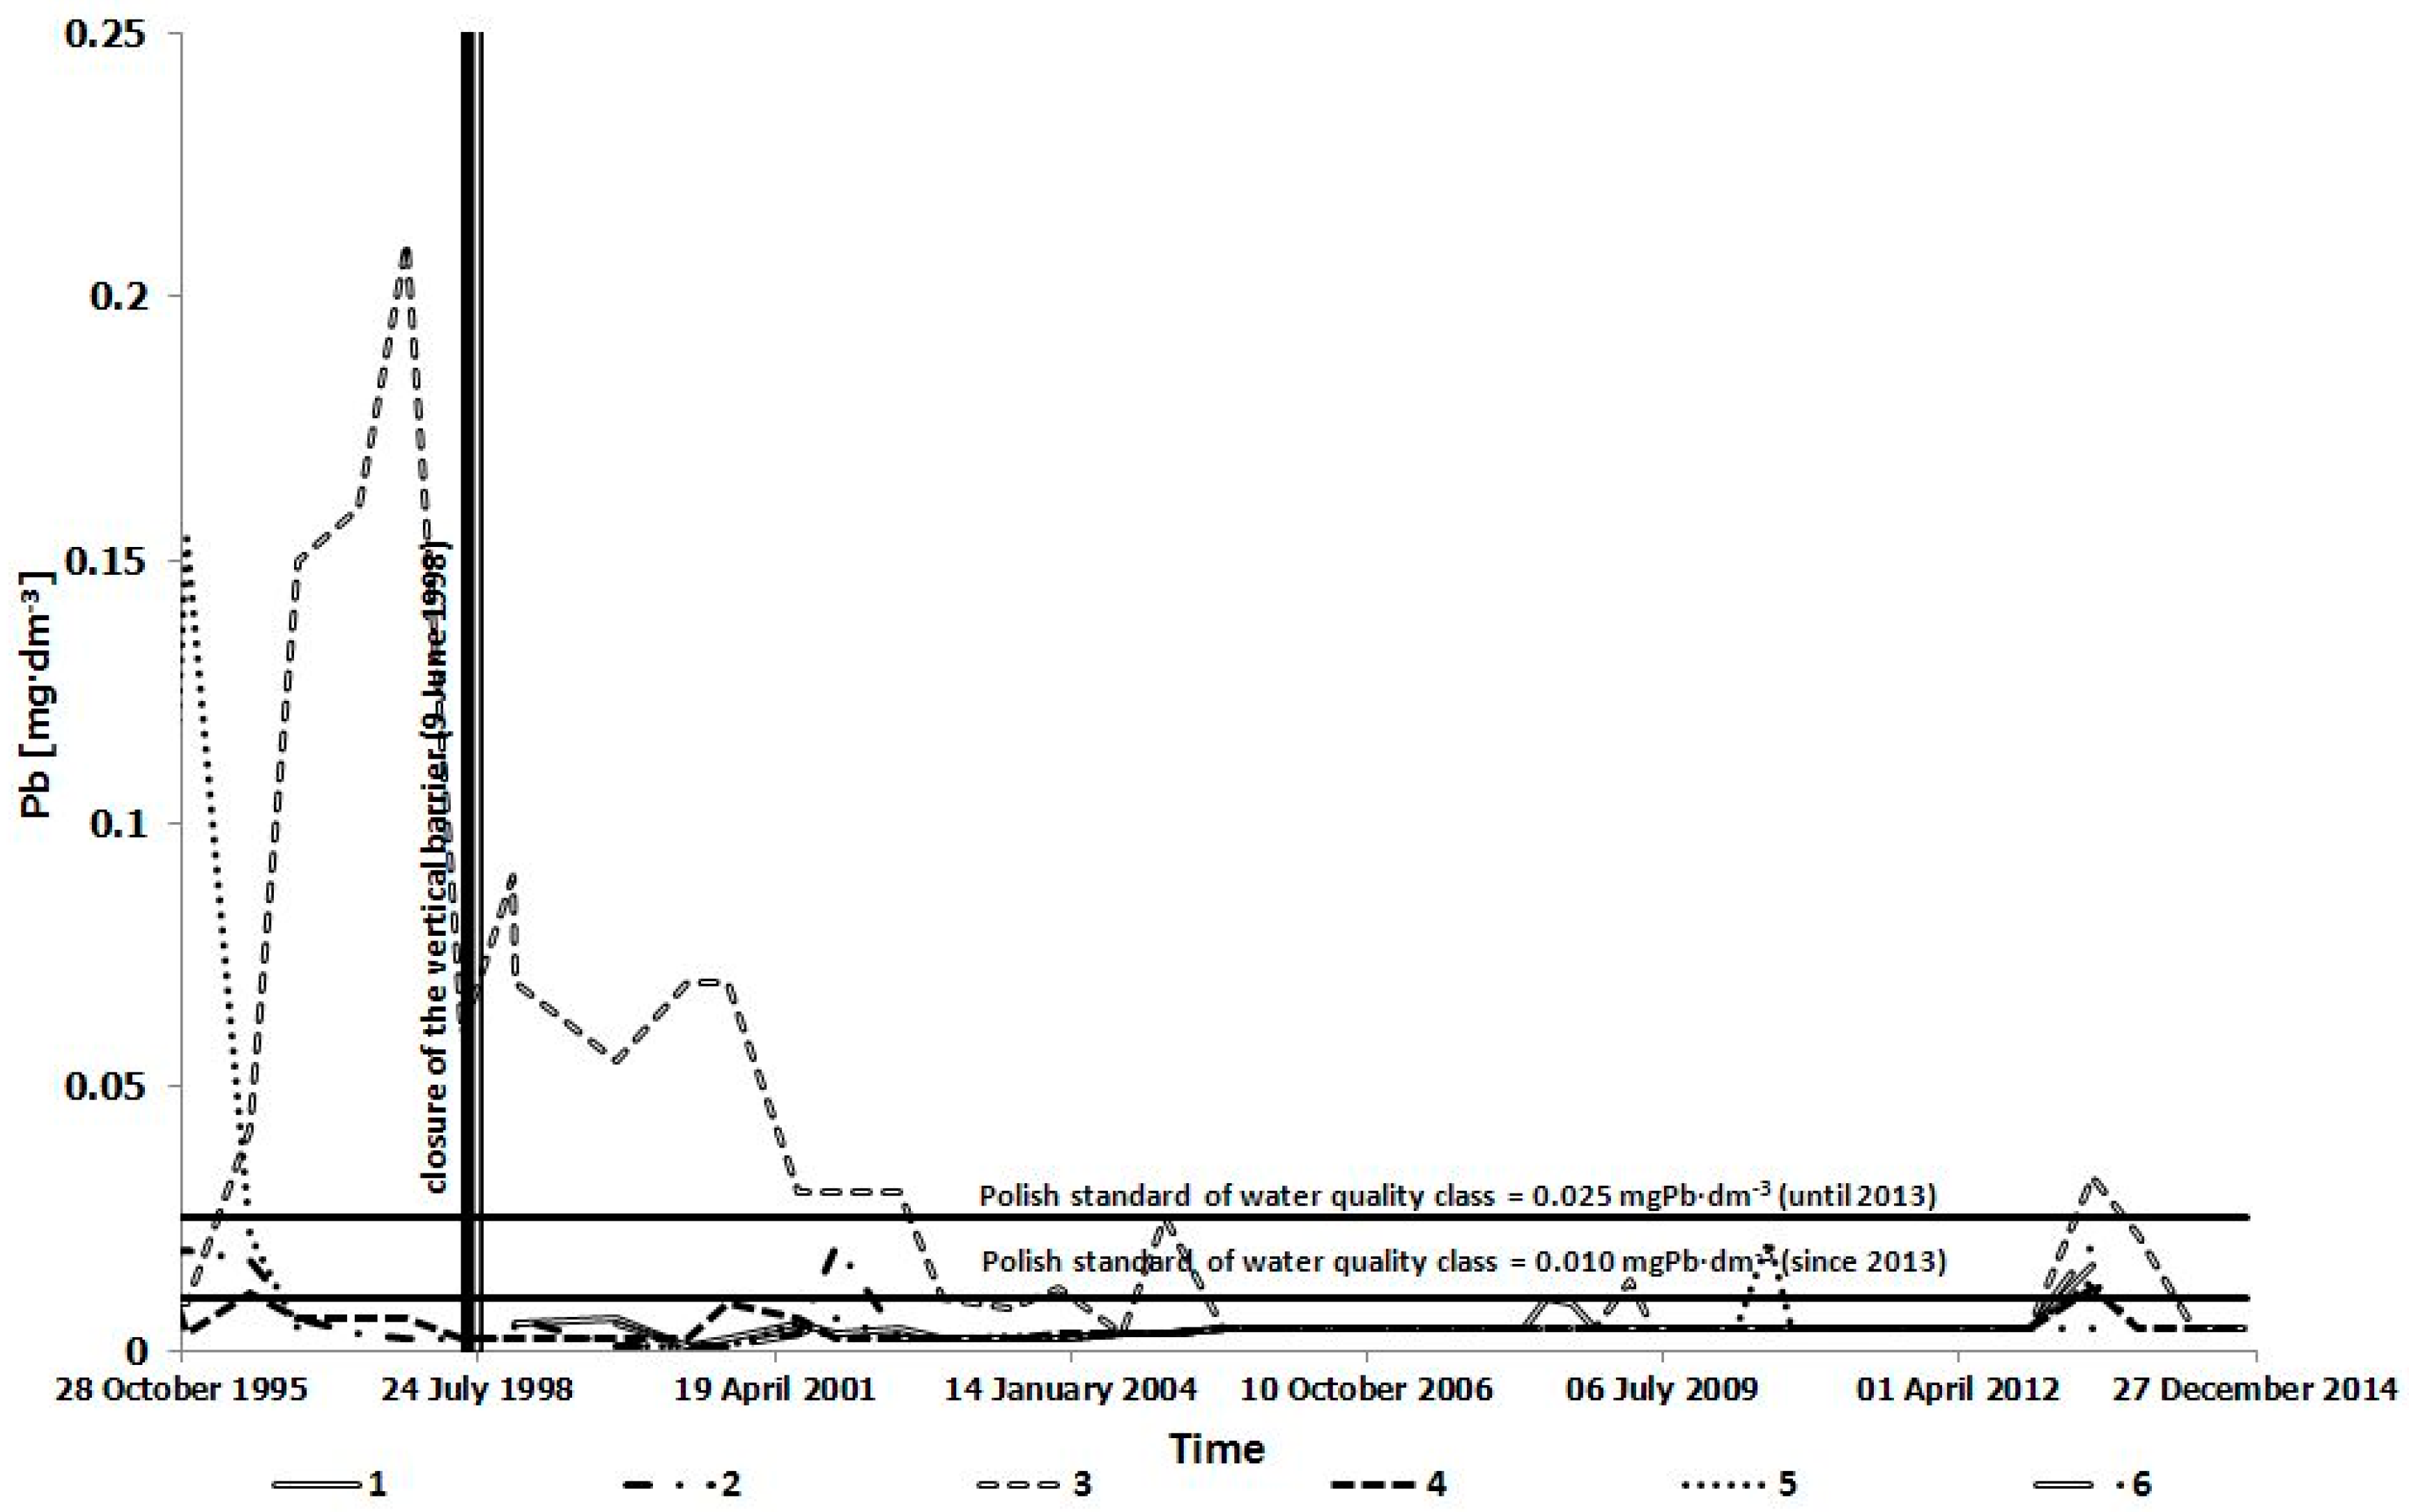
| Pb | 0.025/0.010 | - | 0.011 ± 0.007 | 0.080 ± 0.075 | 0.015 ± 0.014 | 0.035 ± 0.059 | - | 0.035 ± 0.039 |
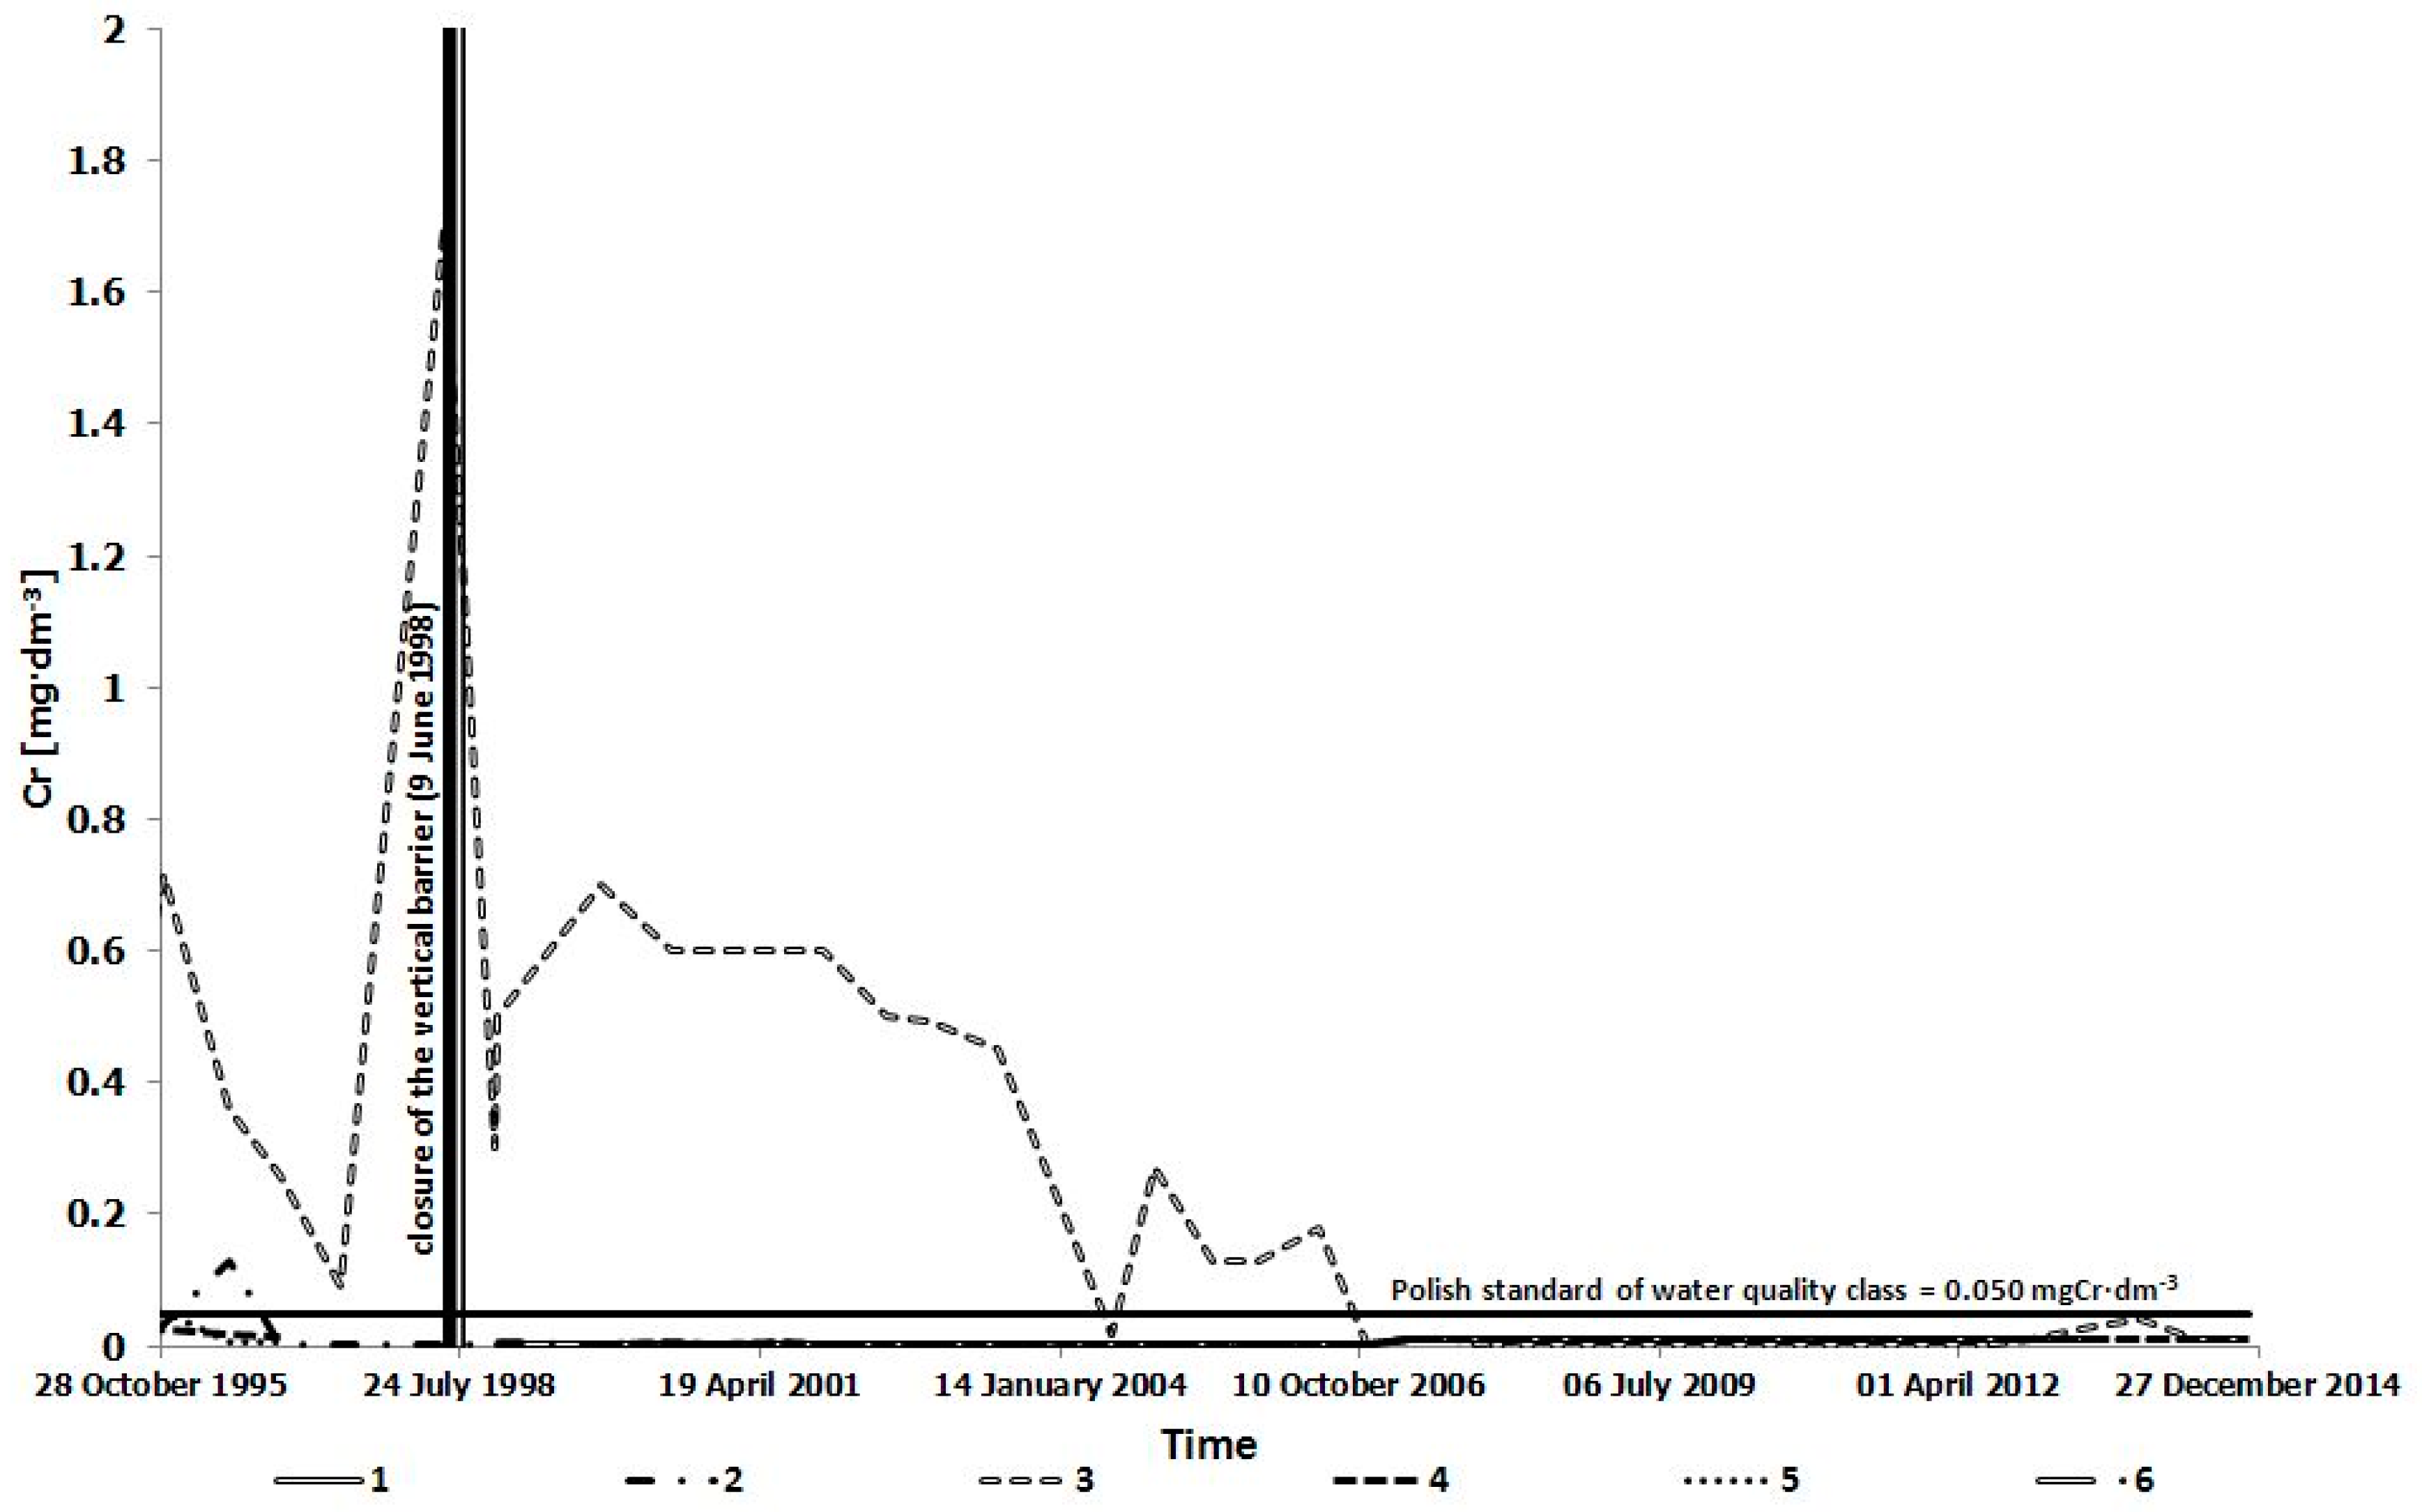
| Cr | 0.050 | - | 0.024 ± 0.042 | 0.531 ± 0.512 | 0.023 ± 0.007 | 0.047 ± 0.075 | - | 0.156 ± 0.159 |
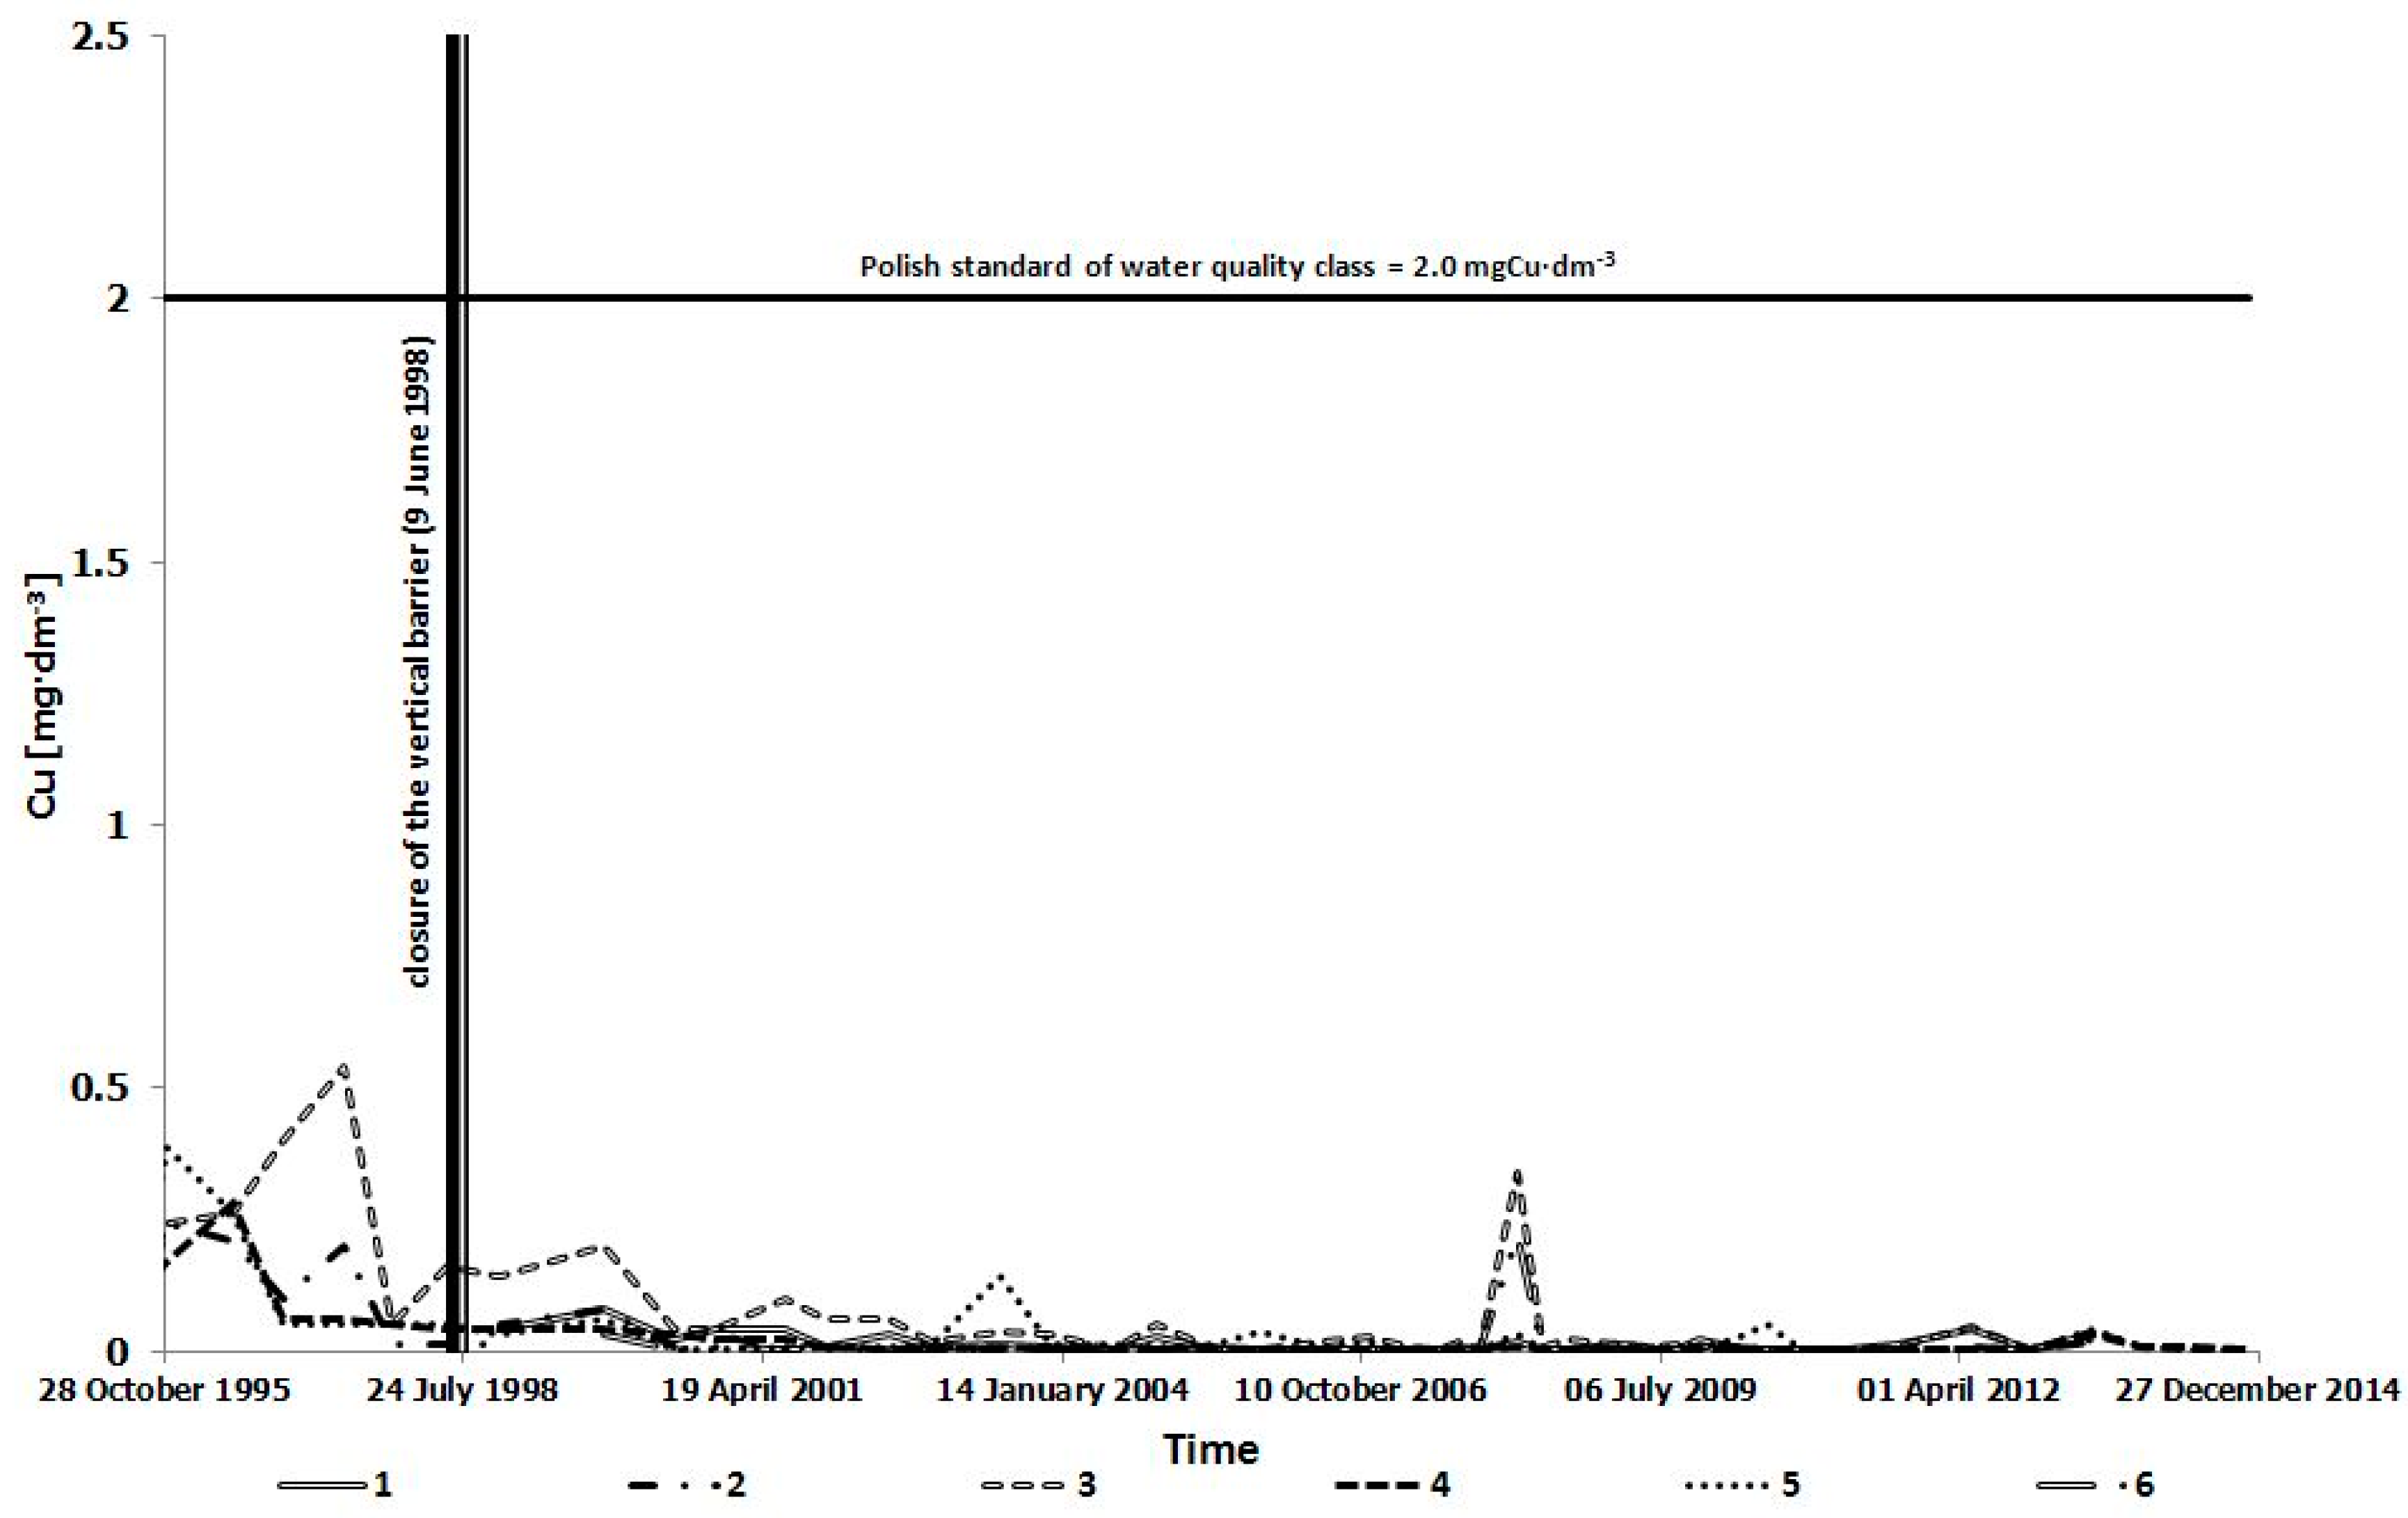
| Cu | 2.0 | - | 0.110 ± 0.097 | 0.226 ± 0.169 | 0.104 ± 0.088 | 0.127 ± 0.130 | - | 0.141 ± 0.121 |
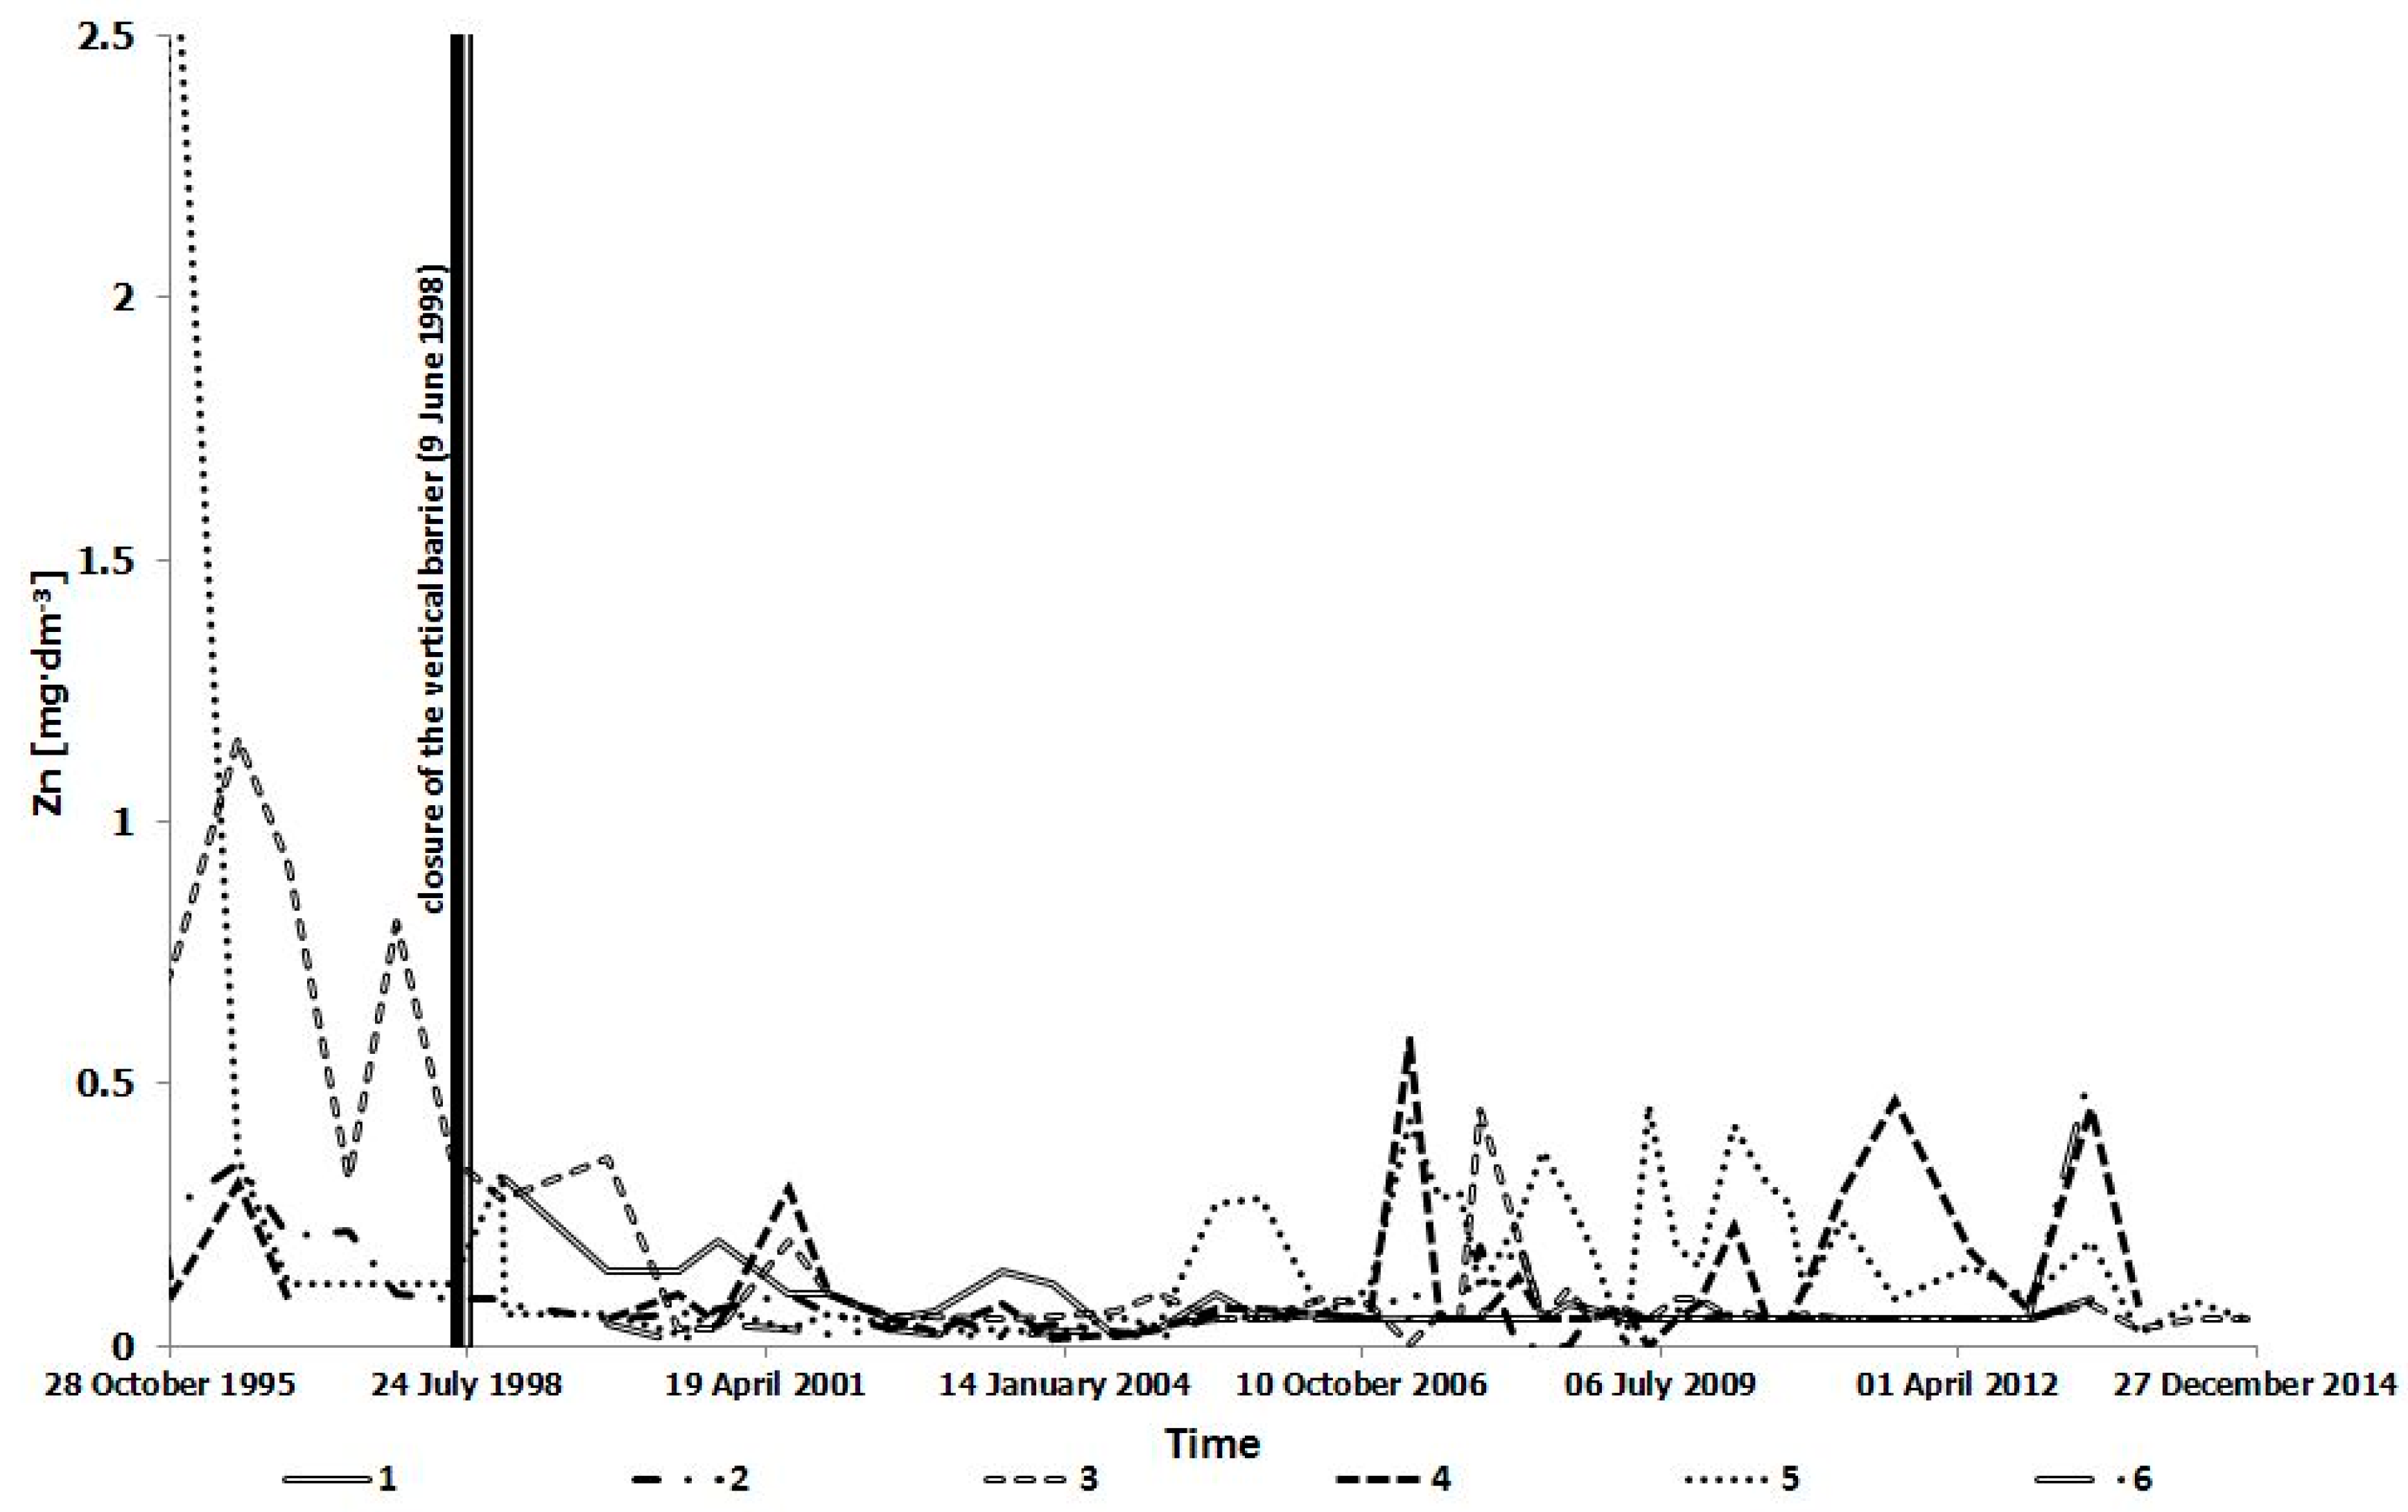
| Zn | - | - | 0.204 ± 0.089 | 0.586 ± 0.351 | 0.227 ± 0.183 | 0.615 ± 0.894 | - | 0.408 ± 0.379 |
| pH | 6.5–9.5 | - | 6.91 ± 0.29 | 7.36 ± 0.38 | 6.83 ± 1.21 | 7.45 ± 0.27 | - | 7.06 ± 0.42 |
| EC | 2500 (μS·cm−1) | 1045 ± 403 | 14403 ± 5417 | 1110 ± 279 | 1638 ± 150 | - | 4549 ± 1562 | |
| 1999–2014 | ||||||||
| Cd | 0.005 | 0.0006 ± 0.0005 | 0.0004 ± 0.0003 | 0.0008 ± 0.0009 | <0.0003 ± 0.0003 | 0.0005 ± 0.0003 | 0.0004 ± 0.0002 | 0.0005 ± 0.0004 |
| Pb | 0.025/0.010 | 0.005 ± 0.002 | 0.006 ± 0.003 | 0.019 ± 0.023 | <0.004 ± 0.002 | <0.004 ± 0.003 | <0.004 ± 0.003 | 0.008 ± 0.011 |
| Cr | 0.050 | <0.010 ± 0.045 | <0.010 ± 0.045 | 0.216 ± 0.250 | <0.010 ± 0.004 | <0.010 ± 0.047 | <0.010 ± 0.045 | 0.044 ± 0.073 |
| Cu | 2.0 | 0.015 ± 0.016 | 0.010 ± 0.016 | 0.037 ± 0.065 | 0.009 ± 0.011 | 0.017 ± 0.024 | 0.013 ± 0.036 | 0.017 ± 0.028 |
| Zn | - | 0.086 ± 0.054 | 0.059 ± 0.028 | 0.109 ± 0.094 | 0.190 ± 0.133 | 0.167 ± 0.130 | 0.068 ± 0.083 | 0.113 ± 0.087 |
| pH | 6.5–9.5 | 6.92 ± 0.32 | 6.07 ± 0.50 | 7.03 ± 0.34 | 7.37 ± 0.31 | 6.91 ± 0.46 | 6.62 ± 0.38 | 6.61 ± 0.38 |
| EC | 2500 (μS·cm−1) | 7394 ± 3231 | 898 ± 506 | 6349 ± 3311 | 957 ± 189 | 1064 ± 519 | 198 ± 155 | 2810 ± 1319 |
| Parameter | t | Df | Standard Error of the Difference | Two-Tailed p-Value | 95% Confidence Interval of the Difference | Statistical Significance of the Difference |
|---|---|---|---|---|---|---|
| Piezometer 2 | ||||||
| Cd | 2.37 | 48 | 0.00 | 0.022 | 0.00–0.01 | 0.01–0.05 |
| Pb | 3.43 | 48 | 0.00 | 0.001 | 0.00–0.01 | 0.001–0.01 |
| Cr | 0.85 | 48 | 0.02 | 0.397 | −0.02–0.05 | >0.05 |
| Cu | 6.44 | 48 | 0.02 | <0.001 | 0.07–0.13 | <0.001 |
| Zn | 8.87 | 48 | 0.02 | <0.001 | 0.11–0.18 | <0.001 |
| pH | 4.84 | 48 | 0.17 | <0.001 | 0.49–1.19 | <0.001 |
| EC | 0.81 | 48 | 180 | 0.419 | −215.91–509.91 | >0.05 |
| Piezometer 3 | ||||||
| Cd | 11,0 | 46 | 0.00 | <0.001 | 0.005–0.007 | <0.001 |
| Pb | 4.46 | 48 | 0.01 | <0.001 | 0.03–0.09 | <0.001 |
| Cr | 2.77 | 48 | 0.11 | 0.008 | 0.09–0.54 | 0.001–0.01 |
| Cu | 5.64 | 48 | 0.03 | <0.001 | 0.12–0.26 | <0.001 |
| Zn | 7.76 | 48 | 0.06 | <0.001 | 0.35–0.60 | <0.001 |
| pH | 2.58 | 48 | 0.13 | 0.013 | 0.07–0.59 | 0.01–0.05 |
| EC | 5.84 | 48 | 1380 | <0.001 | 5282.11–10825.89 | <0.001 |
| Piezometer 4 | ||||||
| Cd | 4.35 | 47 | 0.00 | <0.001 | 0.0001–0.0003 | <0.001 |
| Pb | 4.98 | 48 | 0.00 | <0.001 | 0.01–0.02 | <0.001 |
| Cr | 6.68 | 44 | 0.00 | <0.001 | 0.01–0.02 | <0.001 |
| Cu | 6.92 | 48 | 0.01 | <0.001 | 0.07–0.12 | <0.001 |
| Zn | 0.60 | 43 | 0.06 | 0.549 | −0.09–0.16 | >0.05 |
| pH | 2.46 | 44 | 0.22 | 0.018 | −0.98–0.098 | 0.01–0.05 |
| EC | 1.62 | 43 | 94.4 | 0.113 | −37.64–343.46 | >0.05 |
| Piezometer 5 | ||||||
| Cd | 2.82 | 46 | 0.00 | 0.007 | 0.0001–0.0005 | 0.001–0.01 |
| Pb | 3.52 | 41 | 0.01 | 0.001 | 0.01–0.05 | 0.001–0.01 |
| Cr | 1.65 | 44 | 0.02 | 0.104 | −0.01–0.08 | >0.05 |
| Cu | 5.20 | 48 | 0.02 | <0.001 | 0.07–0.15 | <0.001 |
| Zn | 3.17 | 48 | 0.14 | 0.003 | 0.16–0.73 | 0.001–0.01 |
| pH | 2.78 | 44 | 0.19 | 0.008 | 0.15–0.93 | 0.001–0.01 |
| EC | 2.44 | 43 | 235 | 0.019 | 99.16–1048.84 | 0.01–0.05 |
| Plot No. | Depth (cm) | Cd | Cu | Cr | Ni | Pb | Zn |
|---|---|---|---|---|---|---|---|
| Background * Range Mean | Surface Level | 0.08–1.6 0.3 | 1–25 6 | 5–70 40 | 5–25 30 | 10–200 37 | |
| 1 | 0–25 | 0.274 | 2.67 | 4.5 | 2.1 | 21.0 | 11.0 |
| 25–50 | 0.047 | 1.03 | 3.6 | 1.3 | 5.8 | 3.6 | |
| 2 | 0–25 | 0.197 | 2.30 | 2.7 | 2.7 | 11.9 | 6.3 |
| 25–50 | 0.098 | 1.21 | 3.3 | 1.6 | 3.2 | 2.3 | |
| 3 | 0–25 | 0.334 | 5.70 | 9.9 | 9.2 | 31.7 | 32.3 |
| 25–50 | 0.040 | 2.18 | 4.2 | 2.9 | 2.3 | 4.2 | |
| 4 | 0–25 | 0.475 | 6.97 | 8.6 | 8.0 | 17.7 | 20.8 |
| 25–50 | 0.286 | 4.23 | 8.5 | 7.9 | 7.4 | 18.0 | |
| 5 | 0–25 | 0.080 | 2.97 | 1.7 | 1.2 | 4.4 | 5.2 |
| 25–50 | 0.035 | 2.49 | 1.7 | 0.9 | 2.4 | 5.3 | |
| 6 | 0–25 | 0.047 | 2.40 | 2.6 | 1.1 | 9.1 | 6.7 |
| 25–50 | 0.038 | 0.86 | 2.1 | 1.1 | 4.5 | 5.2 |
| Plot No. | Plant | Cd | Cu | Cr | Ni | Pb | Zn |
|---|---|---|---|---|---|---|---|
| 1 | Grass | 1.0 | 5.0 | 1.1 | 0.9 | 1.5 | 73 |
| 2 | Grass | 0.1 | 2.6 | <0.2 | <0.5 | <0.6 | 31 |
| European goldenrod/leaves | 0.4 | 3.7 | <0.2 | 0.9 | 0.8 | 53 | |
| European goldenrod/stem | 0.4 | 2.6 | <0.2 | <0.5 | <0.6 | 66 | |
| 3 | Grass | 0.3 | 9.1 | <0.2 | <0.5 | <0.6 | 78 |
| European goldenrod/leaves | 0.2 | 5.9 | <0.2 | <0.5 | <0.6 | 42 | |
| European goldenrod/stem | 0.3 | 5.9 | <0.2 | 0.7 | <0.6 | 36 | |
| 4 | Grass | 0.3 | 10.9 | <0.2 | <0.5 | 4.6 | 30 |
| European goldenrod/leaves | 0.4 | 10.7 | 0.2 | 1.6 | 2.3 | 84 | |
| European goldenrod/stem | 0.5 | 9.2 | <0.2 | 0.7 | 1.9 | 92 | |
| 5 | Grass | 0.4 | 6.2 | <0.2 | <0.5 | 2.6 | 60 |
| European goldenrod/leaves | 0.3 | 9.7 | 0.3 | 0.6 | 2.4 | 90 | |
| European goldenrod/stem | 0.3 | 5.0 | <0.2 | <0.5 | <0.6 | 85 | |
| 6 | Grass | 0.1 | 7.3 | <0.2 | <0.5 | <0.6 | 34 |
| European goldenrod/leaves | 0.2 | 8.8 | <0.2 | 0.7 | 0.9 | 55 | |
| European goldenrod/stem | 0.3 | 4.0 | <0.2 | 0.5 | <0.6 | 72 |
| Plot No. | Plant | Cd | Cu | Cr | Ni | Pb | Zn |
|---|---|---|---|---|---|---|---|
| 1 | Grass | 3.58 | 1.87 | 0.24 | 0.43 | 0.07 | 6.7 |
| 2 | Grass | 0.41 | 1.13 | 0.07 | 0.38 | 0.05 | 4.9 |
| European goldenrod/leaves | 1.88 | 1.61 | 0.07 | 0.69 | 0.07 | 8.4 | |
| European goldenrod/stem | 2.13 | 1.13 | 0.07 | 0.38 | 0.05 | 10.5 | |
| 3 | Grass | 0.31 | 1.60 | 0.02 | 0.05 | 0.02 | 2.4 |
| European goldenrod/leaves | 0.29 | 1.04 | 0.02 | 0.05 | 0.02 | 1.3 | |
| European goldenrod/stem | 0.34 | 1.04 | 0.02 | 0.08 | 0.02 | 1.1 | |
| 4 | Grass | 0.65 | 1.22 | 0.02 | 0.06 | 0.26 | 1.4 |
| European goldenrod/leaves | 0.91 | 1.19 | 0.02 | 0.20 | 0.13 | 4.0 | |
| European goldenrod/stem | 0.97 | 1.32 | 0.02 | 0.09 | 0.11 | 4.4 | |
| 5 | Grass | 4.75 | 2.09 | 0.12 | 0.42 | 0.59 | 27.1 |
| European goldenrod/leaves | 3.75 | 3.27 | 0.18 | 0.50 | 0.55 | 17.3 | |
| European goldenrod/stem | 4.25 | 1.68 | 0.12 | 0.42 | 0.14 | 16.3 | |
| 6 | Grass | 2.77 | 3.04 | 0.08 | 0.45 | 0.07 | 5.1 |
| European goldenrod/leaves | 4.68 | 3.67 | 0.08 | 0.64 | 0.10 | 8.2 | |
| European goldenrod/stem | 5.96 | 1.67 | 0.08 | 0.45 | 0.07 | 10.8 |
| Plot No. | Cd | Cu | Cr | Ni | Pb | Zn |
|---|---|---|---|---|---|---|
| 1 | 456 | 178 | 447 | 39 | 4202 | 238 |
| 2 | 493 | 230 | 269 | 90 | 1983 | 126 |
| 3 | 418 | 154 | 114 | 1150 | 2113 | 310 |
| 4 | 1583 | 774 | 855 | 1337 | 4425 | 195 |
| 5 | 160 | 174 | 171 | 590 | 1105 | 31 |
| 6 | 116 | 184 | 262 | 1145 | 2276 | 108 |
© 2016 by the authors; licensee MDPI, Basel, Switzerland. This article is an open access article distributed under the terms and conditions of the Creative Commons Attribution (CC-BY) license (http://creativecommons.org/licenses/by/4.0/).
Share and Cite
Gworek, B.; Dmuchowski, W.; Koda, E.; Marecka, M.; Baczewska, A.H.; Brągoszewska, P.; Sieczka, A.; Osiński, P. Impact of the Municipal Solid Waste Łubna Landfill on Environmental Pollution by Heavy Metals. Water 2016, 8, 470. https://doi.org/10.3390/w8100470
Gworek B, Dmuchowski W, Koda E, Marecka M, Baczewska AH, Brągoszewska P, Sieczka A, Osiński P. Impact of the Municipal Solid Waste Łubna Landfill on Environmental Pollution by Heavy Metals. Water. 2016; 8(10):470. https://doi.org/10.3390/w8100470
Chicago/Turabian StyleGworek, Barbara, Wojciech Dmuchowski, Eugeniusz Koda, Marta Marecka, Aneta H. Baczewska, Paulina Brągoszewska, Anna Sieczka, and Piotr Osiński. 2016. "Impact of the Municipal Solid Waste Łubna Landfill on Environmental Pollution by Heavy Metals" Water 8, no. 10: 470. https://doi.org/10.3390/w8100470