Article

Near Real-Time Flow Cytometry Monitoring of Bacterial and Viral Removal Efficiencies during Water Reclamation Processes

Department of Civil and Environmental Engineering, University of California, Irvine, CA 92697, USA
*
Author to whom correspondence should be addressed.
These authors contributed equally to this work.
Water 2016, 8(10), 464; https://doi.org/10.3390/w8100464
Submission received: 29 August 2016 / Revised: 3 October 2016 / Accepted: 12 October 2016 / Published: 18 October 2016
(This article belongs to the Special Issue Pathogens in Water)

Abstract

:
Wastewater reuse has become an important part of the urban water supply portfolio in water stressed regions. Effective wastewater treatment processes are critical to protect public health during water reuse practices. However, the microbial removal efficiencies in wastewater reclamation plants are not routinely monitored due to the lack of a simple quantification method. This study applied a near real-time flow cytometry (FCM) technique to quantify the removal of total bacteria and viruses at three wastewater reclamation plants in Southern California. The results showed that the activated sludge process removed 1–2 log10 of bacteria but was not efficient at removing viruses. The membrane bioreactor process was capable of removing both bacteria and viruses with high efficiency. At the plant using chloramines as the main disinfectant, even though culturable total coliform bacteria were effectively reduced to the level meeting the California Title 22 Water Recycling Criteria (7-day median of 2.2 most probable number (MPN)/100 mL, and no more than one sample exceeds 23 MPN/100 mL), the disinfected final effluent still contained greater than 106 bacterial and 108 viral particles per mL in. In contrast, more than 4 log10 removal of both bacteria and viruses were observed at the plant using free chlorine as the main disinfectant. The results indicate that additional microbial indicators are needed and suggest the potential use of FCM as a rapid monitoring tool for evaluation of microbial removal.

1. Introduction

With the intensification of water scarcity in metropolitan cities, the reclamation of domestic wastewater has become a common practice to supplement the dwindling traditional water supplies in water stressed regions. For example, in 2012 the State of California in the United States recycled 670,000 acre-feet (8.3 × 10⁹ m3) of municipal wastewater, representing approximately 13% of its annual wastewater production [1]. The Groundwater Replenishment System (GWRS), located in Orange County, California, is the world’s largest indirect potable reuse project, which produces 100 million gallon (4546 m3) of highly purified water every day for groundwater recharge [2,3].
One of the biggest concerns of wastewater reuse is the transmission of waterborne diseases caused by microbial pathogens, including pathogenic enteric protozoa, bacteria and viruses, when treatment technologies are insufficient in removing/inactivating those pathogens [4,5]. Over 80% of diarrheal cases worldwide are linked to unsafe water. Although the burden of waterborne disease is significantly reduced in the developed countries (e.g., helminthes related disease transmission has been eradicated in the U.S. thanks to the advanced sanitation and wastewater treatment systems), the use of human sewage as a source of drinking water raises concerns of the reemergence of infectious diseases, especially viral diseases. In the U.S., the norovirus causes an average of 570–800 deaths, 56,000–71,000 hospitalizations, 400,000 emergency department visits, 1.7–1.9 million outpatient visits, and 19–21 million total illnesses per year [6]. Traditional wastewater treatment plants in the U.S. are designed to remove organic carbon and suspended solids to meet the National Pollution Discharge Elimination System (NPDES) permit requirement. The microbial water quality of reclaimed water is routinely monitored based on the concentration of indicator bacteria (e.g., E. coli or total coliform bacteria). However, the behavior of indicator bacteria during wastewater treatment processes is very different from many other microbial pathogens [7]. For instance, viruses in general are resistant to sedimentation due to their small sizes and thus are not effectively removed in water sludge separation processes [8]. Some human viruses are also found to be more resistant than indicator bacteria to various disinfection processes [9]. Therefore, the microbial risk associated with water reuse practices could be underestimated by using culturable indicator bacteria as the only assessment criteria.
The lack of an easy and sensitive method to detect bacteria and viruses has resulted in the poor understanding of their fate in water reclamation processes. Traditional culture-based methods are time consuming and the majority of microorganisms in environmental samples cannot be grown under lab conditions [10]. The cultivation-independent polymerase chain reaction (PCR) method overcomes this obstacle, but it still takes a few hours from sample to answer. In contrast, flow cytometry (FCM) has the capacity to analyze thousands of biological particles in a few seconds, making it a promising tool for real-time online microbial water quality analysis. In 2013, Switzerland adopted FCM as a standard method for bacterial monitoring in drinking water [11,12]. The viability of bacteria can also be assessed by staining the samples with a combination of fluorescent dyes such as SYBR® Green I and propidium iodide [13]. In a recent study, we have shown that FCM can also detect viral particles in wastewater samples using an optimized sample pretreatment protocol [14,15].
The objective of this study was to investigate bacterial and viral removal rates at each wastewater treatment unit. Water samples collected from three Southern California water reclamation plants were analyzed using a portable FCM. The factors influencing the microbial removal efficiencies and the potential to use FCM as a real-time microbial water quality monitoring tool are discussed. The results of this study contribute to the effort of optimizing treatment processes for water reuse and human health protection.

2. Materials and Methods

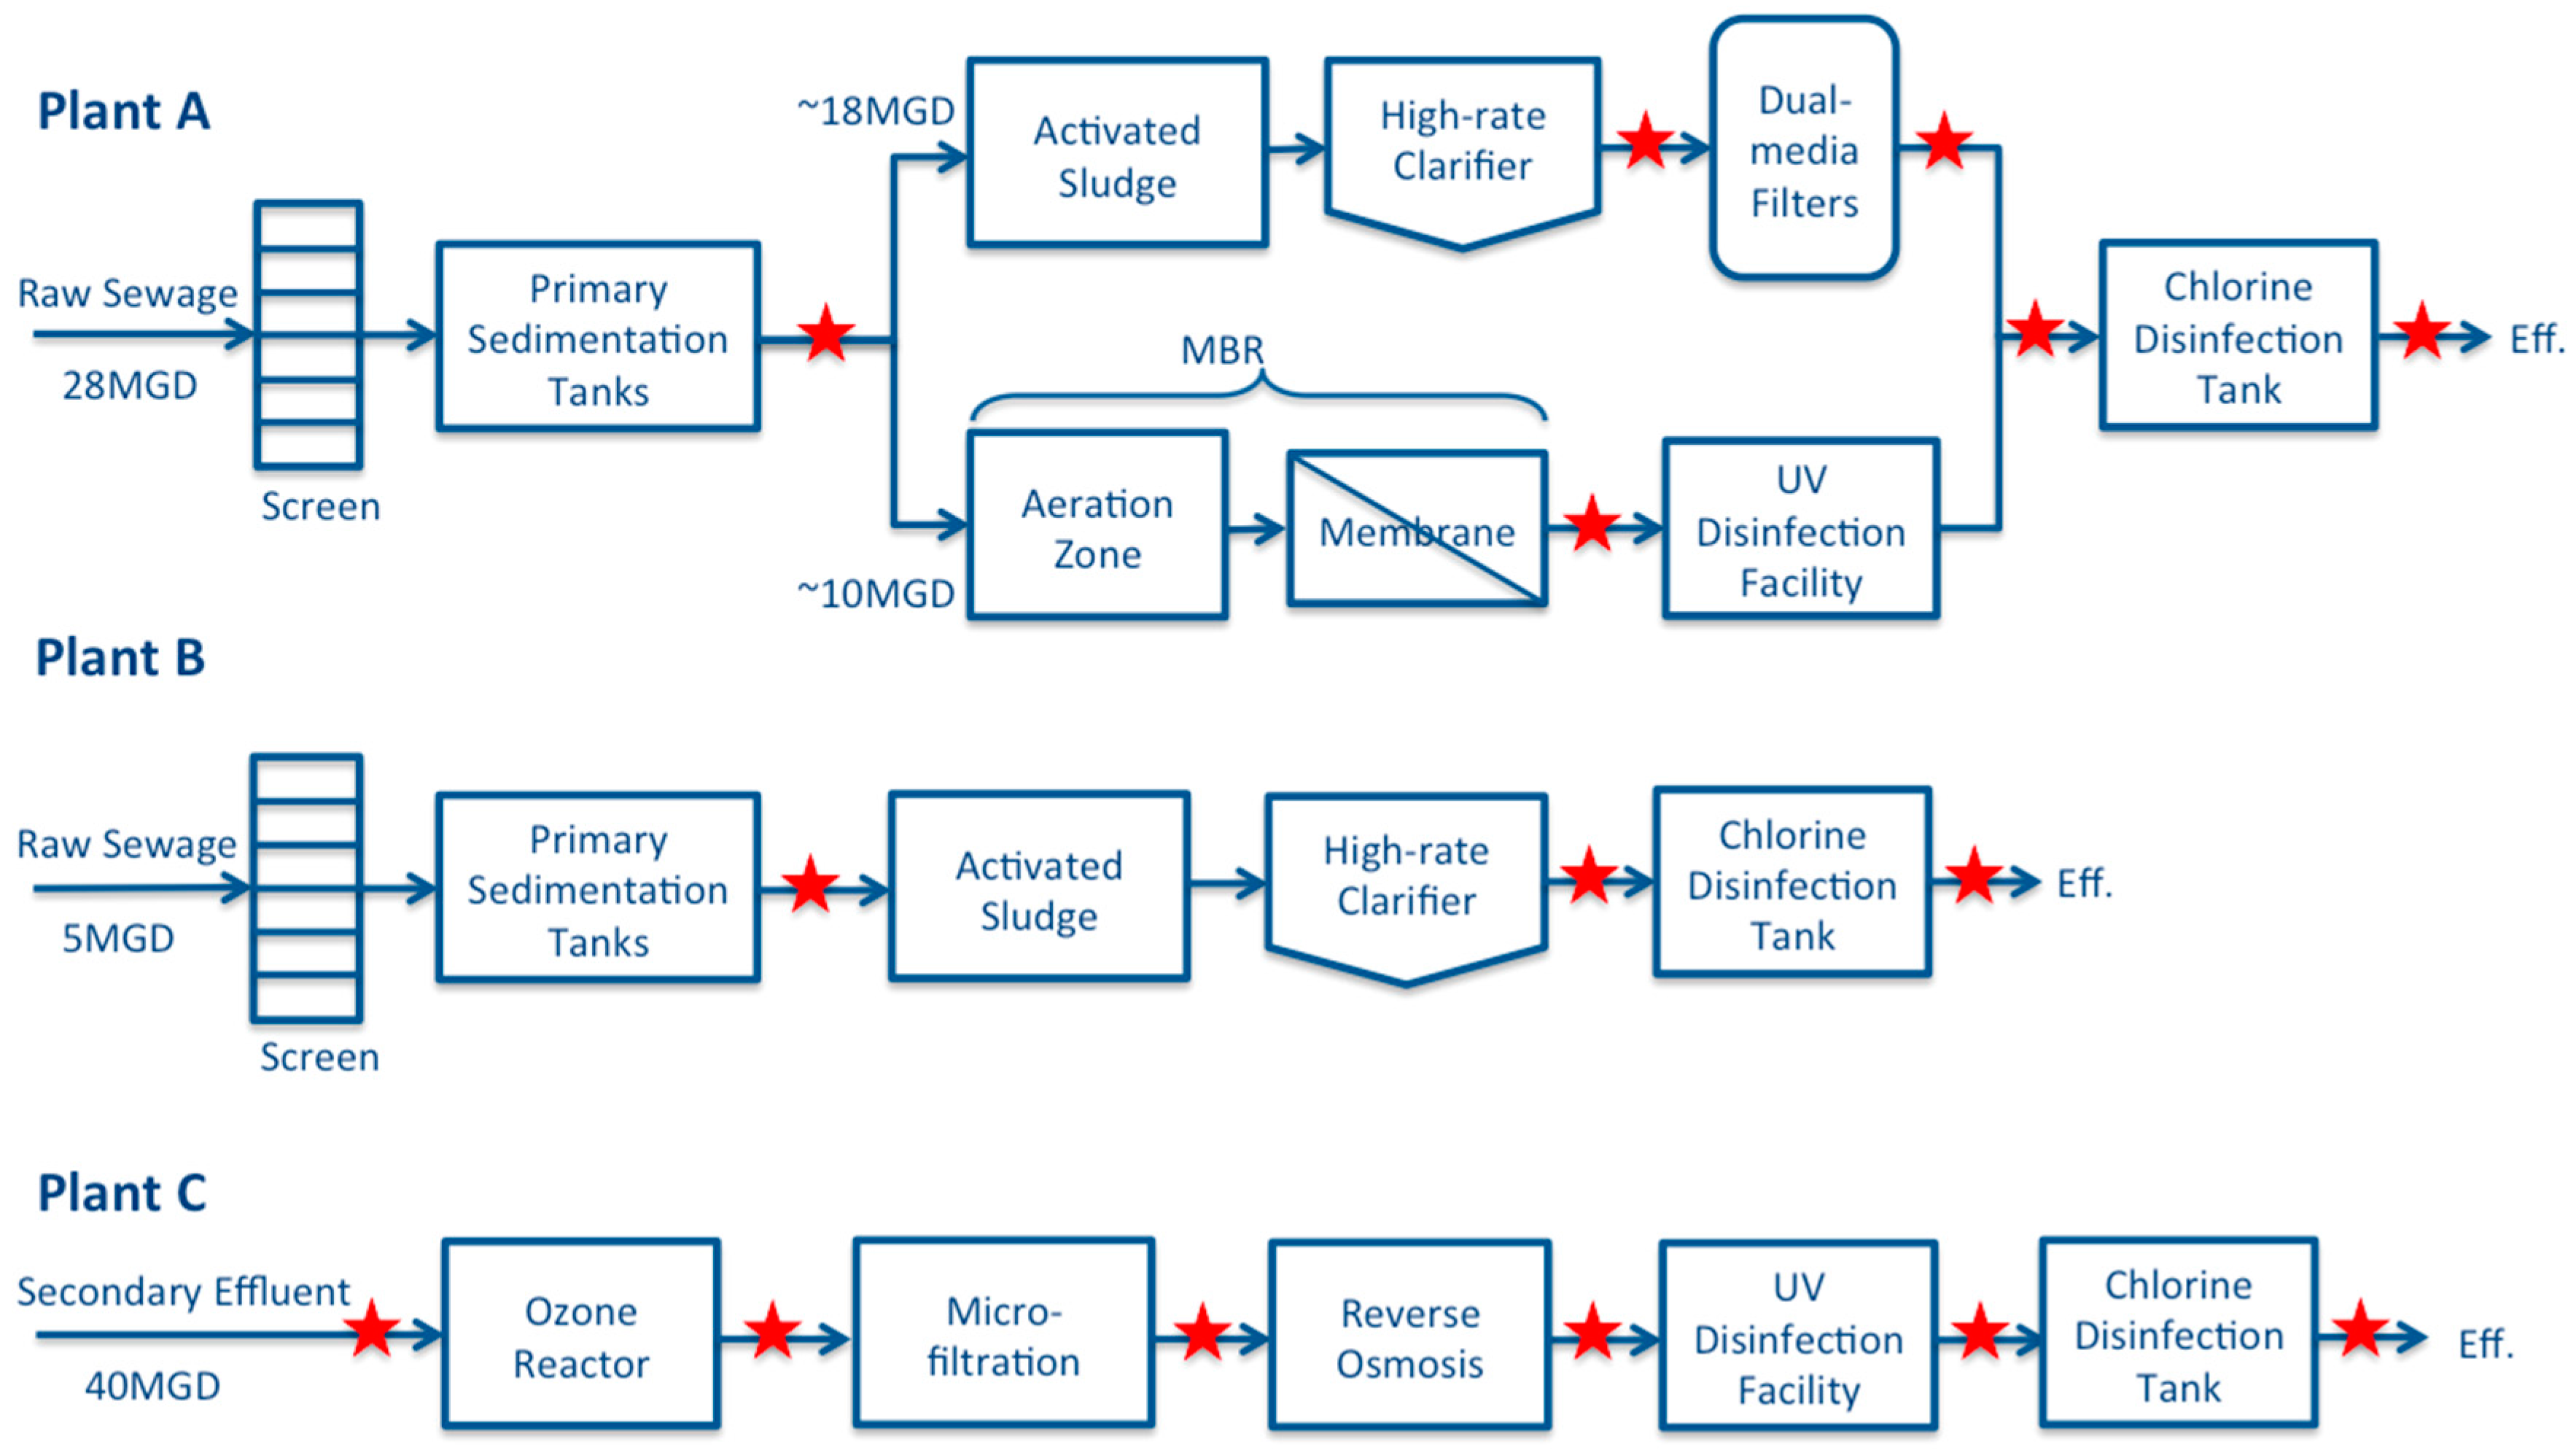
2.1. Study Sites and Sampling Scheme

Three Southern California wastewater reclamation plants sampled in this study were designated as Plant A, B, and C, which include four different treatment processes. Plant A uses the activated sludge (AS) process followed by a high-rate clarifier and dual media filtration before chlorination (Figure 1). A new parallel train using a membrane bioreactor (MBR) was recently constructed to expand the plant treatment capacity from 18 million gallons per day (MGD) (68,137 m3/day) to 28 MGD (105,992 m3/day). The effluent from the MBR will be treated by UV disinfection in the near future. However, the UV disinfection facility was not online during the course of this study. The effluent from the MBR is currently combined with the effluent from the traditional AS train and disinfected with chlorine before being distributed as non-potable water for urban landscape irrigation and toilet flushing (Figure 1). Plant B is designed to treat an average of 5 MGD (18,927 m3/day) of domestic wastewater through primary sedimentation, AS, followed by high-rate clarification and chlorine disinfection. The effluent is monitored using total coliform bacteria as an indicator to meet California Title 22 requirements for non-potable uses and is distributed primarily for urban landscape irrigation. Plant C is an advanced water reclamation plant. It takes the secondary effluent from a nearby traditional wastewater treatment facility for further treatments with the intention to use the treated effluent for indirect-potable reuse via groundwater recharge. In Plant C, 40 MGD (151,416 m3/day) of influent is initially treated by pre-ozonation to reduce the organic loads as a controlling measure of microfiltration (MF) membrane biofouling. The MF effluent is then treated by reverse osmosis (RO), followed by UV disinfection and chlorine disinfection (Figure 1). The sampling locations at each plant are indicated by the stars on the schematic of treatment trains (Figure 1).
Water samples (~500 mL) were collected in sterile Whirl-Pak bags at each sampling location approximately bi-weekly from June 2014 to January 2015. For chlorinated samples, 0.5 mL 10% sodium thiosulfate was added to neutralize the chlorine residual. All samples were transported on ice to the laboratory at the University of California, Irvine for immediate processing.

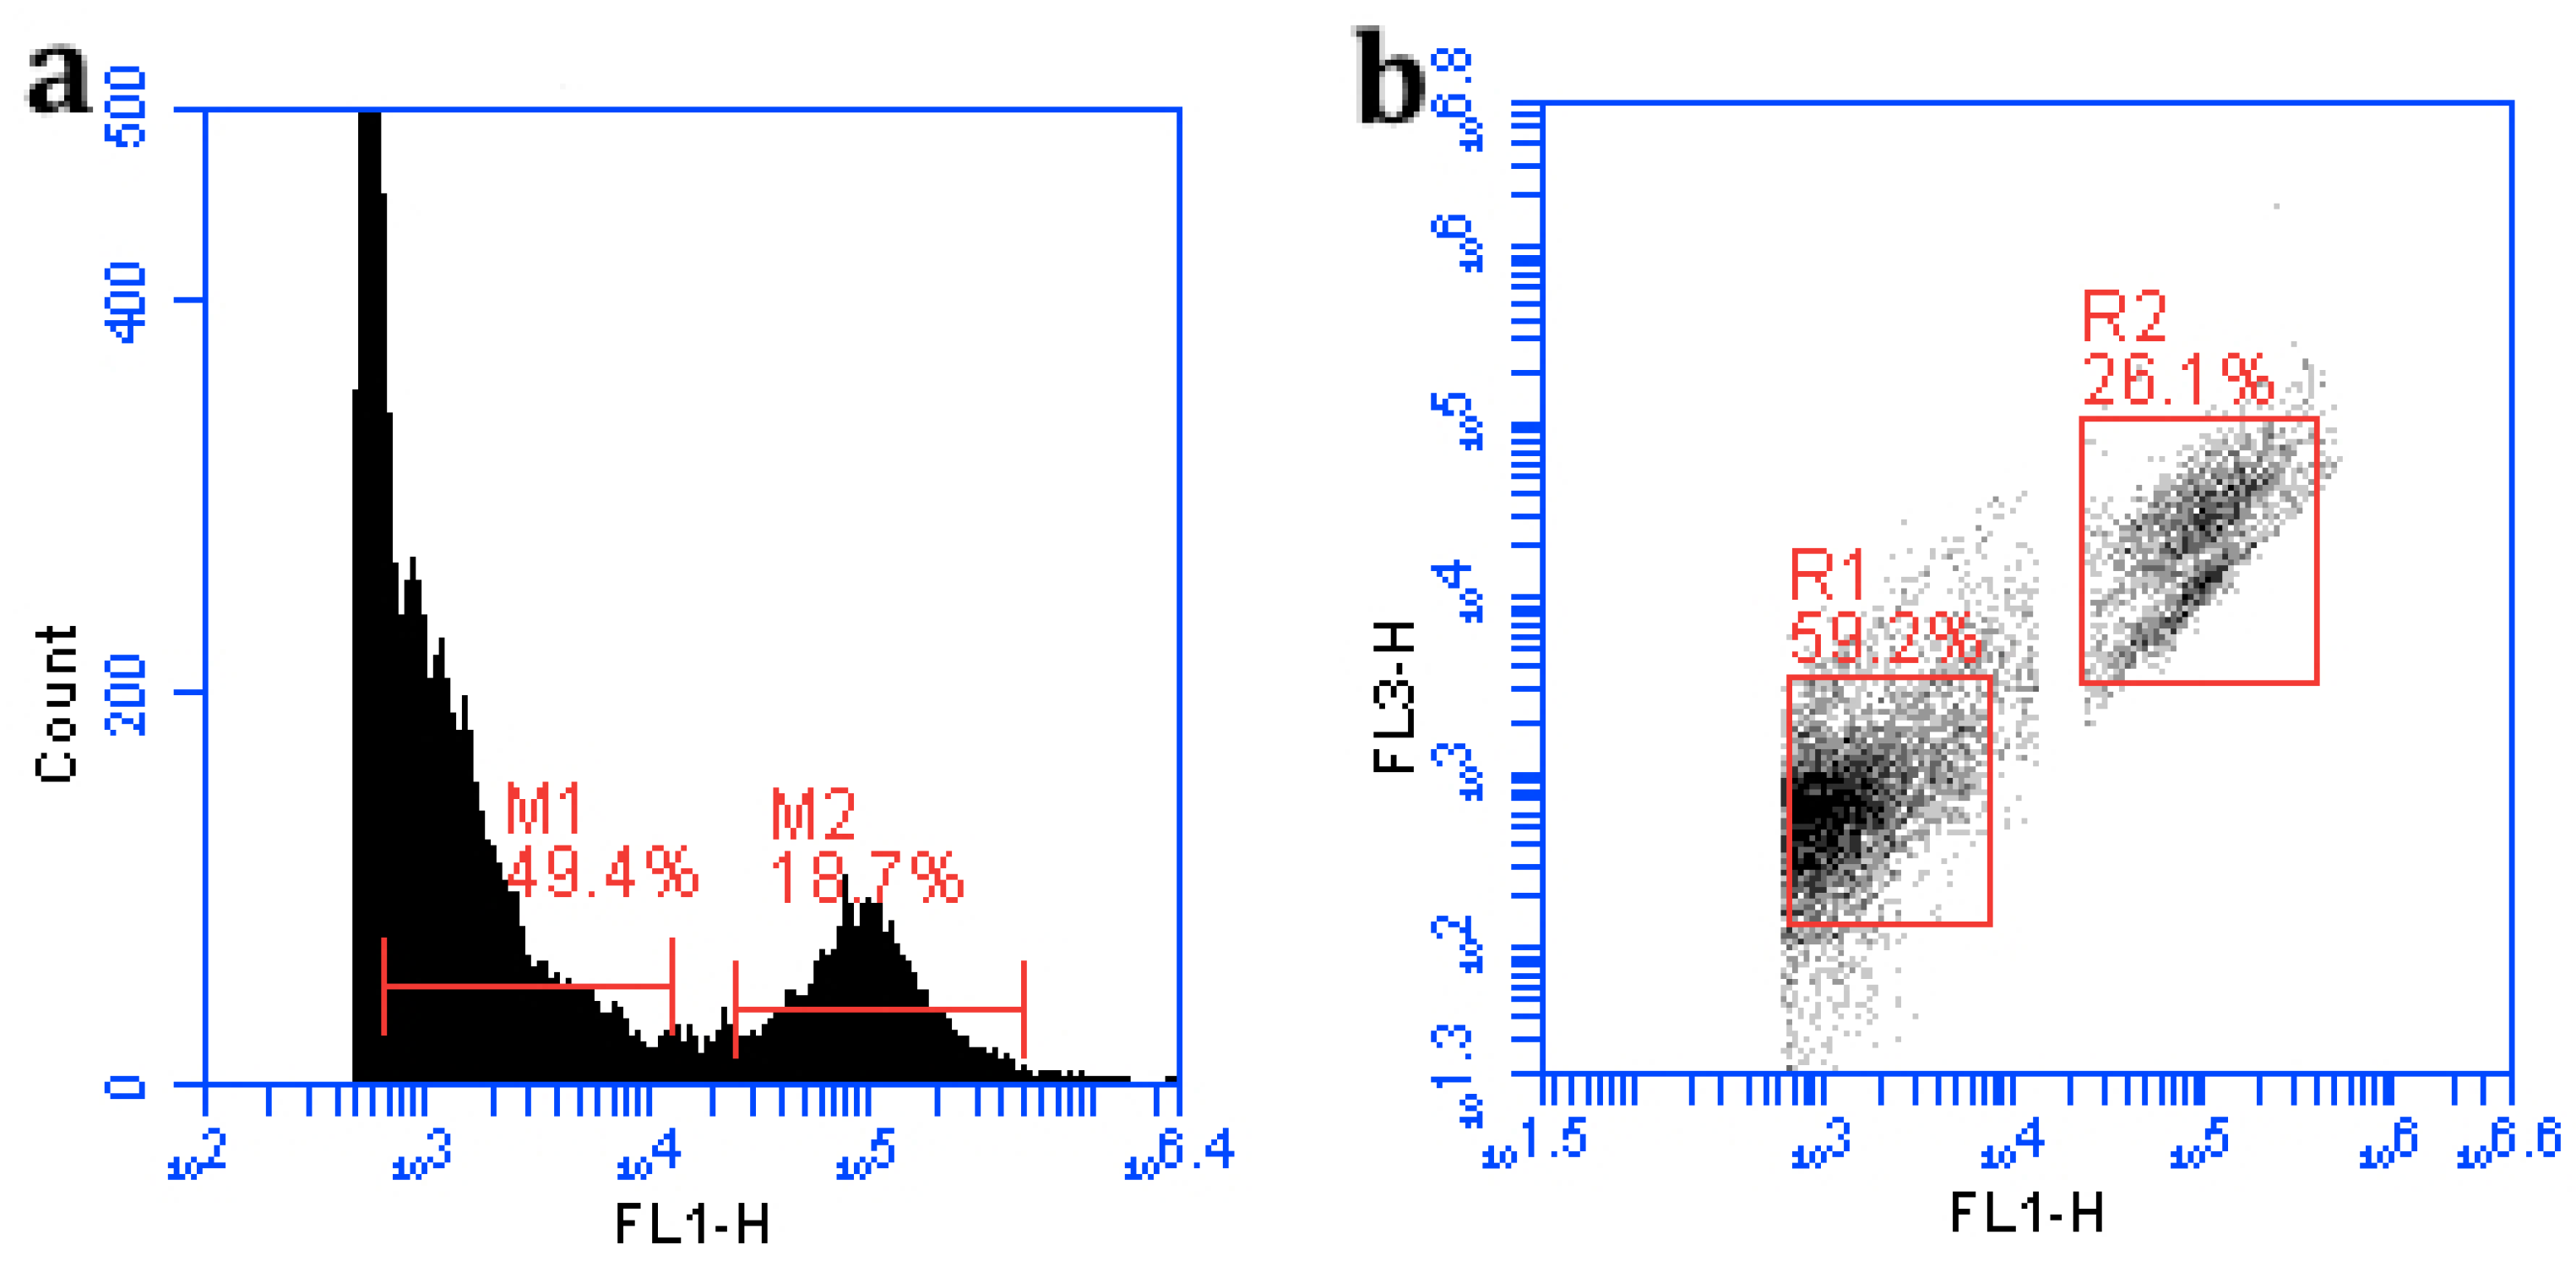
2.2. Quantification of Total Bacteria and Viruses

Upon returning to the lab, 1 mL of each water sample was fixed with glutaraldehyde at the final concentration of 3% (Sigma-Aldrich, St. Louis, MO, USA) and incubated in a 4 °C refrigerator for 15 min. Serial dilutions (10−1, 10−2, 10−3, 10−4 dilution) were made for fixed samples using 1× Tris-EDTA (TE) buffer (pH = 7.8). The diluted samples were stained with SYBR Gold for 15 min in the dark at the final concentration of 0.5× (commercial stock 10,000×) [14].
Total viruses and bacteria in the diluted stained samples were enumerated using a BD Accuri® C6 Flow Cytometer following the protocol developed by Huang, et al. [14]. In brief, 20 μL of samples were tested for each run after thoroughly flushing the system with deionized (DI) water. For sample testing, the flow rate was set to medium (35 μL/min) and a threshold on Fluorescent channel 1 (FL1) was set to 500~650 to eliminate electronic background noise. A single-parameter histogram was used to identify the fluorescent peaks, with FL1 as the x-axis and counts as the y-axis (Figure 2a). A FL1 vs. FL3 density plot was used to indicate different populations of particles (Figure 2b). The dilutions with too low or too high events were not used in the final data analysis. Distinct signal clusters for each population were gated based on visual inspection of the FL1 vs. FL3 density plot to exclude the background and debris noise. The gated region R1 is defined as the cluster of viral particles and the region R2 is defined as the cluster of bacterial particles (Figure 2b). The events in each gated area were collected and used to compute the concentrations of bacteria and viruses in each sample. The lower limit of detection (LLOD) for bacteria was identified by testing 0.2 μm membrane (Whatman, Pittsburgh, PA, USA) filtered samples; and 30K Da Amicon filter (EMD Millipore, San Diego, CA, USA) processed samples were used to set the LLOD for viruses. The bacterial and viral counts by FCM are comparable to those measured by traditional epifluorescence microscopy with a lower LLOD achieved by the FCM assay [14].

2.3. Bacterial and Viral Removal Efficiency

FCM data outputs were analyzed using the following formula to generate the final counts of total bacteria or viruses. C ( Particles mL ) = Count V × 1000   μ L 1   mL × D i l u t i o n   F a c t o r , where C (counts/mL) is either bacterial or viral particle concentration; Count is the number of events in the R1 region for viruses, or the R2 region for bacteria; and V is the sample volume (μL) loaded in each run. Bacterial and viral removal at each step of the treatment process was calculated using log10 transformed count data. The removal efficiency was computed by subtraction of the log transformed effluent concentration from the influent concentration for each unit process. For samples with bacterial or viral concentration below the LLOD, the LLOD was used for the log removal efficiency calculation.

3. Results and Discussion

3.1. Quantification of Both Bacteria and Viruses by FCM

In this study, we investigated the potential of using a portable FCM as a process control method in wastewater reclamation plants. Figure 2 shows that the optimized FCM protocol was able to separate bacterial and viral signals while minimizing the interference of background noise. The current approach is effective at capturing both bacterial and viral particles in a single sample run (1 min/run) and can obtain results within 30 min of sample collection. In comparison with traditional culture-based or PCR-based methods, which target specific bacteria or viruses, FCM provides a near real-time option for total bacterial and viral assessment. This is of great importance for process control in water reclamation, especially for the future implementations of direct potable reuse projects, because less reaction time will be available to adopt corrective actions in the event of a treatment failure. The LLODs for bacteria and viruses were determined as ~102 and ~104/mL, respectively, based on the blank testing results. Increasing the sample loading volume (up to 500 μL) can further improve the LLOD, however, it would take longer time to complete each run (15 min/run). Larger loading volume may also contribute more system noise and potentially reduce the signal/noise ratio. For extremely clean water (e.g., RO effluent), the concentrations of bacteria and viruses are in the magnitude of one in several or hundreds of liters of water. Therefore, a pre-concentration step is indispensable to get a positive result. Further study is needed to determine the volume of water that should be concentrated before testing. This would be based on the designed log removal validation goal as well as the recovery rate of the concentration method.

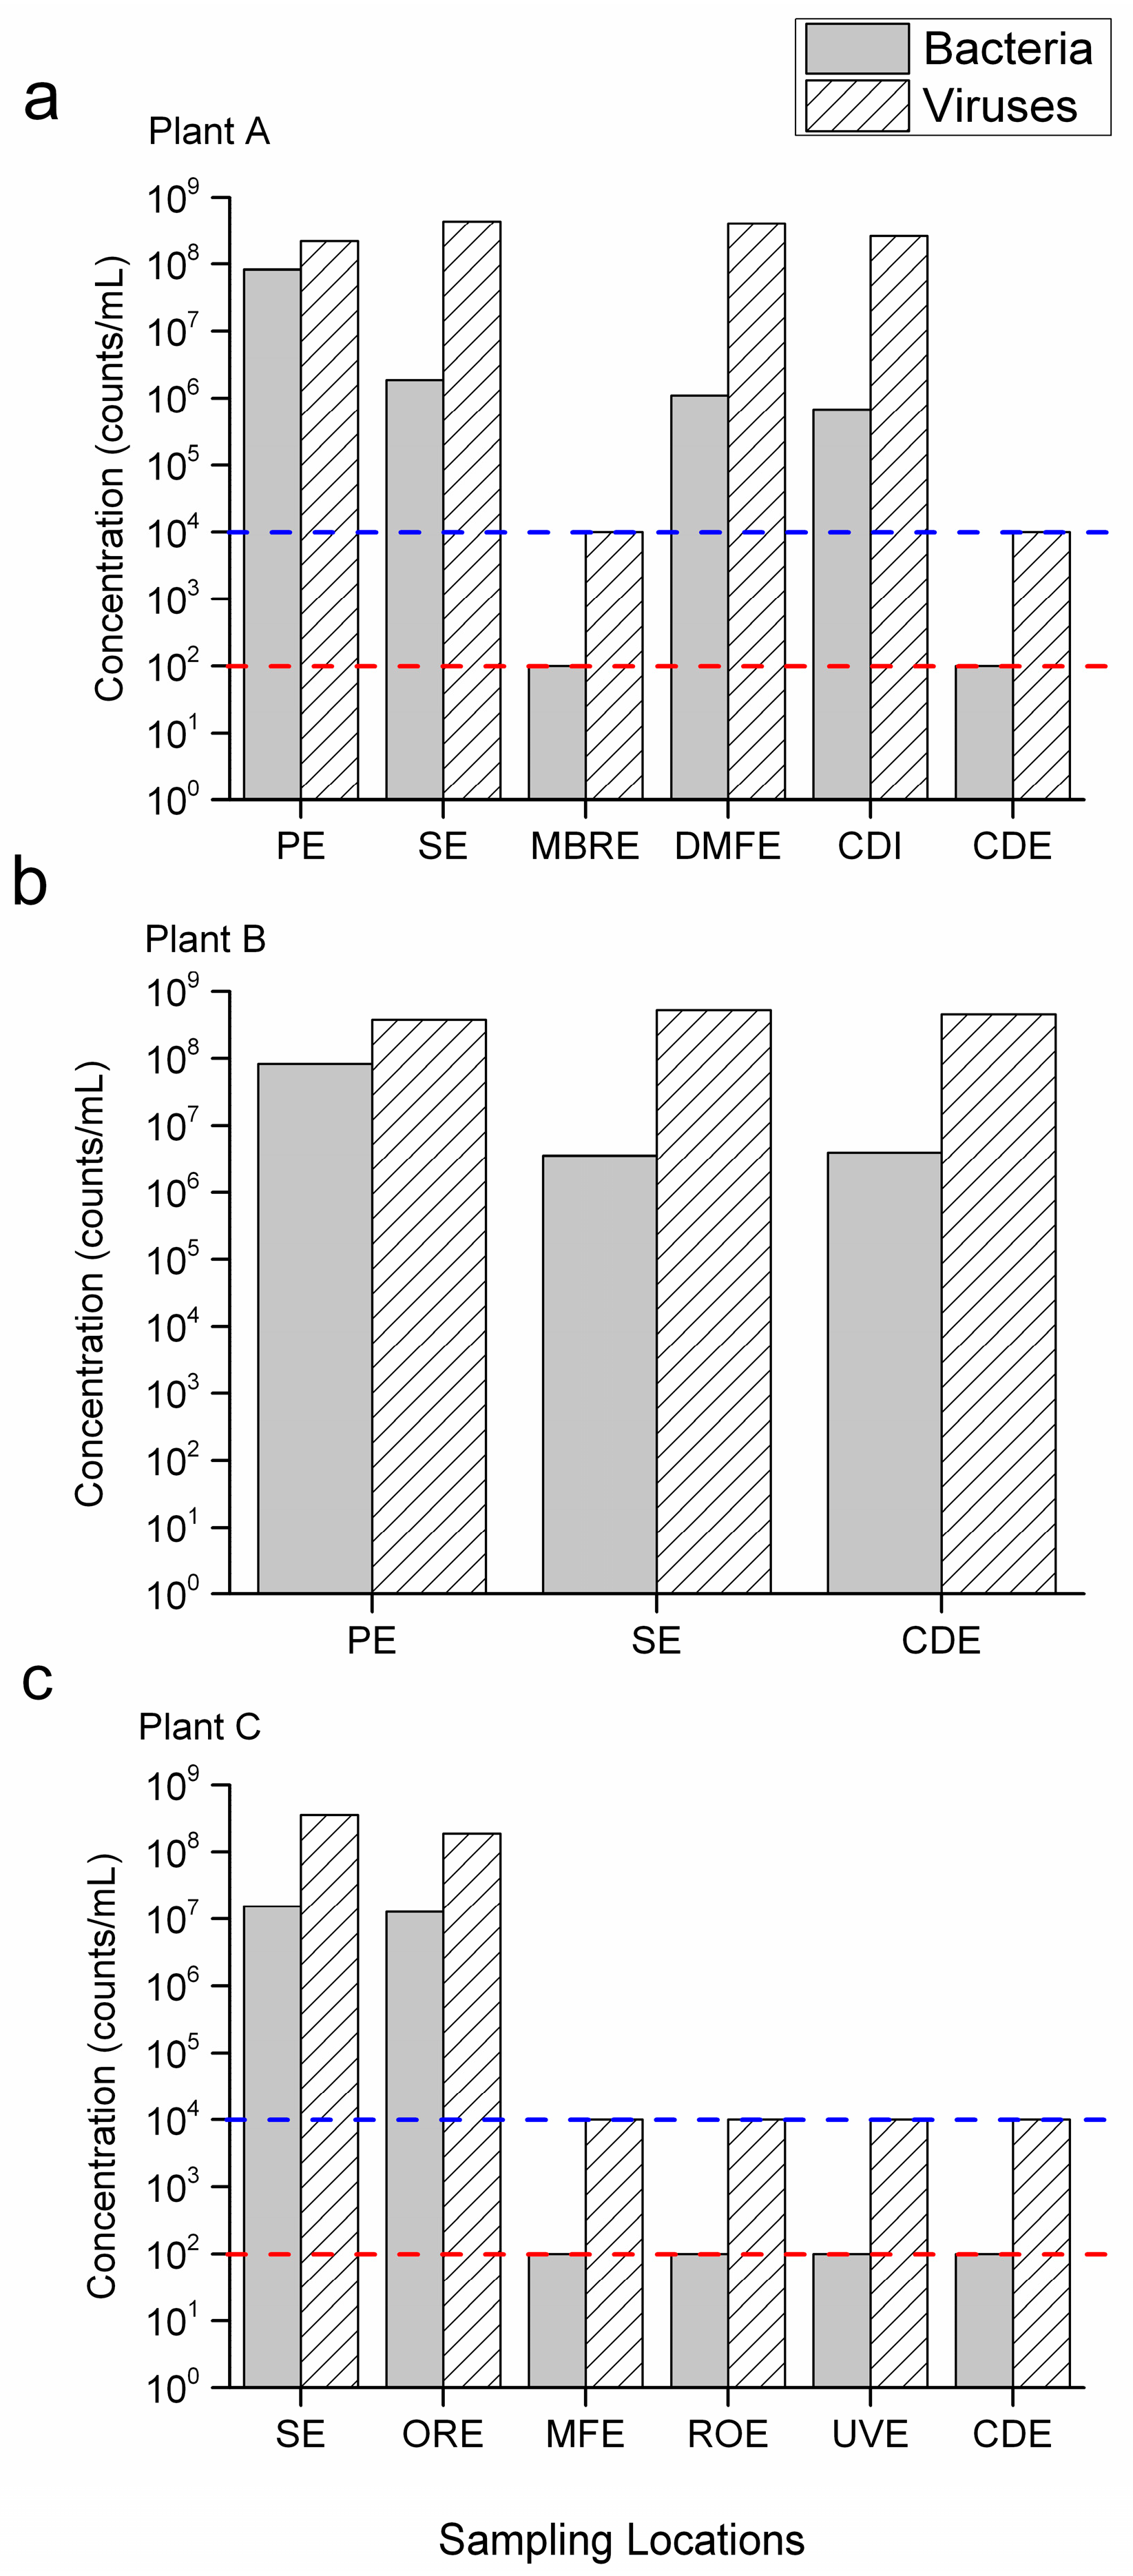
3.2. Removal through AS, High Rate Clarification and Dual Medium Filtration

Bacterial and viral concentrations determined by FCM for each treatment process are presented in Figure 3. The seasonal variations at each sampling location throughout the eight months sampling period were small (relative standard deviation <5%). The primary effluents (PE) contained ~108/mL bacteria and a slightly higher concentration of viruses as observed in plants A and B (Figure 3a,b). The viral concentration observed was similar to those reported in other studies (on the order of 108–1010 viral like particles (VLPs)/mL). The bacterial concentration was about 1–2 log10 higher than those normally reported in wastewater (on the order of 106–107 cells/mL) [16,17].
The secondary treatment through the AS process and high rate clarification (Plant A Train 1 and Plant B) processes reduced 1–2 log10 of bacteria, but the viral concentration remained largely the same in the effluent (Table 1). The results indicated that the high rate clarification, using alum as coagulant, was only effective for bacterial removal, but the process did not settle viruses very well. Adversely, in a bench-scale study, Shin et al. [18] found that under optimized conditions, 1.5 log10 removal of norovirus and poliovirus, and 2 log10 removal of coliphage MS2 can be achieved. The discrepancy indicates that better process control in terms of coagulant dose, pH, flocculation time and flocculation speed may enhance viral removal, but optimizing these procedures is more challenging in a full scale wastewater treatment plant than with a bench-scale jar test. The removal of viruses during the coagulation/flocculation process is not only governed by sedimentation, but can also be induced by inactivation. Studies have shown that some coagulants are toxic to viruses, although the virucidal effect varies among different types of viruses. Bacteriophage MS2 was found to be more sensitive to polyaluminum chloride than enteric adenoviruses and poliovirus [19]. Thus, MS2, as a traditional surrogate virus, may not properly represent the fate of enteric viruses during the coagulation/sedimentation process. In a few sampling days, the total virus counts in the secondary effluent were even higher than that in the influent. Since viruses can only propagate within their hosts, the increase is likely due to the proliferation of bacteriophages during the AS process, in which their host concentrations (bacteria) are intentionally increased by the returned sludge. This speculation is also supported by several recent metagenomic studies on reclaimed water viromes, which have shown that the identifiable viral sequences were dominated by bacteriophages [16,20].
The dual-media filtration, as observed in Plant A, showed little removal of bacteria and viruses (Table 1). This observation is not surprising since dual media filters, using an anthracite coal layer followed by a sand layer, are designed to reduce particles greater than the average pore size of 1.05–1.15 mm. Therefore, they are not effective at removing much smaller microorganisms including viruses and bacteria [7,21].

3.3. Removal through MBR, MF and RO

In plant A, the secondary treatment through an MBR, which is used as a parallel train to the AS train, showed high efficiencies of bacterial and viral removal. Both organisms in the MBR effluent (MBRE) were below the LLOD over the course of the study (Figure 3a). An MBR combines oxygenated biological treatment with an MF membrane for the removal of suspended solids. Size exclusion is the main mechanism of bacterial removal during the MBR process, as most of the bacteria are larger than the nominal pore size of the MF membrane (0.1 μm) [22]. However, the high removal rate (>4 log10) of viruses observed in the MBR process may not be explained by size exclusion only, as most of the viruses, especially bacteriophages (diameter <0.1 μm), would pass through the membrane if only particle size is considered. In a pilot scale MBR test, Hirani et al. [23] found that the removal rates of the seeded MS2 by the six MBR systems ranged from 1.0 to 4.4 log10, but the differences in membrane pore size (0.04–0.2 μm) did not show a substantial impact on the removal rates. The adsorption of viruses to mixed liquor suspended solids (MLSS) is believed to play an important role in viral removal in MBR process. In a recent study, Branch et al. [24] reported that biological predation in MLSS is responsible for up to 1 log10 removal of F-specific RNA (FRNA) bacteriophage in the MBR, but the 4–7 log10 removal of the viruses was linked to the filtration process. The adsorption efficiency of different virus groups is determined by their surface charge and hydrophobic properties. Enteroviruses were found to be less associated with MLSS than norovirus GII and sapoviruses, which resulted in a lower removal in the MBR [25]. Other studies have also shown that biofilm formed on the membrane surface functioned as a secondary barrier to microorganisms and high molecular weight organic materials. For example, phage removal efficiency was increased from 2.6 to 5.6 log10 as the physical irremovable fouling (caused by pore blocking which must be eliminated by chemical cleaning) accumulated, while removable fouling (caused by the formation of a cake layer which can be easily eliminated by physical cleaning) did not have any effect on the retention of viruses by the membrane [22].
In plant C, the MF process is mainly used as a pretreatment step to prevent the fouling problem of the RO process. Like the MBRE, bacterial and viral counts in the MF effluent (MFE) were below the LLOD of the assay (Figure 3) indicating at least 5.10 log10 and 4.25 log10 removal of bacteria and viruses, respectively (Table 1). However, this result does not agree with our previous work at a different local water reclamation plant, where only 1 log10 reduction of virus was observed through the MF process [14]. The inconsistency highlights the uncertainty of the viral removal rate of the MF process under real-world conditions. In this study, the high viral removal rate may be explained by the MF influent water quality (see Section 3.4 for the ozonation process) and the frequent MF fouling in Plant C [26]. The severe fouling of MF improves the removal rate of microorganisms at the cost of a loss in water production efficiency.
Overall, the results in the current study showed that the MBR system in the secondary treatment process can achieve a similar microbial removal rate compared to the MF process, and thus, holds the potential to substitute the standalone MF process in tertiary treatment. In the future, if plant A is extended for indirect/direct potable water production, the MBRE can directly be fed to the RO process, and thus largely simplify the treatment train [27].
Both bacteria and viruses were below the LLOD after RO in Plant C. RO is the most important barrier of the whole treatment train, which theoretically removes all microbial pathogens. However, to-date, due to the lack of a real-time, online integrity monitoring tool, there is a gap between the log removal credit assigned to this process (determined by integrity testing approved by regulators) and its actual log removal capacity [28]. Compared to other direct (e.g., pressure/vacuum hold, diffusive air flow and bubble point test) or indirect monitoring methods (e.g., conductivity, turbidity, total organic carbon), FCM targeting indigenous viral particles themselves provides the most convincing evidence to demonstrate the integrity of the RO membrane. Further development on the automation of sample collection, concentration and testing is needed to facilitate the use of FCM as a true real-time monitoring tool.

3.4. Removal through Ozonation and Chlorination

In sedimentation and filtration processes, the reduction of bacteria and viruses is achieved primarily through physical removal. In contrast, disinfection (inactivation) is the main mechanism responsible for the removal of bacteria and viruses in ozonation and chlorination processes. In other words, bacterial and viral particles may still be present in the treated water, but they are non-viable or have lost their infectivity.
The influent samples for Plant C is the secondary effluent (SE) from a nearby treatment plant. The bacterial concentration in the influent is nearly an order of magnitude higher than the SE from plant A and B, while the viral concentration is comparable to the other two plants (Figure 3c). Depending on the levels of organic content and total suspended solids (TSS), a transferred ozone dose (TOD) of between 2 and 15 mg/L was normally required to meet the initial ozone demand in SE (the World Health Organization standard) for the production of irrigation water (1000 fecal coliform/100 mL). To meet more stringent regulations like Title 22, an filtration step is needed to reduce the amount of TSS before ozonation [29]. The results from Plant C showed that the ozone concentration (10–20 mg/L) applied to the SE did not cause any significant changes in bacterial and viral particle counts in the ozone reactor effluents (ORE) (Figure 3c). However, the infectivity of these particles is unclear, since the FCM protocol used in the current study does not differentiate live and dead bacteria, nor does it provide information on viral infectivity. Ozone disinfection was mostly attributed to the damages of the bacterial cell membrane or the protein coat of viruses. The damage to DNA might have occurred, but only if ozone dosages were very high [30,31]. The current result indicated that the applied ozone dose in Plant C did not affect the bacterial and viral DNA/RNA integrity. In addition, the fouling problem at Plant C did not alleviate after the installment of the ozonation process [26]. In fact, studies have shown that the BOD level increased up to 20% after ozonation due to the degradation of some refractory organics [29]. The increase of available nutrients may stimulate the growth of biofilm on the MF membrane, and therefore, further study is needed to evaluate the impact of ozonation on the treatment train.
Chlorination was employed at both Plant A and B for SE disinfection. The concentration of total coliform bacteria in the final effluent, measured daily at both plants, meets the California Title 22 Water Recycling Criteria (7-day median of 2.2 most probable number (MPN)/100 mL, and no more than one sample exceeds 23 MPN/100 mL). Figure 3a shows that both bacteria and viruses in the chlorinated Plant A effluent were below the LLOD of the FCM, which corresponds to 3.7 log10 removal of bacteria and 4.3 log10 removal of viruses (Table 1). Surprisingly, little to no reduction of FCM counts was observed during the chlorination process at Plant B (Figure 3b). This dichotomy in observation required further examination of plant operation conditions to understand the factors that influence the effect of chlorine on bacterial and viral removal.
Both plants target the final concentration of total chlorine of 10 mg/L with a CT (concentration multiples by contact time) value of 1200 mg min/L. In the chlorine disinfection tanks of plant A, free chlorine residual in the effluent of the chlorine contact tank was 7 mg/L on average based on the daily data over the year of 2014. For Plant B, total chlorine was measured at the beginning and at the end of the chlorine contact tank, where the annual average concentrations of 12 and 9 mg/L was found, respectively. Further data analyses revealed that the influent water quality to the chlorine disinfection tank was dramatically different in Plant A and B. For Plant A, the AS process operated in a nitrification/denitrification model using a methanol augmented anoxic zone at the head of the aeration system. The concentration of ammonia in the disinfection tank influent averaged 0.39 mg/L for the study period (Table 2). In contrast, nitrogen removal is not part of the permit requirement for Plant B, and therefore a high concentration of ammonia was found in the influent to the disinfection tank (Table 2). It is apparent that, in Plant B, the total chlorine residual was predominantly in the form of monochloramine with the presence of low levels of di- and tri-chloramines depending on the pH. As a disinfectant, monochloramine is as effective as free chlorine for bacteria inactivation at a high dose or after prolonged contact time [32]. Jacangelo et al. [33] found that at a concentration normally used for disinfection (2–20 mg/L), monochloramine did not severely affect the bacterial nucleic acid structure. The inactivation was mainly due to the inhibition of protein-associated biological processes, such as bacterial respiration, membrane transport and substrate dehydrogenation. In contrast, free chlorine is a much stronger, non-discriminative oxidant, especially in the form of electrically neutral (HClO) under acidic conditions. (HClO) can penetrate the negatively charged bacterial cell walls and cause severe damage to the inner cell components such as nucleic acid [34]. The high bacterial particle counts in the effluent of plant B indicate that most of the bacterial cells still maintain their DNA integrity (Figure 3b). It is possible that some of the pathogenic bacteria are still alive or enter a state called “viable but non-culturable”. Even greater concerns are associated with the high viral concentration in these samples. Chloramines are generally ineffective for virus inactivation [15,35]. In a study on the chlorine disinfection of primary effluent, less than 0.5 log10 reduction of bacteriophage MS2 (a commonly used enteric virus indicator) was observed when 5 log10 inactivation of indicator bacteria (E. coli and Enterococcus) was achieved [9]. Therefore, potential viral infection risk may still exist during water reuse practices.

3.5. Inadequacy of Current Microbial Water Reuse Criteria

All three Southern California water reclamation plants investigated in this study are in compliance with the current regulatory requirement for water reuse. The dramatic difference in the concentrations of total bacteria and viruses observed in the Plant A and Plant B final effluent implies that FCM can provide a more comprehensive picture of the microbial removal rates during wastewater treatment processes than total coliform bacteria. This result raises the question of the adequacy of the current regulatory requirement for water reuse. It is obviously challenging to directly measure individual human pathogens in the final effluent for reuse purposes. However, total coliform bacteria as the sole indicator for human pathogens, including viruses and protozoa, is likely to underestimate the potential health risk [4]. In fact, U.S. EPA is currently considering the adoption of coliphage as an additional indicator for viruses for regulating wastewater effluent and recreational water quality. In addition, there is no real-time and online tool in the market for microbial water quality monitoring at water reclamation plants. The information on the microbial removal through conventional wastewater treatment processes is limited. This information gap has become a major source of uncertainty for the water reclamation trains, which also affects the potential pathogen removal credits allocable to these processes. The total bacterial and viral measurements determined by FCM are fast, easy, and have the potential for automation and real-time data collection. Therefore, it could be an ideal tool for unit process control. Although the total bacterial and viral particle counts may not reflect the viability/infectivity of the microorganisms, the approach is more conservative in a log removal rate analysis, as it includes injured bacteria/viruses that may be missed by culture-based methods.

4. Conclusions

  • The traditional secondary AS process with a high rate of clarification removed 1–2 log10 of bacteria but was not effective at viral removal.
  • The MBR achieved similar bacterial (5 log10) and viral (4 log10) removal rates in comparison with the standalone MF process.
  • For disinfection, both chloramine and free chlorine are equally effective in reducing total coliform bacteria to meet the water reuse criteria. High concentrations of bacterial and viral particles were still present in the final effluent after chloramine disinfection, while both organisms were below the LLOD of FCM in the final effluent of the plant using free chlorine as its main disinfectant.
  • Current water reuse criteria, using total coliform bacteria as the sole indicator of microbial quality, may underestimate the potential health risk under certain conditions. FCM targeting indigenous total bacteria and viruses shows potential as a rapid monitoring tool for the evaluation of microbial removal.

Acknowledgments

The authors would like to express their gratitude for the collaboration and support from Irvine Ranch Water District, Santa Margarita Water District and West Basin Municipal Water District for their assistance in sample collection and providing historical plant operation data. Graduate Fellowship support to Xiao Huang was provided by the U.S. National Science Foundation Partnerships for International Research and Education (OISE-1243543). The coordination and outreach support from UCI Water Energy Nexus Center (WEX) is acknowledged.

Author Contributions

Sunny C. Jiang conceived and designed the study with the support from all authors; Xiao Huang developed the FCM assay; Zheng Zhao and Dana Hernandez collected the experimental data. Xiao Huang, Zheng Zhao and Sunny C. Jiang analyzed the data and completed the manuscript.

Conflicts of Interest

The authors declare no conflict of interest.

References

  1. Natural Resources Defense Council (NRDC). Water Reuse Potential in California. 2014. Available online: http://pacinst.org/app/uploads/2014/06/ca-water-reuse.pdf (accessed on 13 October 2016).
  2. Drewes, J.E.; Horstmeyer, N. Recent Developments in potable water reuse. In Advanced Treatment Technologies for Urban Wastewater Reuse; Springer: Berlin, Germany, 2015; pp. 269–290. [Google Scholar]
  3. Harris-Lovett, S.R.; Binz, C.; Sedlak, D.L.; Kiparsky, M.; Truffer, B. Beyond user acceptance: A legitimacy framework for potable water reuse in California. Environ. Sci. Technol. 2015, 49, 7552–7561. [Google Scholar] [CrossRef] [PubMed]
  4. Olivieri, A.W.; Seto, E.; Cooper, R.C.; Cahn, M.D.; Colford, J.; Crook, J.; Debroux, J.-F.; Mandrell, R.; Suslow, T.; Tchobanoglous, G. Risk-Based Review of California’s Water-Recycling Criteria for Agricultural Irrigation. J. Environ. Eng. 2014, 140. [Google Scholar] [CrossRef]
  5. Jiang, S.C.; Lim, K.Y.; Huang, X.; McCarthy, D.; Hamilton, A.J. Human and environmental health risks and benefits associated with use of urban stormwater. Wiley Interdiscip. Rev. Water 2015, 2, 683–699. [Google Scholar] [CrossRef]
  6. Hall, A.J.; Lopman, B.A.; Payne, D.C.; Patel, M.M.; Gastañaduy, P.A.; Vinjé, J.; Parashar, U.D. Norovirus disease in the United States. Emerg. Infect. Dis. 2013, 19, 1198–1205. [Google Scholar] [CrossRef] [PubMed]
  7. Scott, T.; McLaughlin, M.; Harwood, V.; Chivukula, V.; Levine, A.; Gennaccaro, A.; Lukasik, J.; Farrah, S.; Rose, J. Reduction of pathogens, indicator bacteria, and alternative indicators by wastewater treatment and reclamation processes. Water Sci. Technol. Water Supply 2003, 3, 247–252. [Google Scholar]
  8. Zhang, C.-M.; Xu, L.-M.; Xu, P.-C.; Wang, X.C. Elimination of viruses from domestic wastewater: Requirements and technologies. World J. Microbiol. Biotechnol. 2016, 32, 1–9. [Google Scholar] [CrossRef] [PubMed]
  9. Tree, J.A.; Adams, M.R.; Lees, D.N. Chlorination of indicator bacteria and viruses in primary sewage effluent. Appl. Environ. Microbiol. 2003, 69, 2038–2043. [Google Scholar] [CrossRef] [PubMed]
  10. Stewart, E.J. Growing unculturable bacteria. J. Bacteriol. 2012, 194, 4151–4160. [Google Scholar] [CrossRef] [PubMed]
  11. Research Method 366.1 Determining the Total Cell Count and Ratios of High and Low Nucleic Acid Content Cells in Freshwater Using Flow Cytometry. 2012. Available online: http://www.isme-microbes.org/sites/isme-microbes.org/files/2012_SLMB_366%201%20ME%20EN%20Final.pdf (accessed on 13 October 2016).
  12. Drinking Water Unexpectedly Rich in Microbial Life. 2013. Available online: https://www.admin.ch/gov/en/start/documentation/media-releases.msg-id-47549.html (accessed on 13 October 2016).
  13. Ramseier, M.K.; von Gunten, U.; Freihofer, P.; Hammes, F. Kinetics of membrane damage to high (HNA) and low (LNA) nucleic acid bacterial clusters in drinking water by ozone, chlorine, chlorine dioxide, monochloramine, ferrate(VI), and permanganate. Water Res. 2011, 45, 1490–1500. [Google Scholar] [CrossRef] [PubMed]
  14. Huang, X.; Min, J.H.; Lu, W.; Jaktar, K.; Yu, C.; Jiang, S.C. Evaluation of methods for reverse osmosis membrane integrity monitoring for wastewater reuse. J. Water Proc. Eng. 2015, 7, 161–168. [Google Scholar] [CrossRef]
  15. Huang, X.; Qu, Y.; Cid, C.A.; Finke, C.; Hoffmann, M.R.; Lim, K.; Jiang, S.C. Electrochemical disinfection of toilet wastewater using wastewater electrolysis cell. Water Res. 2016, 92, 164–172. [Google Scholar] [CrossRef] [PubMed]
  16. Tamaki, H.; Zhang, R.; Angly, F.E.; Nakamura, S.; Hong, P.Y.; Yasunaga, T.; Kamagata, Y.; Liu, W.T. Metagenomic analysis of DNA viruses in a wastewater treatment plant in tropical climate. Environ. Microbiol. 2012, 14, 441–452. [Google Scholar] [CrossRef] [PubMed]
  17. Wu, Q.; Liu, W.-T. Determination of virus abundance, diversity and distribution in a municipal wastewater treatment plant. Water Res. 2009, 43, 1101–1109. [Google Scholar] [CrossRef] [PubMed]
  18. Shin, G.-A.; Sobsey, M.D. Removal of norovirus from water by coagulation, flocculation and sedimentation processes. Water Sci. Technol. Water Supply 2015, 15, 158–163. [Google Scholar] [CrossRef]
  19. Shirasaki, N.; Matsushita, T.; Matsui, Y.; Marubayashi, T.; Murai, K. Investigation of enteric adenovirus and poliovirus removal by coagulation processes and suitability of bacteriophages MS2 and φX174 as surrogates for those viruses. Sci. Total Environ. 2016, 563, 29–39. [Google Scholar] [CrossRef] [PubMed]
  20. Rosario, K.; Nilsson, C.; Lim, Y.W.; Ruan, Y.; Breitbart, M. Metagenomic analysis of viruses in reclaimed water. Environ. Microbiol. 2009, 11, 2806–2820. [Google Scholar] [CrossRef] [PubMed]
  21. Nieuwstad, T.J.; Mulder, E.; Havelaar, A.; Van Olphen, M. Elimination of micro-organisms from wastewater by tertiary precipitation and simultaneous precipitation followed by filtration. Water Res. 1988, 22, 1389–1397. [Google Scholar] [CrossRef]
  22. Marti, E.; Monclús, H.; Jofre, J.; Rodriguez-Roda, I.; Comas, J.; Balcázar, J.L. Removal of microbial indicators from municipal wastewater by a membrane bioreactor (MBR). Bioresour. Technol. 2011, 102, 5004–5009. [Google Scholar] [CrossRef] [PubMed]
  23. Hirani, Z.M.; DeCarolis, J.F.; Adham, S.S.; Jacangelo, J.G. Peak flux performance and microbial removal by selected membrane bioreactor systems. Water Res. 2010, 44, 2431–2440. [Google Scholar] [CrossRef] [PubMed]
  24. Branch, A.; Trinh, T.; Carvajal, G.; Leslie, G.; Coleman, H.M.; Stuetz, R.M.; Drewes, J.E.; Khan, S.J.; Le-Clech, P. Hazardous events in membrane bioreactors—Part 3: Impacts on microorganism log removal efficiencies. J. Membr. Sci. 2016, 497, 514–523. [Google Scholar] [CrossRef]
  25. Miura, T.; Okabe, S.; Nakahara, Y.; Sano, D. Removal properties of human enteric viruses in a pilot-scale membrane bioreactor (MBR) process. Water Res. 2015, 75, 282–291. [Google Scholar] [CrossRef] [PubMed]
  26. Zhao, Z. Personal communication, 15 January 2015.
  27. Tam, L.; Tang, T.; Lau, G.N.; Sharma, K.; Chen, G. A pilot study for wastewater reclamation and reuse with MBR/RO and MF/RO systems. Desalination 2007, 202, 106–113. [Google Scholar] [CrossRef]
  28. Pype, M.-L.; Lawrence, M.G.; Keller, J.; Gernjak, W. Reverse osmosis integrity monitoring in water reuse: The challenge to verify virus removal—A review. Water Res. 2016, 98, 384–395. [Google Scholar] [CrossRef] [PubMed]
  29. Xu, P.; Janex, M.-L.; Savoye, P.; Cockx, A.; Lazarova, V. Wastewater disinfection by ozone: Main parameters for process design. Water Res. 2002, 36, 1043–1055. [Google Scholar] [CrossRef]
  30. Hunt, N.K.; Mariñas, B.J. Kinetics of Escherichia coli inactivation with ozone. Water Res. 1997, 31, 1355–1362. [Google Scholar] [CrossRef]
  31. Gehr, R.; Wagner, M.; Veerasubramanian, P.; Payment, P. Disinfection efficiency of peracetic acid, UV and ozone after enhanced primary treatment of municipal wastewater. Water Res. 2003, 37, 4573–4586. [Google Scholar] [CrossRef]
  32. Rose, L.J.; Rice, E.W.; Hodges, L.; Peterson, A.; Arduino, M.J. Monochloramine inactivation of bacterial select agents. Appl. Environ. Microbiol. 2007, 73, 3437–3439. [Google Scholar] [CrossRef] [PubMed]
  33. Jacangelo, J.G.; Olivieri, V.P.; Kawata, K. Investigating the Mechanism of Inactivation of Escherichia-Coli-B by Monochloramine. J. Am. Water Works Assoc. 1991, 83, 80–87. [Google Scholar]
  34. Cho, M.; Kim, J.; Kim, J.Y.; Yoon, J.; Kim, J.-H. Mechanisms of Escherichia coli inactivation by several disinfectants. Water Res. 2010, 44, 3410–3418. [Google Scholar] [CrossRef] [PubMed]
  35. Cromeans, T.L.; Kahler, A.M.; Hill, V.R. Inactivation of Adenoviruses, Enteroviruses, and Murine Norovirus in Water by Free Chlorine and Monochloramine. Appl. Environ. Microbiol. 2010, 76, 1028–1033. [Google Scholar] [CrossRef] [PubMed]
Figure 1. Schematic of unit treatment processes at three water reclamation plants sampled during this study. Star indicates the sampling locations along the treatment trains.
Water 08 00464 g001
Figure 2. Flow cytometry data analysis using a single-parameter plot (a) and density plot (b). The single-parameter plot identifies particle peaks (M1 and M2); the two-parameter density plot distinguishes different particle populations. The gated region in the density plot is used to quantify the number of counts in each cluster. The R1 region is defined as viral particles and the R2 region is defined as bacterial particles based on their relative fluorescent intensity.
Water 08 00464 g002
Figure 3. Bacterial and viral counts by FCM in samples from three Southern California water reclamation plants. (a) Plant A; (b) Plant B and (c) Plant C. The relative standard deviation is less than 5% for each bar graph. PE: primary effluent; SE: secondary effluent; MBRE: membrane bioreactor effluent; DMFE: dual medium filtration effluent; CDI: chlorine disinfection influent; CDE: chlorine disinfection effluent; ORE: Ozone reactor effluent; MFE: microfiltration effluent; ROE: reverse osmosis effluent; UVE: UV treatment effluent. The red line and blue line indicate the FCM detection limits of bacteria and virus under current assay conditions, respectively.
Water 08 00464 g003
Table 1. Summary of log10 removal efficiency of bacteria and viruses in different water reclamation processes.
Plant AASDMFMBRCD
Bacteria1.66 ± 0.40.25 ± 0.15.9 ± 0.33.7 ± 0.4
Virus−0.30 ± 0.160.09 ± 0.34.3 ± 0.24.3 ± 0.4
Plant BASCD
Bacteria1.33 ± 0.2−0.02 ± 0.2
Virus0.12 ± 0.10.12 ± 0.2
Plant COzoneMFROUV
Bacteria0.07 ± 0.15.10 ± 0.1N.A. *N.A. *
Virus0.3 ± 0.14.25 ± 0.2N.A. *N.A. *
Notes: AS: activated sludge process with clarification; DMF: dual media filtration; MBR: membrane bioreactor; CD: chlorine disinfection; MF: microfiltration; RO: reverse osmosis; UV: ultraviolet radiation; N.A. *: data was not available due to the microbial concentrations being below the detection limit.
Table 2. Comparison of nitrogen concentration in two chlorine disinfection tank influents from two Southern California reclamation plants.
NH3 (mg/L)NO2 (mg/L)NO3 (mg/L)
Plant A0.39 ± 1.100.15 ± 0.1010.90 ± 1.55
Plant B38.88 ± 5.481.71 ± 0.991.85 ± 1.04

