Article

Nonlinear Relationship of Near-Bed Velocity and Growth of Riverbed Periphyton

1
Civil Engineering Department, Tokyo Institute of Technology, 2-12-1-M1-4 Ookayama, Tokyo 152-8550, Japan
2
Sanitary Engineering Department, Faculty of Engineering, Alexandria University, P.O. Box 21544, Alexandria 21544, Egypt
3
Faculty of Agriculture, Meiji University, 1-1-1, Higasi-mita, Tama Ward, Kawasaki City, Kanagawa 214-8571, Japan
*
Author to whom correspondence should be addressed.
Water 2016, 8(10), 461; https://doi.org/10.3390/w8100461
Submission received: 18 June 2016 / Revised: 3 October 2016 / Accepted: 12 October 2016 / Published: 17 October 2016

Abstract

:
Artificial streams were set up to test the relationship between near-bed water velocity and periphyton growth. Periphyton community samples collected from a Japanese stream were incubated for 44 days under a light intensity of 252 ± 72 μmol·photons/m2·s, a temperature of 20–25 °C, and three near-bed water velocity classes: low (<17.9 cm/s), moderate (17.9–32.8 cm/s), and high (>32.8 cm/s). A logistic model was applied to estimate the maximum net growth rate (μmax) and carrying capacity (Bmax). A response surface method was also applied to estimate chlorophyll a (Chl-a) and ash-free dry mass (AFDM) with respect to the independent variables (i.e., time and water velocity). We detected both the highest μmax (1.99 d−1) and highest Bmax (7.01 mg/m2) for Chl-a at the moderate water velocity. For AFDM, we observed the highest μmax (0.57 d−1) and Bmax (1.47 g/m2) at the low and moderate velocity classes, respectively. The total algae density in the region of moderate velocity at the end of the experiment was 6.47 × 10³ cells/cm2, corresponding to levels 1.7 and 1.3 times higher than those at lower and higher velocities, respectively. Our findings indicated that the moderate near-bed water velocity provided favorable conditions for algal growth and corresponding biomass accumulation.

1. Introduction

Periphyton refers to a complex layer composed of algae, cyanobacteria, heterotrophic microbes, and detritus attached to the sediment surface or to aquatic macrophytes in aquatic systems [1]. It serves as an important food source for invertebrates and some fish, and it can absorb and immobilize major nutrients and some heavy metal contaminants [2]. Moreover, periphyton plays a major role in the metabolic conversion and partial removal of biodegradable materials in rivers and streams [3]. However, it can pose engineering and environmental problems; for instance, it clogs hydraulic devices [4] and is sensitive to eutrophication [5]. Therefore, understanding the growth dynamics of periphyton, including removal and reproduction rates, is essential.
Temporal shifts in periphyton biomass depend on its growth and detachment processes, as well as grazing by aquatic fauna. Benthic grazers can be an important factor that determines periphyton biomass, in combination with the near-bed current [6,7,8]. At the same time, periphyton growth is affected by environmental factors, such as light [9], temperature [10], substrate availability [11,12], magnitude of flood events and elapsed time after floods [13,14], and water turbulence in streams [8,15], with detachment of periphyton occurring when a critical shear stress is reached by the increase in the near-bed velocity [16]. Several studies have confirmed the relationship between periphyton and water velocity, either in laboratory-scale experiments [8,17,18] or in natural streams [14,19]. Additionally, periphyton growth is stimulated at low velocities of up to approximately 0.1 m/s, declines with increasing velocities, and is eliminated by velocities greater than approximately 1 m/s [20]. Similarly, the growth rate of periphyton biomass increases as the Reynolds number increases, and eventually decreases after reaching a critical level [17]. Such interactions between the near-bed water velocity and periphyton growth are associated with changes in bed surface roughness. Furthermore, hydrodynamic transport conditions play a key role in structuring benthic microbial communities [21,22,23,24].
Nevertheless, the relationship between periphyton biomass and water velocity has not yet been described in sufficient detail to understand and model the relationship in a quantitative manner. In the literature, we acknowledge that periphyton biomass increases in proportion to velocity roughly within the range between 20 and 50 cm/s [17,25,26]. In addition, any increment above these critical velocities resulted in a reduction of biomass accumulation [27]. However, most experimental studies have tested only two or three ranges of overlapping current velocity and, in field studies, these are often under variable conditions of flow. Thus, the detailed characteristics of the relationship, including its possible nonlinearity, have not been well established. Further, variations in near-bed water velocity were previously shown to change the structure of periphyton communities in both laboratory [28] and field experiments [29].
The response of periphyton growth to water characteristics is often quantified by mathematical models [30]. Uehlinger et al. [31] evaluated the dominant processes controlling periphyton biomass by comparing chlorophyll a (Chl-a) estimates with simulated outputs from an empirical dynamic periphyton model. Uehlinger et al. [13] used a hyper-model considering the dependencies of periphyton growth and detachment on internal and external variables, such as incident light, water temperature, biomass, and discharge. Graba et al. [16] used a simplified form of the model introduced by Uehlinger et al. [31] and determined that the role of local hydrodynamics in the catastrophic detachment process is likely associated with the magnitude of floods. Recently, response surface methodology (RSM) has attracted significant attention as a statistical tool to determine the optimal conditions for multiple variables [32,33,34]. RSM has many advantages compared to other methods; for instance, it is more economical and less time-consuming [35,36,37].
In this study, we constructed artificial streams that simulated a wide range of water velocities to examine the effect of near-bed velocity on periphyton growth characteristics under no-grazing conditions. The periphyton was collected from the community in the Sagami River, Japan, which is characterized by a high species diversity and the predominance of diatoms. Furthermore, we applied the RSM to the results to enhance our understanding of the effect of near-bed velocity on population growth.

2. Materials and Methods

2.1. Periphyton Collection and Processing

Periphyton was collected from the riffle located 1.5 km below the Saito Bridge on the Sagami River, Japan, on 31 October 2014. Riverbed stones were harvested from different locations and classified into five ranges of near-bed velocity: 0–15 cm/s, 15–30 cm/s, 30–45 cm/s, 45–60 cm/s, and 60–75 cm/s. About 12 riverbed cobbles were randomly selected for each category (60 cobbles in total). The collected stones were kept in aerated river water for 10 days. Kobayashi et al. [38] identified 47 species in the Sagami River in autumn; the major genera were Navicula, Nitzschia, and Cymbella. Dominant species were Nitzschia frustulum v. perpusilla, followed by Navicula yuraensis and Homoeothrix janthina.

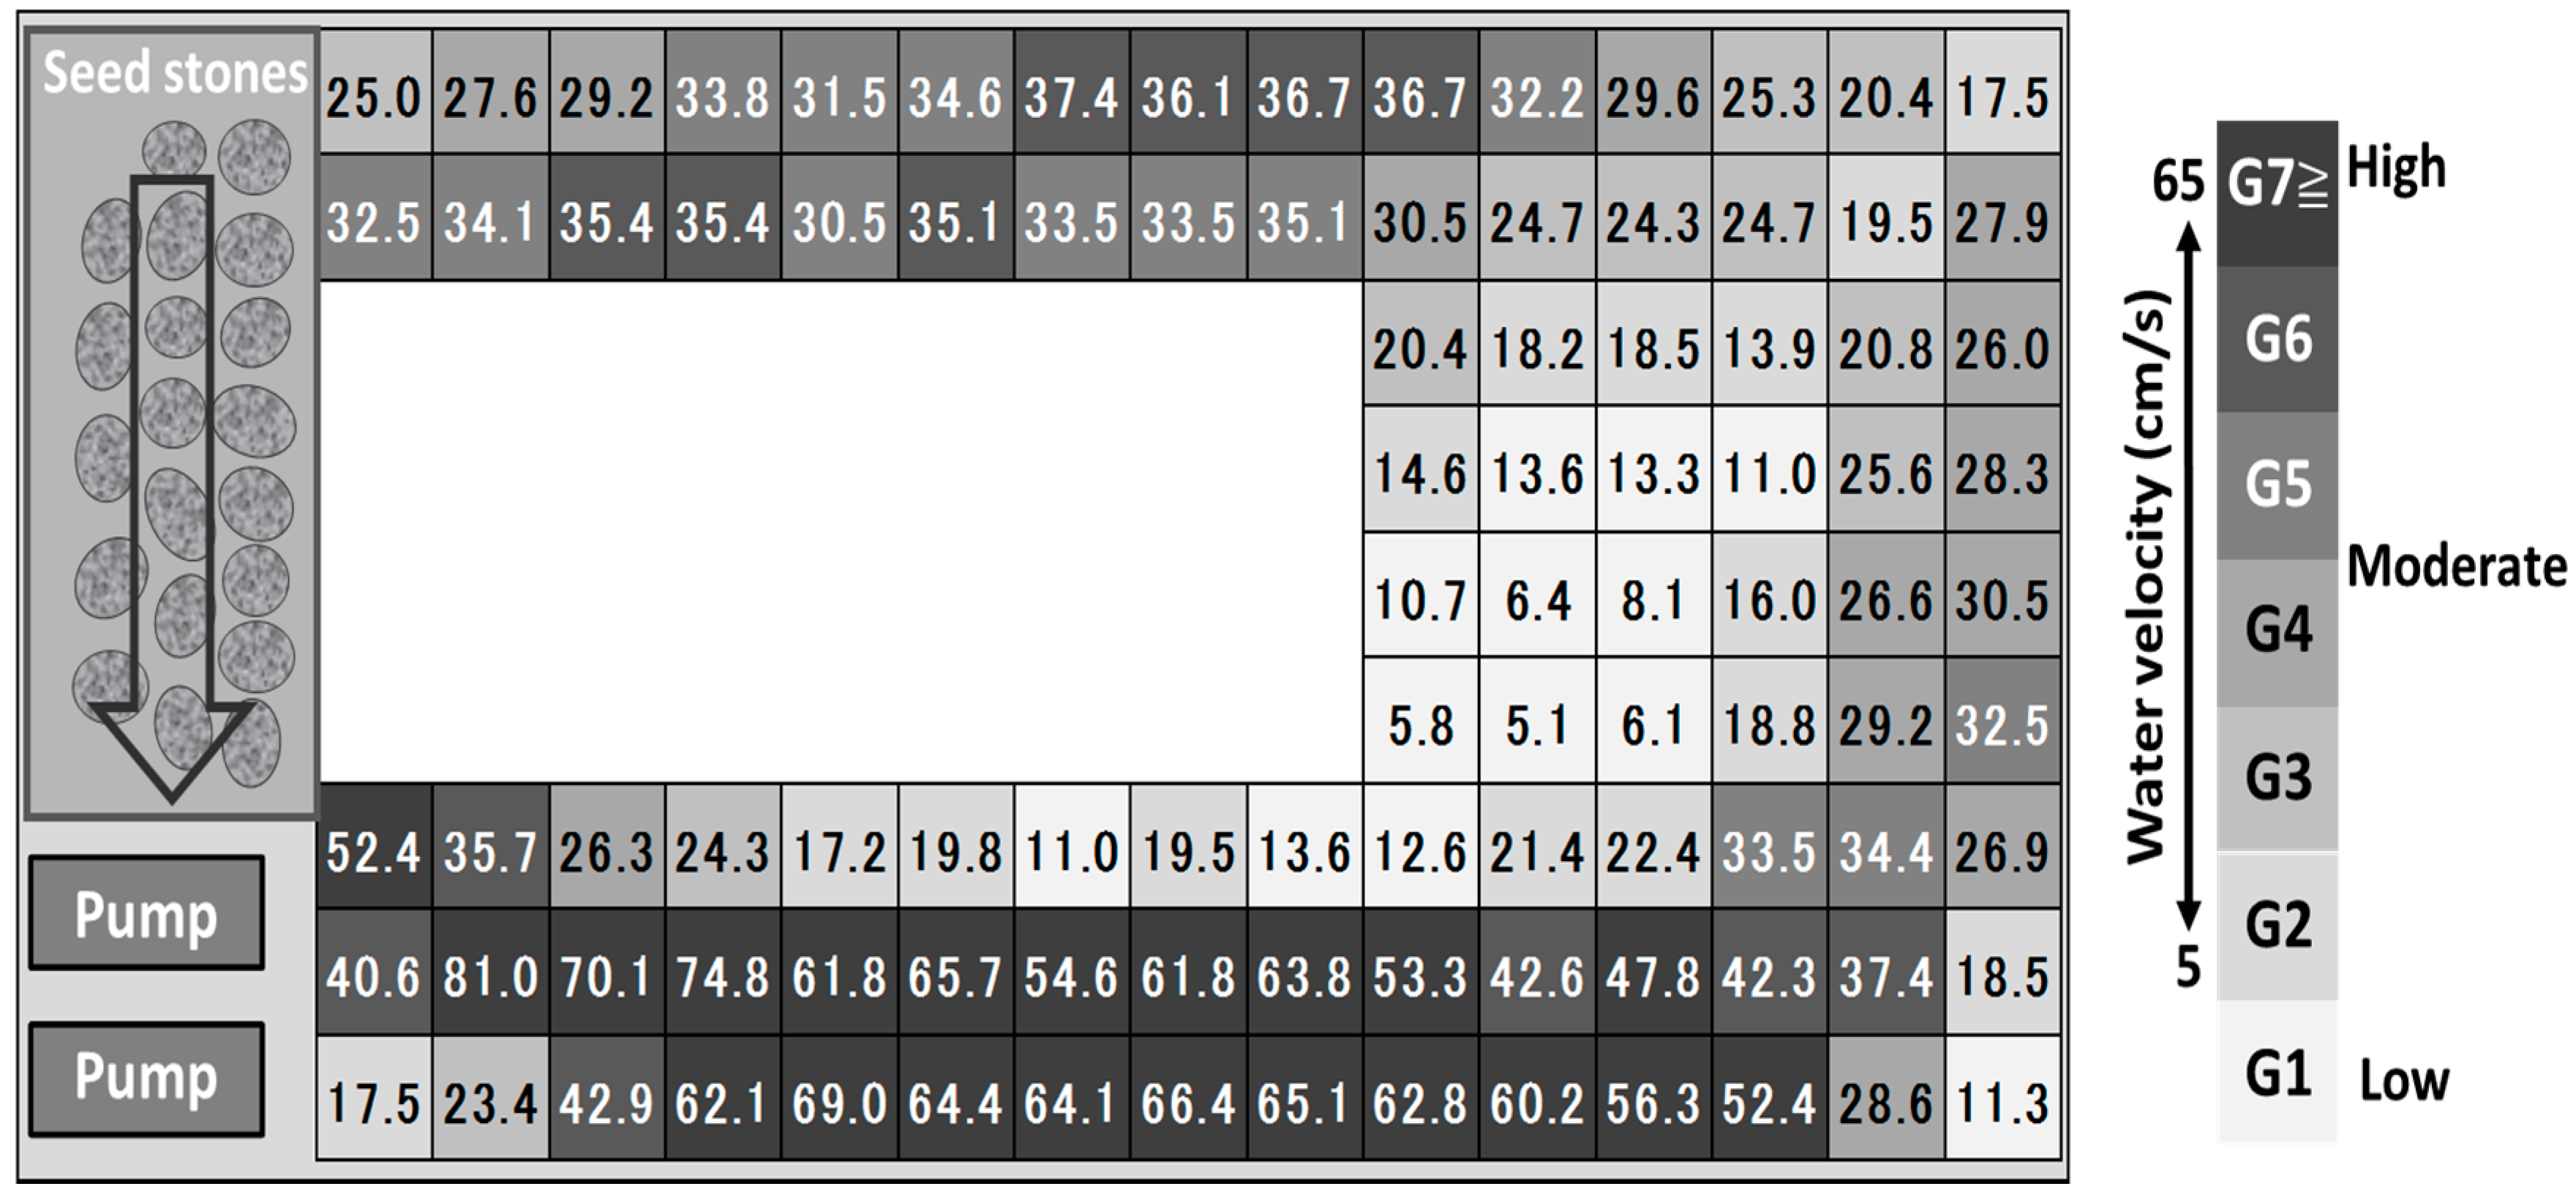
2.2. Experimental Setup

We established three identical artificial streams (approximately 40 L each, with a water depth of 11 cm) containing ceramic tiles (99 tiles/stream) and seed stones placed on the bottom of the stream to investigate the effect of the flow regime on periphyton (Figure 1). The collected stones covered with periphyton from Sagami River were used as seed. Two aquarium pumps (Rio+ Power Head 2100/800; Kamihata, Himeji, Japan) generated the flow in the stream such that the water velocity at 2 cm above the center of the tiles ranged 5–65 cm/s at initial conditions (no periphyton). A propeller meter (CR-11; Cosmo Riken, Osaka, Japan) was used to record the highest near-bed water velocity in all directions in 45° increments. In this manner, we quantified the near-bed current across the tile surfaces. An artificial light source (two incandescent lamps per aquarium) was placed above the streams and turned on from 5 A.M. to 9 P.M. every day, providing light at an intensity of 252 ± 72 μmol·photons/m2·s. The water temperature was kept constant at 20 ± 1 °C in dark conditions and 25 ± 1 °C in light conditions.
Periphyton culture medium was prepared following the constituents of the modified Detmer medium [36]. The nutrients added to the artificial streams included Ca(NO3)2·4H2O (11.5 mg/L), K2HPO4 (2.5 mg/L), Na2SiO3·9H2O (2.3 mg/L), MgSO4·7H2O (0.4 mg/L), and FeSO4·7H2O (0.1 mg/L). The initial concentrations of nutrients in the streams were 1.30 mg/L NO3–N, 0.04 mg/L NO2–N, and 0.47 mg/L PO4–P. Nutrients were dissolved in purified water and added to each stream twice a week to adjust for water evaporation and decreased nutrient concentration in the media due to uptake by periphyton. Periphyton in the streams were incubated over 44 days. We assumed no significant effect of the incubated periphyton on the water velocity as the biomass at the end of this incubation was much lower than in previously reported cases showing velocity attenuation [16].
The tiles in each stream were categorized into seven near-bed water velocity ranges (with category and mean range velocity given parenthetically; Figure 1): 5.1–13.6 cm/s (G1: 9.4 cm/s), 13.9–19.8 cm/s (G2: 17.9 cm/s), 20.4–25.6 cm/s (G3: 23.0 cm/s), 26.0–30.5 cm/s (G4: 28.2 cm/s), 30.5–35.1 cm/s (G5: 32.8 cm/s), 35.1–42.9 cm/s (G6: 39.0 cm/s), and 47.8–64.1 cm/s (G7: 56.0 cm/s). Each group consisted of 13 tiles for a total of 91 tiles per stream (an additional eight tiles were outside the study velocity range). One sample was randomly harvested from each group in the three streams (i.e., 1 sample/group × 7 groups/stream × 3 streams = 21 samples). Over the experimental duration of 44 d, samples were collected at twelve time-points: 1, 2, 5, 9, 12, 15, 19, 22, 26, 30, 39, and 44 d from the starting point. Accordingly, the number of samples collected during the whole experiment was 21 samples × 12 time points = 252 samples. Periphyton samples were scraped with a brush from the whole surface area of the tile, filtered with a 0.7 μm glass fiber filter, collected in light-blocking polyethylene bottles, and stored at 4 °C until the analysis.

2.3. Analysis

Algal biomass was quantified by Chl-a dry mass (DM), ash-free dry mass (AFDM), and the autotrophic index (AI). For the Chl-a analysis, a certain volume of water sample was filtered through Whatman Glass microfiber filters, Grade GF/F. The filtrates were soaked in N,N-dimethylformamide (DMF) to extract Chl-a. Samples were placed in centrifuge tubes, covered with aluminum foil, and stored in a freezer. After one day, the Chl-a concentration was measured by a fluorescence photometer (RF-5300, Shimadzu Co. Ltd., Kyoto, Japan) and a quartz cuvette (1 cm path length) with excitation and emission wavelengths of 432 and 668 nm, respectively [39]. Finally, Chl-a concentrations were calculated using Equation (1) [40]:
( Chl - a ) = ( F C h l F P h e o ) × V ( S C h l S P h e o ) × A
where Chl-a is estimated in mg/cm2; FChl and FPheo are fluorometry signals for the two pigments Chl-a and Pheo-a, respectively; SChl and SPheo (L/mg) are the slopes of the calibration line of the two pigments Chl-a and Pheo-a, respectively; A (m2) is the surface area of the tile; and V (L) is the volume of the DMF solution.
For DM measurement, samples were dried at 105 °C for 24 h. For AFDM, specimens were ashed in a muffle furnace at 500 °C for 3 h. Pearson’s correlation coefficient (r) and p-value were used to examine the linear relationship between variables and calculate significance (α = 0.05), respectively. To calculate the AI, AFDM was divided by Chl-a (Equation (2)) [41]:
A I = A F D M Chl - a
In addition, the periphyton composition at the end of the experiment was identified to the genus level under an optical microscope based on Akiyama et al. [42] and Watanabe et al. [43]. To examine the effects of velocity on the periphyton composition, Shannon’s diversity index [44] was calculated at each velocity (Equation (3)).
H = i = 1 S D i ln D i
where H′, S, and Di indicate the Shannon’s diversity index, species or genus abundance, and cell abundance of each species, respectively.

2.4. Model Application

The logistic model (Equation (4)) was applied to represent the general growth process of periphyton [45]:
d B d t = μ max B ( 1 B B max )
where dB/dt is the net rate of biomass growth, B is the biomass of the organism (g/m2) at an arbitrary time t, μmax is the maximum specific growth rate constant (d−1), and Bmax is the carrying capacity (at the quasi-stationary phase in g/m2), which depends on the carrying capacity of the environment. The values of μmax and Bmax were estimated using a genetic algorithm, owing to its simplicity, using MATLAB code (M-files).
Multiple regression analysis was applied to visualize the relationship between the independent variables (incubation time and water velocity) and periphyton growth. In this analysis, second-order terms were also included a priori (Equation (5), i.e., RSM) because periphyton growth shows nonlinear responses over time and velocity [46]:
Y = a + b X t + c X v + d X t X v + e X t 2 + f X v 2
where Y represents the response variable (Chl-a, AFDM, and AI), a is an error term, b and c are linear terms, d is the interaction term, e and f are quadratic terms, and Xt and Xv represent time and near-bed water velocity. The advantage of multiple regression analysis is that the model equation can show the effects of the independent variables, taken together, on the dependent variable. Assuming each term in Equation (5) is independent each other, significant variables were selected by backward selection method (F > 2.0; MATLAB R2014a, MathWorks, Inc., Natick, MA, USA).

3. Results and Discussion

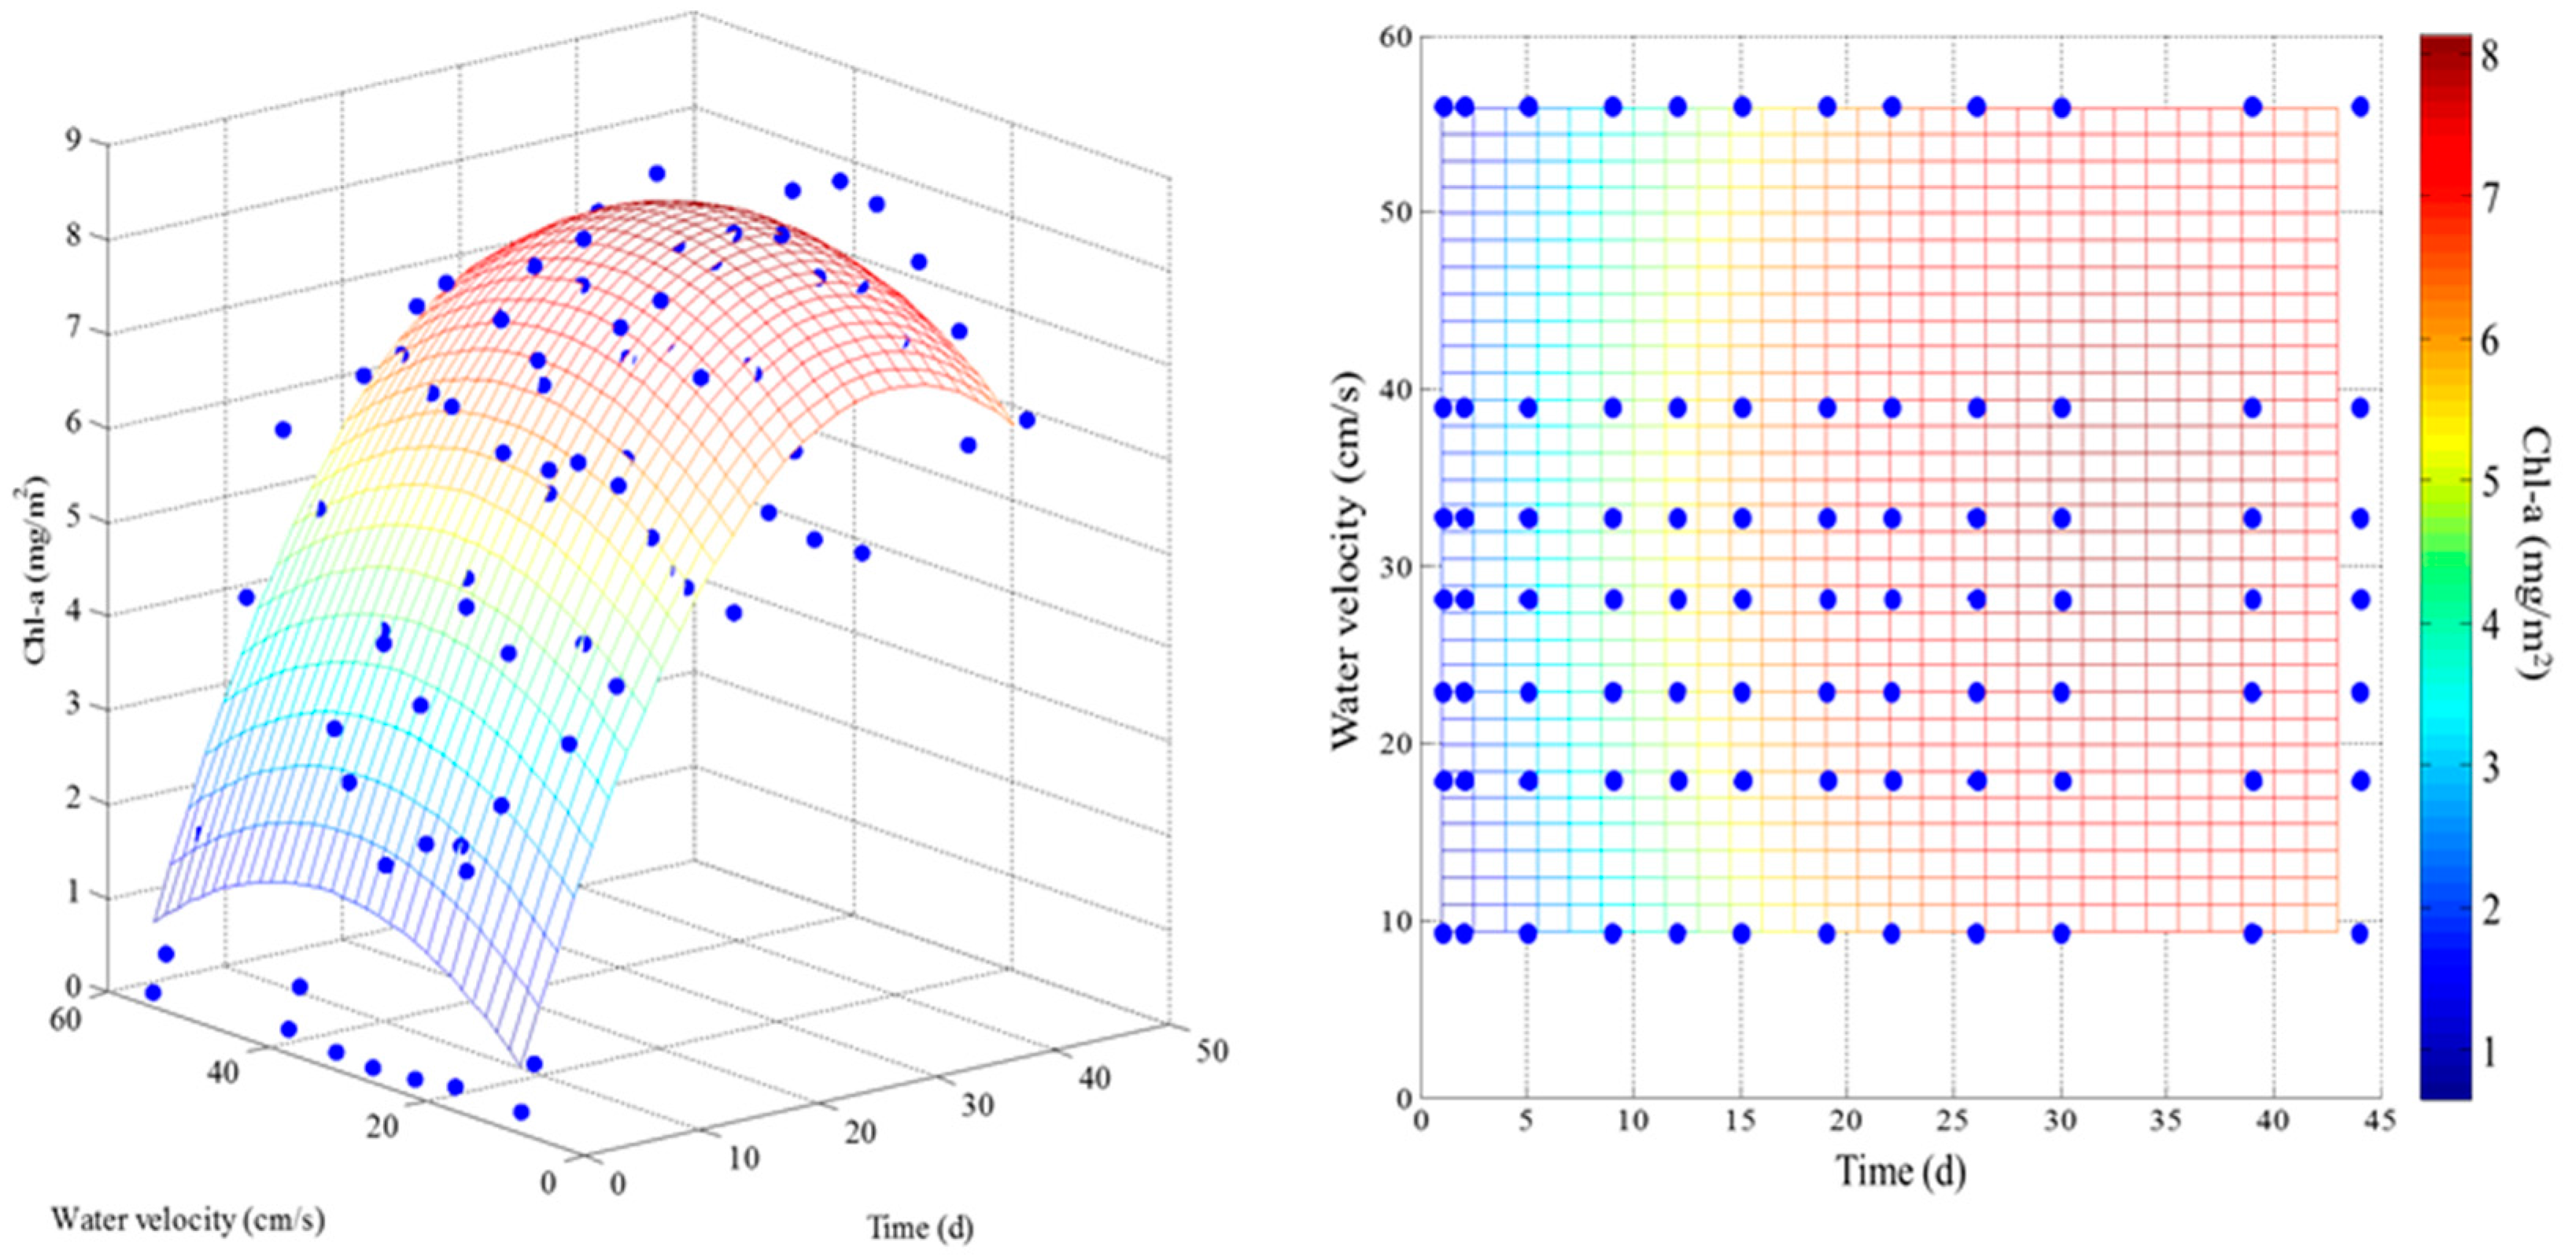
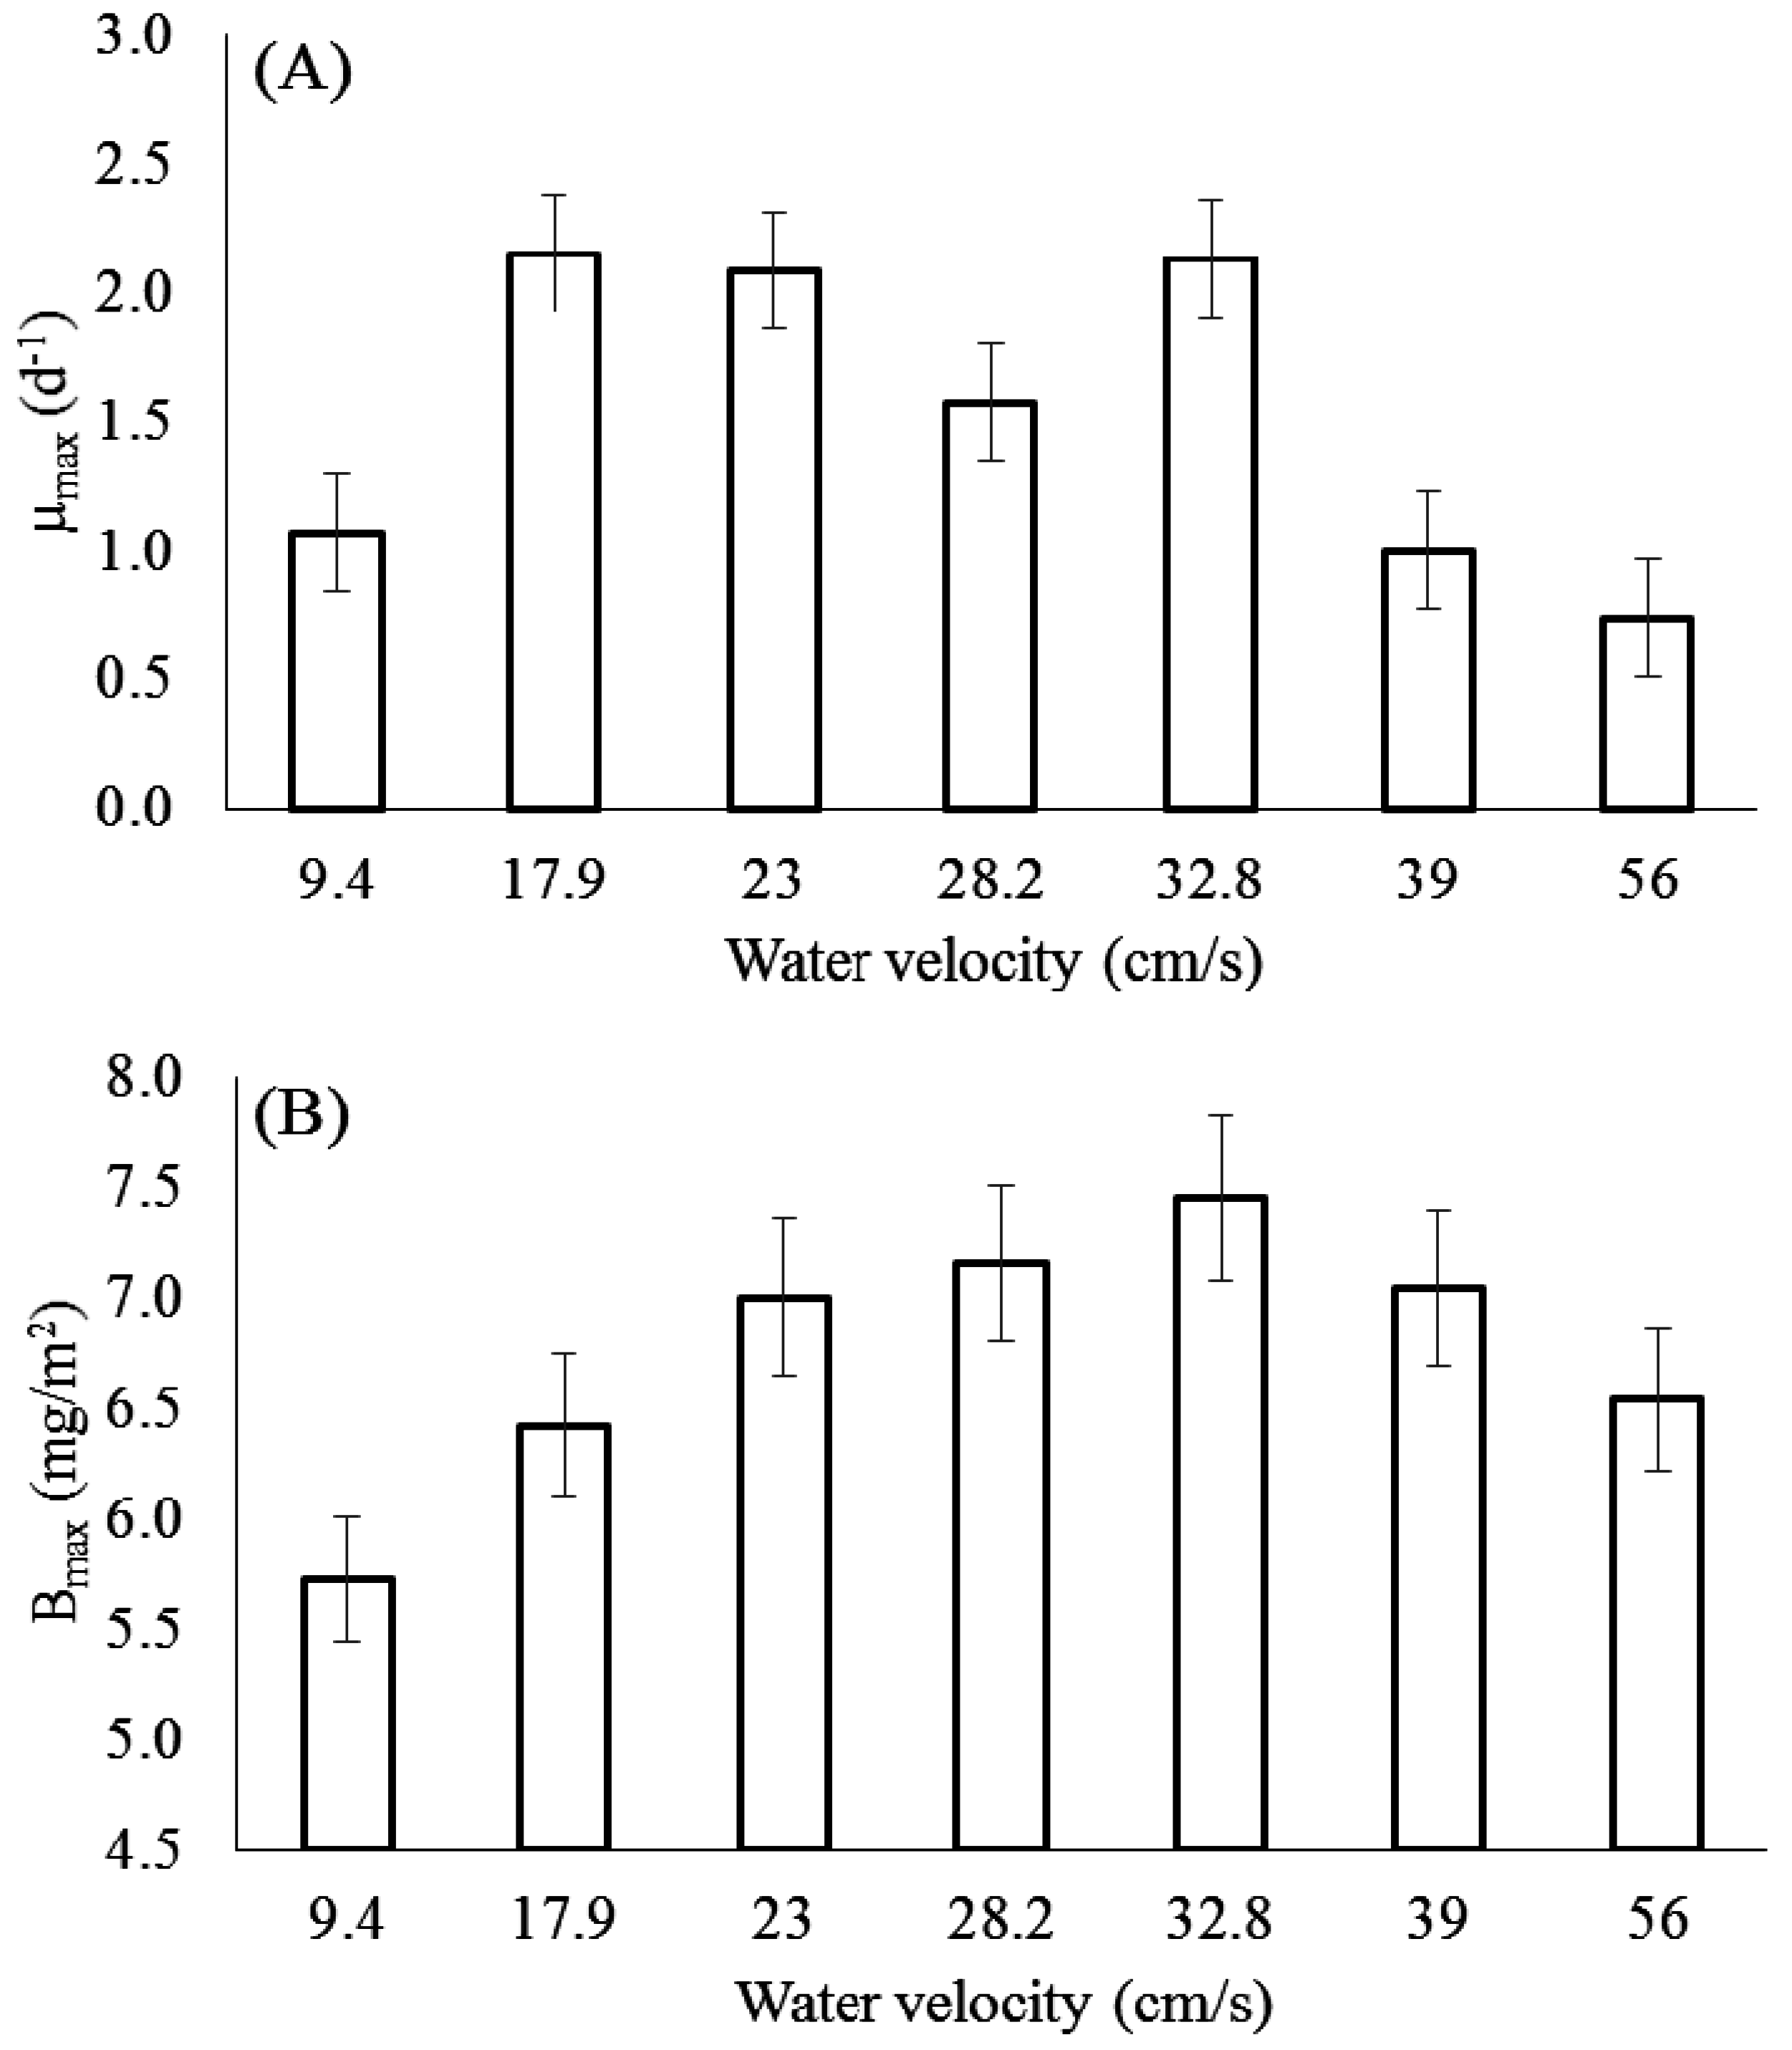
3.1. Effect of Velocity on Chlorophyll-a

The relationship between the independent variables (incubation time and water velocity) and Chl-a were determined by RSM (Equation (6)) and visualized by examining the surface plot presented in Figure 2. The coefficient of determination (r2 value) between measured data and simulated results from the quadratic model was 0.85 (p < 0.001), indicating that the model represented the experimental data in a satisfactory manner. There was a positive correlation between Chl-a and the linear terms, while the quadratic terms had a negative impact on Chl-a. According to the model, the optimum values for Xt and Xv were 33.55 d and 38.38 cm/s, respectively, which yielded Chl-a of 8.21 mg/m2:
Y Chl - a = 0 . 3728 X t + 0 . 1022 X v + 0 . 0013 X t X v - 0 . 0063 X t 2 - 0 . 0019 X v 2
where YChl-a is the concentration of Chl-a (mg/m2), Xt is time (d), and Xv is the near-bed water velocity (cm/s).
Chl-a of the periphyton tended to increase exponentially from day 1–day 15 (accrual phase), after which slight differences in patterns of Chl-a concentration were observed (Figure 2). For example, in the region with a low water velocity, Chl-a increased significantly from 0.20 mg/m2 to 5.78 mg/m2 from day 1–day 15 (r = 0.927, p = 0.008). As additional time elapsed, Chl-a showed a non-significant increase by day 44 (r = 0.642, p = 0.120). These results indicate that periphytic growth under low near-bed water velocity conditions stopped after 15 days. This might be due to the limited diffusional acquisition of substrates [13,46].
Sites subjected to high near-bed water velocity showed a dramatic increase in Chl-a up through day 15, reaching a density of 6.28 mg/m2 (r = 0.970, p = 0.001). In contrast to the results for a low near-bed velocity, Chl-a continued to increase over time (after day 15) and reached 7.89 mg/m2 at day 44 (r = 0.781, p = 0.038). This indicates that a higher velocity promotes biomass accumulation. Similar behavior was observed for tiles exposed to moderate water velocity, where r-values for days 1–15 and days 15–44 were 0.959 (p = 0.003) and 0.734 (p = 0.061), respectively.
The values of μmax and Bmax were estimated from the logistic model for the three water velocity ranges (Figure 3). The area with a lower velocity had an average μmax of 1.62 d−1, which was 1.2-fold lower than that for the moderate velocity. The average μmax for the moderate water velocity (1.99 d−1) was approximately 1.5 times higher than that of the high water velocity, demonstrating a greater negative impact on μmax when water velocity exceeded 32.8 cm/s. Additionally, the average Bmax for the moderate velocity was 7.01 mg/m2, which was 1.2-fold higher than that observed for the lower velocity. However, Bmax showed a negative trend when the water velocity exceeded 32.8 cm/s (r = −0.98, p = 0.13).
The positive effect of near-bed velocity persists until the saturation of nutrient uptake occurs [47,48]. At a low velocity, insufficient nutrient acquisition (owing to the limited diffusional influx) could lead to decreased Chl-a biomass. In contrast, high near-bed water velocity increases shear stress, which can lead to sloughing of the biomass (i.e., the detachment of biomass sections caused by the death of cells at the biomass/solid interface) [49]. Thus, biomass accumulation may require a longer time owing to the high shear stress.
The optimal near-bed water velocity that maximizes biomass varies considerably with environmental and biofilm-specific attributes [50]. For example, Luce et al. [51] reported that the optimal near-bed water velocity in natural rivers is 25 cm/s above the riverbed. Additionally, Hondzo and Wang [52] suggested that for velocities greater than 10–15 cm/s, hydrodynamic shear stress begins to influence biofilm architecture, taxonomic composition, and nutrient cycling. In a similar study, Tonkin et al. [53] studied the effect of physicochemical variables on periphyton biomass Chl-a, and found an r-value of 0.57 for a velocity range of 19–56 cm/s. Additionally, Arnon, et al. [18] studied the effect of overlying velocity (0.05–5.00 cm/s) on microbial biomass in 120-day-old periphyton. They found that near-bed velocity has a positive impact on Chl-a (r2 = 0.83, p < 0.001), where the Chl-a concentration at 5 cm/s was 2.55 mg/m2, which is 7.14 times higher than those under 0.5 cm/s and 0.05 cm/s. Furthermore, Jowett and Biggs [29] studied the effects of near-bed water velocity on the accumulation of periphyton, and found significantly higher Chl-a concentrations for a velocity of 20–50 cm/s than for other velocities.
According to these results, the moderate near-bed water velocity (17.9–32.8 cm/s) provided more favorable conditions for Chl-a, which increased slowly when the near-bed water velocity was low (<17.9 cm/s) or high (>32.8 cm/s).

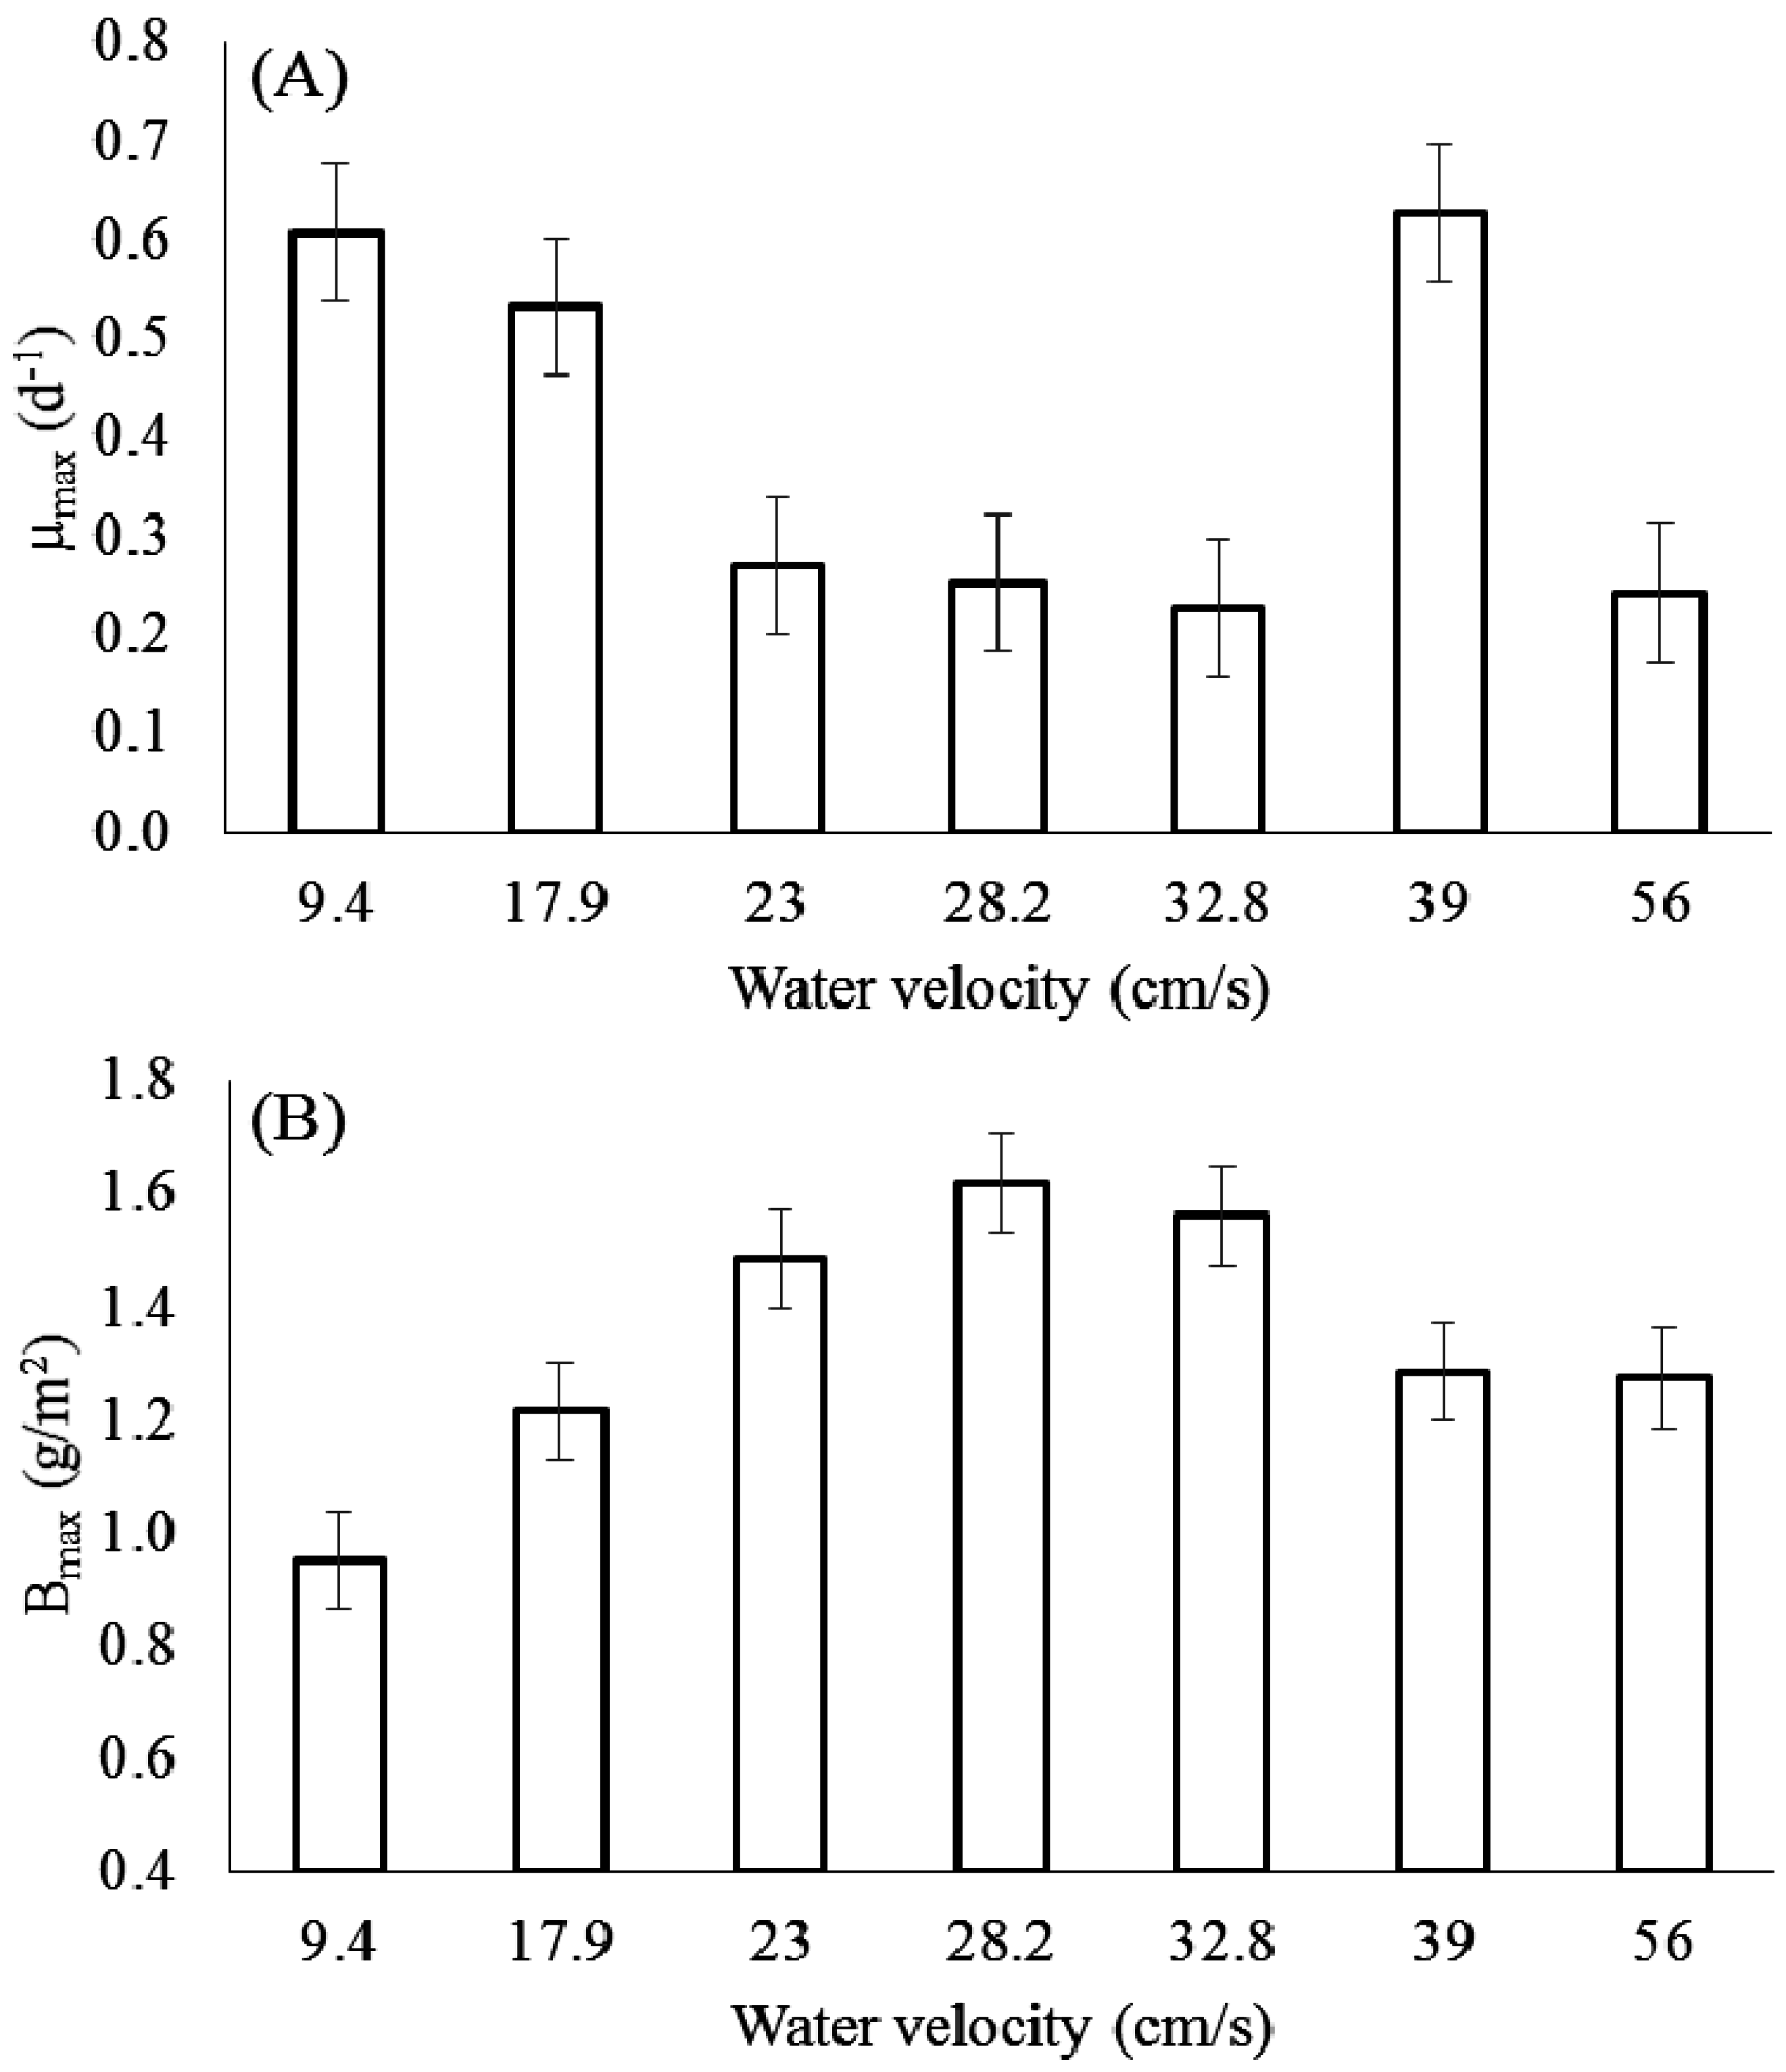
3.2. Effect of Velocity on Biomass

Under conditions of low near-bed velocity (<17.9 cm/s), AFDM increased during the initial period of growth (accrual phase), and reached 1.88 g/m2 at day 15 (r = 0.780, p = 0.067). This trend was similar to those observed at other sites subjected to moderate and high water velocities with r-values of 0.777 (p = 0.069) and 0.774 (p = 0.071), respectively. After day 15, AFDM fluctuated until the end of the experimental period with r-values of −0.318 (p = 0.486), 0.237 (p = 0.609), and 0.302 (p = 0.510) for low, moderate, and high water velocities, respectively.
The coefficient of determination between measured data and simulated results from the quadratic model had r2-value of 0.68 (p < 0.001). AFDM was positively and negatively correlated with the linear and quadratic terms of time, respectively (Equation (7)). According to this model, the highest AFDM concentration of 1434 mg/m2 was obtained at Xt of 39.99 d.
Y AFDM = 71 . 718 X t - 0 . 8967 X t 2
where, YAFDM is AFDM (mg/m2) and Xt is contact time (d).
The effect of the near-bed water velocity on μmax and Bmax for AFDM is displayed in Figure 4. According to the logistic model, μmax decreased from 0.61 d−1 at 9.4 cm/s to 0.27 d−1 at 23 cm/s (r = −0.90, p = 0.28), after which it remained relatively constant at 0.32 d−1 for 23–56 cm/s (r = 0.1, p = 0.88). This suggests that the growth rate for AFDM is higher for low velocities (9.4–17.9 cm/s). In contrast, Bmax was 0.95 g/m2 for 9.4 cm/s and peaked at 1.62 g/m2 for 28.2 cm/s (r = 0.99, p = 0.007). Subsequently, Bmax dropped to 1.27 g/m2 as a function of increasing water velocity to 56 cm/s (r = −0.83, p = 0.17). An identical analysis using DM data showed similar performance to AFDM, but higher Bmax values. This can be explained by inorganic matter in the samples [2,54].
The optimal near-bed water velocity that maximizes AFDM in a natural river was 15 cm/s above the riverbed stone [48]. Jowett and Biggs [29] reported that several floods with water velocities of greater than 30 cm/s tended to affect AFDM and silt content more than they affected Chl-a. The AFDM values observed in our study were lower than those reported by Dodds and Biggs [19], which were 96, 187, 183, and 134 g/m2 for Myriophyllum triphyllum, Glyceria fluitans, Potamogeton crispus, and Elodea canadensis, respectively. Additionally, Arnon et al. [18] found that the average AFDM at 5 cm/s is 1.18 and 1.96 times higher than those for 0.5 cm/s and 0.05 cm/s, respectively (r2 = 0.3, p < 0.05).
Based on our findings, a lower near-bed water velocity (9.4–17.9 cm/s) provided favorable conditions for μmax of AFDM, while Bmax was enhanced for moderate near-bed velocities (17.9–32.8 cm/s). The discrepancy in algal growth performance between our results and those of previous studies might reflect differences in periphytic composition, environmental conditions, and/or stream type.

3.3. Effect of Velocity on the Autotrophic Index

The autotrophic index estimates the autotrophic and heterotrophic nature of periphyton [55]. AI (i.e., AFDM/Chl-a) showed the highest value of 690 at day 1, and dramatically decreased by 86% to 100 at day 2. Subsequently, AI increased slightly over time until day 44, i.e., low water velocity (r = 0.440, p = 0.176), moderate water velocity (r = 0.704, p = 0.016), and high water velocity (r = 0.515, p = 0.105). However, the correlation coefficient between measured data and simulated RSM results was low (r2 = 0.11, p = 0.109).
The behaviors of Chl-a and AFDM were different during the initial period of growth (day 1–day 15). Generally, Chl-a exhibited higher accumulation with increasing growth time in this period (r = 0.965, p = 0.002) than AFDM (r = 0.777, p = 0.069). This trend resulted from the fact that green algae, which are single-celled and light-weight, grew in the initial period, as determined by microscopic observation. Green algae was then gradually covered by Cyanophyceae with filamentous structure, which is similar to the trend reported by Tuji [56]. At the same time, green algae seems to have gradually degraded or died in the middle period of the experiment. As a result, AFDM continued to increase, while Chl-a density was relatively stable in this period (Figure 2), which lead to the slight increase of AI after day 15 towards the end of the experiment.

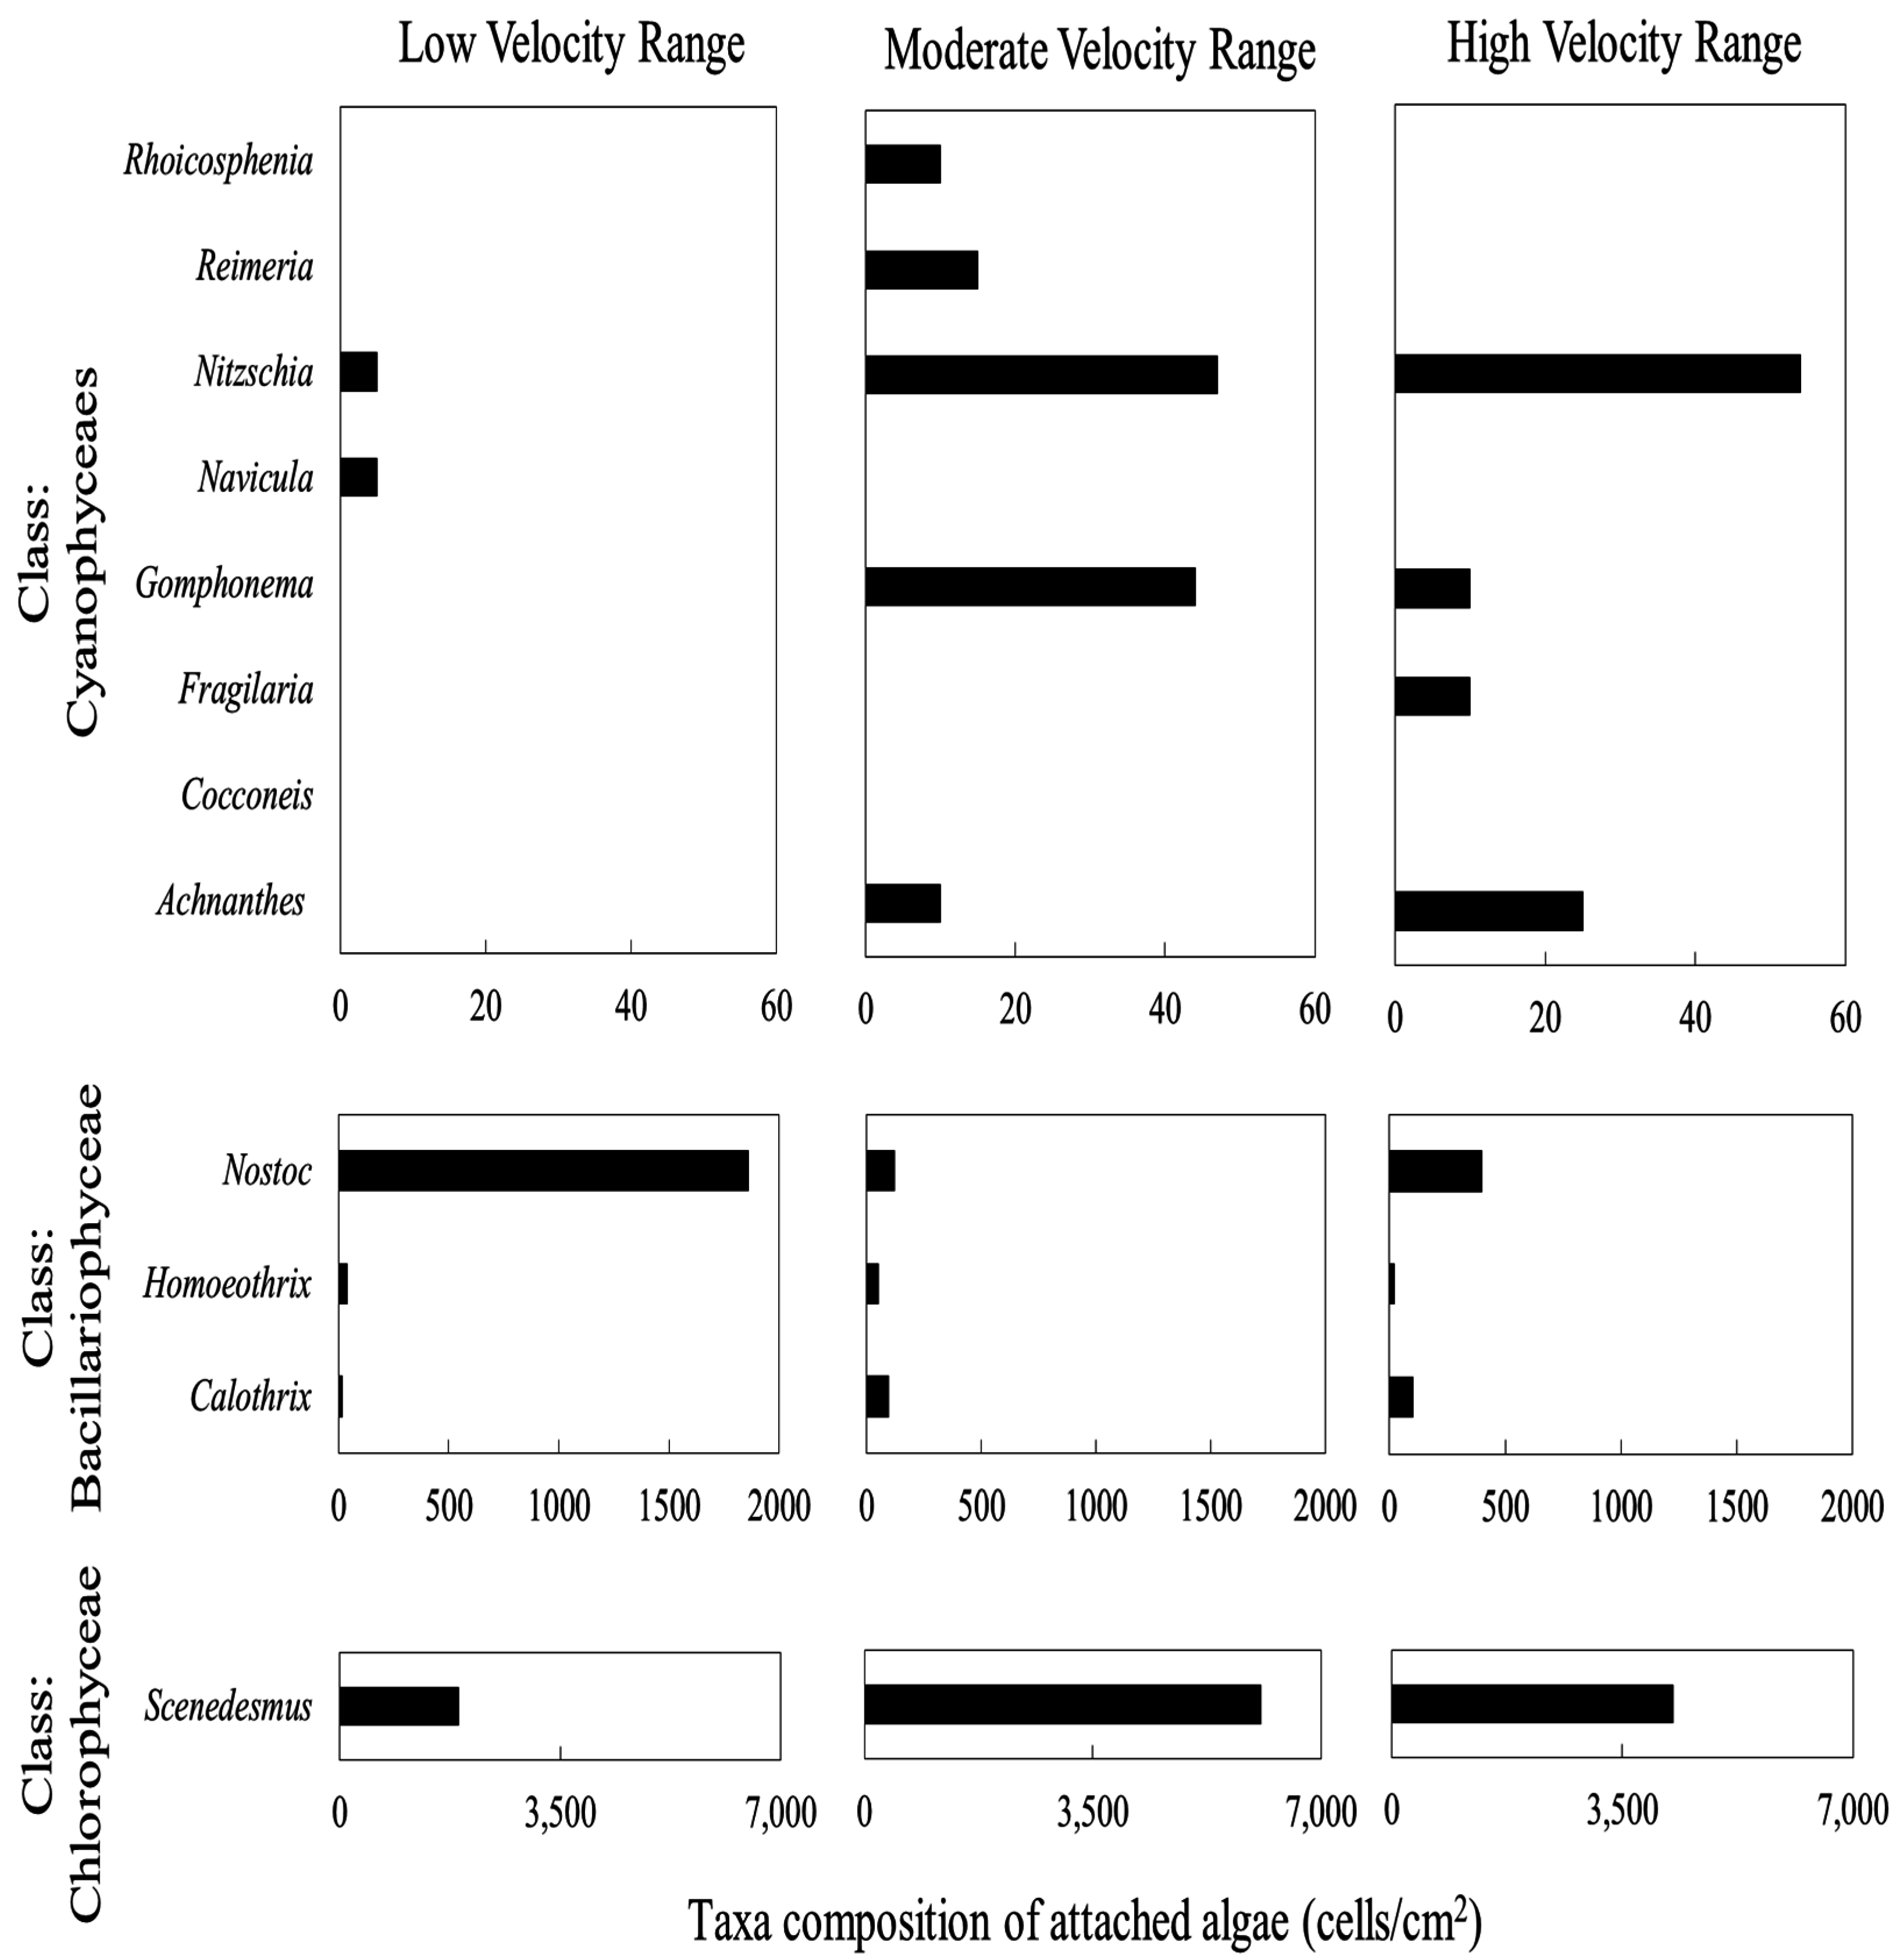
3.4. Periphyton Species Composition

The green algae genus Scenedesmus was dominant in the regions of moderate and high velocities, and Scenedesmus and the cyanobacteria genus Nostoc were dominant in the region of low velocity. Periphyton species at the end of the experimental period for the three regions (low, moderate, and high velocities) were identified (Figure 5). Shannon’s diversity index [44] was highest in the region of low velocity (1.1), and was slightly inversely proportional to biomass (0.76 and 0.48 in the regions of high and moderate velocities, respectively). These indices were within the range of reported values (0.37–3.87) from the Sagami River [38]. Therefore, velocity slightly affected species diversity and composition in this experiment.
The total biomass in the region of moderate near-bed velocity was 6471 cells/cm2, corresponding to 1.7 and 1.3 times higher than the lower and higher velocities, respectively. This result is in agreement with our previous observation that near-bed water velocities of 17.9–32.8 cm/s were optimal for periphyton growth.

4. Conclusions

We studied the effect of near-bed water velocity on the growth characteristics of periphyton using an artificial stream system that can simulate various micro-habitats and RSM as a statistical tool. According to the experimental findings, a moderate near-bed water velocity (17.9–32.8 cm/s) provided favorable conditions for algal growth and the corresponding biomass accumulation. Values of μmax and Bmax from the logistic model further confirmed the experimental data. The total biomass in the region of moderate near-bed velocity was 6471 cells/cm2, equivalent to 1.7 and 1.3 times higher than those at lower and higher velocities, respectively. Additionally, based on an analysis of the taxonomic composition of the attached algae at the end of the experimental period, Scenedesmus was dominant. Further, extensive research work should be developed to study modeling approaches for the evaluation of phytoplankton removal/detachment due to shear stress.

Acknowledgments

This work was supported by JSPS KAKENHI (Grant Number #15K00592, PI: Chihiro Yoshimura and #25241024, PI: Yasuhiro Takemon). We appreciate beneficial comments from Yuichi Iwasaki, post-doctoral fellow at Toyo University.

Author Contributions

All authors were involved in the discussing this study led by Chihiro Yoshimura, Mohamed Ateia drafted and finalized the manuscript. Akira Ikeda did the experimental work. Masafumi Natsuike did the modeling part. Hisako Okada & Masafumi Natsuike identified and quantified the periphyton species. Chihiro Yoshimura & Manabu Fujii revised the manuscript.

Conflicts of Interest

All authors have confirmed and agreed with the contents of the manuscript, and there is no financial interest to report.

References

  1. Weitzel, R.L. Methods and Measurements of Periphyton Communities: A Review; ASTM International: Philadelphia, PA, USA, 1979. [Google Scholar]
  2. Aizaki, M. Growth rates of microorganisms in a periphyton community. Jpn. J. Limnol. 1979, 40, 10–19. (In Japanese) [Google Scholar] [CrossRef]
  3. Lau, Y.; Liu, D. Effect of flow rate on biofilm accumulation in open channels. Water Res. 1993, 27, 355–360. [Google Scholar] [CrossRef]
  4. Fovet, O.; Litrico, X.; Belaud, G. Turbidity management during flushing-flows: A model for open-loop control. Adv. Water Resour. 2012, 39, 7–17. [Google Scholar] [CrossRef]
  5. Labiod, C.; Godillot, R.; Caussade, B. The relationship between stream periphyton dynamics and near-bed turbulence in rough open-channel flow. Ecol. Model. 2007, 209, 78–96. [Google Scholar] [CrossRef]
  6. Feminella, W.; Hawkins, P. Interactions between stream herbivores and periphyton: A quantitative analysis of past experiments. J. N. Am. Benthol. Soc. 1995, 14, 465–509. [Google Scholar] [CrossRef]
  7. Opsahl, W.; Wellnitz, T.; Poff, N. Current velocity and invertebrate grazing regulate stream algae: Results of an in situ electrical exclusion. Hydrobiologia 2003, 499, 135–145. [Google Scholar] [CrossRef]
  8. Hintz, D.; Wellnitz, T. Current velocity influences the facilitation and removal of algae by stream grazers. Aquat. Ecol. 2013, 47, 235–244. [Google Scholar] [CrossRef]
  9. Jakob, C.; Robinson, C.T.; Uehlinger, U. Longitudinal effects of experimental floods on stream benthos downstream from a large dam. Aquat. Sci. 2003, 65, 223–231. [Google Scholar] [CrossRef]
  10. Vonshak, A.; Torzillo, G. 4 environmental stress physiology. In Handbook of Microalgal Culture: Biotechnology and Applied Phycology; John Wiley & Sons: Ames, IA, USA, 2004. [Google Scholar]
  11. Dodds, W.K. Micro-environmental characteristics of filamentous algal communities in flowing freshwaters. Freshw. Biol. 1991, 25, 199–209. [Google Scholar] [CrossRef]
  12. Fuller, R.L.; Dennison, J.; Doyle, S.; Levy, L.; Owen, J.; Shope, E.; Swarr, G.; Vo, L.; Weichert, K.; DiCesare, E. Influence of flood history and hydrology on transport of organic matter in a frequently flooded river. J. Freshw. Ecol. 2014, 29, 37–51. [Google Scholar] [CrossRef]
  13. Uehlinger, U.; Kawecka, B.; Robinson, C. Effects of experimental floods on periphyton and stream metabolism below a high dam in the Swiss Alps (River Spöl). Aquat. Sci. 2003, 65, 199–209. [Google Scholar] [CrossRef]
  14. Gillespie, B.R.; Desmet, S.; Kay, P.; Tillotson, M.R.; Brown, L.E. A critical analysis of regulated river ecosystem responses to managed environmental flows from reservoirs. Freshw. Biol. 2015, 60, 410–425. [Google Scholar] [CrossRef]
  15. Franchi, E.; Carosi, A.; Ghetti, L.; Giannetto, D.; Pedicillo, G.; Pompei, L.; Lorenzoni, M. Changes in the fish community of the upper tiber river after construction of a hydro-dam. J. Limnol. 2014, 73, 203–210. [Google Scholar] [CrossRef]
  16. Graba, M.; Kettab, A.; Sauvage, S.; Sanchez-Pérez, J.M. On modeling chronic detachment of periphyton in artificial rough, open channel flow. Desalin. Water Treat. 2012, 41, 79–87. [Google Scholar] [CrossRef] [Green Version]
  17. Godillot, R.; Caussade, B.; Ameziane, T.; Capblancq, J. Interplay between turbulence and periphyton in rough open-channel flow. J. Hydraul. Res. 2001, 39, 227–239. [Google Scholar] [CrossRef]
  18. Arnon, S.; Packman, A.I.; Peterson, C.G.; Gray, K.A. Effects of overlying velocity on periphyton structure and denitrification. J. Geophys. Res. Biogeosci. 2007, 112, 1–10. [Google Scholar] [CrossRef]
  19. Dodds, W.K.; Biggs, B.J. Water velocity attenuation by stream periphyton and macrophytes in relation to growth form and architecture. J. N. Am. Benthol. Soc. 2002, 21, 2–15. [Google Scholar] [CrossRef]
  20. Mebane, C.A.; Simon, N.S.; Maret, T.R. Linking nutrient enrichment and streamflow to macrophytes in agricultural streams. Hydrobiologia 2014, 722, 143–158. [Google Scholar] [CrossRef]
  21. Biggs, B.J.; Hickey, C.W. Periphyton responses to a hydraulic gradient in a regulated river in New Zealand. Freshw. Biol. 1994, 32, 49–59. [Google Scholar] [CrossRef]
  22. Nikora, V.; Goring, D.; Biggs, B. On stream periphyton-turbulence interactions. N. Z. J. Mar. Freshw. Res. 1997, 31, 435–448. [Google Scholar] [CrossRef]
  23. Nikora, V.; Goring, D.; Biggs, B. A simple model of stream periphyton-flow interactions. Oikos 1998, 607–611. [Google Scholar] [CrossRef]
  24. Moulin, F.Y.; Peltier, Y.; Bercovitz, Y.; Eiff, O.; Beer, A.; Pen, C.; Boulêtreau, S.; Garabétian, F.; Sellali, M.; Sànchez-Pérez, J. Experimental study of the interaction between a turbulent flow and a river biofilm growing on macrorugosities. Freshw. Biol. 2008, 36, 249–263. [Google Scholar]
  25. Zhang, H.; Chen, R.; Li, F.; Chen, L. Effect of flow rate on environmental variables and phytoplankton dynamics: Results from field enclosures. Chin. J. Oceanol. Limnol. 2015, 33, 430–438. [Google Scholar] [CrossRef]
  26. McIntire, C.D. Some effects of current velocity on periphyton communities in laboratory streams. Hydrobiologia 1966, 27, 559–570. [Google Scholar] [CrossRef]
  27. Ahn, C.H.; Song, H.M.; Lee, S.; Oh, J.H.; Ahn, H.; Park, J.-R.; Lee, J.M.; Joo, J.C. Effects of water velocity and specific surface area on filamentous periphyton biomass in an artificial stream mesocosm. Water 2013, 5, 1723–1740. [Google Scholar] [CrossRef]
  28. Poff, N.L.; Voelz, N.J.; Ward, J.; Lee, R. Algal colonization under four experimentally-controlled current regimes in high mountain stream. J. N. Am. Benthol. Soc. 1990, 303–318. [Google Scholar] [CrossRef]
  29. Jowett, I.G.; Biggs, B.J. Flood and velocity effects on periphyton and silt accumulation in two New Zealand rivers. N. Z. J. Mar. Freshw. Res. 1997, 31, 287–300. [Google Scholar] [CrossRef]
  30. Filstrup, C.T.; Wagner, T.; Soranno, P.A.; Stanley, E.H.; Stow, C.A.; Webster, K.E.; Downing, J.A. Regional variability among nonlinear chlorophyll–phosphorus relationships in lakes. Limnol. Oceanogr. 2014, 59, 1691–1703. [Google Scholar] [CrossRef]
  31. Uehlinger, U.; Bührer, H.; Reichert, P. Periphyton dynamics in a floodprone prealpine river: Evaluation of significant processes by modelling. Freshw. Biol. 1996, 36, 249–263. [Google Scholar] [CrossRef]
  32. Karemore, A.; Pal, R.; Sen, R. Strategic enhancement of algal biomass and lipid in chlorococcum infusionum as bioenergy feedstock. Algal Res. 2013, 2, 113–121. [Google Scholar] [CrossRef]
  33. Pan, C.; Fan, Y.; Xing, Y.; Hou, H.; Zhang, M. Statistical optimization of process parameters on biohydrogen production from glucose by Clostridium sp. Fanp2. Bioresour. Technol. 2008, 99, 3146–3154. [Google Scholar] [CrossRef] [PubMed]
  34. Reddy, L.; Wee, Y.-J.; Yun, J.-S.; Ryu, H.-W. Optimization of alkaline protease production by batch culture of bacillus sp. Rky3 through plackett–burman and response surface methodological approaches. Bioresour. Technol. 2008, 99, 2242–2249. [Google Scholar] [CrossRef] [PubMed]
  35. Şahan, T.; Ceylan, H.; Şahiner, N.; Aktaş, N. Optimization of removal conditions of copper ions from aqueous solutions by trametes versicolor. Bioresour. Technol. 2010, 101, 4520–4526. [Google Scholar] [CrossRef] [PubMed]
  36. Zhang, C.; Zhang, Y.; Zhuang, B.; Zhou, X. Strategic enhancement of algal biomass, nutrient uptake and lipid through statistical optimization of nutrient supplementation in coupling scenedesmus obliquus-like microalgae cultivation and municipal wastewater treatment. Bioresour. Technol. 2014, 171, 71–79. [Google Scholar] [CrossRef] [PubMed]
  37. Wani, T.A.; Ahmad, A.; Zargar, S.; Khalil, N.Y.; Darwish, I.A. Use of response surface methodology for development of new microwell-based spectrophotometric method for determination of atrovastatin calcium in tablets. Chem. Cent. J. 2012, 6, 134. [Google Scholar] [CrossRef] [PubMed]
  38. Kobayashi, S. The Effect of Exfoliated Periphyton on Pollution of River Water. Jpn. J. Water Pollut. Res. 1982, 5, 6. [Google Scholar] [CrossRef]
  39. Akamatsu, Y.; Ikeda, S.; Kanai, S.; Osawa, S.; Osawa, K. Phytoremediation of endocrine disrupting chemicals in urban river water. Doboku Gakkai Ronbunshuu G/JSCE J. Environ. Syst. Eng. 2010, 66, 201–210. [Google Scholar] [CrossRef]
  40. Holm-Hansen, O.; Lorenzen, C.J.; Holmes, R.W.; Strickland, J.D. Fluorometric determination of chlorophyll. J. Du Cons. 1965, 30, 3–15. [Google Scholar] [CrossRef]
  41. Apha, A. Standard Methods for The Examination of Water and Wastewater; American Public Health Association/American Water Works Association/Water Environment Federation: Washington, WA, USA, 1995. [Google Scholar]
  42. Akiyama, M.; Ioriya, T.; Imahori, K.; Kasaki, H.; Kumamoto, S.; Kobayashi, H.; Takahashi, E.; Tsumura, K.; Hirano, M.; Hirose, H. Illustrations of the Japanese Fresh-Water Algae; Uchidarokakuho Publishing Company, Limited: Tokyo, Japan, 1977. [Google Scholar]
  43. Watanabe, T.; Ohtsuka, T.; Tuji, A.; Houki, A. Picture Book and Ecology of the Freshwater Diatoms; Uchida-Rokakuho: Tokyo, Japan, 2005. [Google Scholar]
  44. Shannon, C.E. A mathematical theory of communication. ACM SIGMOBILE Mob. Comput. Commun. Rev. 2001, 5, 3–55. [Google Scholar] [CrossRef]
  45. Simkins, S.; Alexander, M. Models for mineralization kinetics with the variables of substrate concentration and population density. Appl. Environ. Microbiol. 1984, 47, 1299–1306. [Google Scholar] [PubMed]
  46. Flinders, C.A.; Hart, D.D. Effects of pulsed flows on nuisance periphyton growths in rivers: A mesocosm study. River Res. Appl. 2009, 25, 1320–1330. [Google Scholar] [CrossRef]
  47. Biggs, B.; Kilroy, C.; Mulcock, C.; Scarsbrook, M. New Zealand stream monitoring and assessment kit. Stream Monit. Man. Version 1998, 1, 50–150. [Google Scholar]
  48. Horner, R.R.; Welch, E.B.; Seeley, M.R.; Jacoby, J.M. Responses of periphyton to changes in current velocity, suspended sediment and phosphorus concentration. Freshw. Biol. 1990, 24, 215–232. [Google Scholar] [CrossRef]
  49. Majdi, N.; Traunspurger, W.; Boyer, S.; Mialet, B.; Tackx, M.; Fernandez, R.; Gehner, S.; Ten-Hage, L.; Buffan-Dubau, E. Response of biofilm-dwelling nematodes to habitat changes in the garonne river, France: Influence of hydrodynamics and microalgal availability. Hydrobiologia 2011, 673, 229–244. [Google Scholar] [CrossRef] [Green Version]
  50. Bothwell, M.L. Phosphorus-limited growth dynamics of lotic periphytic diatom communities: Areal biomass and cellular growth rate responses. Can. J. Fish. Aquat. Sci. 1989, 46, 1293–1301. [Google Scholar] [CrossRef]
  51. Luce, J.J.; Cattaneo, A.; Lapointe, M.F. Spatial patterns in periphyton biomass after low-magnitude flow spates: Geomorphic factors affecting patchiness across gravel-cobble riffles. J. N. Am. Benthol. Soc. 2010, 29, 614–626. [Google Scholar] [CrossRef]
  52. Hondzo, M.; Wang, H. Effects of turbulence on growth and metabolism of periphyton in a laboratory flume. Water Resour. Res. 2002, 38, 13-1–13-9. [Google Scholar] [CrossRef]
  53. Tonkin, J.D.; Death, R.G.; Barquín, J. Periphyton control on stream invertebrate diversity: Is periphyton architecture more important than biomass? Mar. Freshw. Res. 2014, 65, 818–829. [Google Scholar] [CrossRef]
  54. Juneja, A.; Ceballos, R.M.; Murthy, G.S. Effects of environmental factors and nutrient availability on the biochemical composition of algae for biofuels production: A review. Energies 2013, 6, 4607–4638. [Google Scholar] [CrossRef]
  55. Weber, I.; McFarland, H. Periphyton biomass-chlorophyll ratio as an index of water quality. In Proceedings of the 17th Meeting of Midwest Benthological Society, Gilbertsville, KY, USA, 9–11 April 1969.
  56. Tuji, A. Observation of developmental processes in loosely attached diatom (Bacillariophyceae) communities. Phycol. Res. 2000, 48, 75–84. [Google Scholar] [CrossRef]
Figure 1. Distribution of near-bed water velocity in the artificial streams, where G1–G7 are the velocity ranges in our study (indicated in grayscale) and the numbers in each square is the measured water velocity using a propeller meter (water in the aquarium flowed counter-clockwise). Each aquarium contained about 40 L of water (outer dimensions 900 × 450 × 360 mm3, inner dimensions 400 × 180 × 280 mm3, W × D × H). Each tile was 45 × 45 × 9 mm3. Seed stones were natural cobbles collected from the Sagami River to inoculate the tiles with periphyton.
Water 08 00461 g001
Figure 2. Correlation between independent variables (incubation time and water velocity) and Chl-a using response surface methodology (i.e., Equation (6)) (solid dots represent experimental conditions).
Water 08 00461 g002
Figure 3. Effect of water velocity on (A) μmax and (B) Bmax of Chl-a. Vertical bars represent standard deviation of three replicate determinations.
Water 08 00461 g003
Figure 4. Effect of water velocity on (A) μmax and (B) Bmax of AFDM. Vertical bars represent standard deviation of replicate determinations.
Water 08 00461 g004
Figure 5. Effect of water velocity on community structure. Taxa composition of attached algae (cells/cm2).
Water 08 00461 g005

