
Cross-Correlation among Seismic Events, Rainfalls, and Carbon Dioxide Anomalies in Spring Water: Insights from Geochemical Monitoring in Northern Tuscany, Italy

Abstract
:1. Introduction
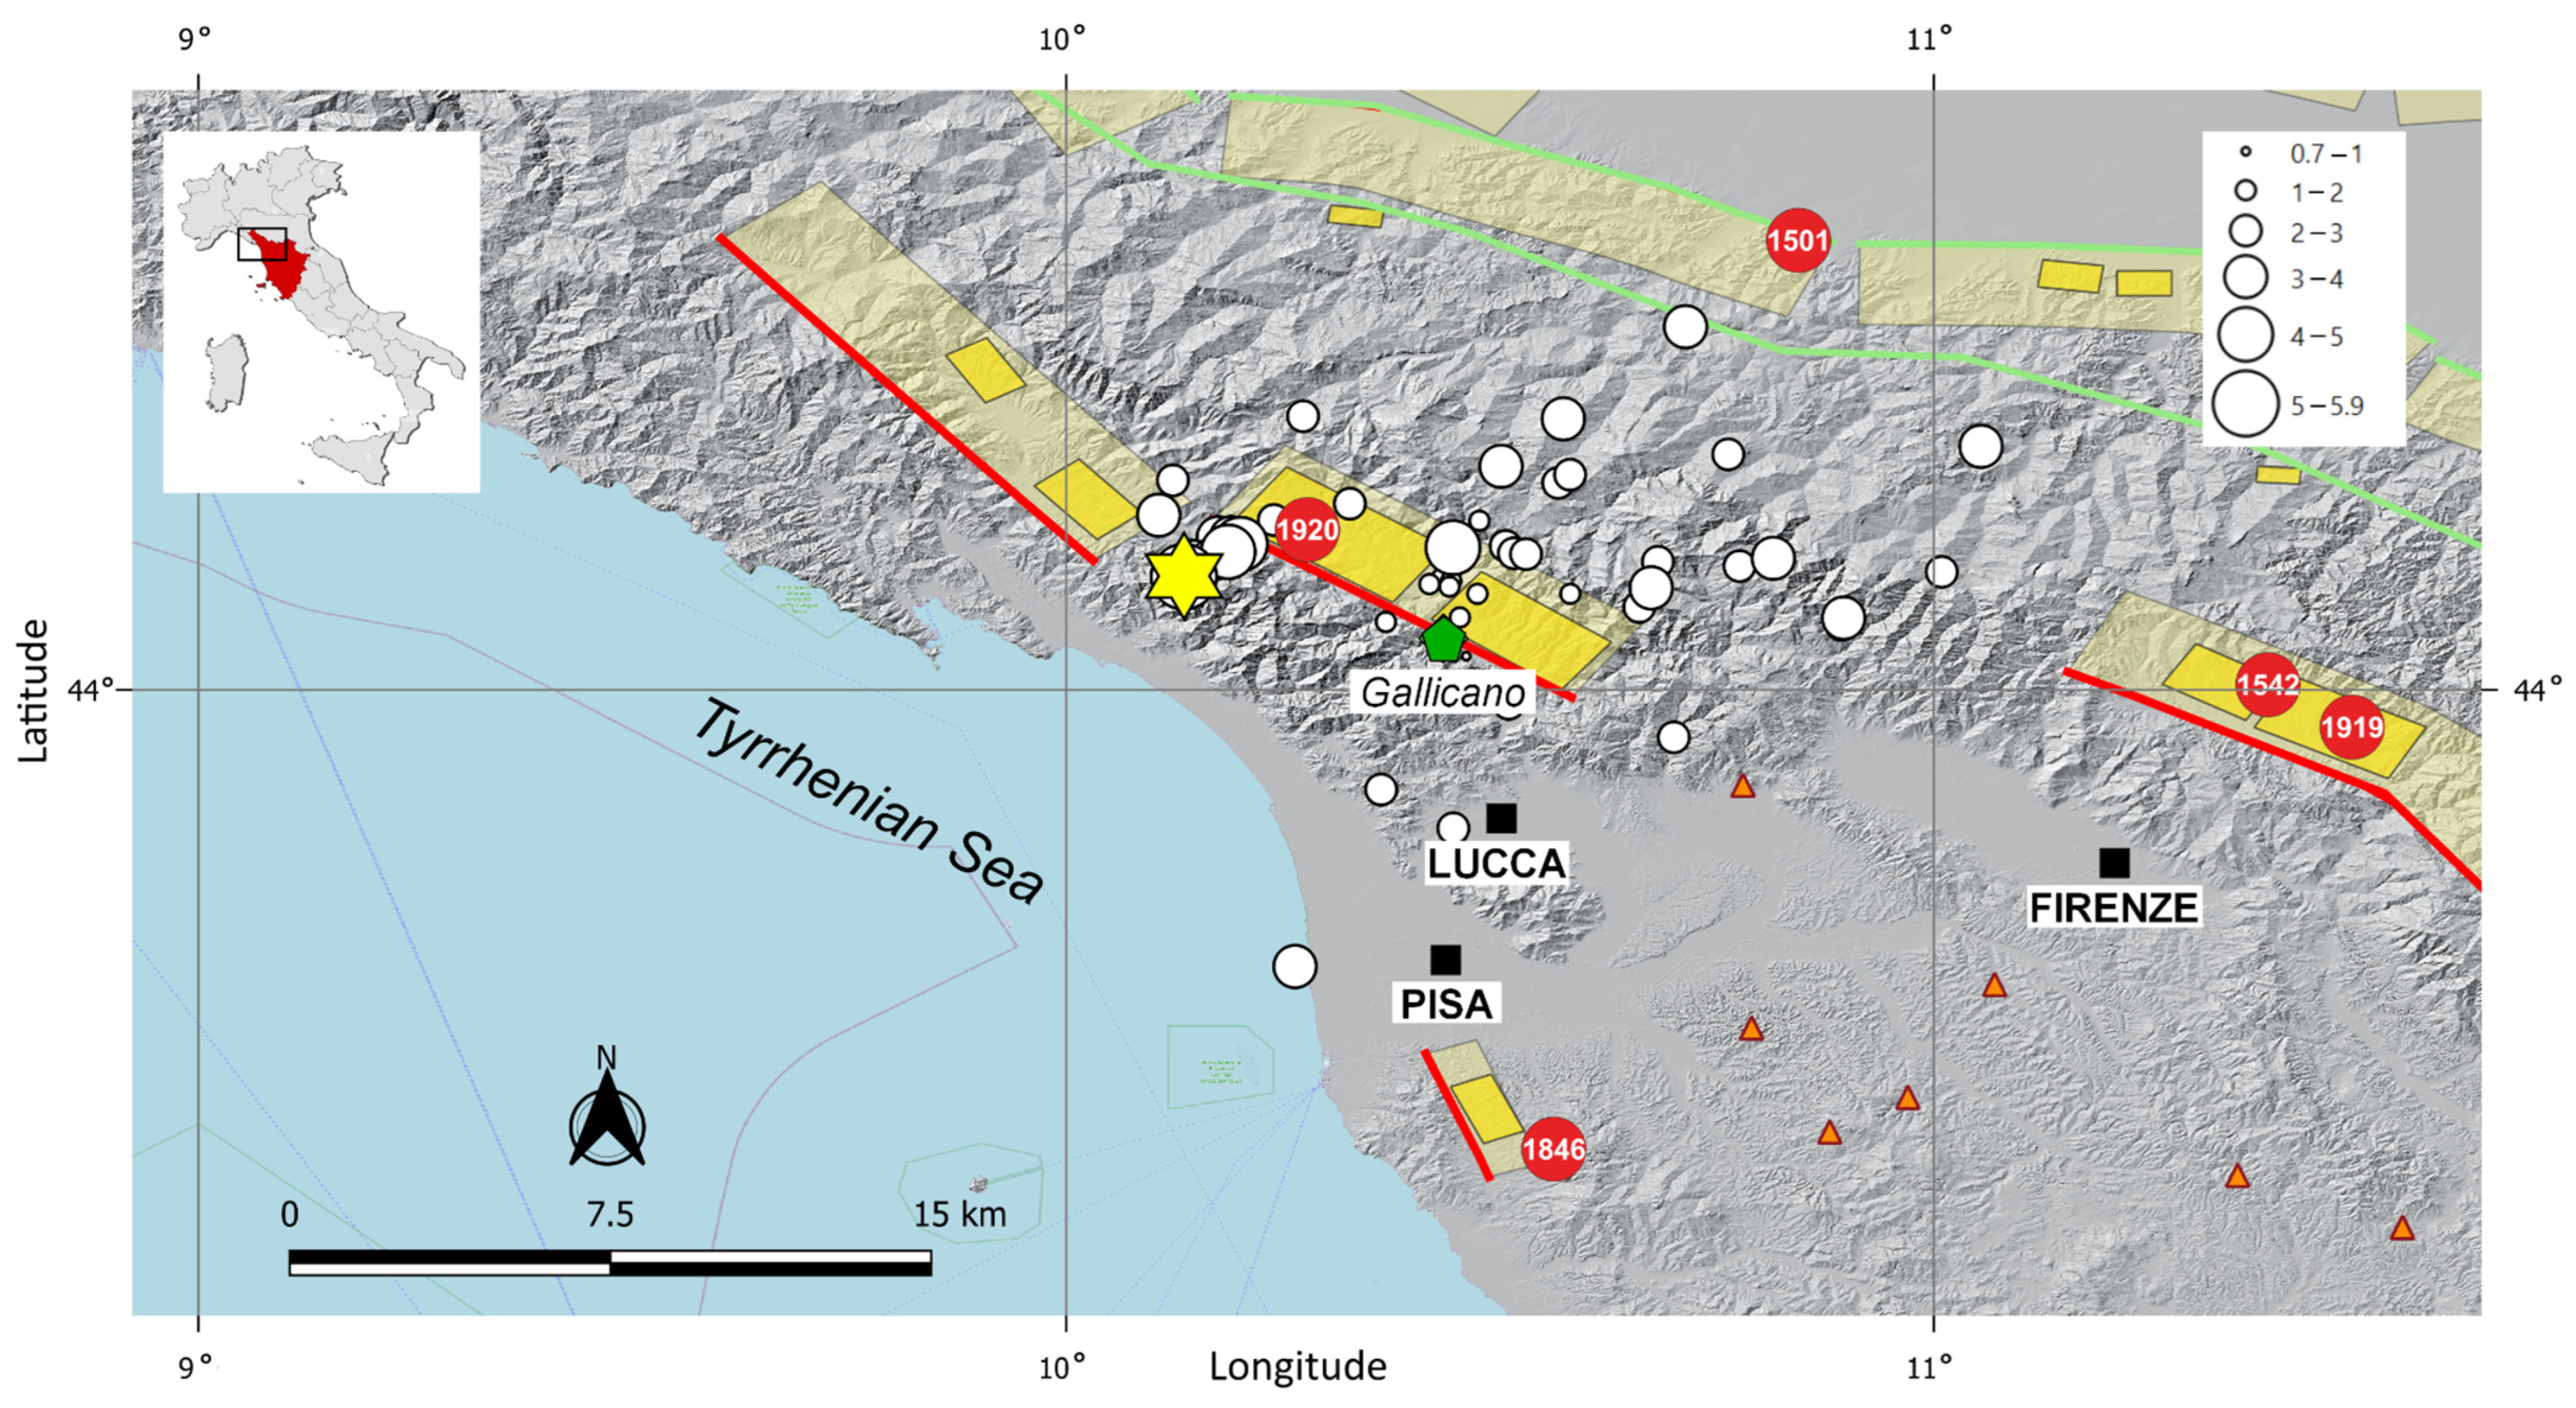
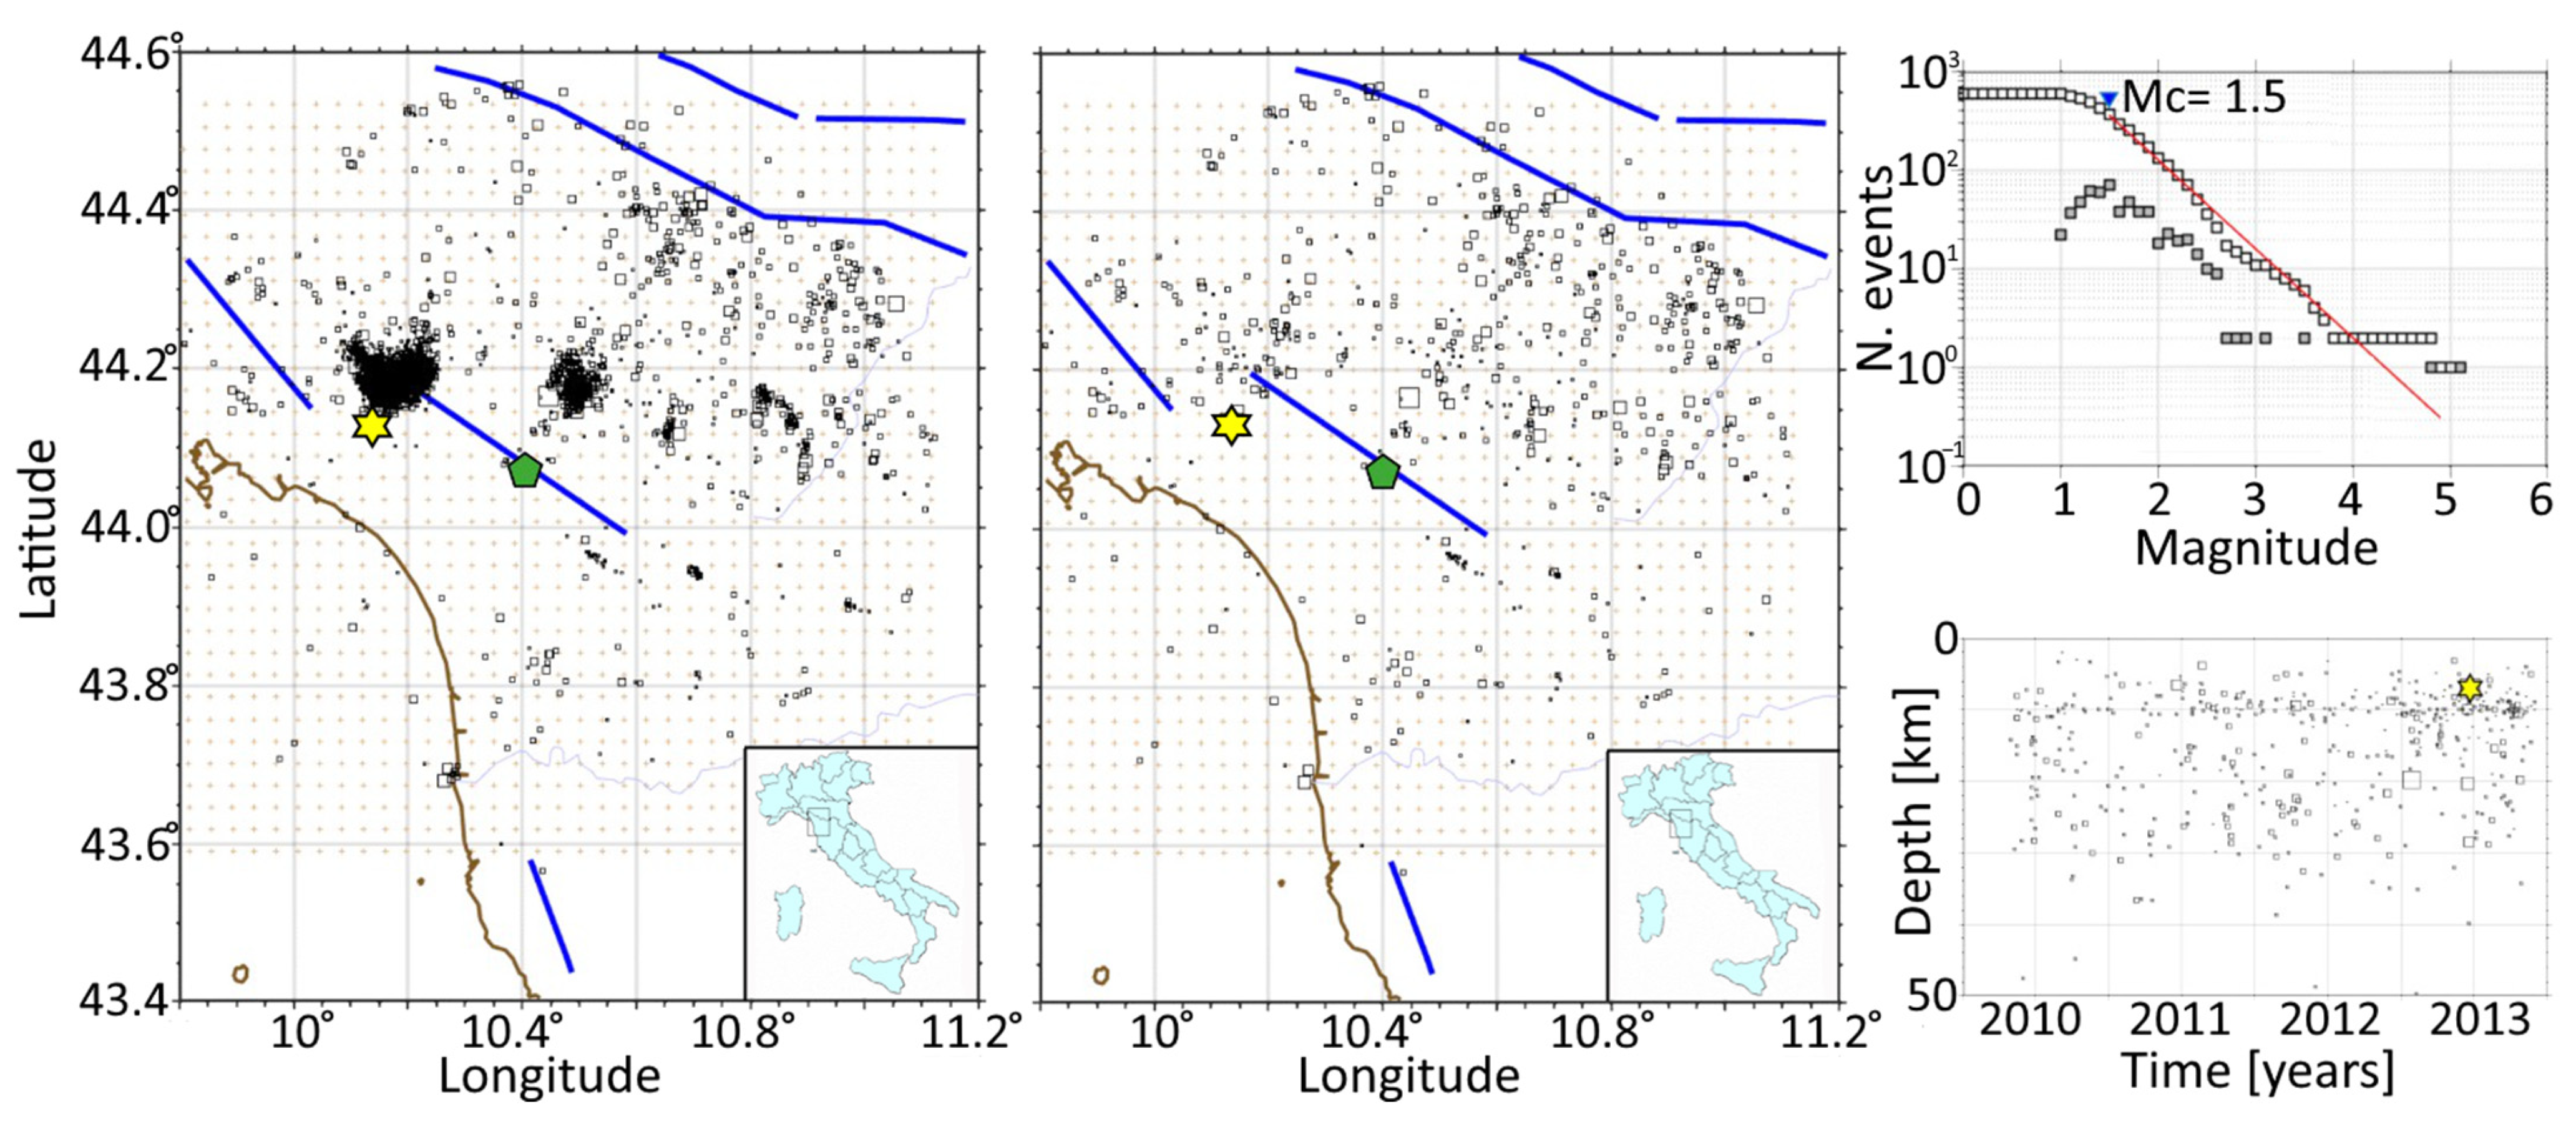
2. Seismicity
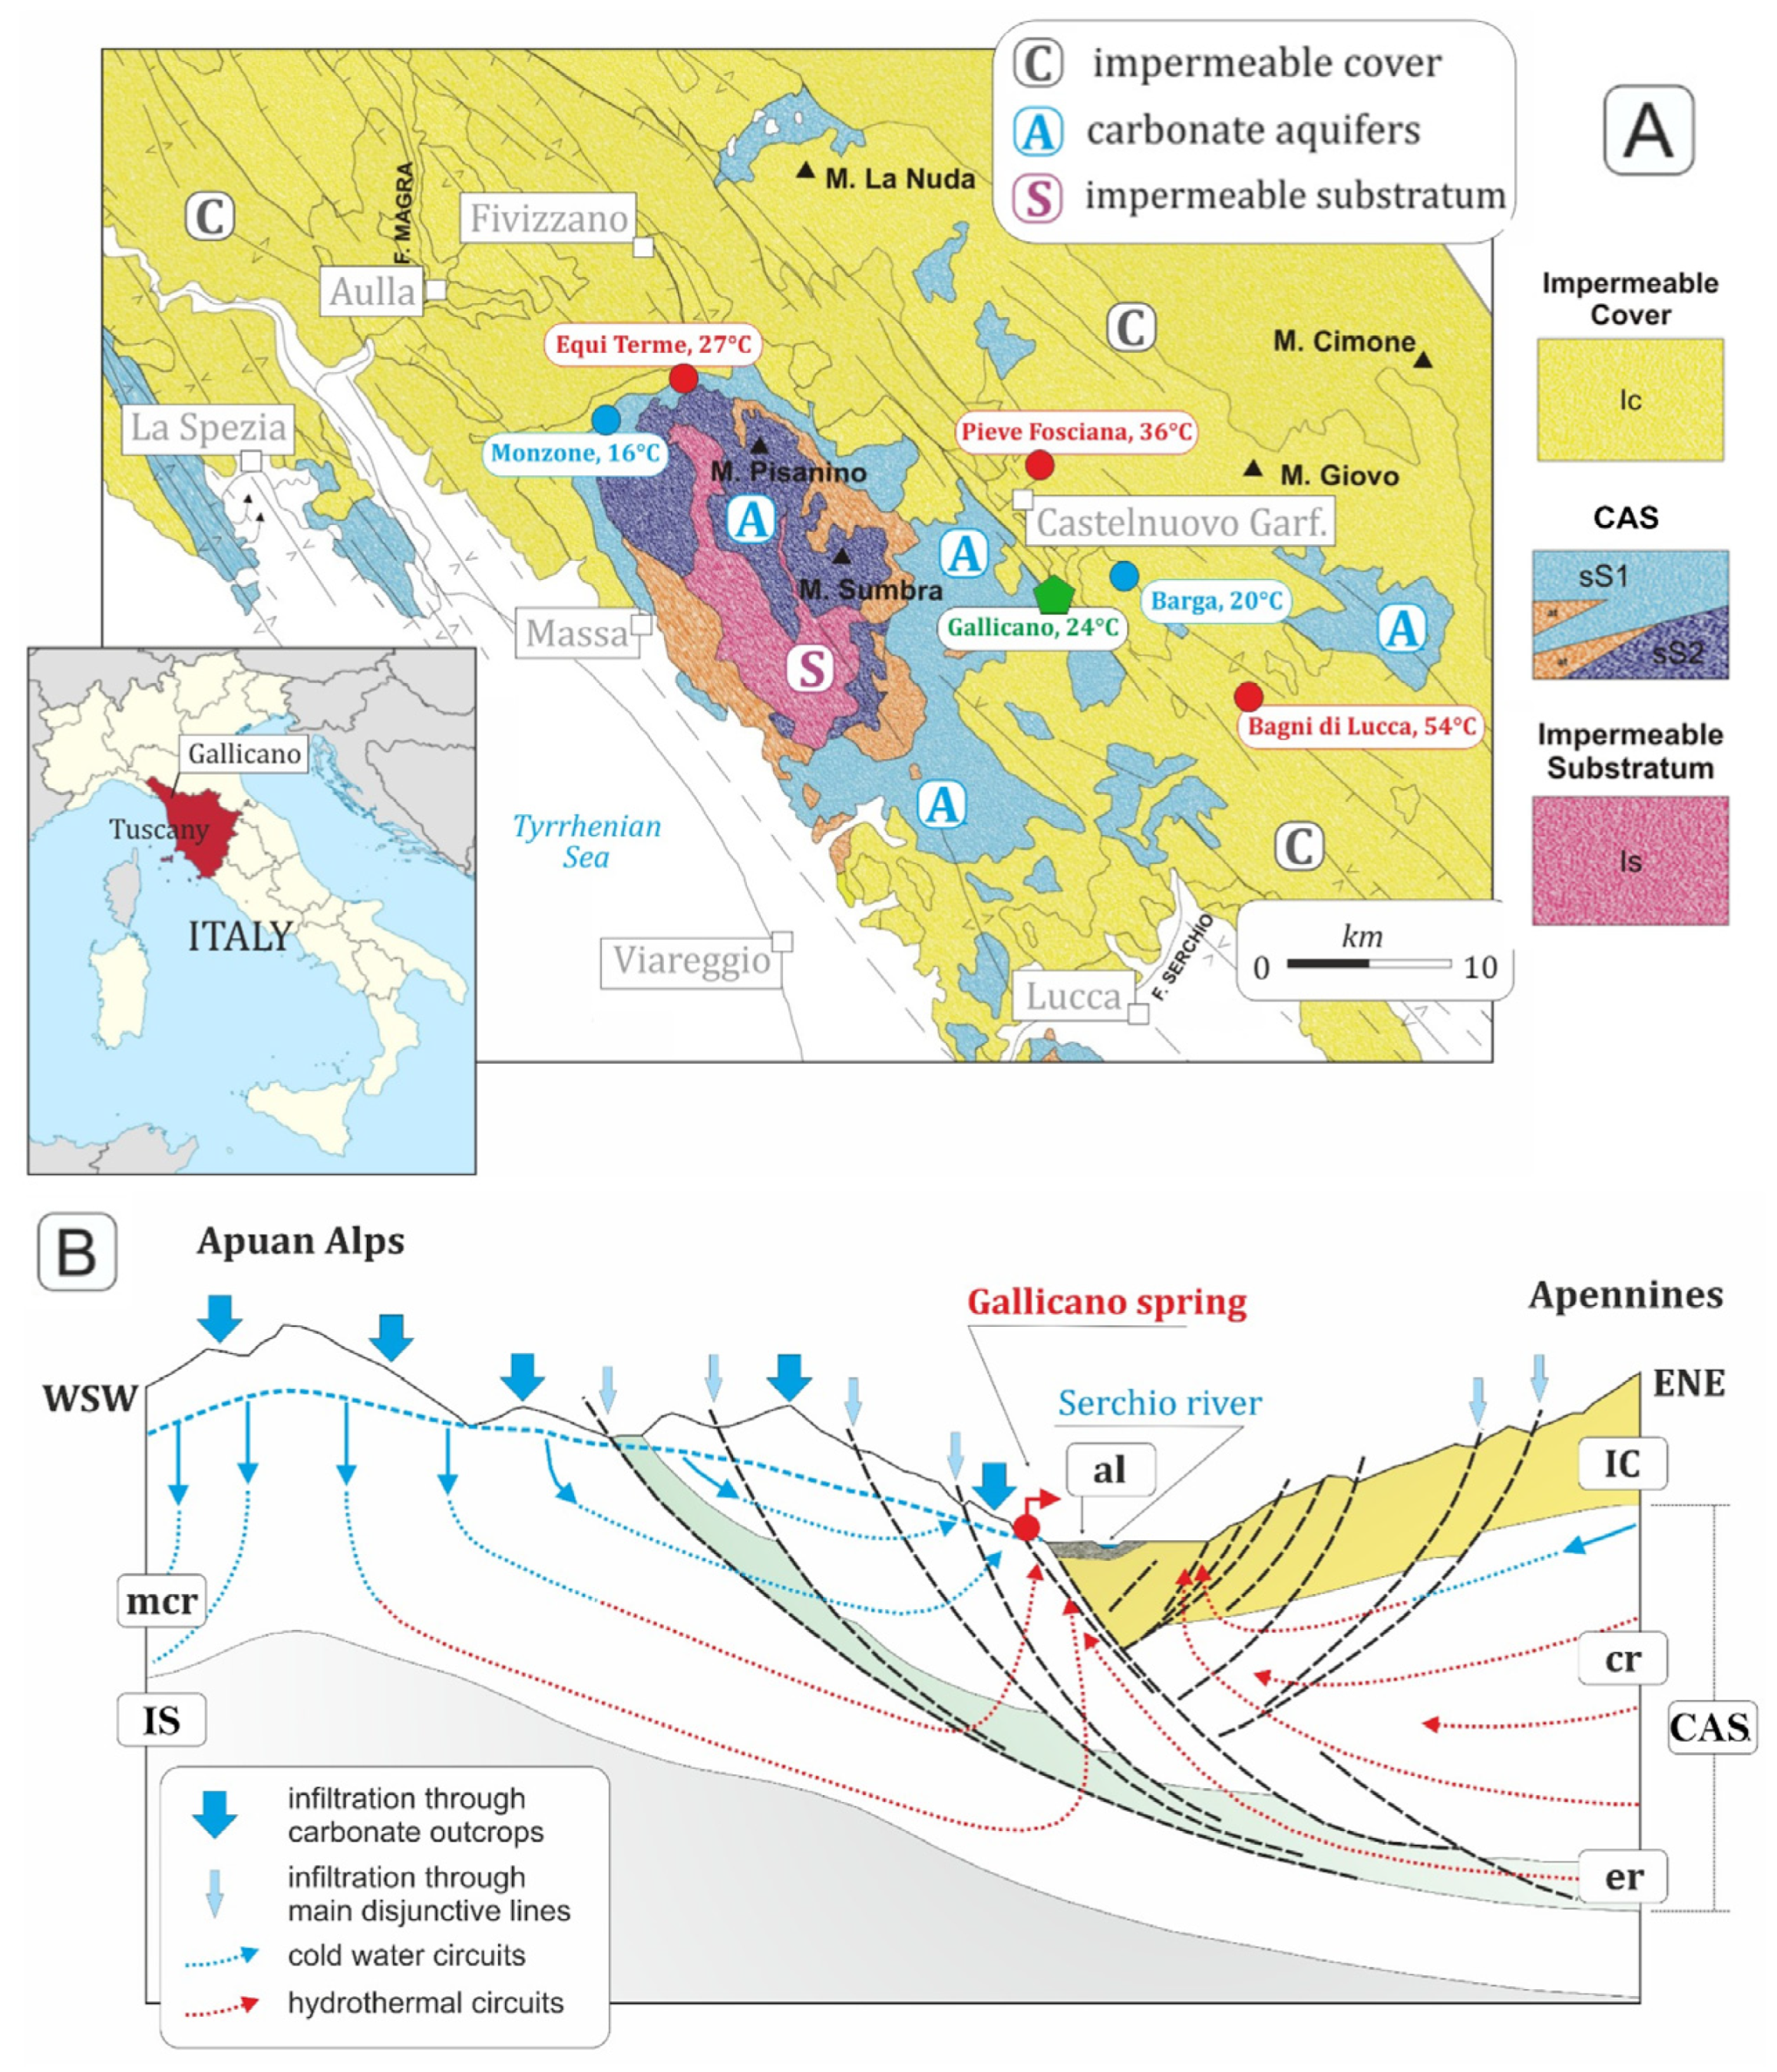
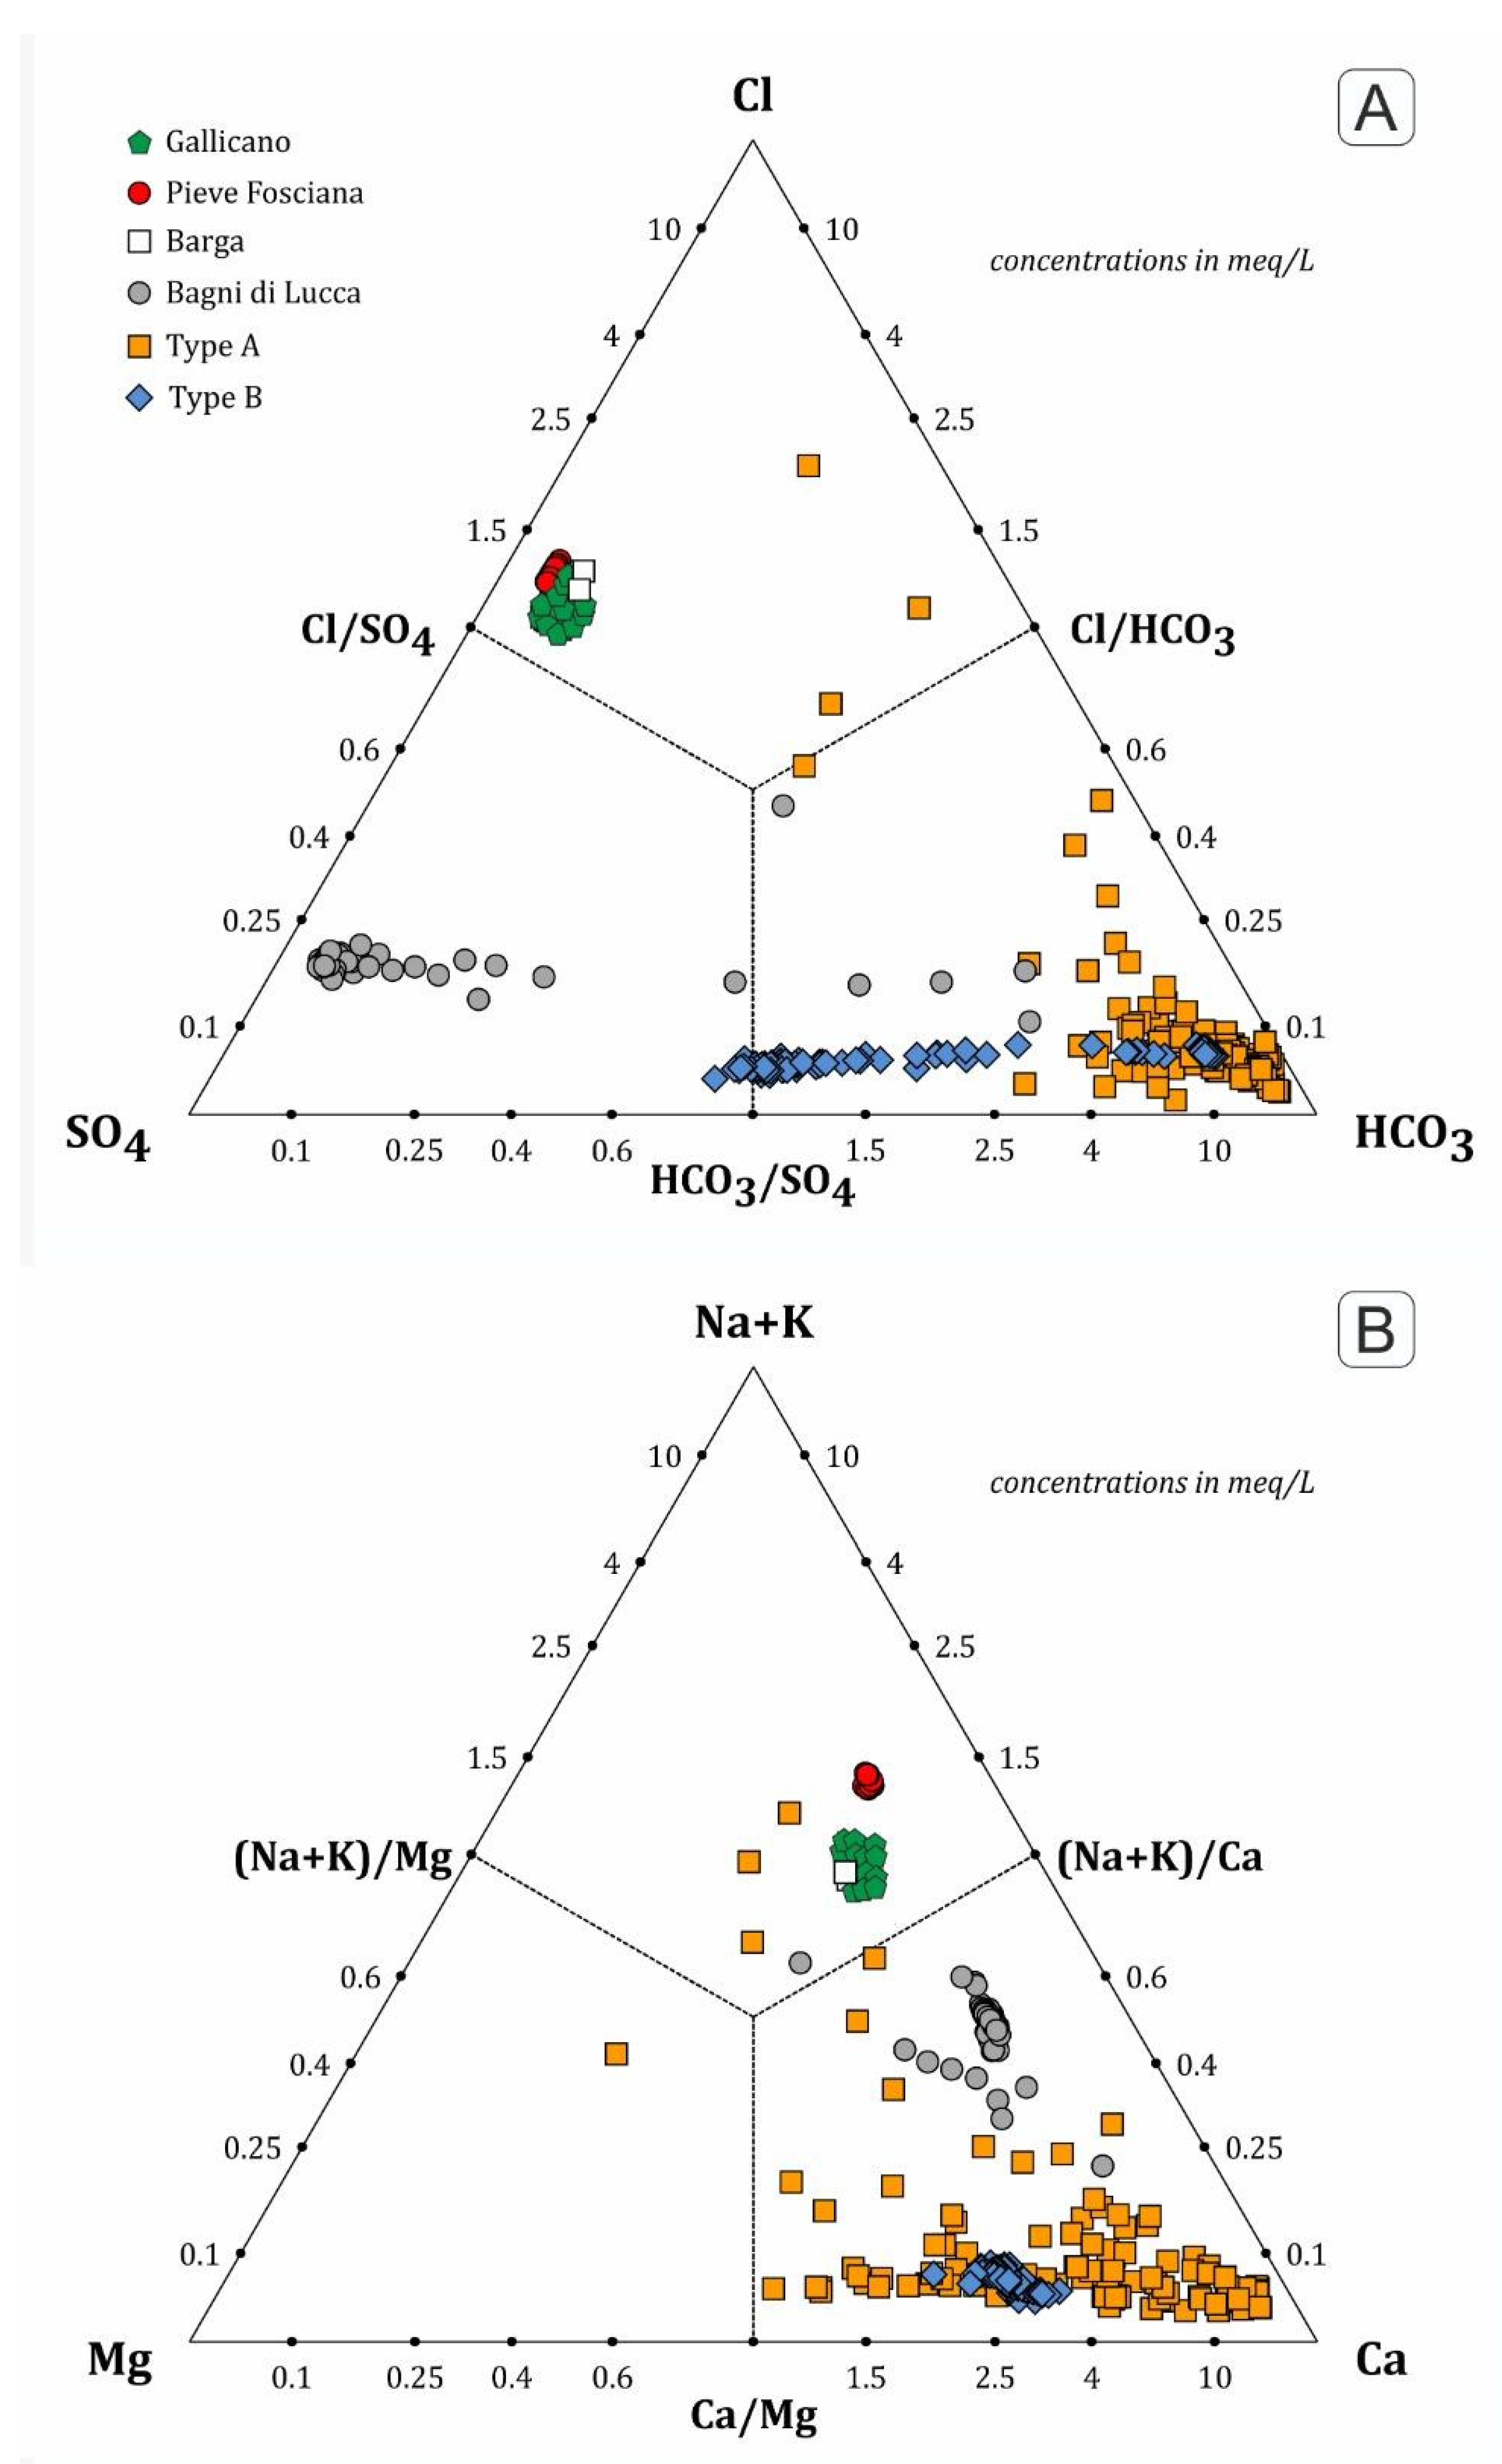
3. Hydrogeological and Hydrogeochemical Setting
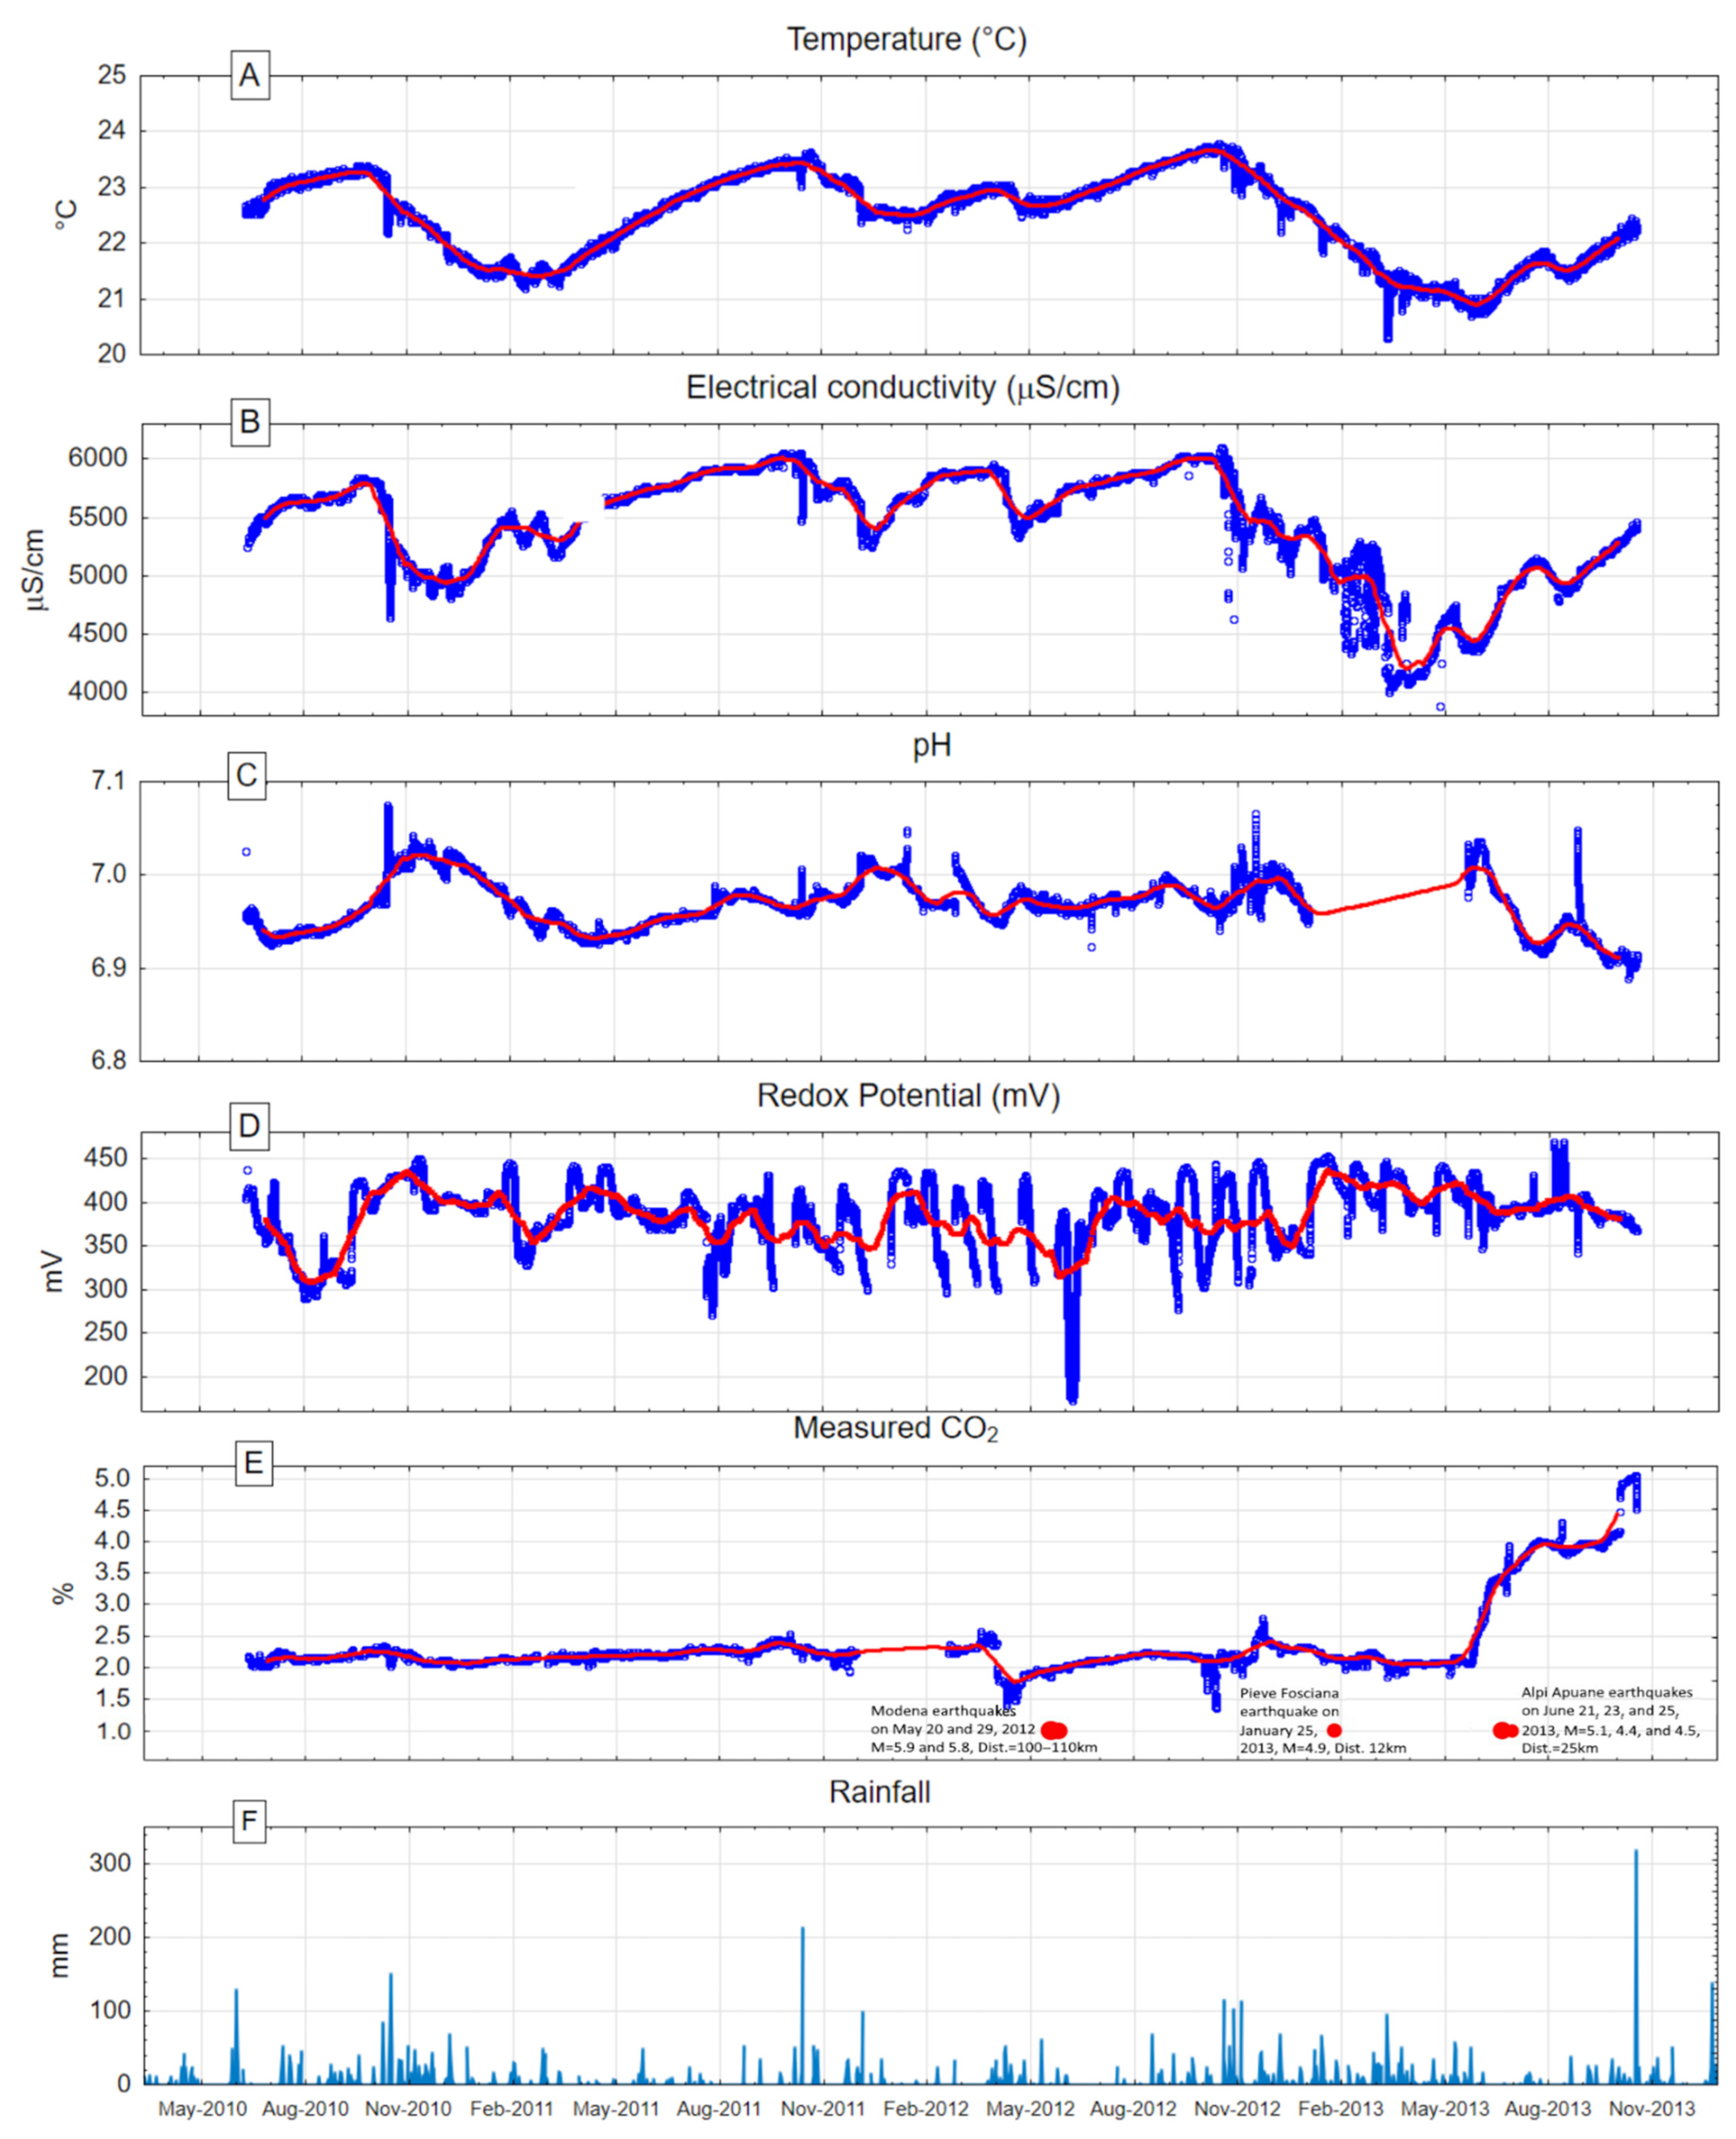
Continuous Geochemical Monitoring during the 2010–2013 Period
4. Statistical Methods
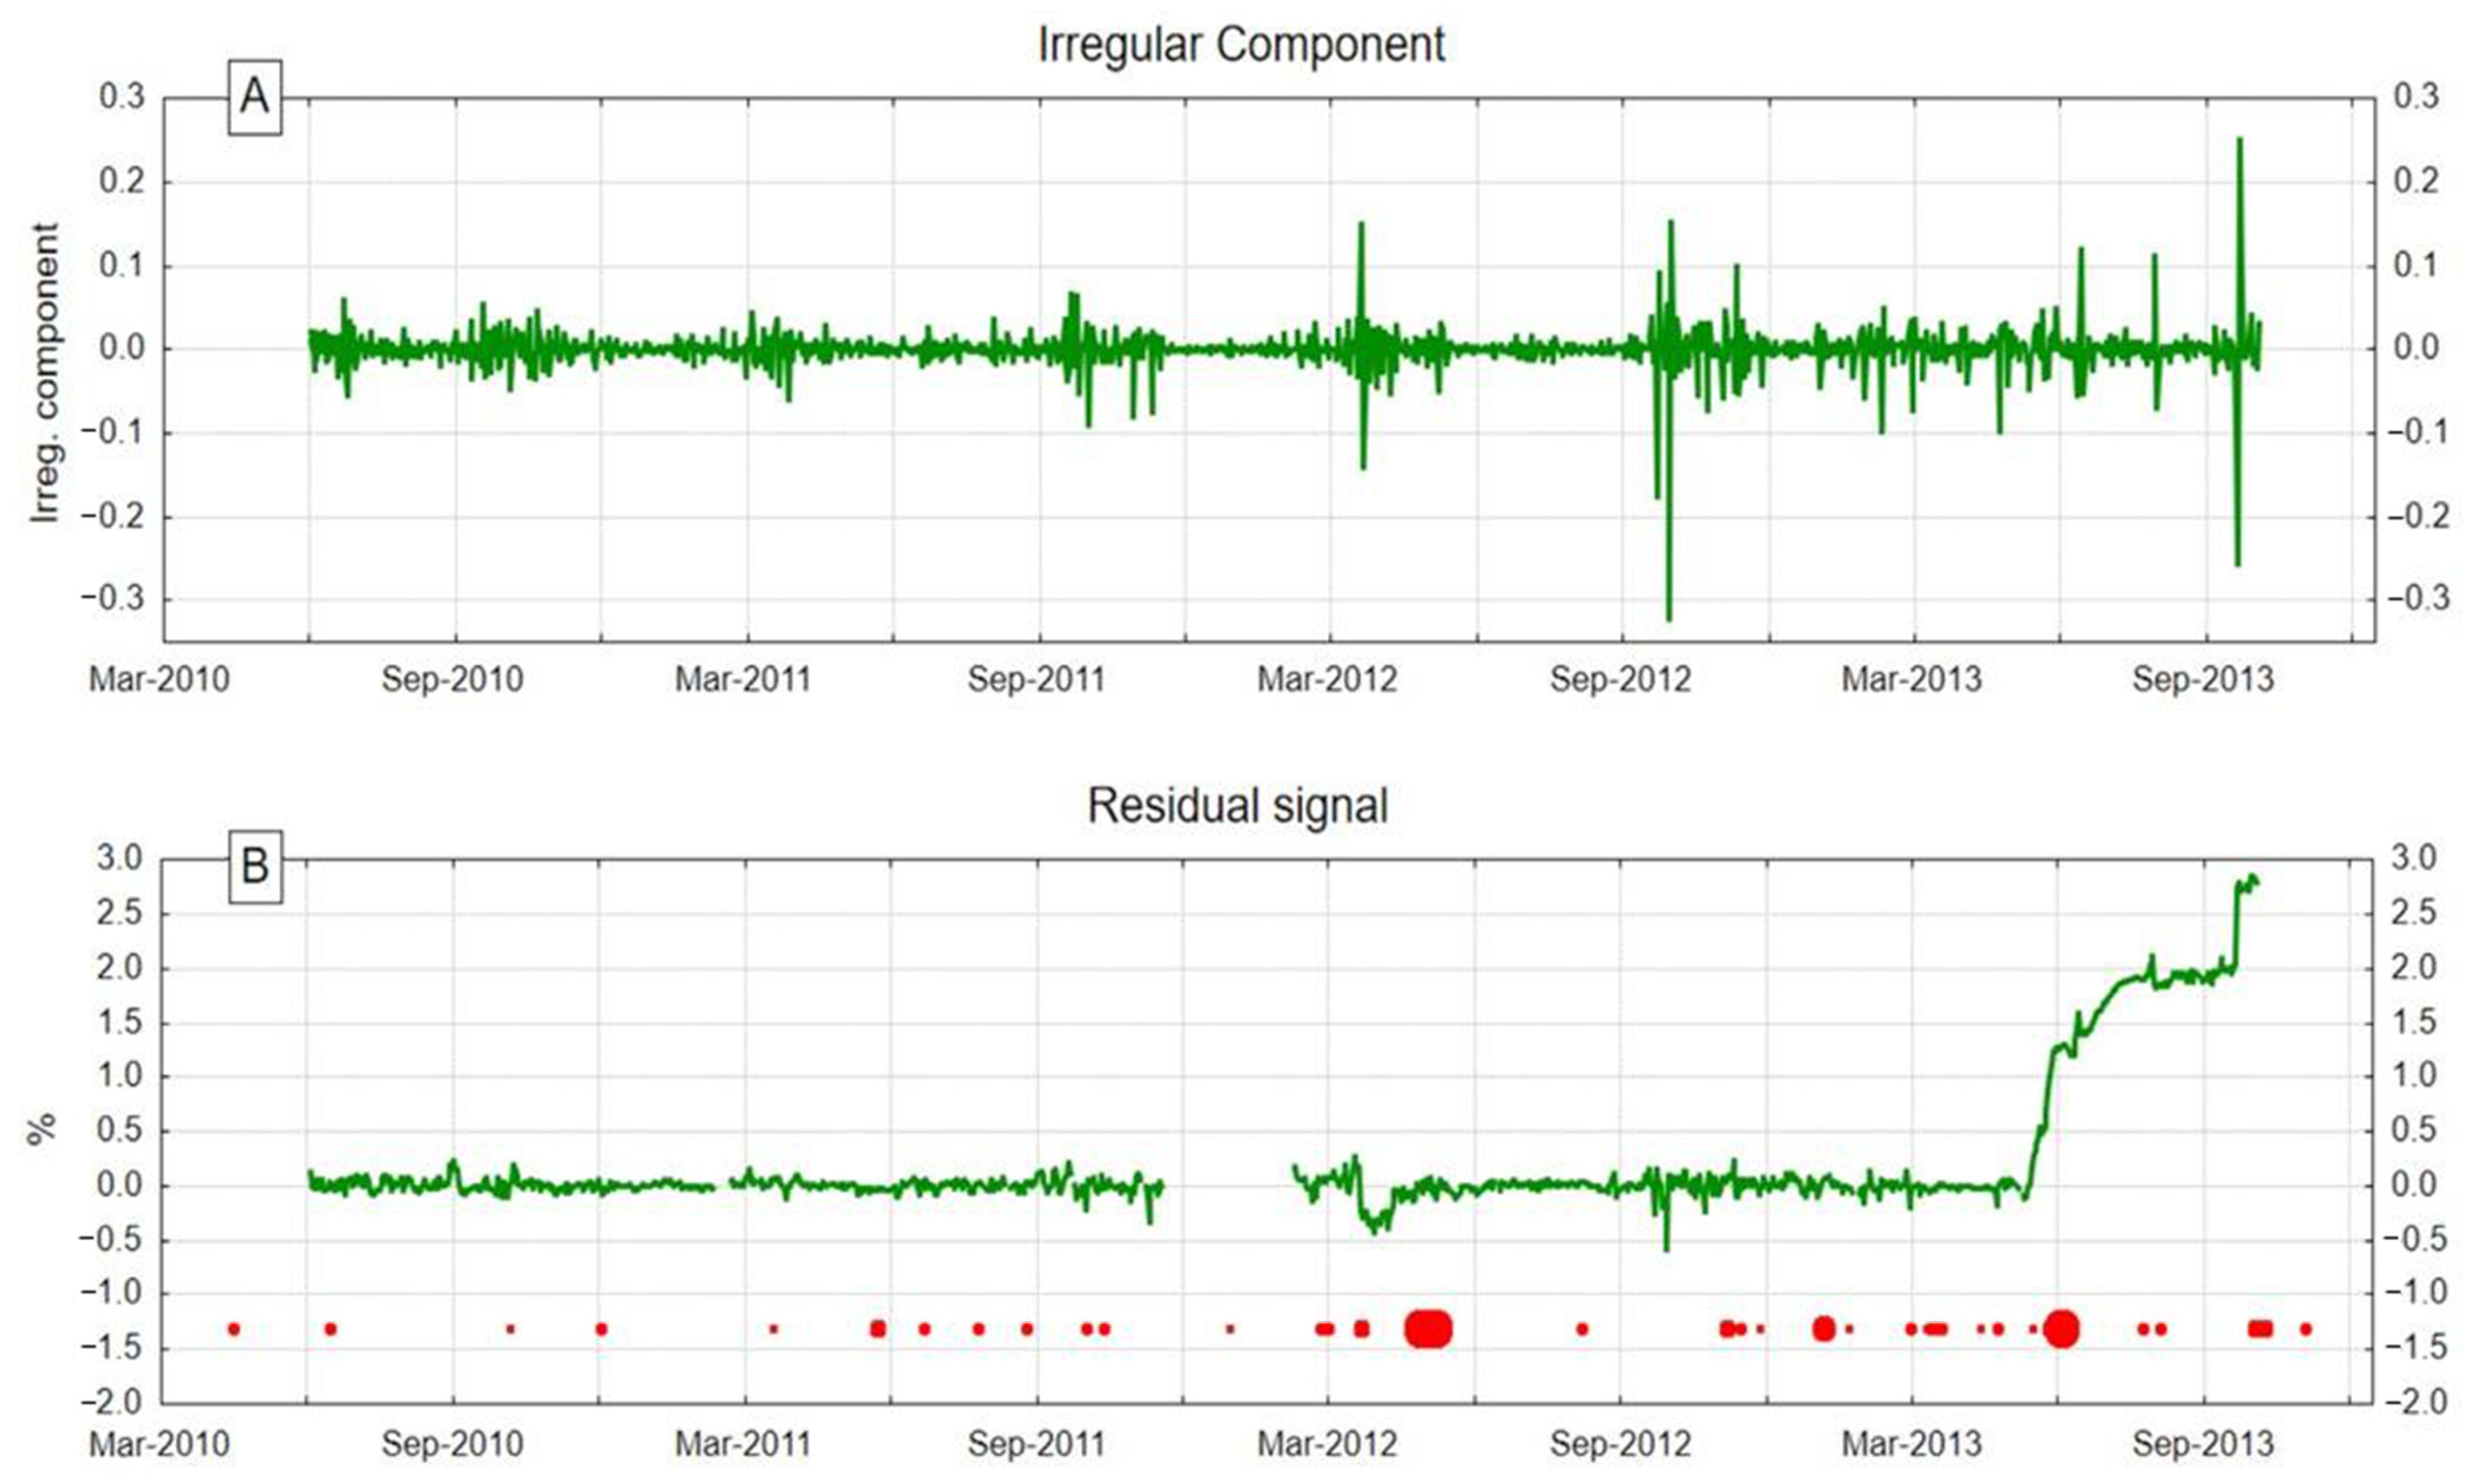
4.1. Processing of CO2 Time Series to Highlight Anomalies
4.1.1. Decomposition of CO2 Time Series by Census I Method
4.1.2. Creation of Synthetic CO2 Time Series by ANN
4.2. Meteorological Data
5. Results
5.1. CO2 Anomalies
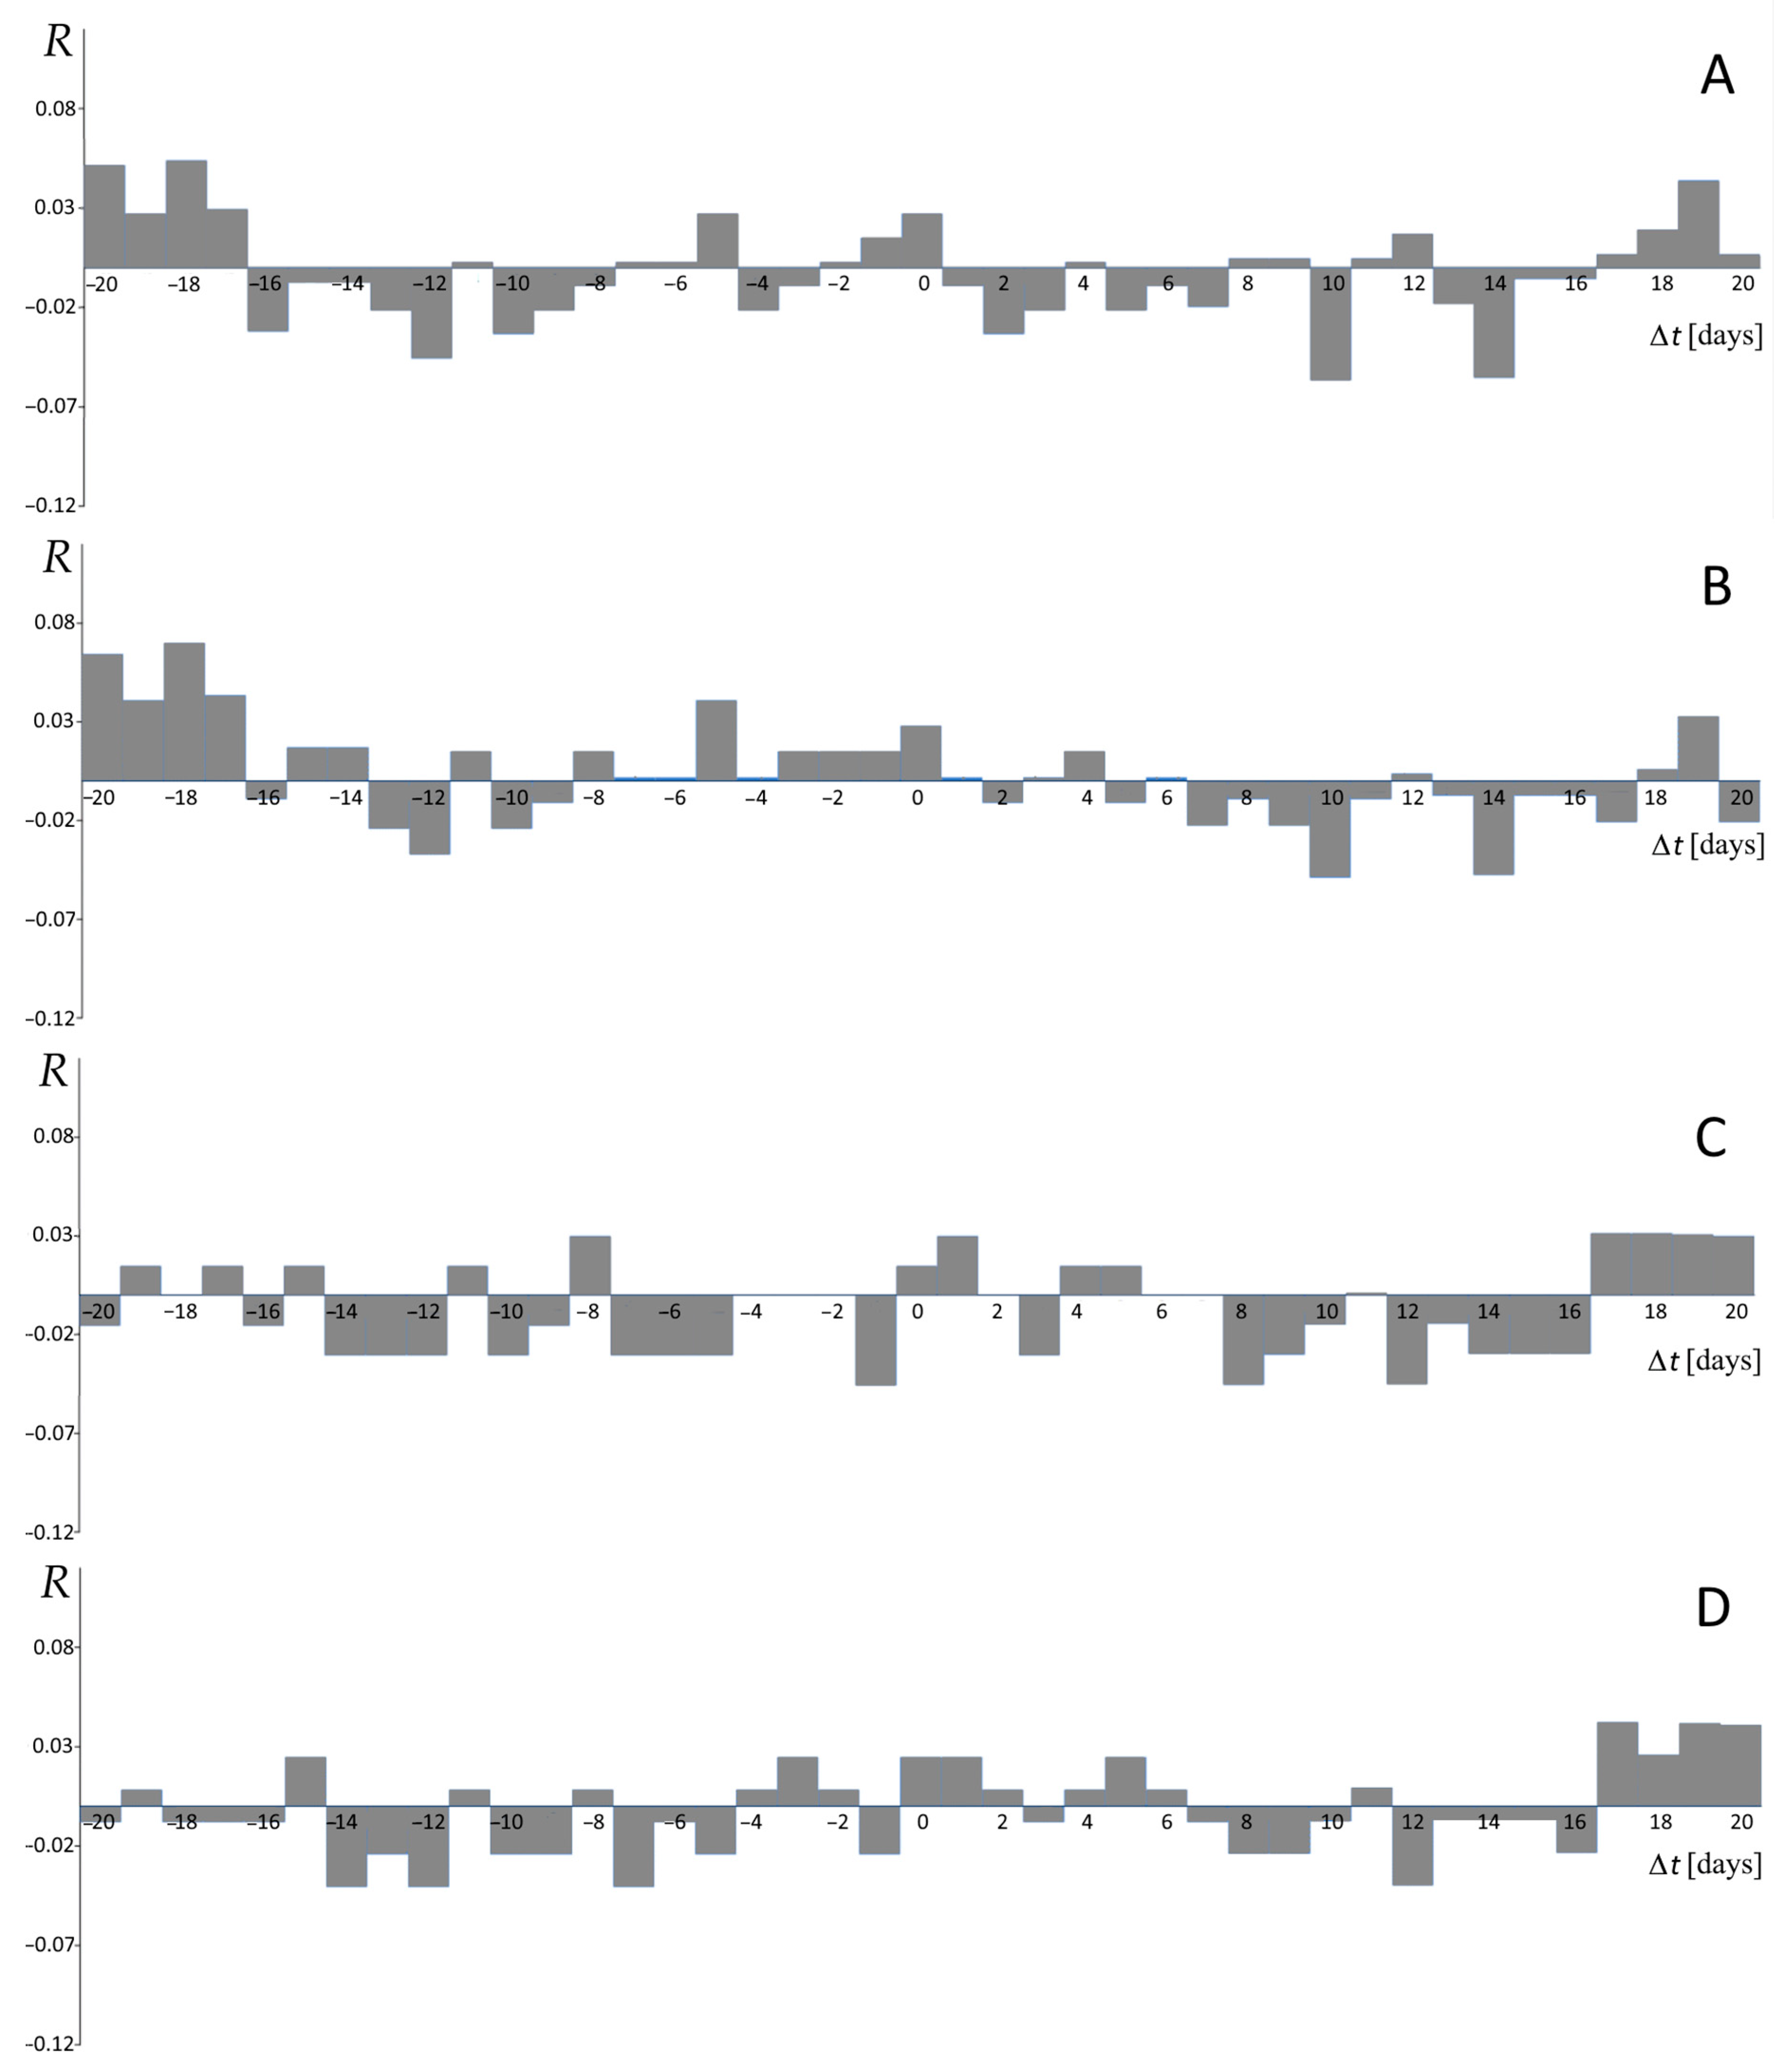
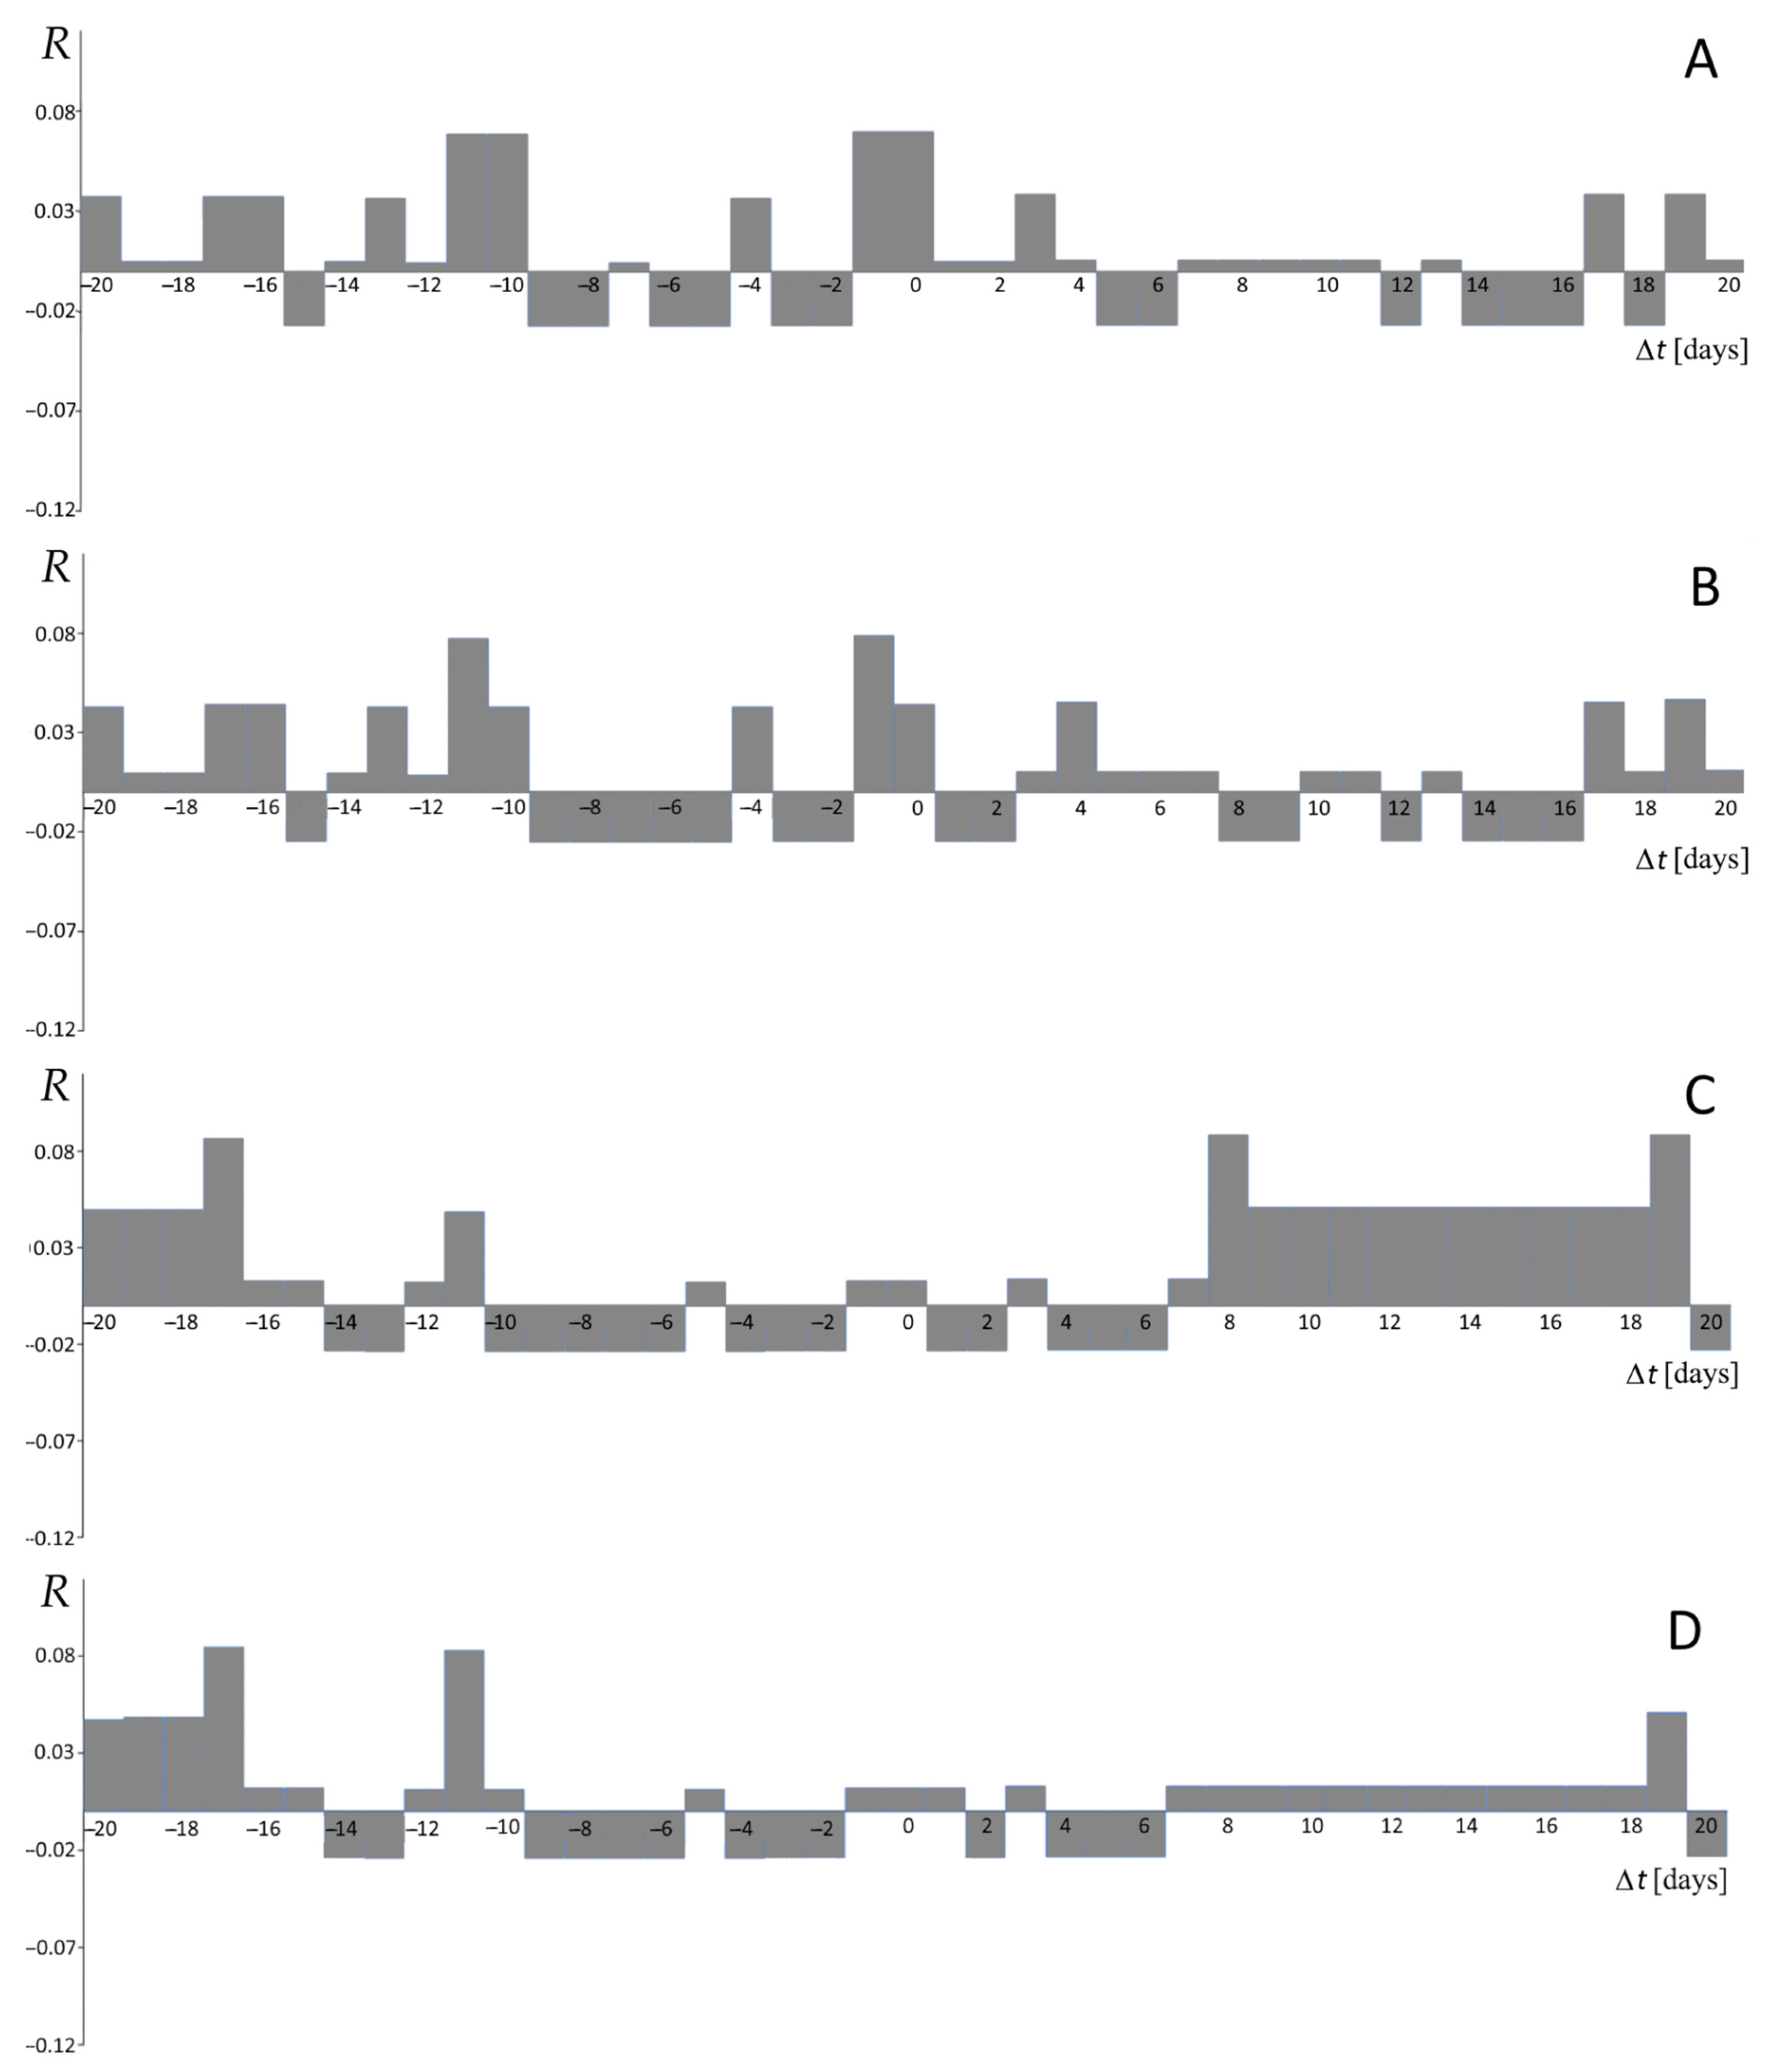
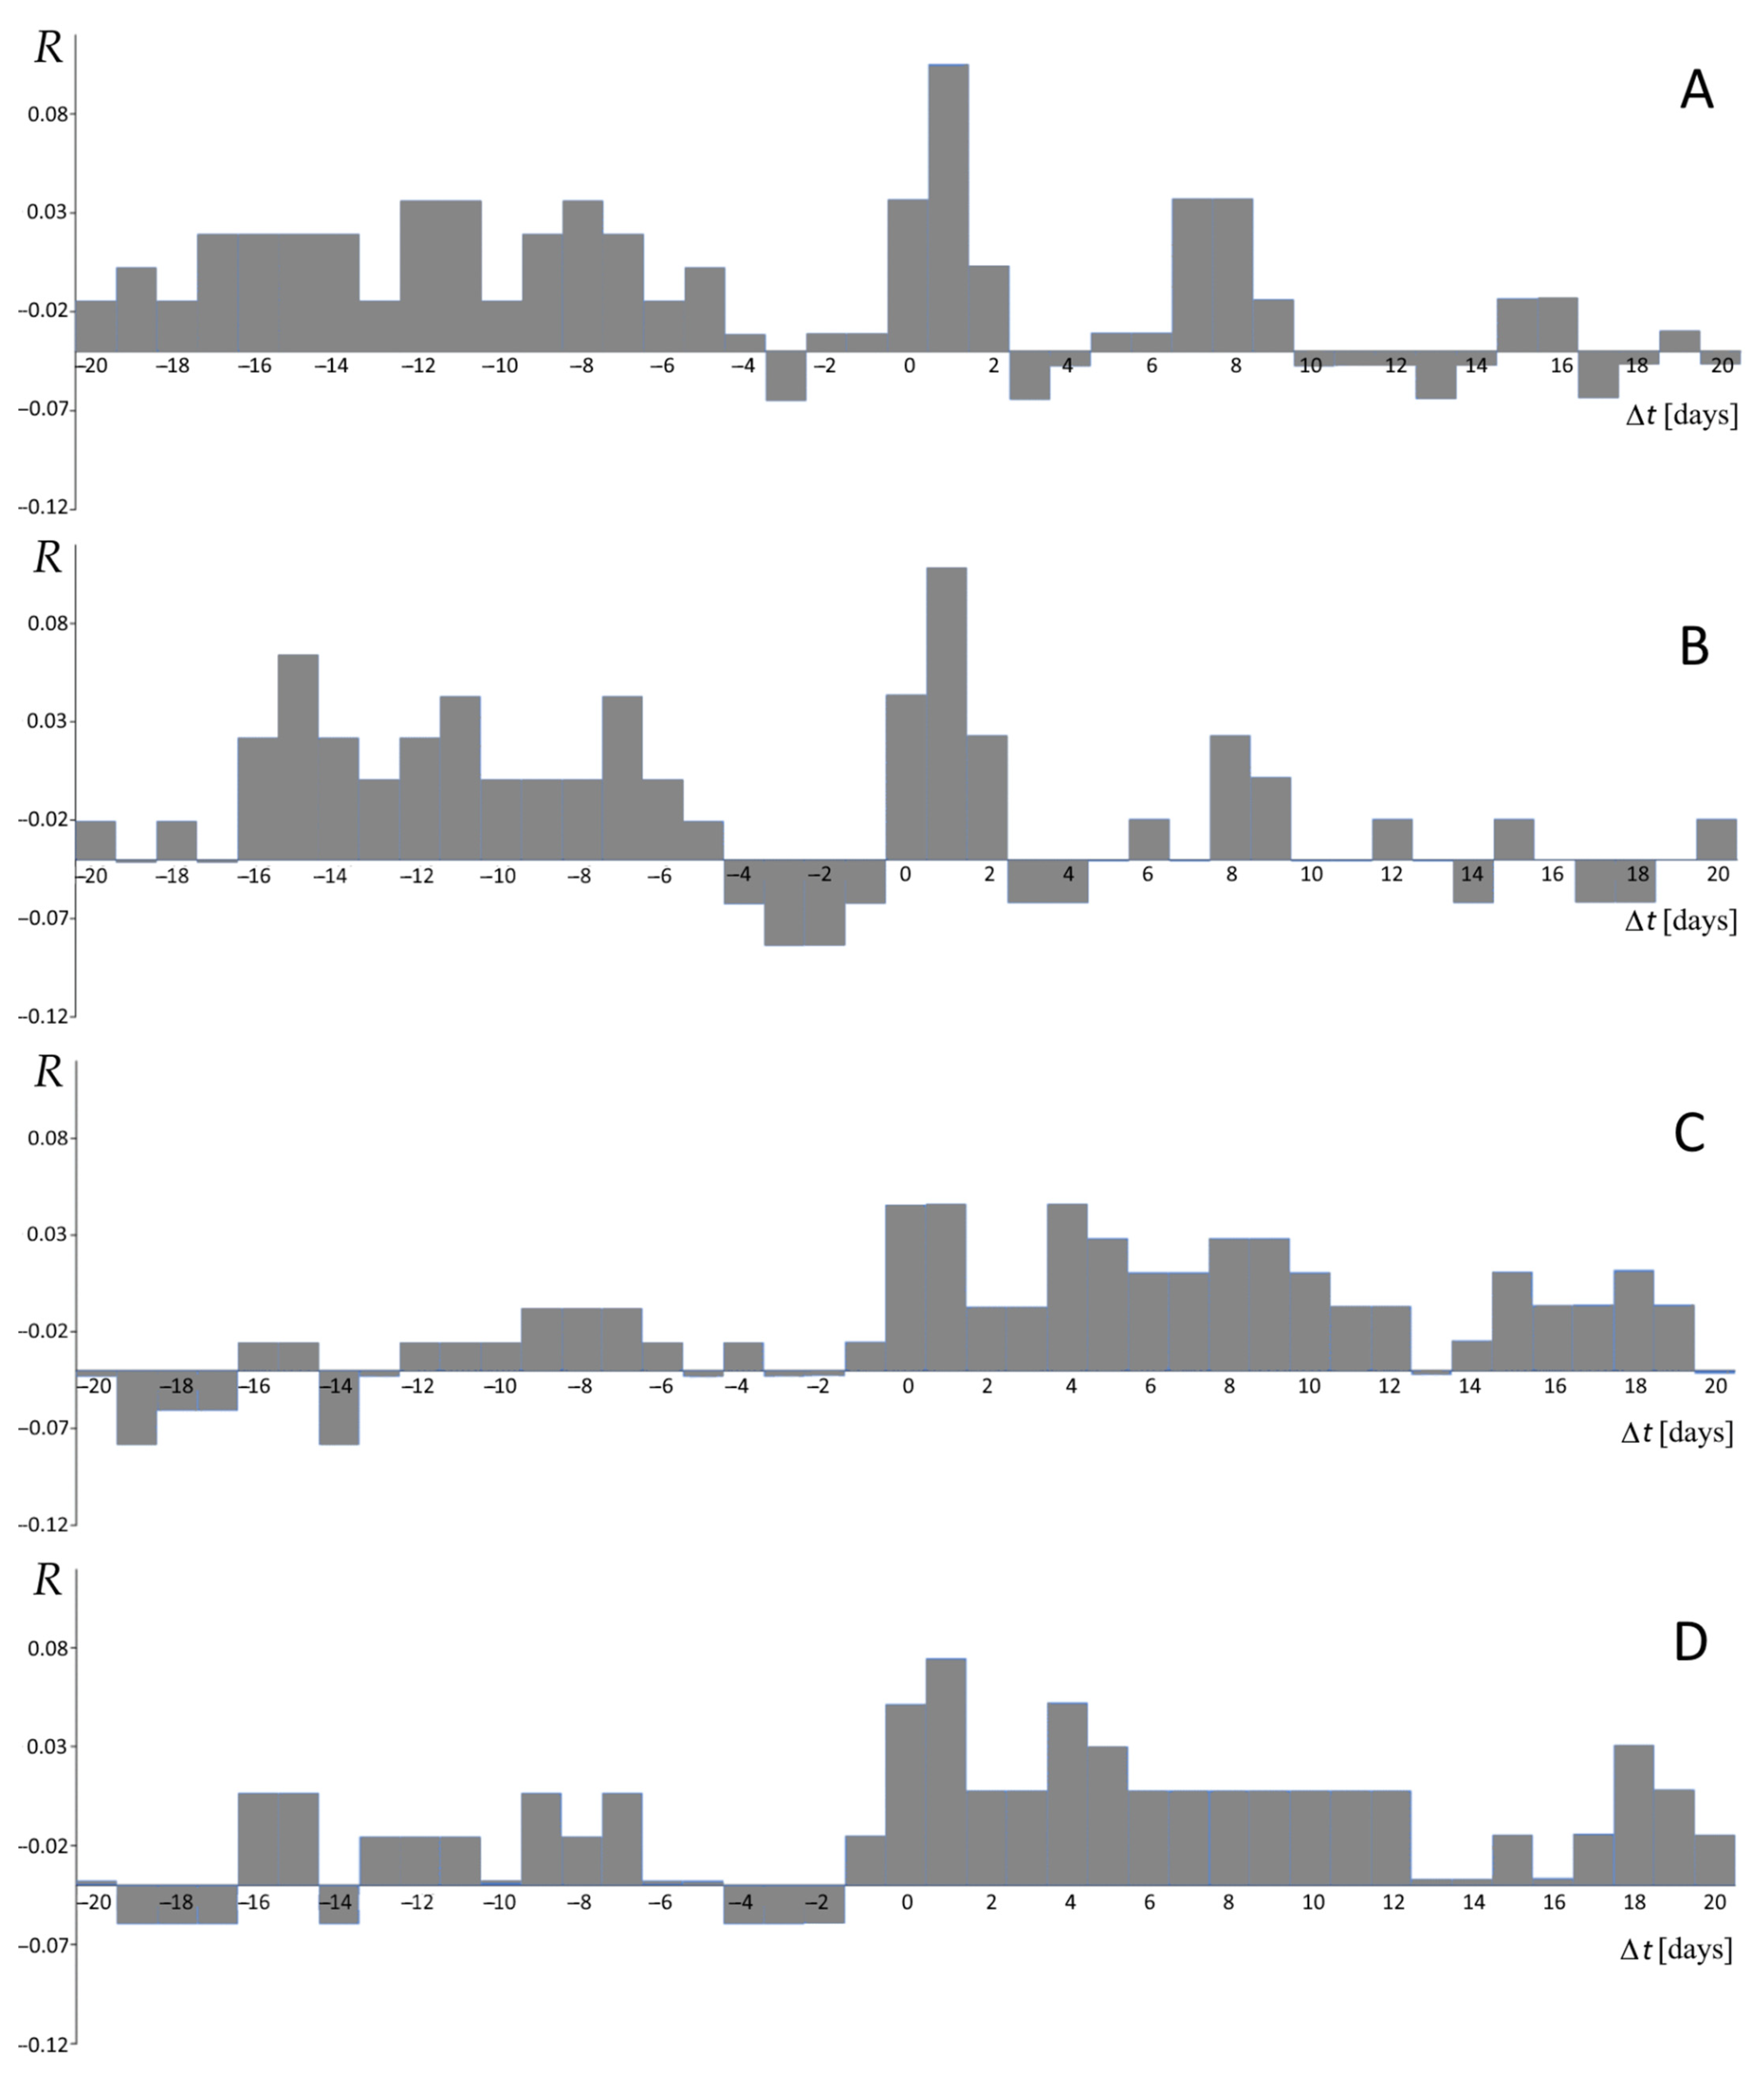
5.2. Correlations
6. Discussion and Conclusions
Author Contributions
Funding
Data Availability Statement
Acknowledgments
Conflicts of Interest
References
- Netreba, A.V.; Fridman, A.I.; Plotnikov, I.A.; Khurin, M.I. On the large-scale 504 mapping of closed ore-bearing areas in the north Caucasus with the uses of gas surveying as a geochemical method. Geokhimia 1971, 8, 1016–1021. (In Russian) [Google Scholar]
- Kravtsov, A.I.; Voitov, G.I. Evaluation of the role of faults in the gas exchange between the lithosphere and the atmosphere illustrated in southern Daghestan. Proc. High. Educ. Inst. Geol. Explor. 1976, 19, 18–26. (In Russian) [Google Scholar]
- Gold, T. Terrestrial sources of carbon and earthquake outgassing. J. Petroleum Geol. 1979, 1, 3–19. [Google Scholar] [CrossRef]
- Gold, T.; Soter, S. Natural Explosive Noises. Science 1981, 212, 1297–1298. [Google Scholar] [CrossRef]
- Irwin, W.P.; Barnes, I. Tectonic relations of carbon dioxide discharges and earthquake. J. Geophys. Res. 1980, 85, 3115–3121. [Google Scholar] [CrossRef]
- Barnes, I.; Irwin, P.W.; White, D.E. Global Distribution of Carbon Dioxide Discharges, and Major Zones of Seismicity; Barnes, I., Irwin, P.W., White, D.E., Eds.; Water Resources Investigation WRI 78-39; U.S. Geological Survey: Washington, DC, USA, 1978; pp. 1–17. [CrossRef]
- Gold, T.; Soter, S. Fluid ascent through the solid lithosphere and its relation to earthquakes. Pure Appl. Geophys. 1984, 122, 492–530. [Google Scholar] [CrossRef]
- Sugisaki, R.; Ido, M.; Takeda, H.; Isobe, Y.; Hayashi, Y.; Nakamura, N.; Satake, H.; Mizutani, Y. Origin of hydrogen and carbon dioxide in fault gases and its relation to fault activity. J. Geol. 1983, 91, 239–258. [Google Scholar] [CrossRef]
- King, C.Y. Gas geochemistry applied to earthquake prediction: An overview. J. Geophys. Res. 1986, 91, 12269–12281. [Google Scholar] [CrossRef]
- Stefànsson, R. Advances in Earthquake Prediction, Research and Risk Mitigation. In Springer and Praxis Book; Springer: Berlin/Heidelberg, Germany, 2011; p. 274. [Google Scholar]
- Stefànsson, R.; Halldòrsson, P. Strain release and strain build-up in the South Iceland seismic zone. Tectonophysics 1988, 159, 267–276. [Google Scholar] [CrossRef]
- Tamburello, G.; Pondrelli, S.; Chiodini, G.; Rouwet, D. Global-scale control of extensional tectonics on CO2 Earth degassing. Nat. Commun. 2018, 9, 4608. [Google Scholar] [CrossRef]
- Kingsley, S.P.; Biagi, P.E.; Piccolo, R.; Capozzi, V.; Ermini, A.; Khatkevichs, Y.M.; Gordeevs, E.I. Hydrogeochemical precursors of strong earthquakes: A realistic possibility in Kamchatka. Phys. Chem. Earth C 2001, 26, 769–774. [Google Scholar] [CrossRef]
- Bräuer, K.; Kämpf, H.; Strauch, G.; Weise, S.M. Isotopic evidence (3He/4He, 13C-CO2) of fluid-triggered intraplate seismicity. J. Geophys. Res. 2003, 108, 2070. [Google Scholar] [CrossRef]
- Ventura, G.; Cinti, F.R.; Di Luccio, F.; Pino, N.A. Mantle wedge dynamics versus crustal seismicity in the Apennines (Italy). Geochem. Geophys. Geosys. 2007, 8, Q02013. [Google Scholar] [CrossRef]
- Massin, F.; Farrell, J.; Smith, R.B. Repeating Earthquakes in the Yellowstone Volcanic Field: Implications for Rupture Dynamics, Ground Deformation, and Migration in Earthquake Swarms. J. Volcanol. Geotherm. Res. 2013, 257, 159–173. [Google Scholar] [CrossRef]
- Miller, S.A. Advances in Geophysics; Dmowska, R., Ed.; Elsevier: Amsterdam, The Netherlands, 2013; Volume 54, pp. 1–46. [Google Scholar]
- Fischer, T.; Matyska, C.; Heinicke, J. Earthquake-enhanced permeability–evidence from carbon dioxide release following the ML 3.5 earthquake in West Bohemia. Earth Planet. Sci. Lett. 2017, 460, 60–67. [Google Scholar] [CrossRef]
- Yoshida, K.; Hasegawa, A. Hypocenter Migration and Seismicity Pattern Change in the Yamagata-Fukushima Border, NE Japan, Caused by Fluid Movement and Pore Pressure Variation. J. Geophys. Res. Solid Earth 2018, 123, 5000–5017. [Google Scholar] [CrossRef]
- Chiodini, G.; Cardellini, C.; Di Luccio, F.; Selva, J.; Frondini, F.; Caliro, S.; Rosiello, A.; Beddini, G.; Ventura, G. Correlation between tectonic CO2 Earth degassing and seismicity is revealed by a 10-year record in the Apennines, Italy. Sci. Adv. 2020, 6, eabc2938. [Google Scholar] [CrossRef] [PubMed]
- Heinicke, J.; Koch, U.; Martinelli, G. CO2 and Radon measurements in the Vogtland area (Germany)—A contribute to earthquake prediction research. Geophys. Res. Lett. 1995, 22, 771–774. [Google Scholar] [CrossRef]
- Heinicke, J.; Braun, T.; Burgassi, P.; Italiano, F.; Martinelli, G. Gas flow anomalies in seismogenic zones in the Upper Tiber Valley, Central Italy. Geophys. J. Int. 2006, 167, 794–806. [Google Scholar] [CrossRef]
- Hunt, J.A.; Zafu, A.; Mather, T.A.; Pyle, D.M.; Barry, P.H. Spatially variable CO2 degassing in the main Ethiopian rift: Implications for magma storage, volatile transport, and rift-related emissions. Geochem. Geophys. Geosyst. 2017, 18, 3714–3737. [Google Scholar] [CrossRef]
- Rose, T.P.; Davisson, M.L. Radiocarbon in hydrologic systems containing dissolved magmatic carbon dioxide. Science 1996, 273, 1367–1370. [Google Scholar] [CrossRef]
- Sorey, M.L.; Evans, W.C.; Kennedy, B.M.; Farrar, C.D.; Hainsworth, L.J.; Hausback, B. Carbon dioxide and helium emissions from a reservoir of magmatic gas beneath Mammoth Mountain, California. J. Geophys. Res. Solid Earth 1998, 103, 15303–15323. [Google Scholar] [CrossRef]
- Chiodini, G.; Frondini, F.; Kerrick, D.M.; Rogie, J.; Parello, F.; Peruzzi, L.; Zanzari, A.R. Quantification of deep CO2 fluxes from Central Italy. Examples of carbon balance for regional aquifers and of soil diffuse degassing. Chem. Geol. 1999, 159, 205–222. [Google Scholar] [CrossRef]
- Caliro, S.; Chiodini, G.; Avino, R.; Cardellini, C.; Frondini, F. Volcanic degassing at Somma–Vesuvio (Italy) inferred by chemical and isotopic signatures of groundwater. Appl. Geochem. 2005, 20, 1060–1076. [Google Scholar] [CrossRef]
- Cox, S.F. Faulting processes at high fluid pressures: An example of fault valve behavior from the Wattle Gully Fault, Victoria, Australia. J. Geophys. Res. Solid Earth 1995, 100, 12841–12859. [Google Scholar] [CrossRef]
- Collettini, C.; Cardellini, C.; Chiodini, G.; De Paola, N.; Holdsworth, R.E.; Smith, S.A.F. Fault weakening due to CO2 degassing in the Northern Apennines: Short-and long-term processes. Geol. Soc. Lond. Spec. Publ. 2008, 299, 175–194. [Google Scholar] [CrossRef]
- Chiarabba, C.; De Gori, P.; Valoroso, L.; Petitta, M.; Carminati, E. Large extensional earthquakes push-up terrific amount of fluids. Sci. Rep. 2022, 12, 14597. [Google Scholar] [CrossRef]
- Gabrielli, S.; Gabrielli, S.; Akinci, A.; Ventura, G.; Napolitano, F.; Del Pezzo, E.; De Siena, L. Fast Changes in Seismic Attenuation of the Upper Crust due to Fracturing and Fluid Migration: The 2016–2017 Central Italy Seismic Sequence. Front. Earth Sci. 2022, 10, 909698. [Google Scholar] [CrossRef]
- Fonzetti, R.; Valoroso, L.; De Gori, P.; Chiarabba, C. Fault and Fluid Interaction during the 2012 Emilia (Northern Italy) Seismic Sequence. Seismol. Res. Lett. 2023, 94, 671–684. [Google Scholar] [CrossRef]
- Manga, M.; Wang, C.Y. Earthquake Hydrology. In Treatise on Geophysics, 2nd ed.; Elsevier: Oxford, UK, 2015; Volume 4, pp. 305–328. [Google Scholar]
- Martinelli, G.; Facca, G.; Genzano, N.; Gherardi, F.; Lisi, M.; Pierotti, L.; Tramutoli, V. Earthquake-related signals in Central Italy detected by hydrogeochemical and satellite techniques. Front. Earth Sci. 2020, 8, 584716. [Google Scholar] [CrossRef]
- Gischig, V.S.; Giardini, D.; Amann, F.; Hertrich, M.; Krietsch, H.; Loew, S.; Maurer, H.; Villiger, L.; Wiemer, S.; Bethmann, F.; et al. Hydraulic stimulation and fluid circulation experiments in underground laboratories: Stepping up the scale towards engineered geothermal systems. Geomech. Energy Environ. 2020, 24, 100175. [Google Scholar] [CrossRef]
- Guglielmi, Y.; Cappa, F.; Henry, P.; Elsworth, E. Seismicity triggered by fluid injection–induced aseismic slip. Science 2015, 348, 1224–1226. [Google Scholar] [CrossRef]
- Wang, W.; Shan, J.; Ni, Z.; Cai, J. Relationship between earthquake dilatancy and electric precursor phenomena. Nat. Hazards 2015, 79, 249–262. [Google Scholar] [CrossRef]
- Enomoto, Y. Coupled interaction of earthquake nucleation with deep Earth gases: A possible mechanism for seismo-electromagnetic phenomena. Geophys. J. Int. 2012, 191, 1210–1214. [Google Scholar] [CrossRef]
- Enomoto, Y.; Yamabe, T.; Okumura, N. Causal mechanisms of seismo-EM phenomena during the 1965–1967 Matsushiro earthquake swarm. Sci. Rep. 2017, 7, 44774. [Google Scholar] [CrossRef] [PubMed]
- Martinelli, G.; Tamburello, G. Geological and geophysical factors constraining the occurrence of earthquake precursors in geofluids: A review and reinterpretation. Front. Earth Sci. 2020, 8, 596050. [Google Scholar] [CrossRef]
- Pierotti, L.; Botti, F.; D’Intinosante, V.; Facca, G.; Gherardi, F. Anomalous CO2 content in the Gallicano thermo-mineral spring (Serchio Valley, Italy) before the 21 June 2013, Alpi Apuane earthquake (M = 5.2). Phys. Chem. Earth Parts A/B/C 2015, 85, 131–140. [Google Scholar] [CrossRef]
- Pierotti, L.; Gherardi, F.; Facca, G.; Piccardi, L.; Moratti, G. Detecting CO2 anomalies in a spring on Mt. Amiata volcano (Italy). Phys. Chem. Earth Parts A/B/C 2017, 98, 161–172. [Google Scholar] [CrossRef]
- Gherardi, F.; Pierotti, L. The suitability of the Pieve Fosciana hydrothermal system (Italy) as a detection site for geochemical seismic precursors. Appl. Geochem. 2018, 92, 166–179. [Google Scholar] [CrossRef]
- Fidani, C. West Pacific Earthquake Forecasting Using NOAA Electron Bursts with Independent L-Shells and Ground-Based Magnetic Correlations. Front. Earth Sci. 2021, 9, 673105. [Google Scholar] [CrossRef]
- Fidani, C.; Gherardi, F.; Facca, G.; Pierotti, L. Correlation between small earthquakes and anomalies in spring waters: A statistical experiment on the probability of seismic occurrence. Front. Earth Sci. 2023, 11, 1128949. [Google Scholar] [CrossRef]
- Rovida, A.; Locati, M.; Camassi, R.; Lolli, B.; Gasperini, P.; Antonucci, A. Catalogo Parametrico dei Terremoti Italiani (CPTI15), Versione 4.0; Istituto Nazionale di Geofisica e Vulcanologia: Italy, 2022. [Google Scholar]
- DISS Working Group. Database of Individual Seismogenic Sources (DISS), Version 3.3.0: A Compilation of Potential Sources for Earthquakes Larger than M 5.5 in Italy and Surrounding Areas; Istituto Nazionale di Geofisica e Vulcanologia: Italy, 2021. [Google Scholar] [CrossRef]
- Stucchi, M.; Meletti, C.; Montaldo, V.; Crowley, H.; Calvi, G.M.; Boschi, E. Seismic Hazard Assessment (2003–2009) for the 686 Italian Building Code. Bull. Seismol. Soc. Am. 2011, 101, 1885–1911. [Google Scholar] [CrossRef]
- Molli, G.; Manighetti, I.; Bennett, R.; Malavieille, J.; Serpelloni, E.; Storti, F.; Giampietro, T.; Bigot, A.; Pinelli, G.; Giacomelli, S.; et al. Active fault systems in the Inner Northwest Apennines, Italy: A reappraisal one century after the 1920 Mw~6.5 Fivizzano earthquake. Geosciences 2021, 11, 139. [Google Scholar] [CrossRef]
- Reasenberg, P. Second-Order Moment of Central California Seismicity, 1969–1982. J. Geophys. Res. 1985, 90, 5479–5495. [Google Scholar] [CrossRef]
- Wiemer, S. A Software Package to Analyze Seismicity: ZMAP. Seismol. Res. Lett. 2001, 72, 373–382. [Google Scholar] [CrossRef]
- Dobrovolsky, I.P.; Zubkov, S.I.; Miachkin, V.I. Estimation of the size of earthquake preparation zones. Pure Appl. Geophys. 1979, 117, 1025–1044. [Google Scholar] [CrossRef]
- Leonard, M. Earthquake Fault Scaling: Self-Consistent Relating of Rupture Length, Width, Average Displacement, and Moment Release. Bull. Seismol. Soc. Am. 2010, 100, 1971–1988. [Google Scholar] [CrossRef]
- Trippetta, F.; Petricca, P.; Billi, A.; Collettini, C.; Cuffaro, M.; Lombardi, A.M.; Scrocca, D.; Ventura, G.; Morgante, A.; Doglioni, C. From mapped faults to fault-length earthquake magnitude (FLEM): A test on Italy with methodological implications. Solid Earth 2019, 10, 1555–1579. [Google Scholar] [CrossRef]
- Munafò, I.; Malagnini, L.; Chiaraluce, L. On the Relationship between Mw and ML for Small Earthquakes. Bull. Seismol. Soc. Am. 2016, 106, 2402–2408. [Google Scholar] [CrossRef]
- De Stefani, C. Le acque termali di Torrite in Garfagnana. Boll. Soc. Geol. It. 1904, XXIII, 117–148. (In Italian) [Google Scholar]
- Bencini, A.; Duchi, V.; Martini, M. Geochemistry of thermal springs of Tuscany, (Italy). Chem. Geol. 1977, 19, 229–252. [Google Scholar] [CrossRef]
- Fanelli, M.; Bellucci, L.; Nachira, F. Manifestazioni idrotermaliit aliane. CNR–PFE. In Geothermal Energy Subproject RF 13; Appendix; 1982. CNR Edition. (In Italian) [Google Scholar]
- Cioni, R.; Guidi, M.; Pierotti, L.; Scozzari, A. An automatic monitoring network installed in Tuscany (Italy) for studying possible geochemical precursory phenomena. Nat. Hazards Earth Syst. Sci. 2007, 7, 405–416. [Google Scholar] [CrossRef]
- Baldacci, F.; Raggi, G. Lineamenti geologici e idrogeologici della regione dell’Appennino Ligure Toscano a nord dell’Arno. Contributo alle conoscenze delle risorse geotermiche del territorio italiano, CNR–PFE. In Geothermal Energy Subproject RF 13; 1982; pp. 68–85. CNR Edition. (In Italian) [Google Scholar]
- Makridakis, S.; Wheelwright, S.C.; Hyndman, R.J. Forecasting Methods and Applications, 3rd ed.; John Wiley and Sons: New York, NY, USA, 1998; p. 642. [Google Scholar]
- Muller, B.; Reinhardt, J. Neural Networks: An Introduction; Springer: Berlin/Heidelberg, Germany, 1990; p. 280. [Google Scholar]
- Box, G.E.P.; Jenkins, G.M. Time Series Analysis: Forecasting and Control; Holden-Day: San Francisco, CA, USA, 1976. [Google Scholar]
- Velleman, P.F.; Hoaglin, D.C. Applications, Basics, and Computing of Exploratory Data Analysis; Duxbury Press: Boston, MA, USA, 1981. [Google Scholar]
- Statsoft Inc. STATISTICA (Data Analysis Software System) Version 12 for Windows: Statistics; STATSOFT Inc.: Tulsa, OK, USA, 2013. [Google Scholar]
- Muller, B.; Reinhardt, J.; Strickland, M.T. Physics of Neural Networks, Neural Networks: An Introduction; Springer Science & Business Media: Berlin/Heidelberg, Germany, 1995. [Google Scholar]
- Rumelhart, D.E.; McClelland, J.L.; PDP Research Group. Parallel Distributed Processing-Explorations in the Microstructure of Cognition, Volume 1: Foundations; MIT Press: Cambridge, MA, USA, 1986; p. 547. [Google Scholar]
- Solomatine, D.P.; Ostfeld, A. Data-driven modelling: Some past experiences and new approaches. J. Hydroinformatics 2008, 10, 3–22. [Google Scholar] [CrossRef]
- Pearson, K. Mathematical contributions to the theory of evolution, XIX: Second supplement to a memoir on skew variation. Philos. Trans. R. Soc. A 1916, 216, 429–457. [Google Scholar] [CrossRef]
- Johnson, N.L.; Samuel Kotz, S.; Balakrishnan, N. Continuous Univariate Distributions, 2nd ed.; Wiley: New York, NY, USA, 1995; Volume 2. [Google Scholar]
- Matthews, B.W. Comparison of the predicted and observed secondary structure of T4 phagelysozyme. Biochim. Biophys. Acta (BBA)-Protein Struct. 1975, 405, 442–451. [Google Scholar] [CrossRef]
- Fidani, C. Probability, Causality and False Alarms Using Correlations between Strong Earthquakes and NOAA High Energy Electron Bursts. Ann. Geophys. 2020, 63, 543. [Google Scholar] [CrossRef]
- Fidani, C. Improving Earthquake Forecasting by Correlations between Strong Earthquakes and NOAA Electron Bursts. Terr. Atmos. Ocean. Sci. 2018, 29, 117–130. [Google Scholar] [CrossRef]


| N. | Date and Time [YYYY-MM-DD hh:mm:ss] | Latitude [°] | Longitude [°] | Depth [km] | Magnitude Ml (INGV) | Magnitude MW (2) (* USGS) | Distance from Gallicano [km] | Lf [km] | D/Lf |
|---|---|---|---|---|---|---|---|---|---|
| 1 | 2010-07-14 09:10:42 | 10.3630 | 43.8850 | 7.4 | 2.4 | 2.7 | 20.3 | 0.25 | 81.2 |
| 2 | 2010-11-03 15:28:48 | 10.5810 | 44.1110 | 10.3 | 1.9 | 2.4 | 13 | 0.17 | 76.47 |
| 3 | 2010-12-29 02:15:35 | 10.5100 | 43.9840 | 5.3 | 2.1 | 2.5 | 10.3 | 0.2 | 51.5 |
| 4 | 2011-04-15 01:39:15 | 10.4330 | 44.1290 | 10.7 | 1.5 | 2.1 | 7.8 | 0.12 | 65 |
| 5 | 2011-05-22 12:26:48 | 10.4610 | 44.0390 | 4.9 | 0.7 | 1.6 | 3.2 | 0.07 | 45.71 |
| 6 | 2011-06-19 14:35:34 | 10.8150 | 44.1520 | 6.5 | 3.6 | 3.5 | 32.2 | 0.63 | 51.11 |
| 7 | 2011-07-12 04:11:39 | 10.4320 | 44.0110 | 1.3 | 0.8 | 1.7 | 5.5 | 0.07 | 78.57 |
| 8 | 2011-07-17 21:50:57 | 10.5670 | 44.2390 | 17.0 | 2.4 | 2.7 | 22.5 | 0.25 | 90 |
| 9 | 2011-08-20 20:02:48 | 10.8930 | 44.0750 | 3.9 | 2.9 | 3.1 | 36.7 | 0.37 | 99.19 |
| 10 | 2011-09-19 06:24:16 | 10.7630 | 44.2720 | 9.8 | 2.6 | 2.9 | 35.4 | 0.29 | 122.07 |
| 11 | 2011-10-26 16:26:28 | 10.7760 | 44.1430 | 12.4 | 2.4 | 2.7 | 29.2 | 0.25 | 116.8 |
| 12 | 2011-11-06 01:33:59 | 10.6820 | 44.1480 | 17.5 | 2.3 | 2.7 | 32.2 | 0.23 | 140 |
| 13 | 2012-01-22 05:31:15 | 10.4740 | 44.1110 | 10.1 | 1.9 | 2.4 | 6.6 | 0.17 | 38.82 |
| 14 | 2012-03-19 19:33:03 | 10.1230 | 44.2420 | 5.0 | 2.7 | 2.9 | 32.5 | 0.32 | 101.56 |
| 15 | 2012-03-24 19:18:04 | 10.2730 | 44.3160 | 19.0 | 2.8 | 3 | 31.5 | 0.34 | 92.65 |
| 16 | 2012-04-12 23:01:48 | 10.5730 | 44.3130 | 22.3 | 3.1 | 3.2 | 30.5 | 0.43 | 70.93 |
| 17 | 2012-04-13 22:13:56 | 10.8960 | 44.0830 | 9.5 | 3.3 | 3.3 | 37.1 | 0.5 | 74.2 |
| 18 | 2012-05-18 20:10:52 | 10.1752 | 44.1757 | 9.1 | 2.4 | 2.7 | 24.5 | 0.25 | 98 |
| 19 | 2012-05-20 02:03:53 | 11.2280 | 44.8890 | 6.3 | 6 | 5.9 * | 113.7 | 11.29 | 9.55 |
| 20 | 2012-05-29 07:00:03 | 11.0860 | 44.8510 | 8.1 | 5.8 | 5.8 * | 103.4 | 8.57 | 12.06 |
| 21 | 2012-08-28 01:56:14 | 10.6605 | 44.0958 | 16.2 | 2.4 | 2.7 | 18.7 | 0.25 | 74.8 |
| 22 | 2012-11-26 19:18:55 | 10.6742 | 44.1178 | 21.6 | 3.2 | 3.3 | 20.5 | 0.46 | 44.56 |
| 23 | 2012-12-04 16:38:27 | 11.0090 | 44.1363 | 8.8 | 2.9 | 3.1 | 46.8 | 0.37 | 126.49 |
| 24 | 2012-12-16 11:24:27 | 10.4437 | 44.1258 | 7.0 | 1.6 | 2.2 | 7.5 | 0.13 | 57.69 |
| 25 | 2013-01-25 14:48:18 | 10.4458 | 44.1643 | 19.8 | 4.8 | 4.9 * | 11.6 | 2.48 | 4.68 |
| 26 | 2013-02-09 02:19:10 | 10.3685 | 44.0785 | 6.1 | 1.7 | 2.3 | 5.6 | 0.15 | 37.33 |
| 27 | 2013-02-20 11:09:59 | 10.5300 | 44.1568 | 13.5 | 3.0 | 3.1 | 13.4 | 0.4 | 33.5 |
| 28 | 2013-03-29 12:59:21 | 10.4187 | 44.1222 | 8.4 | 1.7 | 2.3 | 7.2 | 0.15 | 48 |
| 29 | 2013-04-01 23:35:11 | 10.4763 | 44.1953 | 14.8 | 2.0 | 2.5 | 15.5 | 0.18 | 86.11 |
| 30 | 2013-04-05 03:23:42 | 10.5065 | 44.1662 | 15.0 | 2.3 | 2.7 | 13.2 | 0.23 | 57.39 |
| 31 | 2013-04-08 11:38:57 | 10.5160 | 44.1578 | 13.5 | 2.6 | 2.9 | 12.9 | 0.29 | 44.48 |
| 32 | 2013-05-02 17:10:14 | 10.4537 | 44.0837 | 6.8 | 1.5 | 2.1 | 3.1 | 0.12 | 25.83 |
| 33 | 2013-05-13 18:35:47 | 10.4462 | 43.8403 | 8.3 | 2.5 | 2.8 | 24.3 | 0.27 | 90 |
| 34 | 2013-06-03 15:33:12 | 10.4418 | 44.1193 | 10.0 | 1.8 | 2.3 | 6.7 | 0.16 | 41.87 |
| 35 | 2013-06-14 18:22:23 | 11.0543 | 44.2812 | 20.3 | 3.7 | 3.6 | 55.4 | 0.68 | 81.47 |
| 36 | 2013-06-15 19:41:16 | 10.1462 | 44.1482 | 10.4 | 3.4 | 3.6 * | 25.2 | 0.31 | 81.29 |
| 37 | 2013-06-19 10:51:07 | 10.7138 | 44.4193 | 28.5 | 3.5 | 3.5 * | 45.8 | 0.36 | 127.22 |
| 38 | 2013-06-21 10:33:57 | 10.1357 | 44.1308 | 7.0 | 5.1 | 5.1* | 25.1 | 3.26 | 7.7 |
| 39 | 2013-06-23 13:24:01 | 10.2008 | 44.1683 | 9.2 | 4.4 | 4.4 * | 22.3 | 1.24 | 17.98 |
| 40 | 2013-06-29 05:21:34 | 10.1698 | 44.1513 | 5.9 | 3.5 | 3.5 | 23.5 | 0.58 | 40.52 |
| 41 | 2013-06-30 02:57:42 | 10.1867 | 44.1595 | 6.1 | 4.5 | 4.5 * | 22.8 | 1.43 | 15.94 |
| 42 | 2013-07-09 09:12:57 | 10.1777 | 44.1625 | 6.2 | 3.1 | 3.2 | 23.7 | 0.43 | 55.12 |
| 43 | 2013-07-12 18:07:22 | 10.1067 | 44.2017 | 10.0 | 3.5 | 3.5 | 30.6 | 0.58 | 52.76 |
| 44 | 2013-08-10 13:11:09 | 10.2393 | 44.1962 | 5.8 | 2.7 | 2.9 | 21.9 | 0.32 | 68.44 |
| 45 | 2013-08-14 15:35:50 | 10.1903 | 44.1758 | 9.3 | 3.5 | 3.5 * | 23.5 | 0.36 | 65.28 |
| 46 | 2013-08-21 05:32:13 | 10.5807 | 44.2485 | 15.4 | 2.8 | 3 | 24.1 | 0.34 | 70.88 |
| 47 | 2013-10-03 19:07:15 | 10.3270 | 44.2150 | 10.1 | 2.2 | 2.6 | 19.5 | 0.21 | 92.86 |
| 48 | 2013-10-19 12:29:35 | 10.2638 | 43.6807 | 10.5 | 3.5 | 3.5 | 43.7 | 0.58 | 75.34 |
| 49 | 2013-10-25 09:17:00 | 10.5012 | 44.2582 | 19.8 | 3.1 | 3.2 | 22.8 | 0.43 | 53.02 |
| 50 | 2013-11-19 21:05:48 | 10.7003 | 43.9453 | 5.0 | 2.2 | 2.6 | 25.2 | 0.21 | 120 |
| Mean | Median | Minimum | Maximum | Std. Dev | |
|---|---|---|---|---|---|
| Temperature (°C) | 22.5 | 22.6 | 20.4 | 23.7 | 0.76 |
| Electrical Conductivity (µS/cm) | 5444 | 5571 | 4007 | 6088 | 461 |
| pH | 6.97 | 6.97 | 6.89 | 7.07 | 0.03 |
| ORP (mV) | 387 | 393 | 171 | 461 | 38.8 |
| CO2 (%) | 2.37 | 2.19 | 1.46 | 5.06 | 0.60 |
Disclaimer/Publisher’s Note: The statements, opinions and data contained in all publications are solely those of the individual author(s) and contributor(s) and not of MDPI and/or the editor(s). MDPI and/or the editor(s) disclaim responsibility for any injury to people or property resulting from any ideas, methods, instructions or products referred to in the content. |
© 2024 by the authors. Licensee MDPI, Basel, Switzerland. This article is an open access article distributed under the terms and conditions of the Creative Commons Attribution (CC BY) license (https://creativecommons.org/licenses/by/4.0/).
Share and Cite
Pierotti, L.; Fidani, C.; Facca, G.; Gherardi, F. Cross-Correlation among Seismic Events, Rainfalls, and Carbon Dioxide Anomalies in Spring Water: Insights from Geochemical Monitoring in Northern Tuscany, Italy. Water 2024, 16, 739. https://doi.org/10.3390/w16050739
Pierotti L, Fidani C, Facca G, Gherardi F. Cross-Correlation among Seismic Events, Rainfalls, and Carbon Dioxide Anomalies in Spring Water: Insights from Geochemical Monitoring in Northern Tuscany, Italy. Water. 2024; 16(5):739. https://doi.org/10.3390/w16050739
Chicago/Turabian StylePierotti, Lisa, Cristiano Fidani, Gianluca Facca, and Fabrizio Gherardi. 2024. "Cross-Correlation among Seismic Events, Rainfalls, and Carbon Dioxide Anomalies in Spring Water: Insights from Geochemical Monitoring in Northern Tuscany, Italy" Water 16, no. 5: 739. https://doi.org/10.3390/w16050739