

Improved Performance of Sulfur-Driven Autotrophic Denitrification Process by Regulating Sulfur-Based Electron Donors

Abstract
:
1. Introduction
2. Materials and Methods
2.1. Bioreactor Setup and Operation
2.2. Batch Experiments
2.3. Chemical Analysis
3. Results and Discussion
3.1. Optimization of the S0-PBR Performance
3.2. The Short-Term Effects of Varying S0 Particle Sizes and Chemical S2− Addition on the SADN Process
4. Conclusions
- ♦
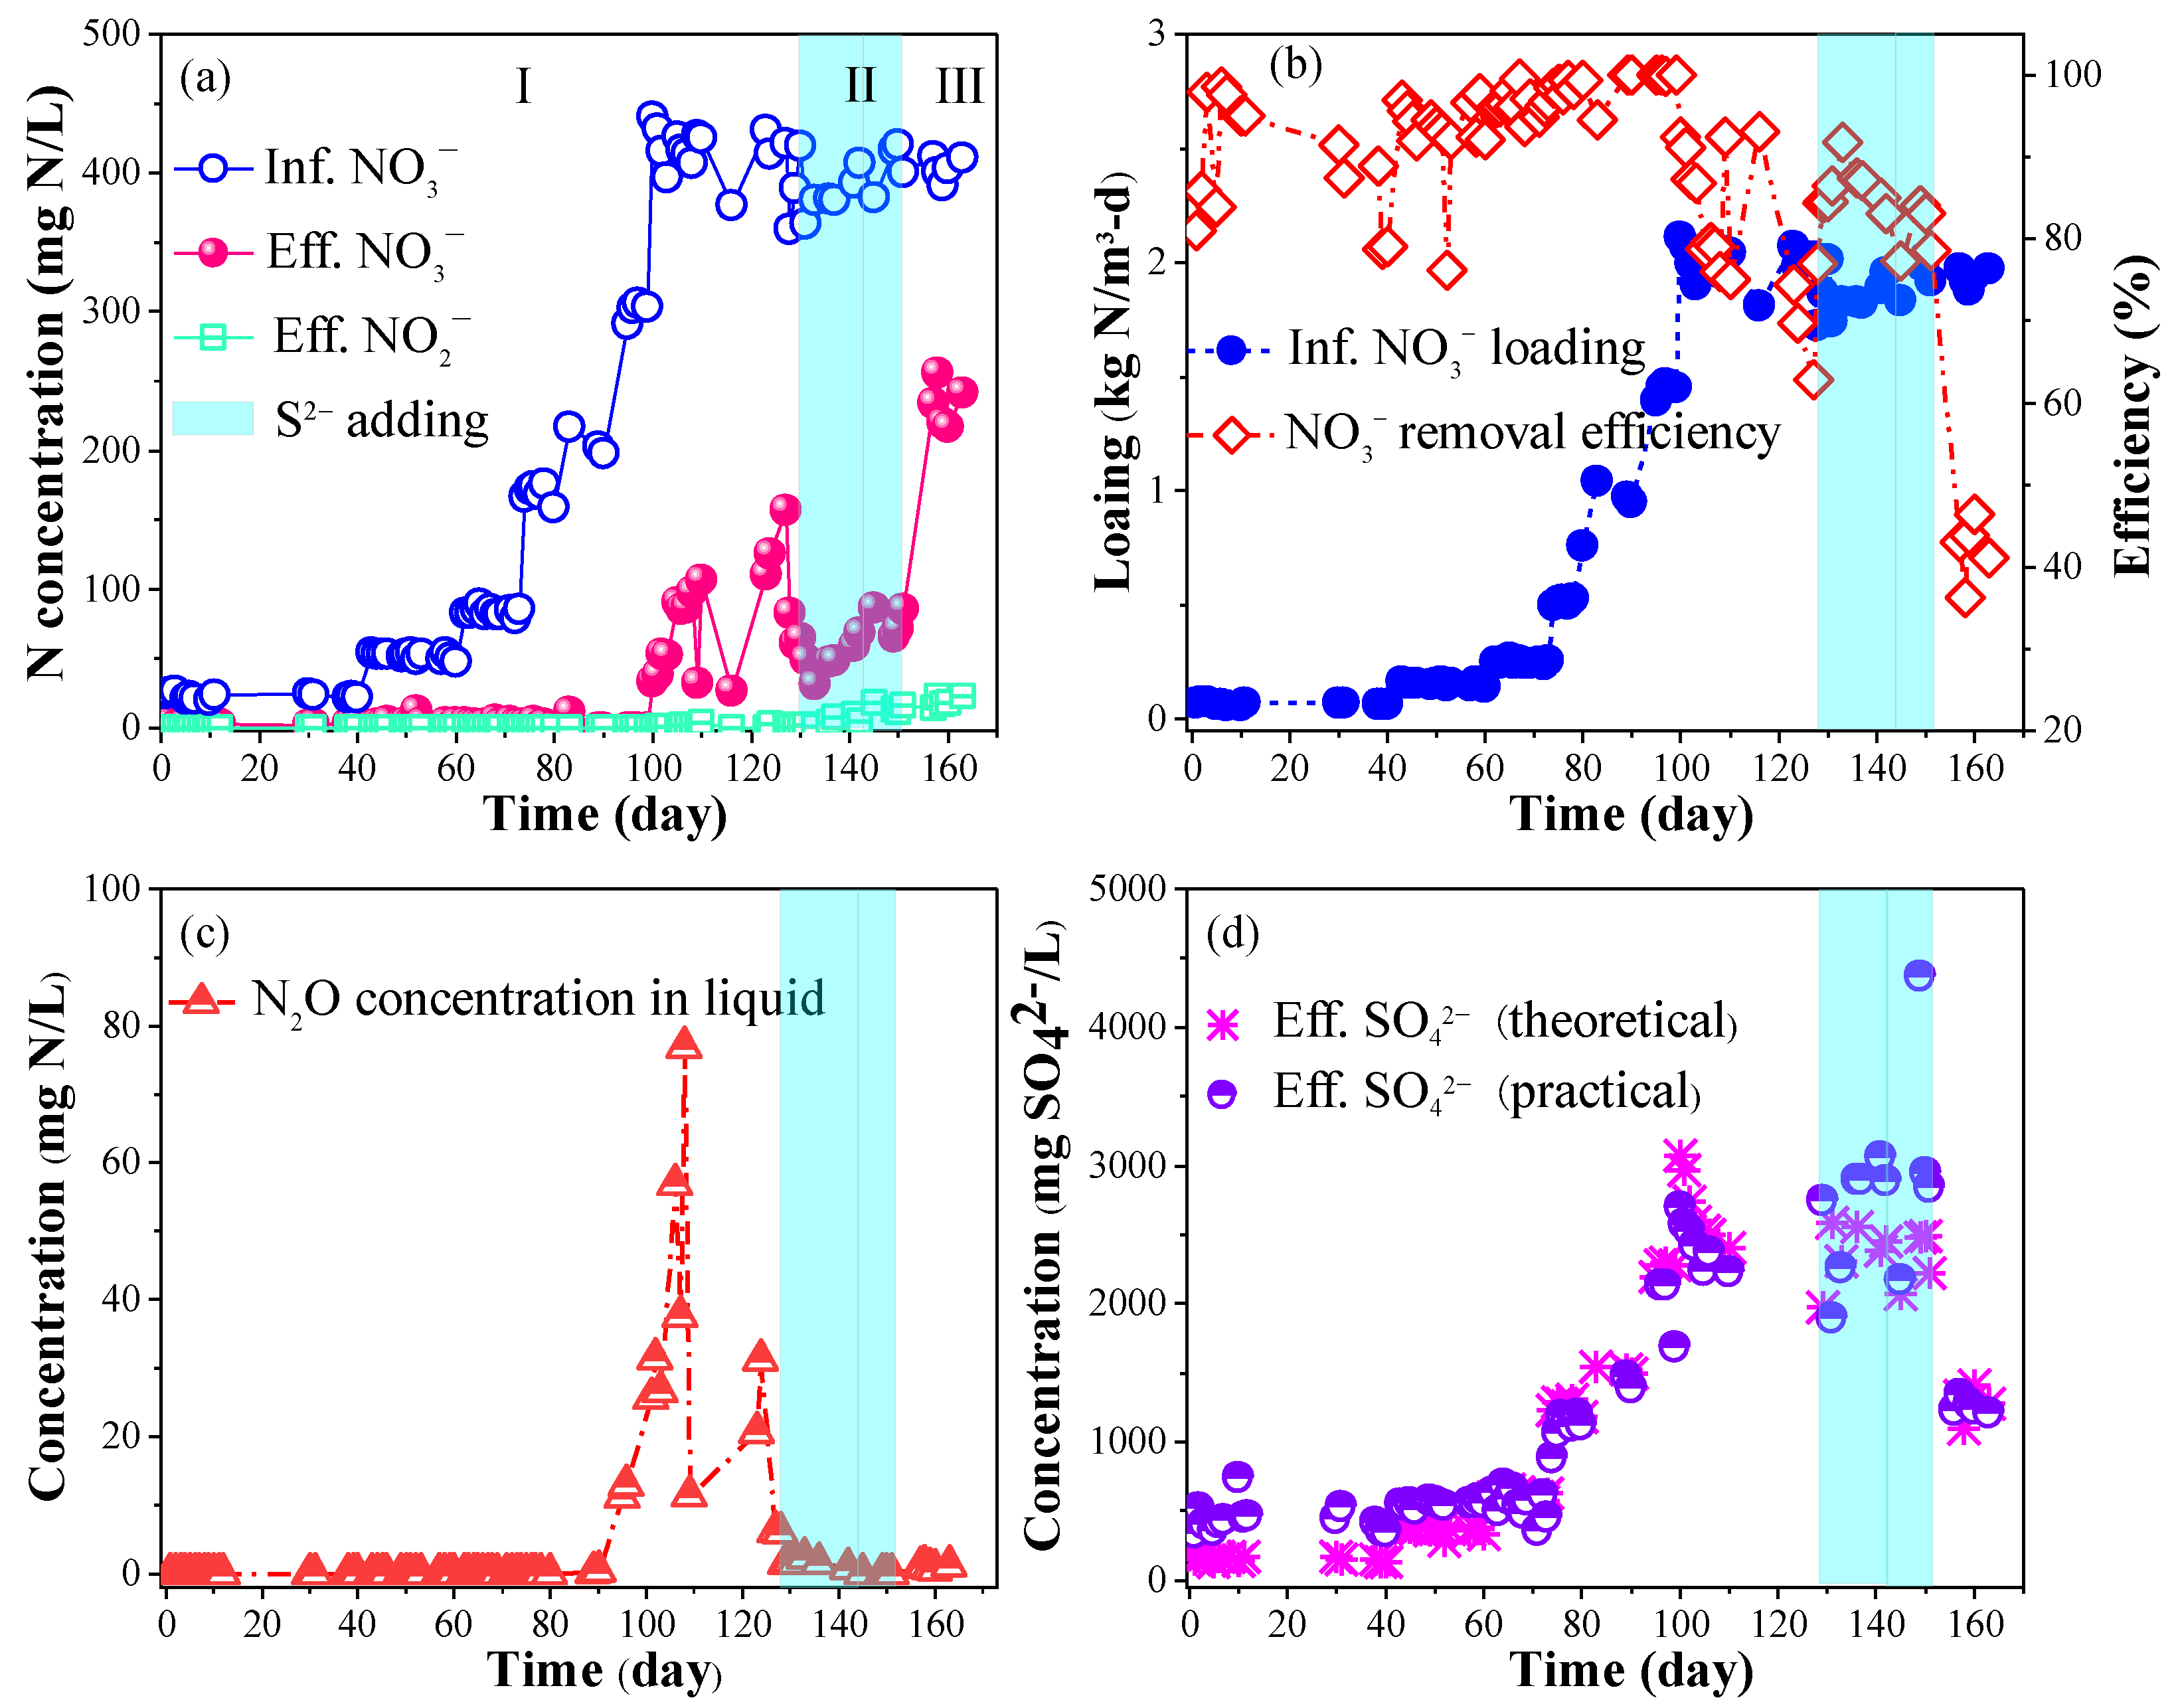
- Utilization of smaller S0 particles (0.5–1 mm) within the S0-PBR achieved a high volumetric loading rate of 1.44 kg NO3−-N/(m3·d) and a NO3− removal efficiency nearing 100%, significantly surpassing outcomes observed in S0-PBR employing larger S0 particles (2–16 mm);
- ♦
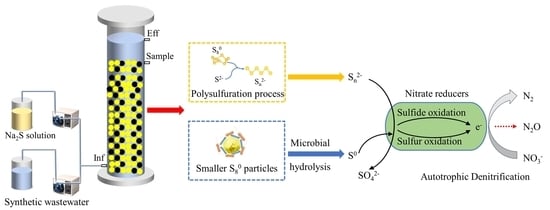
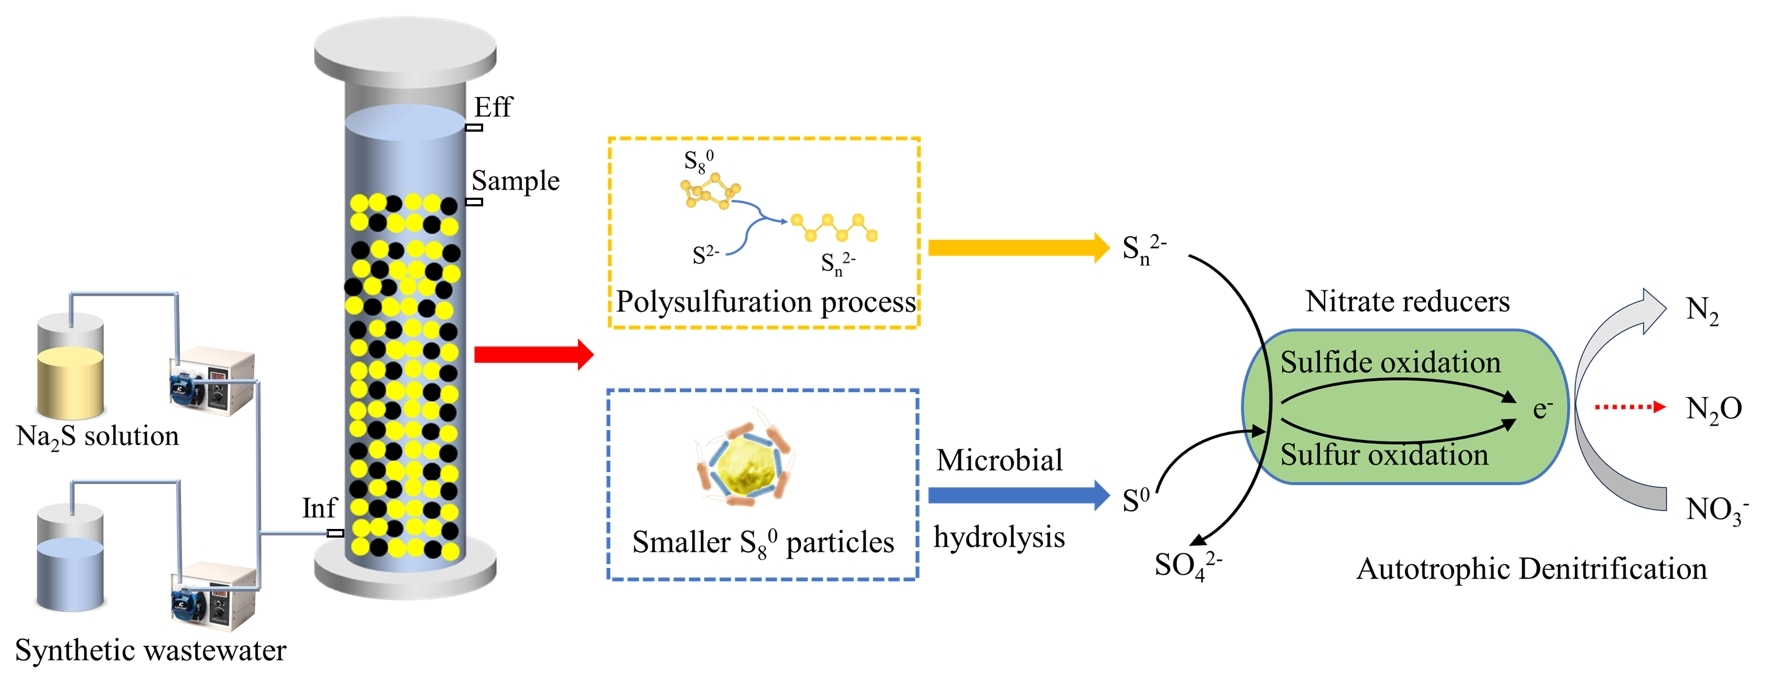
- The supplementation of 30 mg S2−-S/L in the S0-PBR led to an increase in NO3− removal efficiency from 81.3%% to 85.3% and facilitated a 93.8% reduction in N2O accumulation;
- ♦
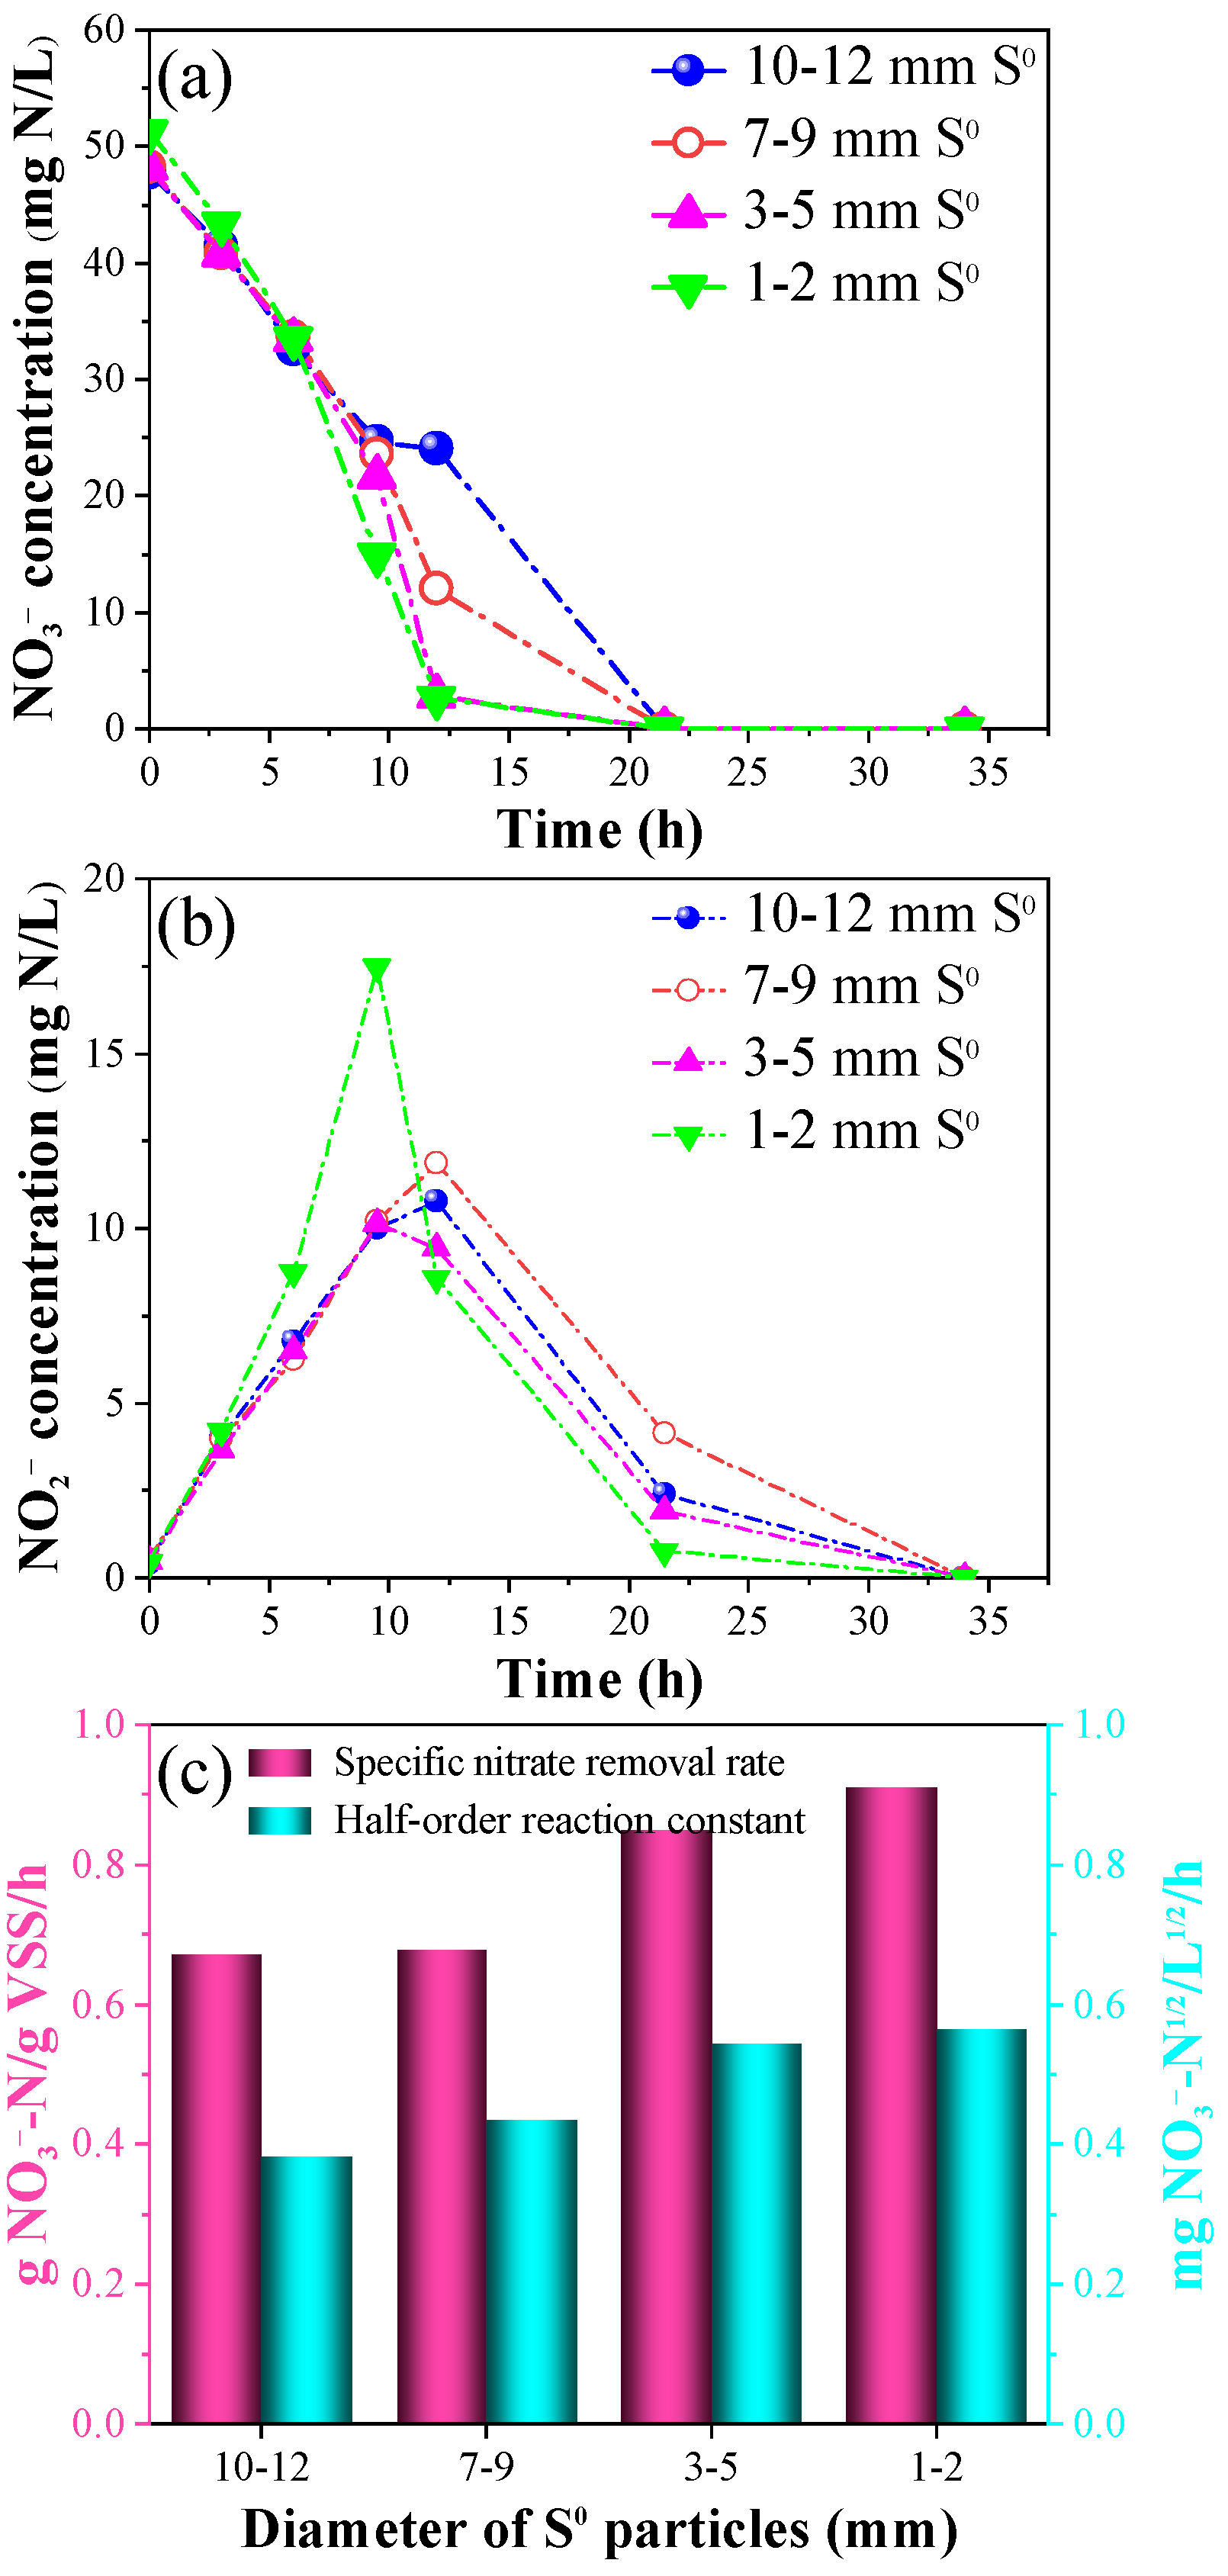
- In the batch tests with a S0 size of 10–12, 7–9, 3–5, and 1–2 mm applied, the average specific NO3− removal rates were 0.672 g NO3−-N/g VSS/h, 0.678 g NO3−-N/g VSS/h, 0.850 g NO3−-N/g VSS/h, and 0.910 g NO3−-N/g VSS/h, respectively, while the half-order kinetic constants were 0.382 mg-N1/2/L1/2/h, 0.435 mg-N1/2/L1/2/h, 0.545 mg-N1/2/L1/2/h, and 0.565 mg-N1/2/L1/2/h, respectively;
- ♦
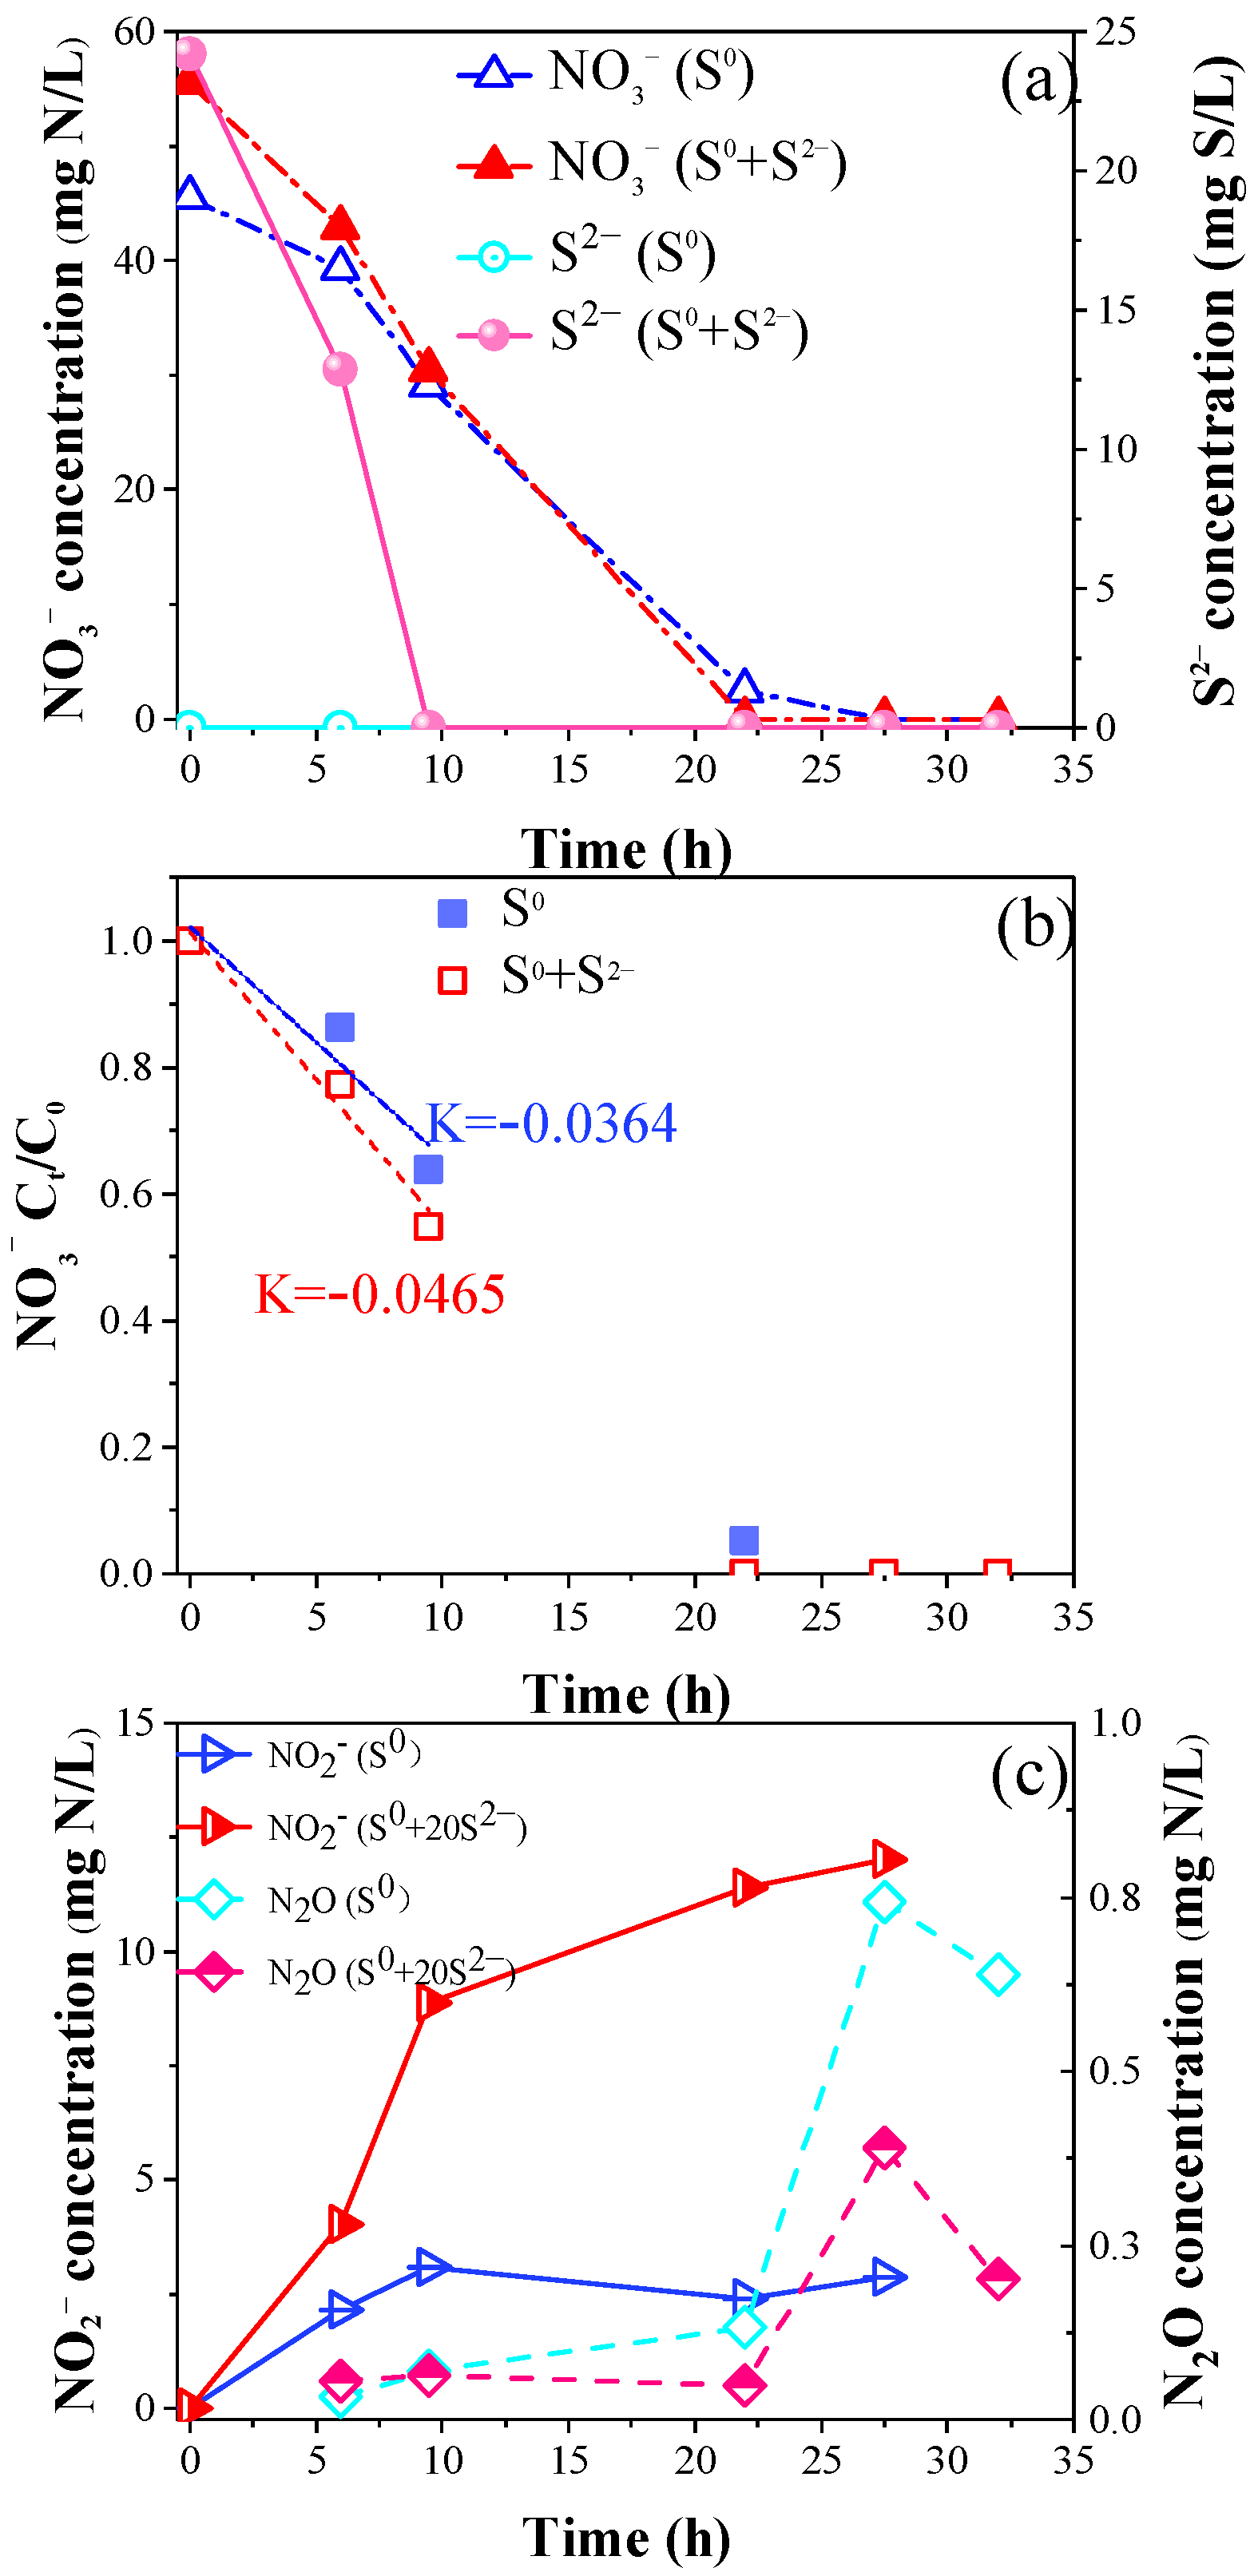
- The specific NO3− removal rates and NO3− consumption slope k in the S2−-added group were 0.557 g NO3−-N/g VSS/h and 0.0465, respectively, significantly higher than S2−-free group of 0.366 g NO3−-N/g VSS/h and 0.0364;
- ♦
- The 1.6% of removed NO3−-N was in the form of N2O within 27.5 h in the S2−-free group, while only 0.7% of the removed NO3−-N was produced as N2O in the S2−-added group.
Author Contributions
Funding
Data Availability Statement
Acknowledgments
Conflicts of Interest
References
- Liu, H.; Jiang, W.; Wan, D.; Qu, J. Study of a combined heterotrophic and sulfur autotrophic denitrification technology for removal of nitrate in water. J. Hazard. Mater. 2009, 169, 23–28. [Google Scholar] [CrossRef]
- Zhang, X.; Zhang, Y.; Shi, P.; Bi, Z.; Shan, Z.; Ren, L. The deep challenge of nitrate pollution in river water of China. Sci. Total Environ. 2021, 770, 144674. [Google Scholar] [CrossRef] [PubMed]
- Danni, S.O.; Bouchaou, L.; Elmouden, A.; Brahim, Y.A.; N’da, B. Assessment of water quality and nitrate source in the Massa catchment (Morocco) using δ 15N and δ 18O tracers. Appl. Radiat. Isot. 2019, 154, 108859. [Google Scholar] [CrossRef] [PubMed]
- Fields, S. Global Nitrogen: Cycling out of Control. Environ. Health Perspect. 2004, 112, A556–A563. [Google Scholar] [CrossRef]
- Della Rocca, C.; Belgiorno, V.; Meriç, S. Overview of in-situ applicable nitrate removal processes. Desalination 2007, 204, 46–62. [Google Scholar] [CrossRef]
- Panda, B.; Chidambaram, S.; Snow, D.; Malakar, A.; Singh, D.K.; Ramanathan, A.L. Source apportionment and health risk assessment of nitrate in foothill aquifers of Western Ghats, South India. Ecotoxicol. Environ. Saf. 2022, 229, 113075. [Google Scholar] [CrossRef] [PubMed]
- Sahinkaya, E.; Dursun, N. Sulfur-oxidizing autotrophic and mixotrophic denitrification processes for drinking water treatment: Elimination of excess sulfate production and alkalinity requirement. Chemosphere 2012, 89, 144–149. [Google Scholar] [CrossRef]
- Zumft, W.G. Cell biology and molecular basis of denitrification. Microbiol. Mol. Biol. Rev. 1997, 61, 533–616. [Google Scholar]
- Oh, S.E.; Yoo, Y.B.; Young, J.C.; Kim, I.S. Effect of organics on sulfur-utilizing autotrophic denitrification under mixotrophic conditions. J. Biotechnol. 2001, 92, 1–8. [Google Scholar] [CrossRef]
- Sierra-Alvarez, R.; Beristain-Cardoso, R.; Salazar, M.; Gómez, J.; Razo-Flores, E.; Field, J.A. Chemolithotrophic denitrification with elemental sulfur for groundwater treatment. Water Res. 2007, 41, 1253–1262. [Google Scholar] [CrossRef]
- Claus, G.N.; Kutzner, H.R. Physiology and kinetics of autotrophic denitrification by Thiobacillus denitrificans. Appl. Microbiol. Biotechnol. 1985, 22, 283–288. [Google Scholar] [CrossRef]
- Wiesmann, U. Biological nitrogen removal from wastewater. Adv. Biochem. Eng. Biotechnol. 1994, 51, 113–154. [Google Scholar]
- Lee, K.-C.; Rittmann, B.E. Applying a novel autohydrogenotrophic hollow-fiber membrane biofilm reactor for denitrification of drinking water. Water Res. 2002, 36, 2040–2052. [Google Scholar] [CrossRef]
- Batchelor, B.; Lawrence, A.W. Autotrophic denitrification using elemental sulfur. Water Pollut. Control Fed. 1978, 50, 1986–2001. [Google Scholar]
- Soares, M.I.M. Denitrification of groundwater with elemental sulfur. Water Res. 2002, 36, 1392–1395. [Google Scholar] [CrossRef]
- Wang, Y.; Bott, C.; Nerenberg, R. Sulfur-based denitrification: Effect of biofilm development on denitrification fluxes. Water Res. 2016, 100, 184–193. [Google Scholar] [CrossRef]
- Cui, Y.-X.; Biswal, B.K.; Guo, G.; Deng, Y.-F.; Huang, H.; Chen, G.-H.; Wu, D. Biological nitrogen removal from wastewater using sulphur-driven autotrophic denitrification. Appl. Microbiol. Biotechnol. 2019, 103, 6023–6039. [Google Scholar] [CrossRef]
- Peng, L.; Ni, B.-J.; Erler, D.; Ye, L.; Yuan, Z. The effect of dissolved oxygen on N2O production by ammonia-oxidizing bacteria in an enriched nitrifying sludge. Water Res. 2014, 66, 12–21. [Google Scholar] [CrossRef]
- Kostrytsia, A.; Papirio, S.; Frunzo, L.; Mattei, M.R.; Porca, E.; Collins, G.; Lens, P.N.L.; Esposito, G. Elemental sulfur-based autotrophic denitrification and denitritation: Microbially catalyzed sulfur hydrolysis and nitrogen conversions. J. Environ. Manag. 2018, 211, 313–322. [Google Scholar] [CrossRef]
- Florentino, A.P.; Weijma, J.; Stams, A.J.M.; Sánchez-Andrea, I. Ecophysiology and Application of Acidophilic Sulfur-Reducing Microorganisms. In Biotechnology of Extremophiles; Springer: Berlin/Heidelberg, Germany, 2016; pp. 141–175. [Google Scholar]
- Moraes, B.S.; Foresti, E. Determination of the intrinsic kinetic parameters of sulfide-oxidizing autotrophic denitrification in differential reactors containing immobilized biomass. Bioresour. Technol. 2012, 104, 250–256. [Google Scholar] [CrossRef] [PubMed]
- Batchelor, B.; Lawrence, A.W. A kinetic model for autotrophic denitrification using elemental sulfur. Water Res. 1978, 12, 1075–1084. [Google Scholar] [CrossRef]
- Dong, H.; Sun, Y.-L.; Sun, Q.; Zhang, X.-N.; Wang, H.-C.; Wang, A.-J.; Cheng, H.-Y. Effect of sulfur particle morphology on the performance of element sulfur-based denitrification packed-bed reactor. Bioresour. Technol. 2023, 367, 128238. [Google Scholar] [CrossRef]
- Koenig, A.; Liu, L.H. Kinetic model of autotrophic denitrification in sulfur packed-bed reactors. Water Res. 2001, 35, 1969–1978. [Google Scholar] [CrossRef] [PubMed]
- Moon, H.S.; Chang, S.W.; Nam, K.; Choe, J.; Kim, J.Y. Effect of reactive media composition and co-contaminants on sulfur-based autotrophic denitrification. Environ. Pollut. 2006, 144, 802–807. [Google Scholar] [CrossRef]
- Florentino, A.P.; Jan, W.; Stams, A.J.M.; Sánchez-Andrea, I. Sulfur Reduction in Acid Rock Drainage Environments. Environ. Sci. Technol. 2015, 49, 11746–11755. [Google Scholar] [CrossRef] [PubMed]
- Ucar, D.; Yilmaz, T.; Di Capua, F.; Esposito, G.; Sahinkaya, E. Comparison of biogenic and chemical sulfur as electron donors for autotrophic denitrification in sulfur-fed membrane bioreactor (SMBR). Bioresour. Technol. 2020, 299, 122574. [Google Scholar] [CrossRef]
- Wang, Y.; Sabba, F.; Bott, C.; Nerenberg, R. Using Kinetics and Modeling to Predict Denitrification Fluxes in Elemental-Sulfur Based Biofilms. Biotechnol. Bioeng. 2019, 116, 2698–2709. [Google Scholar] [CrossRef]
- Zhang, L.; Qiu, Y.-Y.; Zhou, Y.; Chen, G.-H.; van Loosdrecht, M.C.M.; Jiang, F. Elemental sulfur as electron donor and/or acceptor: Mechanisms, applications and perspectives for biological water and wastewater treatment. Water Res. 2021, 202, 117373. [Google Scholar] [CrossRef]
- Qiu, Y.-Y.; Zhang, L.; Mu, X.; Li, G.; Guan, X.; Hong, J.; Jiang, F. Overlooked pathways of denitrification in a sulfur-based denitrification system with organic supplementation. Water Res. 2020, 169, 115084. [Google Scholar] [CrossRef]
- Zhang, L.; Zhang, C.; Hu, C.; Liu, H.; Bai, Y.; Qu, J. Sulfur-based mixotrophic denitrification corresponding to different electron donors and microbial profiling in anoxic fluidized-bed membrane bioreactors. Water Res. 2015, 85, 422–431. [Google Scholar] [CrossRef]
- Qiu, Y.-Y.; Gong, X.; Zhang, L.; Zhou, S.; Li, G.; Jiang, F. Achieving a Novel Polysulfide-Involved Sulfur-Based Autotrophic Denitrification Process for High-Rate Nitrogen Removal in Elemental Sulfur-Packed Bed Reactors. ACS EST Eng. 2022, 2, 1504–1513. [Google Scholar] [CrossRef]
- Finster, K. Microbiological disproportionation of inorganic sulfur compounds. J. Sulfur Chem. 2008, 29, 281–292. [Google Scholar] [CrossRef]
- American Public Health Association (APHA); American Water Works Association (AWWA); Water Environment Federation (AEF). Standard Methods for the Examination of Water and Wastewater; American Public Health Association (APHA): Washington, DC, USA, 2005. [Google Scholar]
- Kleinjan, W.E.; de Keizer, A.; Janssen, A.J.H. Equilibrium of the reaction between dissolved sodium sulfide and biologically produced sulfur. Colloids Surf. B Biointerfaces 2005, 43, 228–237. [Google Scholar] [CrossRef]
- Zhang, L.; Zhang, Z.; Sun, R.; Liang, S.; Chen, G.-H.; Jiang, F. Self-accelerating sulfur reduction via polysulfide to realize a high-rate sulfidogenic reactor for wastewater treatment. Water Res. 2018, 130, 161–167. [Google Scholar] [CrossRef]
- Hao, W.; Li, Q.; Liu, P.; Han, J.; Duan, R.; Liang, P. A new inoculation method of sulfur autotrophic denitrification reactor for accelerated start-up and better low-temperature adaption. Sci. Total Environ. 2022, 823, 153657. [Google Scholar] [CrossRef]
- Yang, W.; Lu, H.; Khanal, S.K.; Zhao, Q.; Meng, L.; Chen, G.-H. Granulation of sulfur-oxidizing bacteria for autotrophic denitrification. Water Res. 2016, 104, 507–519. [Google Scholar] [CrossRef]
- Ruan, Y.-J.; Luo, G.-Z.; Tan, H.-X.; Che, X.; Jiang, Y.; Sun, D.-C. Nitrate and phosphate removal in sulphur-coral stone autotrophic denitrification packed-bed reactors. J. Environ. Eng. Sci. 2013, 8, 267–276. [Google Scholar] [CrossRef]
- Sadeq, M.; Moe, C.L.; Attarassi, B.; Cherkaoui, I.; ElAouad, R.; Idrissi, L. Drinking water nitrate and prevalence of methemoglobinemia among infants and children aged 1–7 years in Moroccan areas. Int. J. Hyg. Environ. Health 2008, 211, 546–554. [Google Scholar] [CrossRef]
- Chen, F.; Li, X.; Gu, C.; Huang, Y.; Yuan, Y. Selectivity control of nitrite and nitrate with the reaction of S0 and achieved nitrite accumulation in the sulfur autotrophic denitrification process. Bioresour. Technol. 2018, 266, 211–219. [Google Scholar] [CrossRef]
- Vavilin, V.A.; Fernandez, B.; Palatsi, J.; Flotats, X. Hydrolysis kinetics in anaerobic degradation of particulate organic material: An overview. Waste Manag. 2008, 28, 939–951. [Google Scholar] [CrossRef] [PubMed]
- Flere, J.M.; Zhang, T.C. Nitrate Removal with Sulfur-Limestone Autotrophic Denitrification Processes. J. Environ. Eng. 1999, 125, 721–729. [Google Scholar] [CrossRef]
- Lu, H.; Chandran, K. Factors promoting emissions of nitrous oxide and nitric oxide from denitrifying sequencing batch reactors operated with methanol and ethanol as electron donors. Biotechnol. Bioeng. 2010, 106, 390–398. [Google Scholar] [CrossRef]
- Sahu, A.; Conneely, T.; Nüsslein, K.; Ergas, S. Biological Perchlorate Reduction in Packed Bed Reactors Using Elemental Sulfur. Environ. Sci. Technol. 2009, 43, 4466–4471. [Google Scholar] [CrossRef]
- Wan, D.; Li, Q.; Liu, Y.; Xiao, S.; Wang, H. Simultaneous reduction of perchlorate and nitrate in a combined heterotrophic-sulfur-autotrophic system: Secondary pollution control, pH balance and microbial community analysis. Water Res. 2019, 165, 115004. [Google Scholar] [CrossRef]
- Guo, G.; Li, Z.; Chen, L.; Ling, Q.; Zan, F.; Isawi, H.; Hao, T.; Ma, J.; Wang, Z.; Chen, G.H.; et al. Advances in elemental sulfur-driven bioprocesses for wastewater treatment: From metabolic study to application. Water Res. 2022, 213, 118143. [Google Scholar] [CrossRef]
- Hijnen, W.; Bennekom, C.A.; Mijnarends, B.J. Optimization of the sulphur-limestone filtration process for nitrate removal from groundwater. Aqua 1992, 41, 209–218. [Google Scholar]
- Sun, Y.-L.; Zhai, S.; Qian, Z.-M.; Yi, S.; Zhuang, W.-Q.; Cheng, H.-Y.; Zhang, X.; Wang, A.-J. Managing Microbial Sulfur Disproportionation for Optimal Sulfur Autotrophic Denitrification in a Pilot-scale Elemental Sulfur Packed-bed Reactor. Water Res. 2023, 243, 120356. [Google Scholar] [CrossRef]
- Richardson, D.; Felgate, H.; Watmough, N.; Thomson, A.; Baggs, E. Mitigating release of the potent greenhouse gas N2O from the nitrogen cycle—Could enzymic regulation hold the key? Trends Biotechnol. 2009, 27, 388–397. [Google Scholar] [CrossRef]
- Yang, W.; Zhao, Q.; Lu, H.; Ding, Z.; Meng, L.; Chen, G.-H. Sulfide-driven autotrophic denitrification significantly reduces N2O emissions. Water Res. 2016, 90, 176–184. [Google Scholar] [CrossRef]
- Liu, Y.; Peng, L.; Ngo, H.; Guo, W.; Wang, D.-B.; Pan, Y.; Sun, J.; Ni, B.-J. Evaluation of Nitrous Oxide Emission from Sulfide- and Sulfur-Based Autotrophic Denitrification Processes. Environ. Sci. Technol. 2016, 50, 9407–9415. [Google Scholar] [CrossRef] [PubMed]
- Lin, S.; Mackey, H.; Hao, T.; Guo, G.; Loosdrecht, M.; Chen, G.H. Biological Sulfur Oxidation in Wastewater Treatment: A Review of Emerging Opportunities. Water Res. 2018, 143, 399–415. [Google Scholar] [CrossRef] [PubMed]
- Beristain-Cardoso, R.; Sierra-Alvarez, R.; Rowlette, P.; Razo-Flores, E.; Gomez, J.; Field, J. Sulfide oxidation under chemolithoautotrophic denitrifying conditions. Biotechnol. Bioeng. 2006, 95, 1148–1157. [Google Scholar] [CrossRef]
- Lu, H.; Huang, H.; Yang, W.; Mackey, H.; Khanal, S.; Wu, D.; Chen, G.-H. Elucidating the stimulatory and inhibitory effects of dissolved sulfide on sulfur-oxidizing bacteria (SOB) driven autotrophic denitrification. Water Res. 2018, 133, 165–172. [Google Scholar] [CrossRef]
- Huang, S.; Yu, D.; Chen, G.; Wang, Y.; Tang, P.; Liu, C.; Tian, Y.; Zhang, M. Realization of nitrite accumulation in a sulfide-driven autotrophic denitrification process: Simultaneous nitrate and sulfur removal. Chemosphere 2021, 278, 130413. [Google Scholar] [CrossRef]
- An, S.; Tang, K.; Nemati, M. Simultaneous biodesulphurization and denitrification using an oil reservoir microbial culture: Effects of sulphide loading rate and sulphide to nitrate loading ratio. Water Res. 2010, 44, 1531–1541. [Google Scholar] [CrossRef]
- Zhou, Z.; Xing, C.; An, Y.; Hu, D.; Qiao, W.; Wang, L. Inhibitory effects of sulfide on nitrifying biomass in the anaerobic–anoxic–aerobic wastewater treatment process. J. Chem. Technol. Biotechnol. 2014, 89, 214–219. [Google Scholar] [CrossRef]
- Di Capua, F.; Pirozzi, F.; Lens, P.N.L.; Esposito, G. Electron donors for autotrophic denitrification. Chem. Eng. J. 2019, 362, 922–937. [Google Scholar] [CrossRef]
- Bao, H.-X.; Li, Z.-R.; Song, Z.-B.; Wang, A.-J.; Zhang, X.-N.; Qian, Z.-M.; Sun, Y.-L.; Cheng, H.-Y. Mitigating nitrite accumulation during S0-based autotrophic denitrification: Balancing nitrate-nitrite reduction rate with thiosulfate as external electron donor. Environ. Res. 2022, 204, 112016. [Google Scholar] [CrossRef]
- Esposito, G.; Frunzo, L.; Panico, A.; Pirozzi, F. Modelling the effect of the OLR and OFMSW particle size on the performances of an anaerobic co-digestion reactor. Process Biochem. 2011, 46, 557–565. [Google Scholar] [CrossRef]
- Kostrytsia, A.; Papirio, S.; Mattei, M.; Frunzo, L.; Lens, P.N.L.; Esposito, G. Sensitivity analysis for an elemental sulfur-based two-step denitrification model. Water Sci. Technol. 2018, 78, 1296–1303. [Google Scholar] [CrossRef] [PubMed]
- Qi, X.; Han, J.; Kou, Z.; Liang, P. Supplementary sulfide during inoculation for improved sulfur autotrophic denitrification performance and adaptation to low temperature. Sci. Total Environ. 2023, 900, 166365. [Google Scholar] [CrossRef] [PubMed]
- Bao, H.-X.; Wang, H.-L.; Wang, S.-T.; Sun, Y.-L.; Zhang, X.-N.; Cheng, H.-Y.; Qian, Z.-M.; Wang, A.-J. Response of sulfur-metabolizing biofilm to external sulfide in element sulfur-based denitrification packed-bed reactor. Environ. Res. 2023, 231, 116061. [Google Scholar] [CrossRef] [PubMed]
- Zhou, W.; Liu, X.; Dong, X.; Wang, Z.; Yuan, Y.; Wang, H.; He, S. Sulfur-based autotrophic denitrification from the micro-polluted water. J. Environ. Sci. 2016, 44, 180–188. [Google Scholar] [CrossRef] [PubMed]
- Pokorna, D.; Zabranska, J. Sulfur-oxidizing bacteria in environmental technology. Biotechnol. Adv. 2015, 33, 1246–1259. [Google Scholar] [CrossRef]


| Stages | Stage I | Stage II | Stage III |
|---|---|---|---|
| NO3−-N (mg/L) | 20–400 | 400 | 400 |
| HRT (h) | 8–5 | 5 | 5 |
| Loading (kg NO3−-N/(m3·d)) | 0.06–1.92 | 1.92 | 1.92 |
| S2− (mg S/L) | - | 30–50 | - |
Disclaimer/Publisher’s Note: The statements, opinions and data contained in all publications are solely those of the individual author(s) and contributor(s) and not of MDPI and/or the editor(s). MDPI and/or the editor(s) disclaim responsibility for any injury to people or property resulting from any ideas, methods, instructions or products referred to in the content. |
© 2024 by the authors. Licensee MDPI, Basel, Switzerland. This article is an open access article distributed under the terms and conditions of the Creative Commons Attribution (CC BY) license (https://creativecommons.org/licenses/by/4.0/).
Share and Cite
Xu, J.; Lu, Z.; Xu, Y.; Liang, C.; Peng, L. Improved Performance of Sulfur-Driven Autotrophic Denitrification Process by Regulating Sulfur-Based Electron Donors. Water 2024, 16, 730. https://doi.org/10.3390/w16050730
Xu J, Lu Z, Xu Y, Liang C, Peng L. Improved Performance of Sulfur-Driven Autotrophic Denitrification Process by Regulating Sulfur-Based Electron Donors. Water. 2024; 16(5):730. https://doi.org/10.3390/w16050730
Chicago/Turabian StyleXu, Jiang, Zhikun Lu, Yifeng Xu, Chuanzhou Liang, and Lai Peng. 2024. "Improved Performance of Sulfur-Driven Autotrophic Denitrification Process by Regulating Sulfur-Based Electron Donors" Water 16, no. 5: 730. https://doi.org/10.3390/w16050730