Article

Study on the Influence of Water Erosion on the Bearing Capacity and Function of the High Pile Foundation of the Wharf

1
College of Water Conservancy Engineering, Wanjiang University of Technology, Ma’anshan 243031, China
2
Wanjiang University of Technology Engineering Technology Research Center for Port Construction Optimization and Waterway Regulation Upgrading, Ma’anshan 243031, China
*
Author to whom correspondence should be addressed.
Water 2024, 16(4), 606; https://doi.org/10.3390/w16040606
Submission received: 9 January 2024 / Revised: 4 February 2024 / Accepted: 5 February 2024 / Published: 18 February 2024
(This article belongs to the Special Issue Effects of Groundwater and Surface Water on the Natural Geo-Hazards)

Abstract

:
High-pile foundation is a common form of deep foundation commonly used in ocean environments, such as docks and bridge sites. Aiming at the problem of bearing capacity of high pile foundations, this paper proposes the calculation of bearing capacity and the analysis of scour depth of high pile foundations under the action of scour based on the modified p-y curve. In this paper, three kinds of scour mechanisms—natural evolution scour, general scour, and local scour—are described; and the calculation methods of scour widely used at present are compared and analyzed. The solution of the vertical stress of soil around the pile under local scour is solved and applied to the β method to solve the lateral resistance of the pile under local scour. The local erosion is equivalent to the whole erosion, and the expression of the ultimate soil resistance before and after the equivalent is calculated, respectively, according to the principle that the ultimate soil resistance at a certain point above the equivalent pile end remains unchanged. The distance from the equivalent soil surface to the pile end can be obtained simultaneously, and then the equivalent erosion depth, p-y curve of sand at different depths, and high pile bearing capacity can be obtained. Finally, it is found that the bending moment of a single pile body varies along the pile body in the form of a parabola, and the maximum bending moment of the pile body is below the mud surface and increases with the increase in horizontal load. When the scouring depth is 30 m, the horizontal load is 25 KN, and the maximum bending moment of the pile body is about 150 N·m. The data with a relative error greater than 10% accounted for only 16.6% of the total data, and the error between the calculated value and the measured value was small. The formula can predict the erosion depth more accurately.

1. Introduction

As a common form of deep foundation, high pile foundation is widely used in complex and difficult projects such as wharves, cross-sea Bridges, and viaducts of high-speed railway lines in Marine environments due to its good seismic performance, strong adaptability, and high bearing capacity [1]. The ratio of length to slenderness of a high pile foundation is much larger than that of a short, rigid pile, which is more prone to instability or large deformation under the action of a dynamic load, thus leading to the destruction of the pile foundation and superstructure. Erosion reduces the strength and stiffness of the pile-soil system, which is one of the main reasons for the failure of high-pile foundation structures. Due to geological deposition and other reasons, the soil layer has natural layered characteristics, and the physical characteristics of each layer of foundation soil are often different, so the influence of foundation soil stratification on the internal force and deformation of lateral loaded piles cannot be ignored [2]. However, the high pile foundation not only has to bear the reciprocating horizontal load related to the upper loosening but is also affected by the pile-soil dynamic interaction related to the soil characteristics, which may cause a complex dynamic response under the lateral excitation of the pile top. Furthermore, it is important to consider the impact of water-related disasters, such as floods and tidal actions, on the stability and safety of high-pile foundations. Particularly in riverine and marine environments, variations in water flow intensity and direction can cause soil erosion around the pile foundations, thereby increasing the risk of structural failure [3,4,5,6].
At present, Li, W et al. studied the vertical bearing traits and load switch mechanism of pile basis passing via karst caves at exclusive heights when the backfilling approach was once used to heal karst caves and proposed the variant regulation of the worst friction resistance of pile facet and its varied ratio precipitated via backfilling substances at special cave tiers [7]. Aiming at the hassle of poor friction resistance of pile basis in collapsible loess area, JSA do Carmo proposed a crawler pile that can no longer solely limit bad friction resistance of pile side but additionally enlarge wonderful friction resistance and mentions its shape and working principles [8]. On the groundwork of a comparative study about the self-balancing pile, take a look at the technique and the normal vertical compression static load, and take a look at the approach of a single pile. The impact of soil displacement around the pinnacle pile in the check pile in the sandy soil vicinity on the agreement trade of the pile give-up is studied, and the current conversion approach for finding out the bearing capability of self-balancing is multiplied by the pile [9]. Zhao Shuang et al. studied the cumulative traits of the inclined single pile below cyclic masses such as wind, wave, and ocean current, embedded the sand stiffness attenuation mannequin into the finite factor mannequin of the pile-soil machine through a user-developed subprogram to recognize numerical evaluation of the cyclic load traits of a single pile, and studied the deformation accumulation regulation of the inclined single pile underneath extraordinary cyclic amplitudes and cycles [10].
When water flows through the wharf, it is hindered by multiple pile groups, and the flow changes, which causes the water flow structure around the wharf pile groups to change sharply. After the completion of the wharf, the changes in the flow field mainly focus on the vicinity of the pile group; the velocity in the area of the pile group decreases significantly; the velocity gradient near the pile group changes greatly; the velocity increases slightly away from the pile group; the velocity change affects the pile far; and the local flow pattern around the pile group will appear, forming a vortex downstream of the pile [7,8]. According to the research of Tang Shifang et al. [9], due to the resistance of the pile foundation of the wharf, the velocity along the wharf gradually attenuates from a distance to the direction in front of the wharf, and cross-flow occurs at the front of the wharf. The cross-flow velocity fluctuates, and the cross-flow disappears after a certain distance. When the middle velocity of the pile foundation is large, there will be a vortex in the middle. The maximum velocity vertical line at the interface between the pile group area and the non-pile group area is 0.2 times the water depth [10]. After the completion of the pier, the turbulence intensity in the longitudinal and transverse channels is similar, while the vertical turbulence intensity is quite small.
Therefore, considering the influence of hydrodynamics on pile foundations is crucial. For instance, rapid water flows caused by floods and extreme weather events can exert additional lateral pressure on pile foundations, exacerbating soil erosion and, consequently, affecting the stability of the entire pile foundation structure [11,12,13,14]. Based on the modified p-y curve, the bearing capacity calculation and erosion depth analysis of high pile foundations under erosion are presented in this paper. In this paper, three kinds of scour mechanisms—natural evolution scour; general scour; and local scour—are described; and the calculation methods of scour widely used at present are compared and analyzed. Among these, the general erosion calculation technique based on the sediment transport balance principle may more accurately capture the impact of the key factors involved in flow and sediment movement. The approach to solving the lateral resistance of the pile under local scour is based on the solution of the vertical tension of soil around the pile under local scour. The expression of the ultimate soil resistance before and after the equivalent is computed accordingly, using the premise that the ultimate soil resistance at a certain location above the equivalent pile end stays unaltered. Local erosion is comparable to total erosion. The distance from the equivalent soil surface to the pile end can be obtained simultaneously, and then the equivalent erosion depth, p-y curve of sand at different depths, and high pile bearing capacity can be obtained.

2. Materials and Methods

2.1. Wave Load and Scour Depth Calculation

In this section, three types of scour mechanisms, namely, naturally evolving scour, general scour, and local scour, are described, and the widely used scour calculation methods are compared and analyzed. The general scour calculation method based on the principle of sediment transport balance can more comprehensively reflect the influence of the main parameters involved in flow and sediment movement.

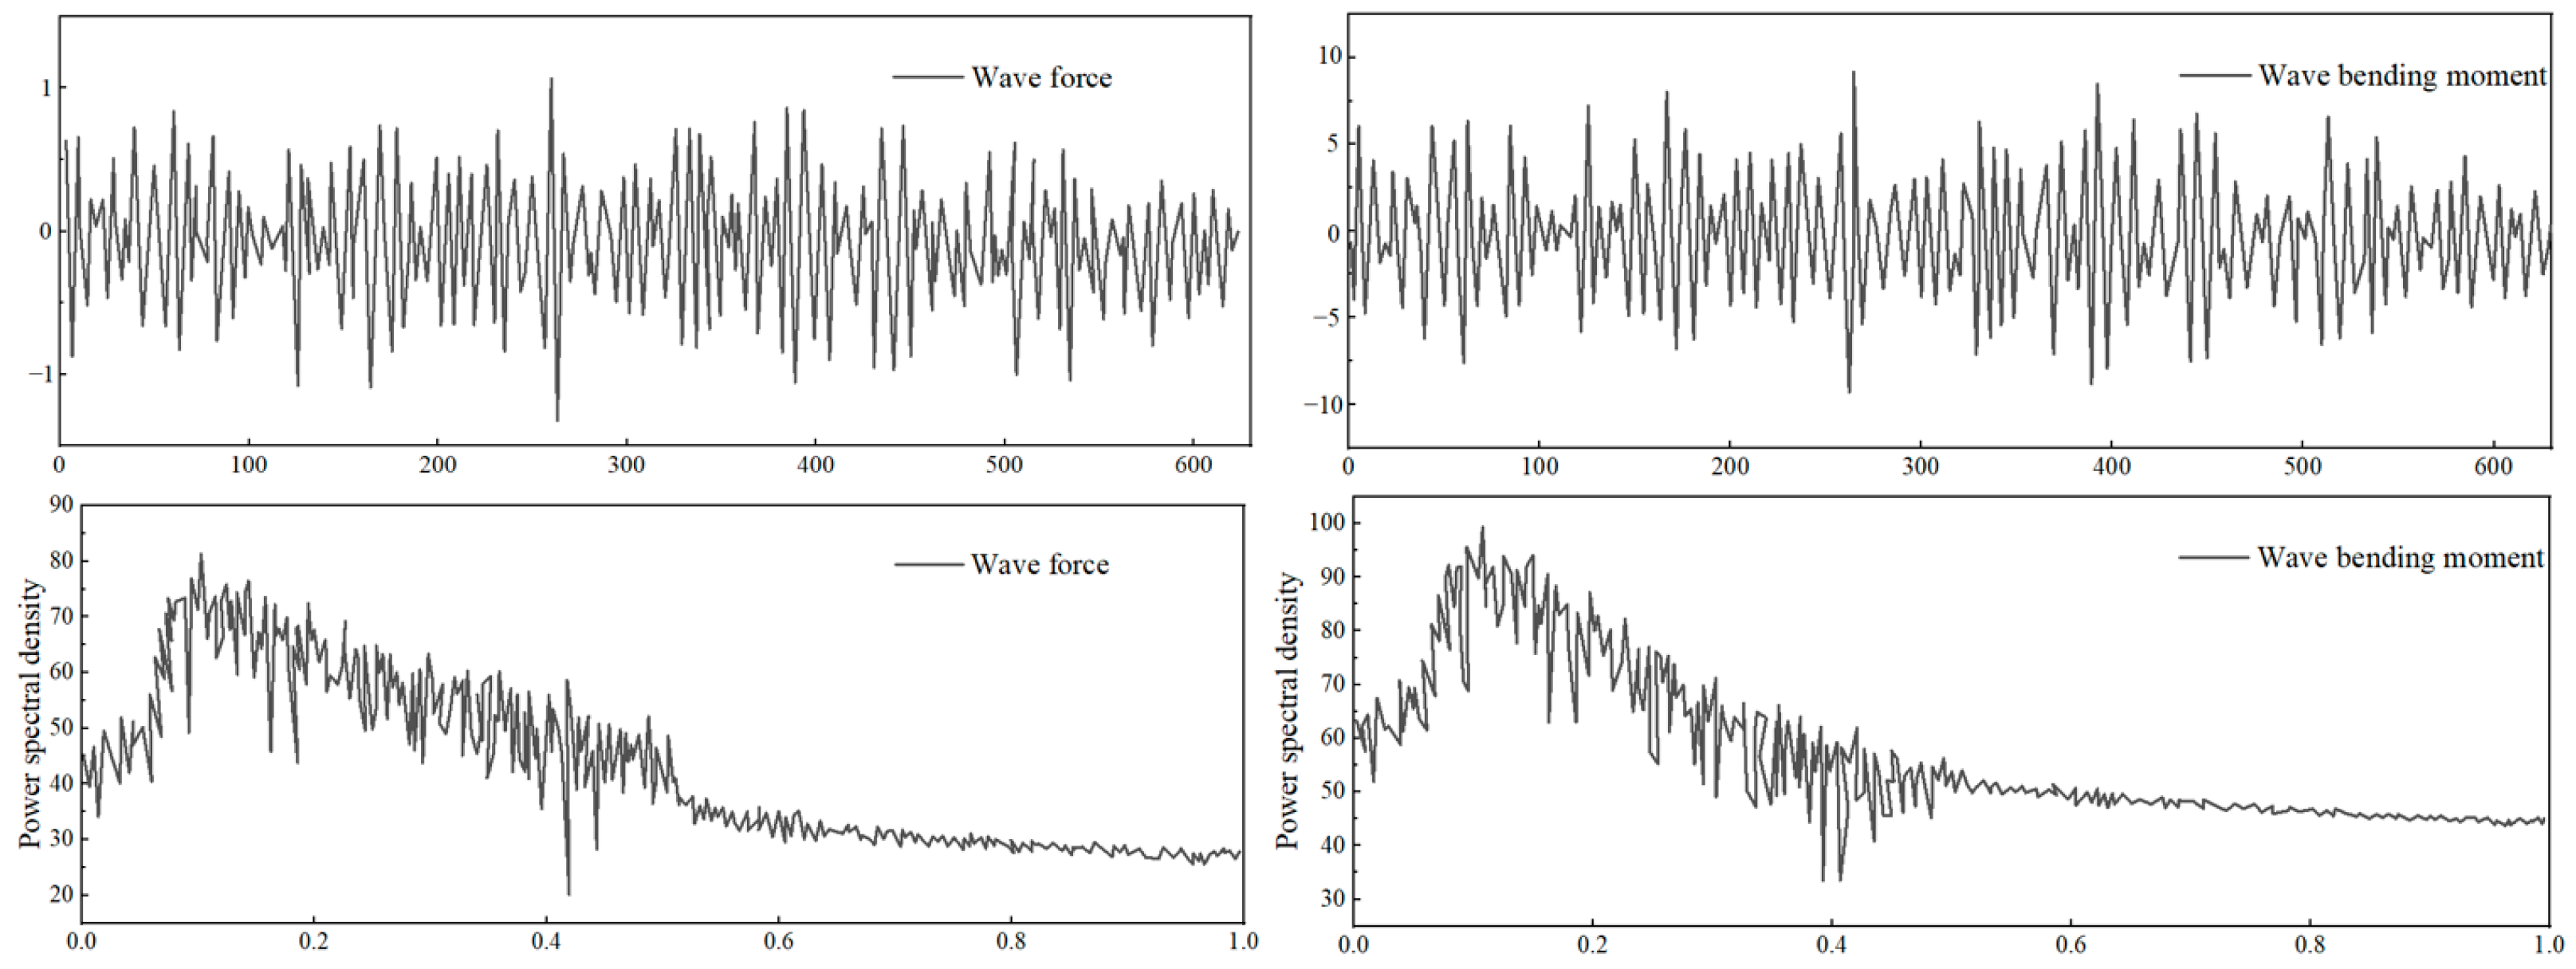
2.1.1. Wave Load Calculation

Before calculating the wave load, it is necessary to choose a suitable wave theory. At present, there are two mainstream wave theories: Airy linear wave theory and Stokes wave theory. Both wave theories are described based on the Lagrange method in fluid mechanics, which focuses on the motion of fluid particles [15]. Among them, the Airy linear wave theory is suitable for the region less affected by the topography, and the calculation is convenient. Stokes wave theory is suitable for the region affected by the topography, and it is relatively difficult to solve. The water depth in this paper is 20 m, and it is assumed that the sea bed is horizontal. Therefore, the Airy linear wave theory was adopted for solving.
Based on Airy’s wavefront equation, the velocity potential function can be expressed as follows:
Φ = g a ω cosh k ( z + d ) cosh k d sin ( k x ω t )
By substituting the velocity potential function into the boundary conditions, the dispersion relation can be obtained.
ω 2 = g k t a n h k d
According to the relationship between velocity, the velocity potential function, and the dispersion relation, the velocity field of wave motion can be obtained as [16].
u x = π H T cosh k ( z + d ) sinh k d cos ( k x ω t )
u z = π H T sinh k ( z + d ) sinh k d sin ( k x ω t )
The acceleration of the water quality point is:
a x = u x t = 2 π 2 H T 2 cosh k ( z + d ) sinh k d sin ( k x ω t )
a z = u z t = 2 π 2 H T 2 sinh k ( z + d ) sinh k d cos ( k x ω t )
where alpha is the amplitude. K is the wave number. W is the circular frequency of the wave. G is the gravitational acceleration. D is the water depth. T is the period of the wave.
The wavelengths of the three wave loads involved in this paper are 116.39 m, 122.74 m, and 141.50 m, respectively, and the values of D/L are 0.052, 0.049, and 0.042, respectively. In Marine engineering, components with a ratio of transverse dimension D to wavelength L less than 0.2 are usually called small-diameter piles [17]. The current standard methodology for calculating the wave force of small-diameter piles is the Morison equation. It is a semi-empirical and semi-theoretical method based on flow theory. Assume that a pile is perched upright on the seafloor with a water depth of h, that an incident wave of height H is propagating in the positive direction of the X-axis, and that the coordinate origin is located at the intersection of the pile’s central axis and the static water surface.
Horizontal drag force expression.
f D = 1 2 C D ρ A u | u |
Because the existence of the pile makes the water body in the space occupied by the pile change from being in wave motion to being stationary, a horizontal inertial force will be generated on the column [18]. Its size is equal to the mass of this part of the water body multiplied by the acceleration. Since the acceleration of each point in this part of the water body is different, the acceleration of the water body at the central axis of the pile body is taken to represent the average acceleration of this part of the water body. In addition to the water body occupied by the pile itself, there is also a part of the water body near the pile that will change speed, and the mass of this part of the water body is called the additional water mass, so the mass acting on the pile should be multiplied by a mass coefficient, that is, the inertia force coefficient [19]. Therefore, the inertial force on the pile per unit height can be expressed as
f I = C M ρ Δ V u t = C M ρ π D 2 4 u t
where CM is the dynamic inertia force coefficient. Ρ is the water flow density. D is the cross-section diameter of the pile.
In summary, the total wave force acting on the unit pile height at z under the water surface of the upright pile body is:
f H = f D + f I = 1 2 C D ρ A u | u | + C M ρ π D 2 4 u t
The linear wave superposition method and filter method are often used to simulate irregular waves. The former has a clear concept and a simple method. Therefore, this paper adopts the linear wave superposition method to calculate irregular waves, which believes that ocean waves are obtained by the accumulation of multiple cosine waves with different important parameters [20].
In this paper, the P-M two-parameter spectrum is used to simulate ocean waves, and the wave surface elevation can be expressed as follows:
η ( t ) = i = 1 m 2 S η η ω ^ ı Δ ω i cos ω ^ l t + ε i
The wave force and spectrum diagram are shown in Figure 1, from which we can find that the frequency of the wave load is mainly concentrated at [0, 0.2 Hz].

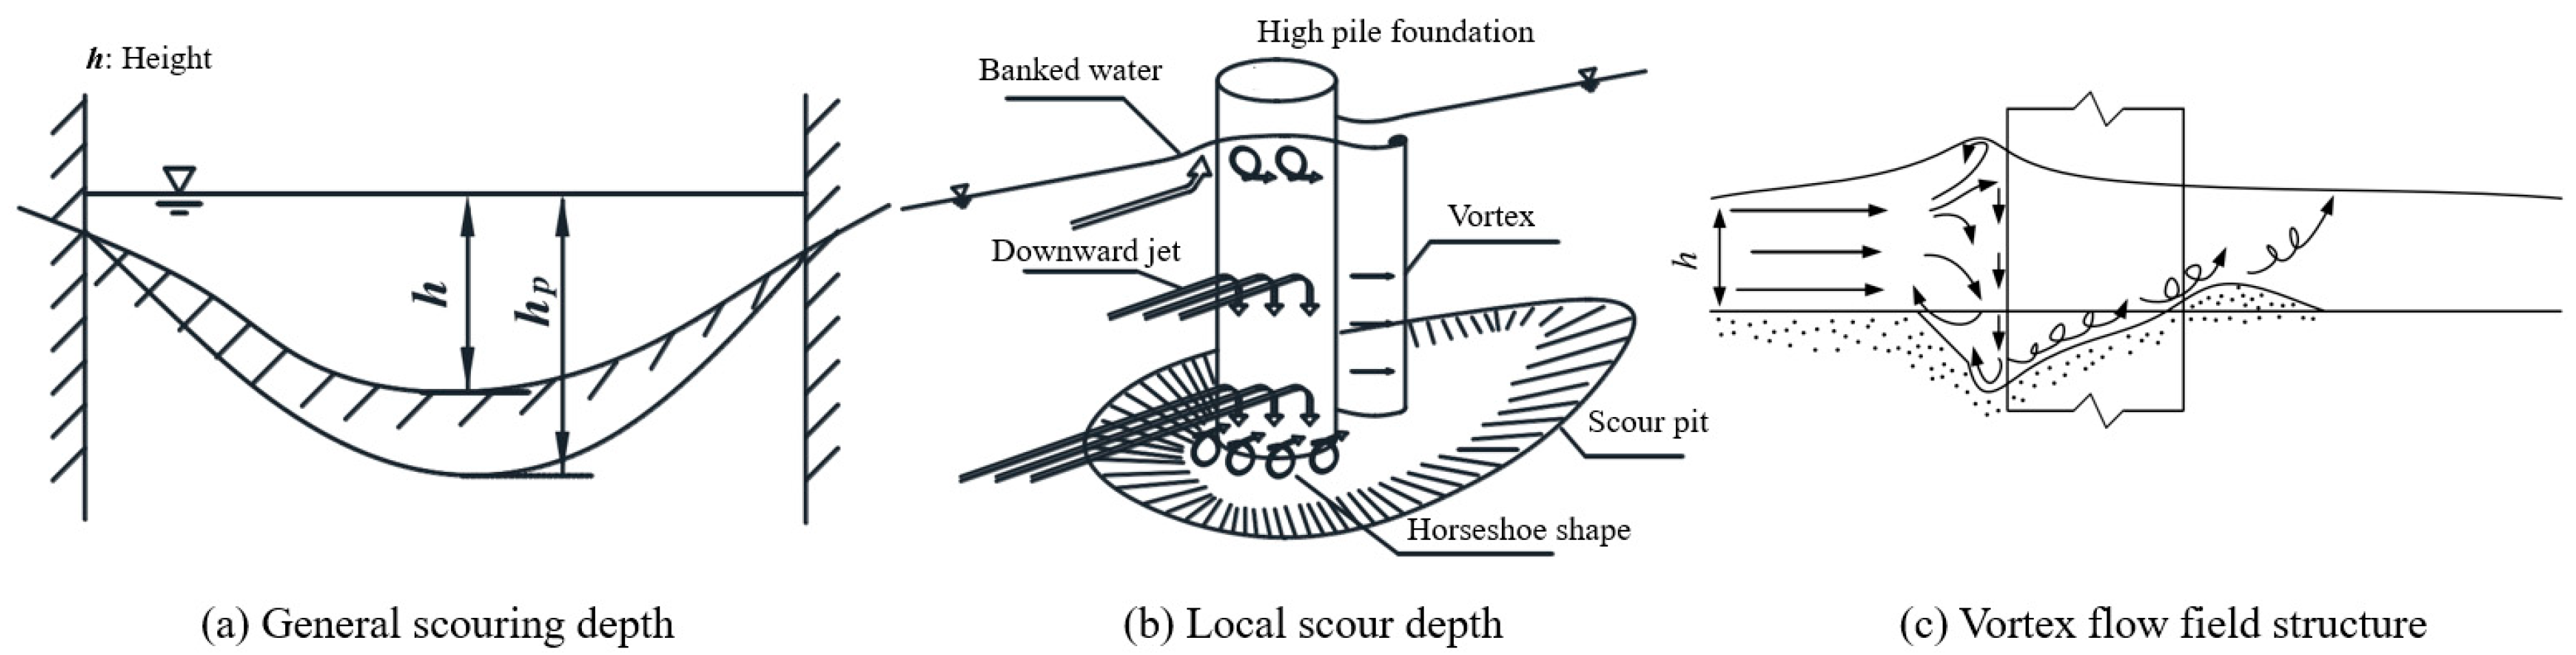
2.1.2. Scour Mechanism

Generally, the erosion is caused by the reduction of the underpass section caused by the newly built bridge, and the sand carrying capacity of the water flow increases to a certain extent with the increase in the flow velocity, thus resulting in the overall decrease of the riverbed elevation in the underpass section [21]. With the dynamic development of general erosion, the cross-section under the bridge gradually increases after the river bed elevation drops, and the sediment-carrying capacity of the flow returns to a lower level with the decrease in flow velocity. When there is a new equilibrium state of sand transport or when the flow speed under the bridge decreases to the flushing velocity, the general flushing will stop. At this time, the maximum vertical water depth from the design water level to the flushing line is called the general flushing depth, as shown in Figure 2a.
The bridge structure in the river is not only subjected to the general erosion of the section under the bridge but also to the local erosion around the pier, which is especially strong during the flood [22]. Local scour is a phenomenon in which the soil around the bridge pier is eroded due to the complicated vortex flow field structure caused by the water flow blocking near the bridge pier. When local scouring stops, the maximum equilibrium depth of the scouring pit is called the local scouring depth, as shown in Figure 2b.
When water flows near the pier, the vortex flow field structure generated around the pier is shown in Figure 2c. As can be seen from the figure, part of the water flow impacts the bridge, and the other part flows around the pier side. When the water hits the pier, the upflowing water creates a surge height in front of the pier, while the downflowing water forms a vortex at the bottom of the river that is opposite to its flow direction [23]. When the water flows around the pier side, it forms horseshoe eddies and wake eddies on the bottom of the river bed and continuously develops towards the surface of the water. Therefore, the pier began to appear as a local erosion pit under the action of the complex vortex flow field structure. With the gradual increase in the scale of the local scour pit, the sediment-carrying capacity of the water flow is weakened, and the soil coarsening phenomenon occurs at the bottom of the pit. When the soil anti-scour ability increases to be able to balance with the scouring action of the water flow, the local scour stops.
The interaction mechanism between water flow and sediment around the pile group foundation is more complicated than that of the local scour of a single pier. The regional flow field between piles is affected by the arrangement of pile groups, showing a flow pattern where upflow and vorticity interact together, thus causing pile group foundation erosion to be affected by multiple effects, including the shielding effect, strengthening effect, compression effect, and shedding effect [24]. When the water flows through each pile, the front side of the upstream pile is washed first and quickly reaches a stable state, and the development of the local scour pit is mainly due to the sediment action on the pile side. With the increasing depth and scope of the scour pit, the coursing of sediment at the bottom of the pit and the decrease in eddy current force gradually weakens the motion of sediment in the pit, and finally, the local scour pit around the pier is formed.

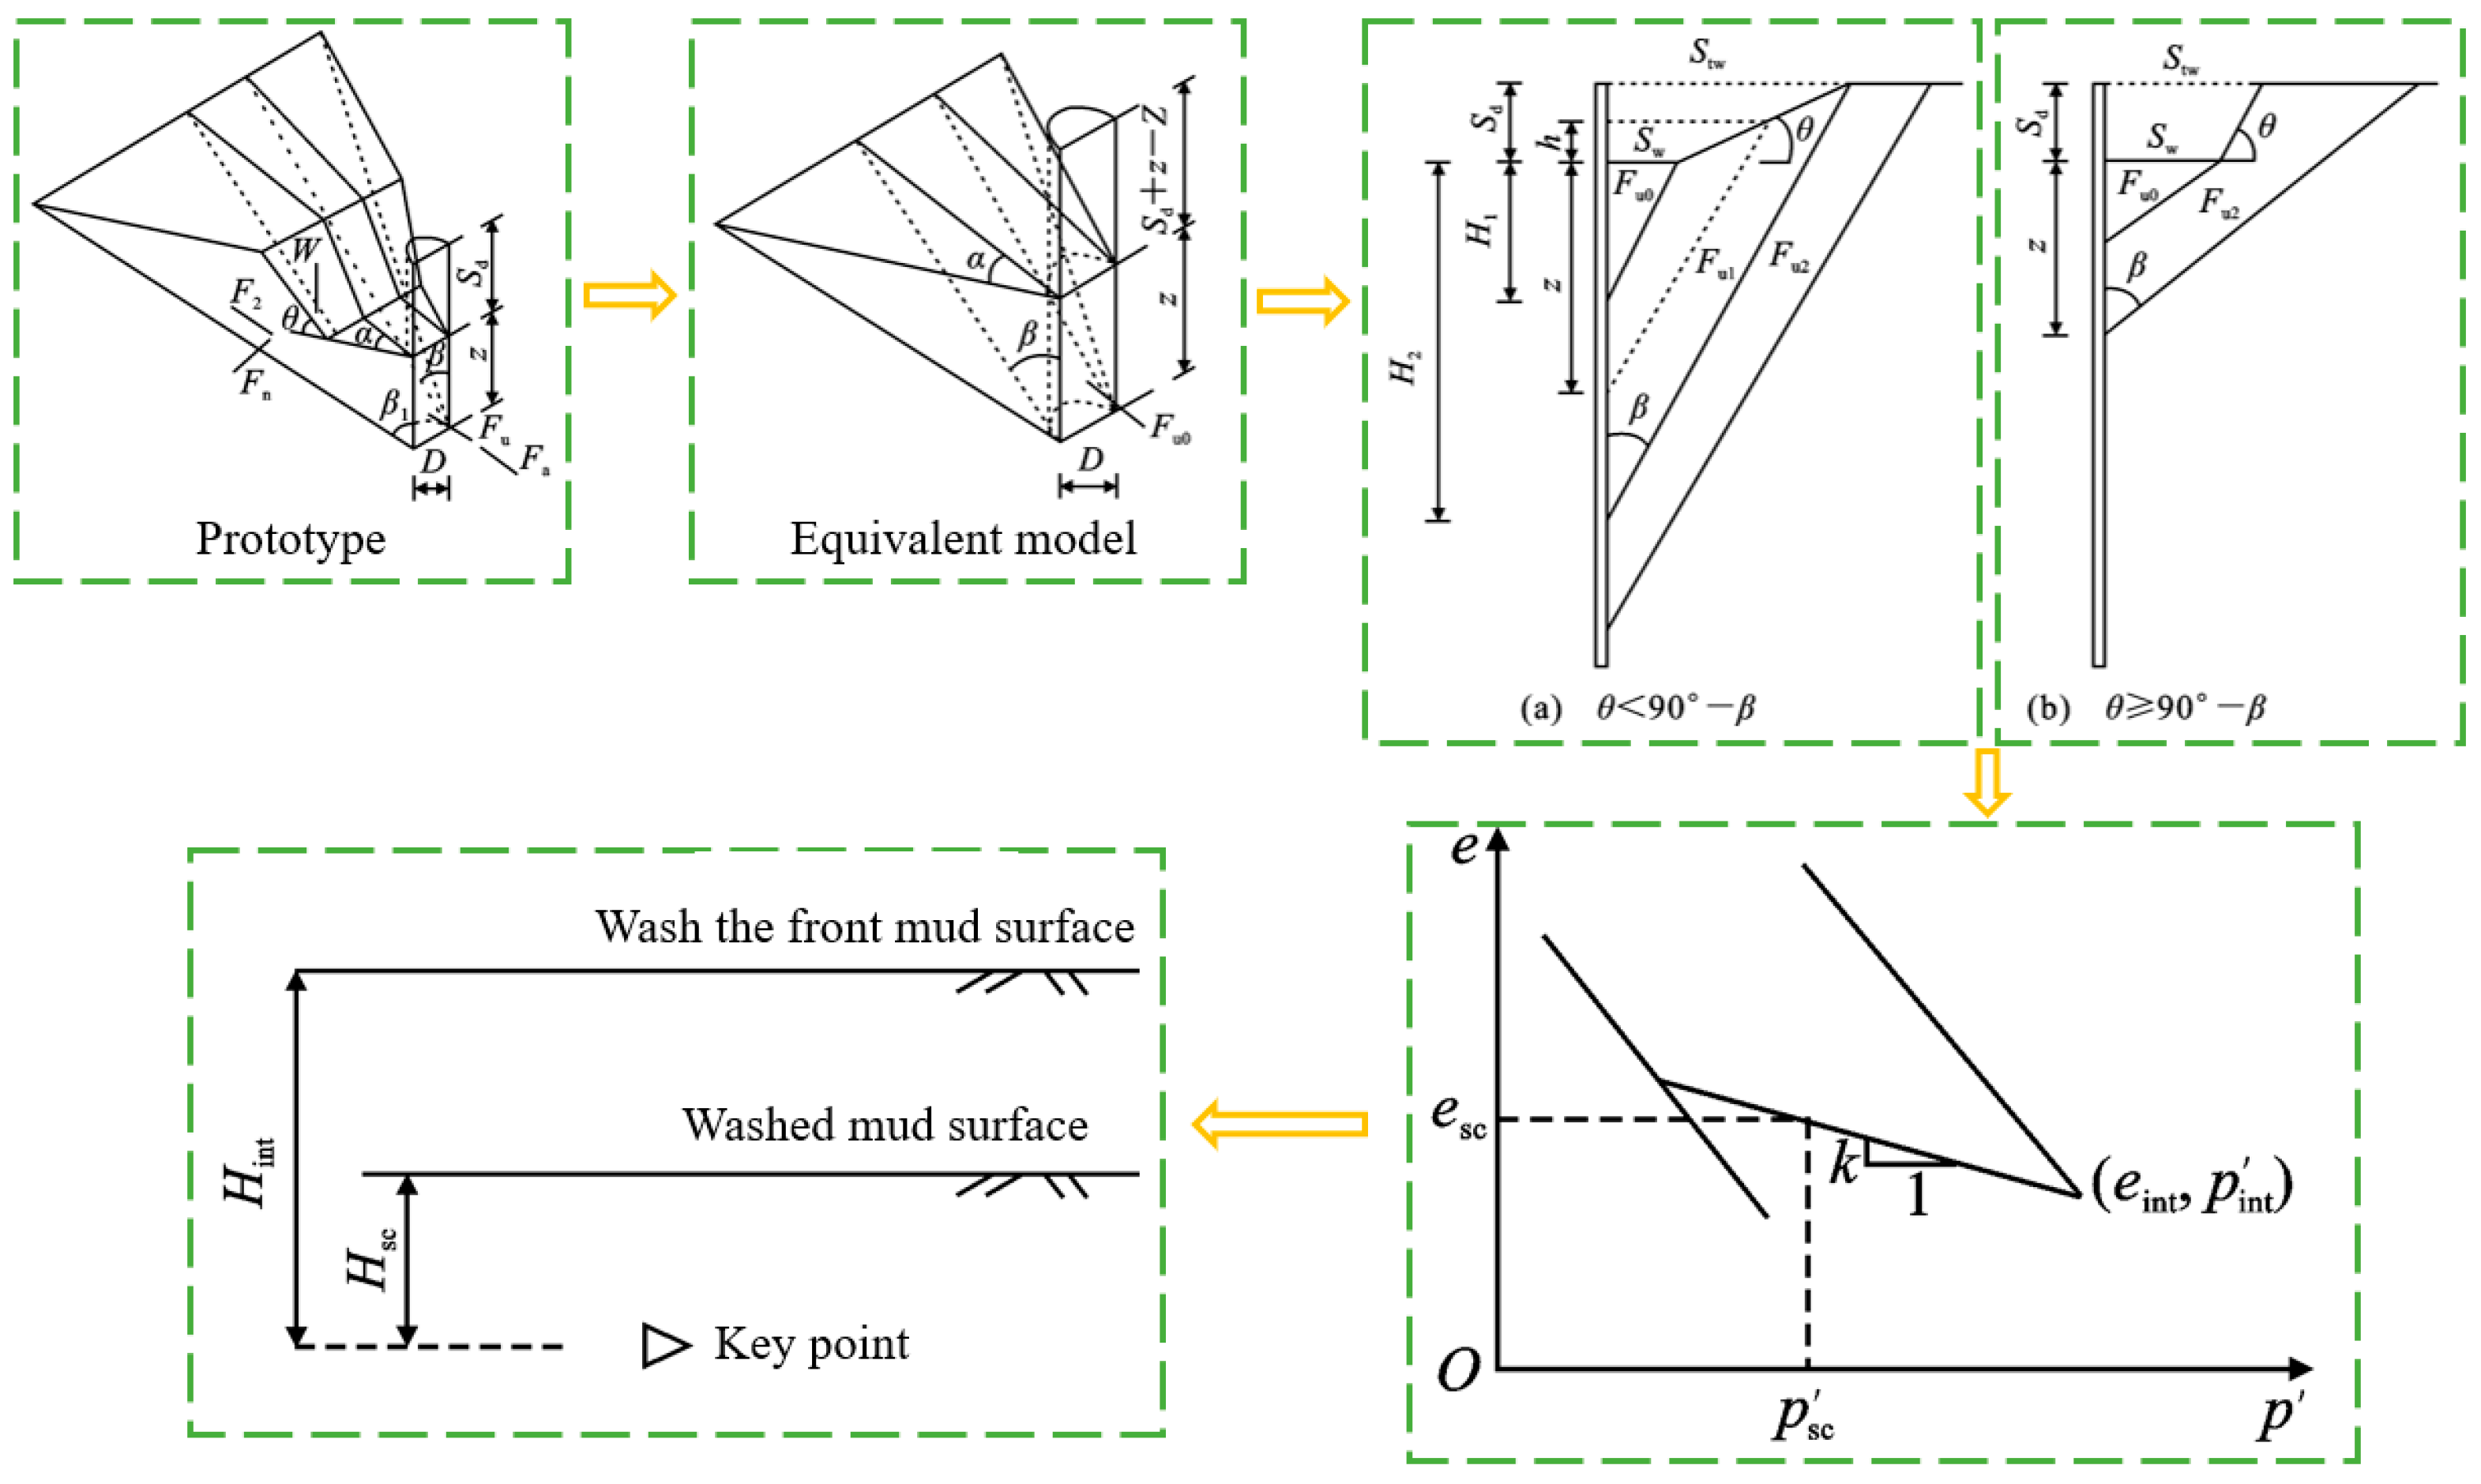
2.1.3. Local Scour Calculation

It is difficult to predict the depth of local scour using a theoretical formula because the process of local scour is very complicated. At present, the main method of local scour calculation research is a semi-empirical and semi-theoretical formula method; that is, the basic relationship is established based on certain assumptions or theories, and then the correlation coefficient of the formula is determined according to test data or field-measured data [25]. Due to the different basic theories when establishing the formula, the calculation formula for local scour depth is also relatively diverse. The following is a study and analysis of the current commonly used local scour calculation formula.
Based on CSU equation and modified according to flume test.
h b = 2.0 y 1 K 1 K 2 K 3 b y 1 0.65 F r 0.43
For complex piers composed of pier body, cap, and pile group foundation, HEC-18 recommends the scour superposition method of the component; that is, according to the different distances of each component of the bridge substructure to the river bed, the local scour contribution value generated by each part is calculated, and finally, the overall local scour depth of the pier is obtained by superposition:
h b = h s p i e r + h s p c + h s p g
Formula (12) adopts the superposition method to consider the contribution of different components to the local erosion depth, which can be uniformly applied to all types of piers with different structural forms; its calculation process is clear; and its application scope is wider [26]. The comparison of a large number of test data shows that Formula (12) have high calculation accuracy and is generally safe.
At present, the local scour depth calculations of (11) and (12) widely used in China are mainly based on a large number of actual observation data and test data. According to the “Code for Railway Engineering Hydrological Survey and Design”, the local scour depth of the non-viscous soil riverbed is formally calculated according to (13):
h b = K ξ K η 1 B 1 0.6 v v 0 , v v 0 K ξ K η 1 B 1 0.6 v v 0 v v 0 v 0 v 0 n 1 , v > v 0
Among them:
K η 1 = 0.8 1 d ¯ 0.45 + 1 d ¯ 0.15 , n 1 = v 0 v 0.25 d ¯ 0.19 v 0 = 0.0246 h p d ¯ 0.14 332 d ¯ + 10 + h p d ¯ 0.72 , v 0 = 0.462 d ¯ B 1 0.06 v 0
In addition to the (13) repair, the local erosion of bridge piers in the Code for Highway Engineering Hydrological Survey and Design can also be calculated according to Formula (15):
h b = K ξ K η 2 B 1 0.6 h p 0.15 v v 0 v 0 , v v 0 K ξ K η 2 B 1 0.6 h p 0.15 v v 0 v 0 n 3 , v > v 0
Among them:
K η 2 = 0.0023 d ¯ 2.2 + 0.375 d ¯ 0.24 , n 2 = v 0 v 0.23 + 0.191   g d ¯ 1 v 0 = 0.28 ( d ¯ + 0.7 ) 0.5 , v 0 = 0.12 ( d ¯ + 0.5 ) 0.55
Equations (13) and (15) have been widely used in bridge engineering design in China, considering the influence of factors such as velocity and sediment movement at the bottom of the river bed on the erosion depth, and have the advantage of high stability of the calculation results [27]. However, the left and right dimensions are not uniform, the calculation is more complicated, and there are many related parameters that need engineering experience to evaluate. In the actual project, the reliability of different results should be judged comprehensively by combining the specific situation of the river and the range of data.
For complex piers with pile group foundations, Appendix G of “Code for Hydrological Survey and Design of Railway Engineering” (TB10017-99) points out that when the bottom of the cap is lower than the general erosion line, the upper body is calculated; when the bottom of the cap is higher than the general erosion line, the erosion depth hb is calculated according to the following formula:
h b = K ξ K m ϕ K h ϕ ϕ 0.6 + 0.85 K ξ K h 2 B 1 0.6 · K η 1 v 0 v 0 v v 0 v 0 v 0 n 1
Among them:
K m ϕ = 1 + 5 ( m 1 ) ϕ B m 2 , K h ϕ = 1.0 0.001 h ϕ / h p + 0.1 2
In this paper, each parameter is taken as an independent variable, and the flushing depth hb can be expressed as follows:
h b = f H , L , v c , h , g , ρ w , μ , B , d 50 , ρ s , t , T , σ , R a
According to the characteristics of the dock sea area, factors affecting the local erosion depth hb are selected, and Equation (19) is rewritten as:
f h b , L , v c , h , g , μ , B , d 50 , ρ w = 0
Using the Berkingham Π theorem, the functional equation with dimension 1 is obtained as follows:
f h b h , B L , d 50 L , v c g h , ρ w v c B μ = 0
Rewrite (21) as follows:
f h b h , B L , d 50 L , F r = 0
Suppose Equation (22) is of the following form:
h b h = a 0 B L a 1 d 50 L a 2 ( F r ) a 3
Equation (23) is further written in logarithmic form as follows:
ln h b h = ln a 0 + a 1 ln B L + a 2 ln d 50 L + a 3 ln F r
The linear regression model is established as follows:
Y = a 1 x 1 + a 2 x 2 + a 3 x 3 + b
Using computer statistical software, the linear regression model is used to study the relationship between parameters based on the principle of the least squares method. a0, a1, a2, and a3 are 9.8620, 0.7258, 0.3047, and 0.9195, respectively. Therefore, the relative local scour depth of the high pile foundation under scour is obtained in this paper.
h b = 3.4518 B 0.7258 L 1.0305 v 0.9195 c h 0.5403 d 50 0.3047

2.2. Bearing Capacity of Pile Foundation under Local Erosion

In this section, the Bsiniske solution for the vertical stress of the soil around the pile under local scour is solved, and it is applied to the β method to solve the lateral resistance of the pile under local scour. According to the principle that the ultimate soil resistance at a certain point above the pile end before and after the equivalent scour is constant, the expressions of ultimate soil resistance before and after the equivalent scour are calculated, respectively. The distance between the mud surface and the pile end after the equivalent scour is obtained simultaneously, and then the equivalent scour depth, the p-y curve of the sand at different depths, and the bearing capacity of the high pile are calculated.

2.2.1. Vertical Stress Distribution of Soil around Piles under Erosion

To derive the stress distribution of soil around piles under local erosion, the pile-soil model under local erosion is assumed first. The relationship between the parameters can be expressed as follows:
S w t = S w b + S d tan α
The derivation process is based on Boussinesq’s elastic solution for semi-infinite space, which assumes that the soil beneath the washed mud surface is a semi-infinite-space elastic body [28]. The remaining soil above the locally scoured mud surface is equivalent to the distributed load P(r) equal to its weight. z represents the depth of a point O on the center line of the base below the locally scoured mud surface, which is also called z as the relative depth. Then, the expression P(r) is as follows:
P ( r ) = 0 , r S w b γ S d r S w b S w t S w b , S w b r < S w t γ S d , r S w t
where r is the horizontal distance from the location where O is being loaded.
The Boussinesq solution states that the vertical stress produced by a concentrated force P0 on the surface of a semi-infinite body at a location separated by a horizontal distance r and a vertical distance z is as follows:
d σ z = 3 P 0 2 π r 2 + z 2 z r 2 + z 2 3
Then, the additional stress caused by the equivalent distributed load of the remaining soil mass at the O point can be expressed as a double integral of the r direction and the ring direction:
Δ σ z = 0 2 π S w b S w t 3 γ S d 2 π r 2 + z 2 r S w b S w t S w b z r 2 + z 2 3 d r d θ + 0 2 π S w t 3 γ S d 2 π r 2 + z 2 z r 2 + z 2 3 d r d θ
The result of integration is:
Δ σ z = γ S d z S w t S w b S w t S w t 2 + z 2 S w b S w b 2 + z 2
If Equation (27) is substituted, Equation (31) can also be expressed as:
Δ σ z = γ z tan α S w b + S d tan α S w b + S d tan α 2 + z 2 S w b S w b 2 + z 2
Then, the vertical stress at the O point is:
σ z s = γ z + Δ σ z = γ z 1 + tan α S w b + S d tan α S w b + S d tan α 2 + z 2 S w b S w b 2 + z 2
The lateral resistance of a pile foundation may be solved using this approach. Based on the effective stress of the soil, it may examine the pile foundation’s short- and long-term carrying capability. The method is a widely used technique for calculating the side resistance of pile foundations due to its straightforward computation and clear idea. The side friction resistance of a pile foundation under local erosion circumstances is estimated in this section using a technique [29]. The following is how the ultimate lateral resistance of a pile foundation is expressed:
F = π D β σ z d z
The ultimate lateral resistance of the pile foundation before scouring is obtained by integrating.
F 0 = π γ D β L 2 2
Then, the ultimate lateral resistance of the pile foundation under local erosion is:
F s = 0 L S d π D β σ z s d z
Substitute Equation (33) to obtain:
F s = π γ D β 2 L S d 2 + 2 tan α S w b + S d tan α S w b + S d tan α 2 + L S d 2 S w b S w b 2 + L S d 2 S d tan α 2 S w b + S d tan α

2.2.2. Ultimate Soil Resistance Based on the p-y Curve

According to “The Pile Foundation Engineering Manual”, piles can be divided into rigid piles and elastic piles according to their relative stiffness, and their corresponding calculation methods are different. In view of the correlation between the measured reaction and displacement curve of the pile and the stress-strain curve of the soil-consolidated undrained triaxial test, the p-y curve is proposed to solve the nonlinear lateral resistance of the pile. At present, in one-of-a-kind states of foundation, the calculation techniques of horizontal bearing single piles, on the whole, consist of the limiting basis response method, the elastic basis response technique, and the p-y curve technique [30]. Based on the p-y curve method, this paper calculates the distribution of pile inside pressure and soil resistance on a pile basis after erosion. The key is to decide the stress-strain relationship of soil mass, that is, to calculate a set of decided y curves. According to the Code for Pile Foundations of Port Engineering, the p-y curves of piles in sandy soil can be determined by Equation (38) in the absence of area check data.
p = Ψ p u t h K z y / Ψ p u
When calculating the ultimate horizontal resistance per unit pile length, this paper adopts the passive wedge model and considers the action of soil in the wedge in front of the pile above the bottom of the pit, so that the local erosion is equivalent to the overall erosion [31]. The soil resistance of a point x above the pile end is the same before and after equivalence, and the soil resistance of this point before and after equivalence is calculated, respectively. The distance between the mud surface and the point after equivalence can be obtained by combining the two, and then the equivalent scour depth and the p-y curve of sand at different depths can be obtained.
According to the study, the wedge failure model is shown in Figure 3. Considering the scouring pit, the ultimate soil resistance can be derived from a point at the depth z of the mud surface, and the formulas are as follows:
F u 0 = γ K 0 tan ( β ) 3 cos ( α ) z 3 cos ( α ) sin ( β ) tan ϕ sin ( α ) + tan ϕ cos ( β ) tan β ϕ + γ z 2 tan β ϕ D tan ( β ) 2 + z tan 2 ( β ) tan ( α ) 3 K a γ D z 2 2
F u 1 = γ K 0 tan ( β ) 3 cos ( α ) z 3 + 3 D 1 z 3 z 2 S w / tan ( β ) + 2 D 1 2 z S w / tan ( β ) 3 cos ( α ) sin ( β ) tan ϕ sin ( α ) + tan ϕ cos ( β ) tan β ϕ + 1 tan β ϕ · { γ [ 1 tan ( β ) tan ( θ ) ] tan ( β ) 6 3 D z 1 + D 1 S w D 1 / tan ( β ) ) 2 + 2 tan ( β ) tan ( α ) · z 1 + D 1 S w D 1 / tan ( β ) 3 + γ S w 2 tan θ 6 ( 3 D + 2 S w tan ( α ) } K a γ D z 2 2
F u 2 = γ K 0 3 cos ( α ) z + S d 3 tan ( β ) 3 S w + S d / tan ( θ ) ] S d 2 + 2 S d 2 tan ( θ ) cos ( α ) sin ( β ) tan ϕ sin ( α ) + tan ϕ cos ( β ) tan β ϕ + 1 tan β ϕ · γ ( z + S d ) 2 t a n ( β ) 6 3 D + 2 z + S d tan ( β ) · tan ( α ) ] γ S w tan ( θ ) + S d 2 tan ( θ ) D 2 + 1 3 S w + S d / tan ( θ ) tan ( α ) + γ S w 2 tan ( θ ) D 2 + 1 3 S w tan ( α ) K a γ D z + S d 2 S d 2 2
The formula for calculating the ultimate soil resistance at a point Z at the equivalent back distance from the mud surface is
F ue = γ K 0 tan ( β ) Z 3 3 cos ( α ) cos ( α ) sin ( β ) tan ϕ sin ( α ) + tan ϕ cos ( β ) tan β ϕ + γ Z 2 tan β ϕ · D tan ( β ) 2 + Z tan 2 ( β ) tan ( α ) 3 K a γ D Z 2 2
According to Equation (42), the equivalent state is the special case of the wedge failure surface mentioned above when θ = 0, and the equivalent depth Z can be obtained. According to the research results, he calculation formula for the ultimate soil resistance per unit length near the mud surface is:
p st = γ z K 0 z tan ϕ sin ( β ) tan β ϕ cos ( α ) + tan ( β ) tan β ϕ [ D + z tan ( β ) tan ( α ) ] + K 0 z tan ( β ) tan ϕ · sin ( β ) tan ( α ) ] K a D
The formula for calculating the ultimate soil resistance per unit length at z below the mud surface is
p sd = K a D γ z tan 8 ( β ) 1 + K 0 D γ z tan ϕ tan 4 ( β )

2.2.3. Stress History-Soil Parameter Variation

Erosion has a great influence on the stress of soil around high piles, causing the remaining soil to change from a normal consolidation state to an over consolidation state, and the physical characteristics of soil change [32]. Among them, the effective weight and the effective internal friction Angle are the basic parameters used to determine the lateral resistance of the horizontal bearing pile. Both the effective weight and the internal friction Angle are related to the relative density of the body. The effective weight and the effective internal friction Angle of the sand foundation can be calculated using the following formula:
γ = G s 1 γ w 1 + e max D r e max e min
ϕ = ϕ cr + 3 D r 10 ln p 0 / 1 2 sin ϕ · 3 sin ϕ 1 3
After scouring, both the effective weight and the internal friction Angle of the sand at the same depth change, and the effective weight and the effective internal friction Angle after scouring can be obtained through the change in relative compactivity [33]. In sandy soil, the change in relative compactness can also correspond to the change in pore ratio before and after unloading, as shown in Figure 3.
For sandy soil, the change in pore ratio can be obtained by using the following formula:
Δ e = e sc e int = κ ln p sc / p int
Minimum effective principal stress.
σ 3 = K 0 γ int H int = 1 sin ϕ ˙ int γ int H int
Then, the average effective stress of sand is
p ˙ int = σ 1 + 2 σ 3 / 3 = γ int H int 3 2 sin ϕ ˙ int / 3
After scouring, the minimum effective principal stress is
σ 3 = K 0 γ sc H sc = 1 sin ϕ int O CR sin ϕ int γ sc H sc
Then, the average effective stress of sand is
p sc = σ 1 + 2 σ 3 / 3 = γ sc H sc { 1 + 2 [ 1 sin ϕ int O CR sin ϕ min / 3
The relative compactness can be obtained from Formulas (49)–(51).
Δ D r = D rint D rsc = Δ e / e max e min = κ ln 3 2 sin ϕ int O CR 1 + 2 1 sin ϕ ˙ int O CR sin ϕ int / e max e min
Through the substitution calculation of Equations (45), (46) and (52), the relative compactness of sand at a certain depth after scouring can be obtained, and then the effective weight and effective internal friction Angle can be obtained. According to Equations (39)–(42), the equivalent depth Z after scouring can be obtained, which can be substituted into Equations (43) and (44) to replace Z, and a wedge model considering the crater size can be obtained to calculate the corrected soil resistance at different depths [34]. According to Formula (38), the modified p-y curves of sand at different depths can be obtained, which are input into LPILE (2022) software to define soil parameters, and then the load-displacement properties and internal forces of single piles under each level of horizontal load can be calculated.

3. Results and Discussion
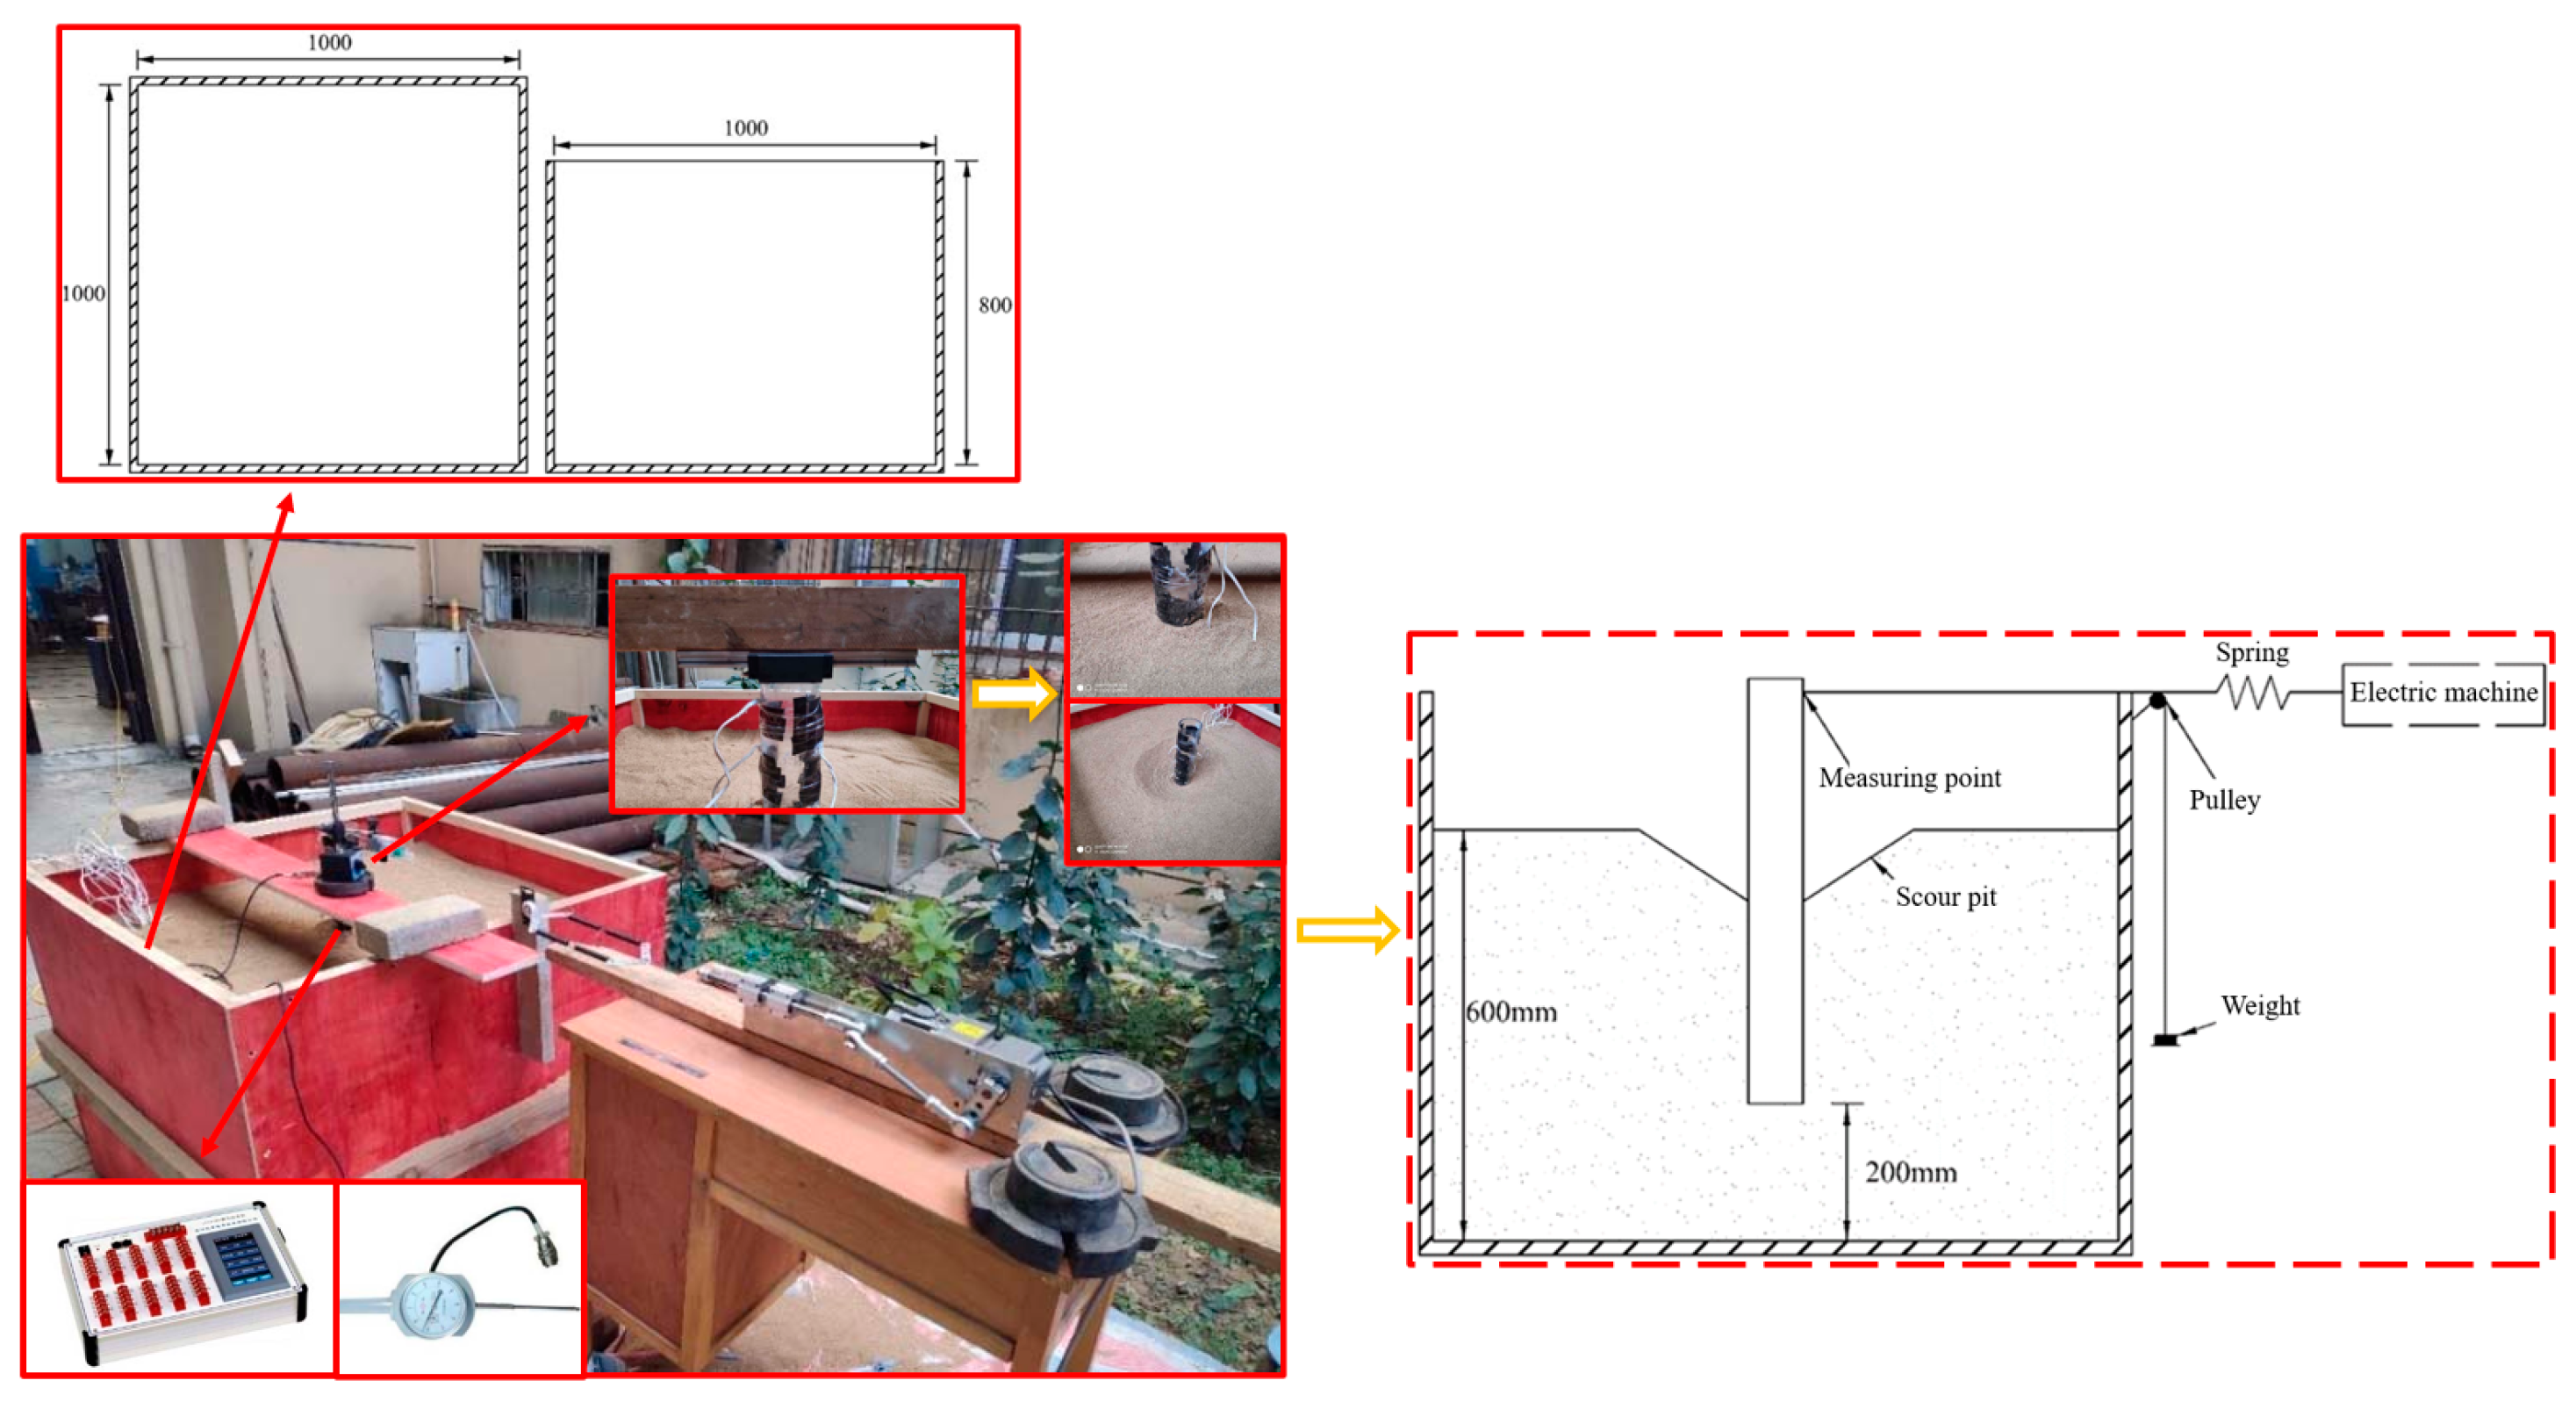
3.1. Model Test

The sand used in the model test is taken from yellow sand used in construction, and the parameters of the soil sample include physical parameters and mechanical parameters, including the density of sand and the water content of sand. The specific mechanical parameters are sand friction Angle, cohesion, and sand compression modulus [35]. The relevant soil sample parameters were obtained by laboratory soil tests, such as sand particle classification tests, sand density tests, sand water content tests, fast shear tests, and consolidation tests.
The sand used for the test was medium sand, the sand density was 1.457 g/cm3, and the sand water content was 8.73%. The specific test method and test results were as follows:
To determine the density of test sand more accurately, the methods used are as follows: The plastic drum is used to transfer the sand to the model box. The height of the sand is filled to 0.6 m by layering compaction, and the weight of each barrel of sand and the number of drums used can be measured to determine the quality of the sand used. The sand mass used is about 874 kg, and the size of the foundation soil is l m × 1 m × 0.6 m. This results in a sand density of about 1.457 g/cm3.
The measurement method for sand and water content is as follows: Three groups of samples are taken from a gearbox and put into an electric oven. After drying to a constant weight, the samples are taken out, and the weight before and after drying is taken to measure the average water content. The test results show that the average water content of sand is about 8.73%.
Through the fast shear test and consolidation test, the cohesive force of sand is about 0, the internal friction Angle is about 33, and the compression modulus is about 2 MPa.
The direct shear test of sand samples was completed by a hand-operated strain direct shear instrument. The shear speed was controlled at 4 r/min, and the vertical pressure was divided into five stages: 50 kPa, 100 kPa, 200 kPa, 300 kPa, and 400 kPa, respectively. According to the test results, the internal friction Angle of sand is about 33°, and the cohesion is about 0. If the Poisson ratio of test sand v = 0.25, the elastic modulus of soil E = 1.7 MPa The basic parameters are shown in Table 1.
As shown in Figure 4. The model test device includes a model box, a horizontal loading device, a sensor, and a data acquisition system. The model box is made of wood with a thickness of 20 mm. The loading device is composed of a horizontal static loading device and a horizontal cyclic loading device. The sensors include a strain sensor and a displacement sensor.
The model box is made of wood with a thickness of 20 mm, and its dimensions are 1000 mm × 1000 mm × 800 mm. To keep the model box stable during the test, the wall of the box does not have obvious deformation, and the solid wood strips are reinforced around the model box.
The horizontal static loading device includes a fixed pulley, a wire, a hook tray, and a weight. The test shows that the wire is strong enough to withstand the required horizontal load. One end of the wire is connected to the pile head, and the other end is connected to the hook tray. The horizontal static load can be applied by adding weights. The test shows that the friction of the pulley is very small, so the gravity of the weight and the hook tray is the size of the horizontal load. The horizontal cyclic loading device includes a fixed pulley, wire, spring, and reciprocating motor. The cyclic load is applied through the reciprocating motor. The reciprocating motor used in the test has three stroke levels: 7 cm, 10 cm, and 15 cm.
To minimize the influence of accumulated deformation of the pile foundation on spring elongation, a maximum travel of 15 cm is selected as the maximum elongation of the spring. The speed can be adjusted by the governor, and the speed can be adjusted from 16 r/min to 33 r/min. The cycle of the horizontal cyclic load can be determined by determining the speed of the reciprocating motor, and the amplitude of the horizontal cyclic load can be determined by determining the stroke of the reciprocating motor and the stiffness of the spring used in the test.
Two kinds of sensors were used in the test: a strain sensor and a displacement sensor. The BX-120-3AA strain gauge produced by the Zhejiang Huangyan Test Instrument Factory is selected as the strain sensor. The corresponding parameters are as follows: gate length is 3 mm, gate width is 2 mm, sensitivity coefficient is 2.08 ± 1%, and resistance value is 120.1 ± 0.1 Ω. A total of seven groups of strain gauges are arranged along the axisymmetric position of the body. The distance between the top strain gauge and the pile top is 7 cm, and the distance between each group of strain gauges is 8 cm. The displacement sensor adopts a type of dial indicator resistance strain displacement sensor produced by Yuhuan Jiatong Electromechanical Parts Factory. The corresponding displacement is 0.01 mm, and the wiring mode is full bridge. The data acquisition system is the uT7110Y static strain gauge produced by Wuhan Youtai Electronic Technology Co., Ltd. (Wuhan, China), The measuring range is 0~±30,000 uε, and the acquisition frequency is 2 Hz. The displacement value of the pile head under cyclic load is collected by Youtai dynamic data acquisition software (2020), and the sampling frequency is 5 Hz, which is sufficient to ensure sampling accuracy.

3.2. Analysis of Test Results

Figure 5, respectively, shows the change curves of flow velocity measured by the Doppler current meter at different positions away from the bed surface when the average section velocity (the average flow velocity at a position 0.25 m away from the bed surface) reaches 0.20 m/s, 0.26 m/s, and 0.29 m/s. The sampling period is 5 s. It can be seen from the figure that the velocity of the section changes slightly, within 0.05 m/s. In this paper, the average velocity of each section is taken as the test flow velocity.
To further compare the influence of pile spacing S on different wharf groups, the erosion and deposition changes of the typical cross-sectional underbed around pile groups of the high wharf were analyzed. Figure 6 shows the erosion and deposition changes of a typical cross-sectional underbed. The following characteristics are obtained:
(1) Section D-0.25 L is 50 cm away from the facing water surface of the pier, where there has been a micro-thrust. With the increase in wharf pile spacing S, the maximum scouring depth in front of the wharf decreases from 1 cm to 0.3 cm, and the width of the scouring area decreases from 3 times the wharf width to 1 times the wharf width. The erosion depth of the wharf facing the water surface (section D0 L) was reduced from 3.8 cm to 1.7 cm, and the erosion width was reduced from 4 times the wharf width to 3 times the wharf width.
(2) At the beginning of section D0.25 L, the scour trough with a distance of 5 cm × 2.5 cm and a distance of 5 cm × 5 cm becomes a double-groove shape, and the middle uplift is sandwiched between the two troughs, which is like a sand ridge. However, when the pile spacing is 5 cm × 5 cm, this is still a scoured area, and its top is below the pier pile group. The position of scour slots on both sides of the wharf did not change, but the scour depth increased, and the maximum scour depth deviated from both sides of the wharf. At the beginning of section D0.5 L, the pile spacing of 5 cm × 10 cm also showed a double-channel scour pattern. Spacing 5 cm × 2.5 cm silting height below the pier began to decrease. At the beginning of section D0.75 L, the pile spacing of 5 cm × 5 cm and the deposition height under the pier began to decrease. At the beginning of section D1 L, the pile spacing of 5 cm × 2.5 cm was increased twice. As the distance S between piles increases, the height of siltation under and on both sides of the wharf decreases, and the highest point of siltation moves backward and even moves to the back surface of the wharf. The maximum siltation changes from 5 cm in section D0.5 L to 3.3 cm in section D0.5 L and even to 1.65 cm in section D1 L. The maximum volume on both sides decreased from 2.4 cm in section D0.5 L to 1.1 cm in section D1 L. The scour range and depth on both sides of the pier were reduced; the scour width was reduced from 2.5 times the pier width to 1.5 times the pier width; and the maximum scour depth was reduced from 3.2 cm to 0.9 cm.
(3) From the beginning of section D1 L, the deposition height of the water surface at the back of the pier decreases, and the erosion depth on both sides of the pier also decreases until section D1.5 L. There are still traces of topographic erosion and deposition changes caused by piers with smaller pile spacing, but the variation amplitude is small. With the increase in the distance S between piles, the height of the silting body decreases from 3.3 cm to 1.65 cm, and the silting width decreases slightly. The erosion depth on both sides of the pier became shallower, decreasing from 2.8 cm to no obvious erosion.
In this paper, a consultant central pile in the pile crew was once chosen for inside pressure analysis. The bending second distribution of the pile physique used to be bought from the pressure records of the pile physique of the basis pile. The boundary stipulations of the pinnacle of the basis pile have been identical to those of the single pile. It can be seen from Figure 7 that the bending second of pile physique will increase first and then decrease, and the bending second reaches its most cost at a role under the mud surface. With the expansion of scour depth, the most bending second of pile physique will increase below the identical load, and the role of the most bending second factor strikes the pile end, which is equal to the vogue of a single pile. Under the equal load, the bending second of the pile crew middle is smaller than that of a single pile, which is on the whole due to the constraint impact of the cap. The integrity of the pile crew basis is strengthened, the inside pressure of the pile crew is redistributed, and the pressure of the basis pile is uniform and small.
The correlation coefficient R = 0.984 and the decision coefficient R = 0.969 indicate that the fitting effect of multiple linear regression is better. The calculated values of Equation (26) and the distribution of the measured scatter values are shown in Figure 8, and the scatter points of the calculated values are all distributed near the measured values. To verify the accuracy of the formula for calculating the local scour depth of the high pile foundation proposed in this paper under the action of water flow, the calculated value of the local scour depth of the bridge pier is obtained by substituting the site scour test data into Equation (26). The results of comparing the calculated value with the measured value are shown in Figure 8. The traditional calculation formula for scour depth has an error of up to 20%. The dashed line in the figure indicates that the relative error between the calculated value and the measured value is 0%, and the data between the two dashed lines is the verification data with the absolute value of the relative error less than 10%. It can be seen from the figure that the relative error of the method in this paper is greater than 10% of the total data; only 16.6% of the calculated value and measured value error are small, so the formula can predict the erosion depth more accurately.

3.3. Discussion

With the increase in horizontal load, the load sharing ratio of the front pile gradually increases, and the middle and back piles gradually decrease, which basically remains unchanged in the late loading period. The load-sharing ratio of the front pile is greater than that of the middle pile and the back pile, which is consistent with the pile group effect theory. With the increase in scour depth, the load sharing ratio of the front pile increases, and the load sharing ratio of the middle pile and the back pile decreases gradually. In the engineering design, it is suggested to take appropriate strengthening measures for the front corner piles.
The flow field around the open wharf and the erosion and deposition of the bed are complicated, and the dynamic factors of tidal flow acting on the pile of the wharf play a big role. In the future, the study of the flow field around the pile group and the erosion and deposition of the bed of the wharf under the action of the tide should be strengthened, and more reasonable suggestions should be put forward for the design of the wharf.

4. Conclusions

Based on the modified p-y curve, the calculation of the bearing capacity and the analysis of the scour depth of the wharf-high pile foundation under the action of scour are proposed in this paper. According to the principle of constant ultimate soil resistance at a point above the pile end before and after the equivalent, the expressions of ultimate soil resistance before and after the equivalent are calculated, respectively. The distance between the equivalent soil surface and the pile end can be obtained simultaneously. Then, the equivalent erosion depth, the p-y curve of sand at different depths, and the bearing capacity of a high pile are proposed. Section D-0.25L is 50 cm away from the facing water surface of the wharf, where a slight flushing has occurred. With the increase in wharf pile spacing S, the maximum scouring depth in front of the wharf decreases from 1 cm to 0.3 cm, and the width of the scouring area decreases from 3 times the wharf width to 1 times the wharf width. The erosion depth of the wharf facing the water surface (section D0 L) was reduced from 3.8 cm to 1.7 cm, and the erosion width was reduced from 4 times the wharf width to 3 times the wharf width. Comparing the calculated value with the measured value, it is found that the relative error between the calculated value and the measured value is 10%, and the data between the two dashed lines is the verification data with an absolute value of relative error less than 10%. The data with a relative error greater than 10% accounted for only 16.6% of the total data, and the calculated and measured values had little error. The formula proposed in this paper can predict the erosion depth more accurately.
The research in this paper provides accurate guidance for the calculation of bearing capacity and erosion depth for the design of a high pile foundation for a wharf. However, this paper only studies the response of wave loads to high-pile foundations. In addition to beam deformation caused by flood pressure and foundation stiffness reduction caused by increasing erosion depth, pile foundations may also suffer different damage effects, such as deterioration of concrete materials and erosion of foundation sections. Therefore, the influence of different failure types on the safety of high-pile foundations can be studied.

Author Contributions

Conceptualization, Y.Y.; methodology, P.Z.; software, L.W. and Q.Z.; validation, Y.Y., P.Z. and L.W.; formal analysis, Y.Y.; investigation, Y.Y.; writing-original draft preparation, Y.Y.; writing-review and editing, Y.Y. and P.Z.; visualization, Q.Z.; supervision, L.W.; project administration, Y.Y. All authors have read and agreed to the published version of the manuscript.

Funding

(1) 2020 Open Funding for Engineering Technology Research Center for Port Construction Optimization and Waterway Regulation Upgrading of Wanjiang University of Technology (GKHD202002). (2) 2021 Funding for Key Projects of Natural Sciences of Institutions of Higher Education in Anhui Province (KJ2021A1211).

Data Availability Statement

The data presented in this study are available on request from the corresponding author. The data are not publicly available due to confidentiality and restrictions.

Conflicts of Interest

The authors declare no conflicts of interest.

References

  1. Kim, S.; Whang, S.W.; Kim, S. Pile foundation design through the increased bearing capacity of extended end pile. J. Asian Archit. Build. Eng. 2017, 16, 395–402. [Google Scholar] [CrossRef]
  2. Kuwajima, K.; Hyodo, M.; Hyde, A.F. Pile bearing capacity factors and soil crushabiity. J. Geotech. Geoenviron. Eng. 2009, 135, 901–913. [Google Scholar] [CrossRef]
  3. Zhang, X.; Huang, T.; Wu, Y. Soil drainage clogging mechanism under vacuum preloading: A review. Transp. Geotech. 2024, 45, 101178. [Google Scholar] [CrossRef]
  4. Zhang, X.; Du, D.; Man, T.; Ge, Z.; Huppert, H. Particle clogging mechanisms in hyporheic exchange with coupled lattice Boltzmann discrete element simulations. Phys. Fluids 2024, 36, 013312. [Google Scholar] [CrossRef]
  5. Li, J. Model Test and Numerical Simulation of Water Conservancy Foundation Bearing Capacity. Comput. Intell. Neurosci. 2022. [Google Scholar] [CrossRef]
  6. Liu, C.Y.; Wang, Y.; Hu, X.M.; Han, Y.L.; Zhang, X.P.; Du, L.Z. Application of GA-BP neural network optimized by Grey Verhulst model around settlement prediction of foundation pit. Geofluids 2021, 2021, 5595277. [Google Scholar] [CrossRef]
  7. Li, W.; Huang, B.; Hou, J. Experimental study on water flow characteristics of pile group in high pile wharf. J. Xinjiang Agric. Univ. 2004, 27, 78–81. [Google Scholar]
  8. do Carmo, J.S.A. Experimental study on local scour around bridge piers in rivers. WIT Trans. Ecol. Environ. 2005, 83. [Google Scholar] [CrossRef]
  9. Tang, S.F.; Li, B. Numerical simulation of tidal flow under the influence of pile resistance. China Harb. Constr. 2001, 5, 25–29. [Google Scholar]
  10. Zhao, S.; Wang, K.; Wu, J. Cumulative deformation characteristics of inclined single pile in sand under horizontal cyclic load. J. Zhejiang Univ. (Eng. Technol.) 2022, 56, 1310–1319. [Google Scholar]
  11. Zhang, X.; Ye, P.; Wu, Y.; Zhai, E. Experimental study on simultaneous heat-water-salt migration of bare soil subjected to evaporation. J. Hydrol. 2022, 609, 127710. [Google Scholar] [CrossRef]
  12. Wang, L.; Lv, Z.D.; Wang, F.; Zhao, Z.; Dong, X.L. Underwater Shaking-Table Investigation of Complex Deep-Water Pile-Cap Foundation for Xihoumen Rail-cum-Road Bridge. Shock. Vib. 2023, 2023, 5409006. [Google Scholar] [CrossRef]
  13. Zhang, X.; Du, D.; Wu, Y.; Ye, P.; Xu, Y. Theoretical and analytical solution on vacuum preloading consolidation of landfill sludge treated by freeze–thaw and chemical preconditioning. Acta Geotech. 2023, 19, 221–238. [Google Scholar] [CrossRef]
  14. Liu, C.; Du, L.; Zhang, X.; Wang, Y.; Hu, X.; Han, Y. A new rock brittleness evaluation method based on the complete stress-strain curve. Lithosphere 2021, 2021 (Special 4), 4029886. [Google Scholar] [CrossRef]
  15. Momeni, E.; Nazir, R.; Armaghani, D.J.; Maizir, H. Prediction of pile bearing capacity using a hybrid genetic algorithm-based ANN. Measurement 2014, 57, 122–131. [Google Scholar] [CrossRef]
  16. Wei, Y.; Wang, D.; Li, J.; Jie, Y.; Ke, Z.; Li, J.; Wong, T. Evaluation of ultimate bearing capacity of pre-stressed high-strength concrete pipe pile embedded in saturated sandy soil based on in-situ test. Appl. Sci. 2020, 10, 6269. [Google Scholar] [CrossRef]
  17. Lee, I.M.; Lee, J.H. Prediction of pile bearing capacity using artificial neural networks. Comput. Geotech. 1996, 18, 189–200. [Google Scholar] [CrossRef]
  18. Józefiak, K.; Zbiciak, A.; Maślakowski, M.; Piotrowski, T. Numerical modelling and bearing capacity analysis of pile foundation. Procedia Eng. 2015, 111, 356–363. [Google Scholar] [CrossRef]
  19. Hight, D.W.; Lawrence, D.M.; Farquhar, G.B.; Mulligan, G.W.; Gue, S.S.; Potts, D.M. Evidence for scale effects in the end bearing capacity of open-ended piles in sand. In Proceedings of the Offshore Technology Conference, Houston, TX, USA, 6–9 May 1996. OTC-7975-MS. [Google Scholar]
  20. Xie, Y.; Liu, C.; Gao, S.; Tang, J.; Chen, Y. Lateral load bearing capacity of offshore high-piled wharf with batter piles. Ocean. Eng. 2017, 142, 377–387. [Google Scholar] [CrossRef]
  21. Mendoza, C.C.; Caicedo, B.; Cunha, R. Determination of vertical bearing capacity of pile foundation systems in tropical soils with uncertain and highly variable properties. J. Perform. Constr. Facil. 2017, 31, 04016068. [Google Scholar] [CrossRef]
  22. Qi, W.G.; Tian, J.K.; Zheng, H.Y.; Wang, H.Y.; Yang, J.; He, G.L.; Gao, F.P. Bearing capacity of the high-rise pile cap foundation for offshore wind turbines. In Sustainable Development of Critical Infrastructure; ASCE: Reston, VA, USA, 2014; pp. 413–420. [Google Scholar] [CrossRef]
  23. Zhou, J.J.; Yu, J.L.; Gong, X.N.; Zhang, R.H.; Yan, T.L. Influence of soil reinforcement on the uplift bearing capacity of a pre-stressed high-strength concrete pile embedded in clayey soil. Soils Found. 2019, 59, 2367–2375. [Google Scholar] [CrossRef]
  24. Zhu, Y.P.; Bao, Z.X.; Ma, T.Z.; Lai, C.J. Testing and analysis of bearing capacity on pile foundation. Appl. Mech. Mater. 2014, 501, 234–237. [Google Scholar] [CrossRef]
  25. Koizumi, Y.; Ito, K. Field tests with regard to pile driving and bearing capacity of piled foundations. Soils Found. 1967, 7, 30–53. [Google Scholar] [CrossRef] [PubMed]
  26. Jeong, S.; Ko, J.; Won, J.; Lee, K. Bearing capacity analysis of open-ended piles considering the degree of soil plugging. Soils Found. 2015, 55, 1001–1014. [Google Scholar] [CrossRef]
  27. Knappett, J.A.; Madabhushi, S.P.G. Seismic bearing capacity of piles in liquefiable soils. Soils Found. 2009, 49, 525–535. [Google Scholar] [CrossRef]
  28. Darrigol, O. Joseph Boussinesq’s legacy in fluid mechanics. Comptes Rendus Mécanique 2017, 345, 427–445. [Google Scholar] [CrossRef]
  29. Chen, Q.N.; Zhao, M.H.; Zhou, G.H.; Zhang, Z.H. Bearing capacity and mechanical behavior of CFG pile composite foundation. J. Cent. South Univ. Technol. 2008, 15 (Suppl. S2), 45–49. [Google Scholar] [CrossRef]
  30. Lestari, L.L.; Propika, J.; Puspasari, A.D. Axial Bearing Capacity Analysis of Pile Foundation using Nakazawa Method. J. IPTEK 2020, 24, 45–52. [Google Scholar] [CrossRef]
  31. Hwang, U.S. Study on Bearing Capacity of Ultra High Strengh End Extended PHC Pile by Loading Test. J. Korea Acad. Ind. Coop. Soc. 2019, 20, 269–275. [Google Scholar] [CrossRef]
  32. Pham, T.A.; Ly, H.B.; Tran, V.Q.; Giap, L.V.; Vu, H.L.T.; Duong, H.A.T. Prediction of pile axial bearing capacity using artificial neural network and random forest. Appl. Sci. 2020, 10, 1871. [Google Scholar] [CrossRef]
  33. Moayedi, H.; Jahed Armaghani, D. Optimizing an ANN model with ICA for estimating bearing capacity of driven pile in cohesionless soil. Eng. Comput. 2018, 34, 347–356. [Google Scholar] [CrossRef]
  34. Maнгушев, P.; Hикитинa, H. Bearing capacity of deep pile foundation for high-rise facility on weak soils: Comparing of analysis results and experimental data. Int. J. Comput. Civ. Struct. Eng. 2019, 15, 90–97. [Google Scholar] [CrossRef]
  35. Zhang, C.; Nguyen, G.D.; Einav, I. The end-bearing capacity of piles penetrating into crushable soils. Géotechnique 2013, 63, 341–354. [Google Scholar] [CrossRef]
Figure 1. Wave load and its spectrum.
Water 16 00606 g001
Figure 2. (a) General scouring depth (b) Local scour depth (c) Vortex flow field structure. Erosion structure diagram of a high pile foundation.
Water 16 00606 g002
Figure 3. Failure model and load/unload curve.
Water 16 00606 g003
Figure 4. Model structure and layout.
Water 16 00606 g004
Figure 5. Determination of water flow velocity.
Water 16 00606 g005
Figure 6. Changes in river bed erosion and deposition.
Water 16 00606 g006
Figure 7. Pile bending moment distribution.
Water 16 00606 g007
Figure 8. Fitting and formula verification.
Water 16 00606 g008
Table 1. Sand parameters.
Density1.457 g/cm3
Water content8.73%
Cohesive force0
Angle of internal friction33°
Compression modulus2 MPa
Poisson’s ratio0.25
Modulus of elasticity1.7 MPa
Disclaimer/Publisher’s Note: The statements, opinions and data contained in all publications are solely those of the individual author(s) and contributor(s) and not of MDPI and/or the editor(s). MDPI and/or the editor(s) disclaim responsibility for any injury to people or property resulting from any ideas, methods, instructions or products referred to in the content.

