Article

Analysis of Influencing Factors of Heavy Metals and Non-Point Source Pollution in Typical Areas of Tethys Himalayan Tectonic Domain

1
School of Statistics, Xi’an University of Finance and Economics, Xi’an 710100, China
2
School of Information, Xi’an University of Finance and Economics, Xi’an 710100, China
*
Author to whom correspondence should be addressed.
Water 2024, 16(2), 291; https://doi.org/10.3390/w16020291
Submission received: 4 December 2023 / Revised: 30 December 2023 / Accepted: 3 January 2024 / Published: 15 January 2024

Abstract

:
Due to their potential toxicity and non-degradability, heavy metals pose water and soil quality and safety challenges, impacting crop growth and the ecological environment. The contamination of heavy metals (HMs) and non-point source pollution from agriculture and pastoral presents significant ecological and environmental challenges, necessitating prioritized prevention and mitigation. In this study, 44 water samples and 55 soil samples from Gangba County, a typical agricultural and pastoral area in the Tethys Himalaya tectonic domain, served as research objects. We employed various methods, including the inverse distance weighting, ecological risk assessment model, redundancy analysis, and geographical detector modeling, to investigate the spatial distribution and pollution attributes of arsenic (As), chromium (Cr), cadmium (Cd), lead (Pb), nickel (Ni), nitrogen (N), phosphorus (P), and potassium (K). Our analysis considered the impact of soil physicochemical properties on heavy metals (HMs), elucidating factors influencing their spatial distribution. Results indicated that 65.46% of soil As in the study area exceeded the screening value, while the concentrations of the eight selected elements in water remained below the standard limit. Simultaneously, the study area exhibited low overall ecological risk and minimal HM pollution. Furthermore, As and Pb were primarily linked to human activities and the environment, while Cd, Cr, and Ni were predominantly associated with natural processes. Additionally, factors, such as per capita net income, mean annual temperature, mean annual precipitation, geomorphic type, organic matter, geology type, and soil texture (sand, silt, and clay) constituted primary controlling factors influencing the spatial distribution of HMs in soil. Therefore, for effective prevention and control of HMs and non-point source pollution in agriculture and pastoral, arsenic should be the primary monitoring target, with careful consideration given to the application rates of fertilizers containing N, P, and K to facilitate sustainable development of the ecological environment.

1. Introduction

In recent times, the management and mitigation of agricultural and pastoral non-point source pollution and heavy metals (HMs) pollution have emerged as primary risk factors and represent a focal point in contemporary research [1]. As the predominant type of global non-point source pollution, the origins of pollutants contributing to agricultural and pastoral non-point source pollution are diverse. This primarily arises from the excessive and irrational application of chemical fertilizers and pesticides, along with the disposal of agricultural waste, such as discarded agricultural film, crop straw, livestock manure, and domestic waste [2]. Non-point source pollution seeps into water bodies through soil erosion, surface runoff, and farmland degradation, resulting in considerable ecological and environmental challenges [3,4]. Water is a vital resource for human production activities and a cornerstone of human development. The degradation of water quality resulting from non-point source pollution constitutes a paramount water quality issue [5,6]. Soil serves as the primary repository for trace elements in the ecological environment system. Agricultural and pastoral non-point source pollution directly affects the quality of soil and water in farmland, posing a risk to the quality and safety of agricultural products [7]. Since the 1990s, 30% to 50% of the substandard water quality in global rivers and lakes can be ascribed to non-point source pollution [8]. According to the 2017 Bulletin of the Second National Pollution Source Survey, the releases of total nitrogen (TN) and total phosphorus (TP) from water pollutants in China accounted for 46.5% and 67.2%, respectively, of the total pollution burden [9]. Non-point source and HM pollution constitute a global challenge.
Additionally, irrational human activities, encompassing the utilization of agricultural chemicals, like fertilizers and pesticides, sewage irrigation, exhaust gas deposition, and waste residue stacking, have led to the contamination of heavy metals (HMs), such as arsenic (As), chromium (Cr), cadmium (Cd), nickel (Ni), and lead (Pb) [10]. HMs exhibit potential toxicity, persistence, irreversibility, and accumulative properties. They predominantly infiltrate groundwater through soil leaching and other pathways, substantially affecting soil and water quality and safety [11,12,13,14]. HMs can diminish water and soil quality, affecting crop health. Furthermore, these metals can enter the human body through the food chain via biogeochemical cycles, posing risks to human health [15]. The extent of HM pollution is influenced by a combination of natural, environmental, and human factors, manifesting significant spatial variations [16,17,18]. Regions with substantial human activities demonstrate HM sources and distribution closely tied to mining, agriculture, and transportation activities [17,19]. In regions with limited human activities, the sources and distribution of HMs are primarily associated with soil parent materials, soil types, and texture [20,21]. Consequently, comprehending the spatial distribution and influencing factors of essential soil nutrient elements (N, P, K) and major HMs (As, Cd, Cr, Pb, Ni) in agricultural non-point source pollution is essential for the effective prevention and remediation of HMs and non-point source pollution.
Presently, methodologies, like multivariate statistical analysis, geostatistics, and source analysis, are commonly employed to investigate the factors influencing the source and distribution of non-point source pollution [22,23]. Recently, several studies have utilized multivariate statistical analysis to investigate the internal correlations among major elements and HMs in soil and water. This method allows for the quantitative analysis of sources of non-point source pollution [24,25]. Simultaneously, spatial statistical techniques, such as spatial interpolation and hot spot analysis have established the spatial relationship between the distribution of HMs and influencing factors. Nevertheless, the majority of studies have primarily concentrated on qualitative analysis [16,26]. The geographical detector is a technique employed to identify spatial heterogeneity and reveal its driving forces. It facilitates the analysis of the spatial relationship between the distribution of heavy metals (HMs) and influencing factors, allowing for the quantitative assessment of the contribution rate of these factors [23,27].
The Qinghai–Tibet Plateau (QTP), characterized by its sparse population, gradual urbanization, and industrialization, is widely acknowledged as one of the least polluted and cleanest regions globally [28]. Nonetheless, recent studies have indicated that the QTP is increasingly confronting the risk of nitrogen and phosphorus pollution, as well as HM pollution from agricultural and pastoral non-point sources [29,30]. Owing to the harsh environmental conditions of high cold and high altitude in the QTP, its ecosystem is fragile, demonstrating limited self-regulation and resistance to interference. It is highly susceptible to disruption and damage caused by human activities, with self-recovery being challenging and slow [31,32]. Historically, due to the unique plateau geographical environment, investigations into the distribution characteristics and influencing factors of non-point source pollution in the QTP have predominantly relied on a singular method or limited selected factors for analysis. For example, Wang et al. (2022) [30] conducted a quantitative assessment of non-point source pollution and its influencing factors in Rangtang County, QTP, utilizing remote sensing data and the ecological index (EI). They identified climate change and human activities as the primary contributing factors. In their investigation, Du et al. (2023) [33] concentrated on the QTP and employed a combination of statistical and spatial analysis methods. They noted spatial autocorrelation among seven HMs in the soil, suggesting that HM pollution is influenced by both human and natural factors. Yu et al. (2022) [34] discovered, through coupling analysis, a close association between the application of fertilizer containing N and P and agricultural non-point source pollution. Consequently, there is significant practical importance in systematically investigating the distribution characteristics and identification of non-point source pollution while considering various influencing factors.
Subsequent to the preceding discussion, we collected 44 samples of drinking water and 55 samples of cultivated soil in Gangba County, a representative region within the Tethys Himalaya tectonic domain. This study aimed to: (a) describe and analyze the concentration characteristics and spatial distribution of As, Cd, Cr, Ni, Pb, N, P, and K in soil and water within the study area; (b) assess pollution characteristics of HMs using ecological risk assessment models; (c) investigate the correlation and contribution rate between soil physical and chemical properties and HMs through redundancy analysis; (d) detect factors using the geographic detector model to determine the main controlling factors of soil HM accumulation and distribution. The findings from this cross-sectional study will provide insights for the prevention and control of agricultural and pastoral non-point source pollution and HM pollution.

2. Materials and Methods

The research framework of this paper is illustrated in Figure 1.

2.1. Study Area Description

Gangba County, situated between 88°08′20″–88°56′47″ E and 27°56′32″–28°45′27″ N, lies to the southeast of Shigatse City in Tibet, China. Positioned at the northern base of the middle Himalayas, it serves as a significant agricultural and animal husbandry production area within the Tethys Himalayan tectonic region (Figure 2). The seventh national census data reveal that Gangba County has a resident population of 11,276 individuals, encompassing Tibetan, Lhoba, and Han ethnic groups. Positioned in the southern part of the Tethys Himalayan tectonic domain and surrounded by numerous southern Tibetan streams, Gangba County becomes an ideal locale for assessing agricultural and pastoral non-point source pollution and heavy metal pollution.

2.2. Data Sources

2.2.1. Element Data of Soil and Water

A total of 44 water samples and 55 soil samples were collected from the study area between July and September 2022. While sampling, we recorded the coordinates of each sampling point using a handheld global positioning system (GPS) device. Figure 2 illustrates the location of the study area and the distribution of sampling points. We transported the collected soil and water samples to the laboratory, where each sample underwent collection and pretreatment following the procedure in Section 2.3.1. Sample collection and analysis method. As, Cd, Cr, Ni, Pb, N, P, K, and related physicochemical properties of the samples were determined.

2.2.2. Other Data

Additional data encompass DEM data, remote sensing data, soil type data, geospatial data, and per capita net income data, etc. DEM and remote sensing data are sourced from the Geospatial Data Cloud platform (www.gscloud.cn, accessed on 16 October 2023). Soil data originated from the World Soil Database (HWSD). Geospatial data were retrieved from OpenStreetMap (https://www.openstreetmap.org/, accessed on 15 October 2023). Additionally, per capita net income data for rural residents were obtained from statistical records of the Gangba County Statistics Bureau, and these data were discretized and rasterized using ArcGIS 10.8. In this investigation, DEM (X1), annual mean precipitation (X2), slope degree (X3), slope direction (X4), distance from river (X5), annual mean temperature (X6), vegetation type (X7), geomorphic type (X8), soil total nitrogen content (X9), soil total phosphorus content (X10), soil total kalium content (X11), land-use type (X12), per capita net income (X13), distance from road (X14), silt (X15), sand (X16), clay (X17), soil PH value (X18), soil bulk density (X19), soil cation exchange capacity (X20), organic carbon (X21), organic matter (X22) and geological type (X23) served as driving factors of soil HMs. The distribution of each factor is illustrated in Figure 3. Due to the large number of factors, considering the resolution and clarity of the image, Figure 3 is divided into Figure 3A,B.

2.3. Sample Analysis and Data Processing

2.3.1. Sample Collection and Analysis

Water samples were stored in a colorless polyethylene bottle (about 500 mL), which was washed with deionized water before collection and kept at 4 °C. Water samples were collected and stored according to the requirements of the GB/T 5750-2006 [35] Standard method for drinking water testing. Determination of Cd and Pb used inductively coupled plasma–mass spectrometry (ICP-MS, DRC-e, PerkinElmer, Massachusetts State, USA, LOD: 0.001 μg/L). Determination of Cr and Ni used inductively coupled plasma–optical emission spectrometry (ICP-OES, DRC-e, PerkinElmer, MA, USA, LOD: 0.001 μg/L). Hydride generation atomic fluorescence spectrometry (HG-AFS, AFS-9780, haiguing, Beijing, China, LOD: 0.01 μg/L) was used to determine the concentration of As (1 mL 2.5% thiourea and 2.5% ascorbic acid, respectively).
Soil samples: Approximately 0.05 g of topsoil was collected for each sample. The 3:3:1 acidic mixture of HNO3, HF, and HClO4 was added and heated at 180 ± 10 °C until the solution became transparent. Cd and Pb were determined by inductively coupled plasma–mass spectrometry. Determination of Cr and Ni used inductively coupled plasma–optical emission spectrometry. Hydride generation atomic fluorescence spectrometry was used to determine the concentration of As (1 mL 2.5% thiourea and 2.5% ascorbic acid, respectively).
The content of nitrogen (N), phosphorus (P), and kalium (K) was determined by ion chromatography (IC).
Quality assurance was achieved through the use of certified external national reference materials and repeated measurements (repeated sample measurements after every 10 samples) in the analysis process: (1) a cationic external label solution was configured using a multi-element ICP-MS calibration standard (batch number 15–76 JB, catalog number N9300233); (2) GB W10011 (wheat), GB WI0015 (vegetables), and GB WI0044 (rice) were used as raw materials to prepare national standard materials for food; (3) using GBW07449 preparation (Xinjiang Shanshan saline alkali soil) and GBW07447 (Hangjin Houqi saline alkali soil of Inner Mongolia) as raw materials, the national standard materials for soil were prepared. The relative error (equivalent ratio) of each GB sample was less than 5.00%, and the correlation coefficient was greater than 0.999. Therefore, it can be said that our analysis method and data are reliable and accurate.

2.3.2. Data Processing and Analysis

This study employed SPSS 26.0 software for conducting descriptive statistics on the concentrations of eight selected elements in both soil and water. Spatial distribution maps for the concentrations of the eight selected elements in both soil and water within the study area were created using inverse distance weighted (IDW) interpolation in ArcGIS 10.8. Factors influencing the spatial distribution of HMs in soil were investigated using the geographical detector model in conjunction with R 4.3.2 software. Canoco 5.0 software was utilized to analyze the correlation between the soil HMs and their respective physical and chemical properties. The results were graphically represented using Origin 2023.

2.4. Ecological Risk Assessment

We applied the revised potential ecological risk method to evaluate the pollution status of water–soil system in the study area, represented by Expressions (1) and (2):
P E R I = ( C s S s + C w S w ) × T r i
R I = P E R I i
where, in Equation (1), Cs and Cw denote the measured concentrations of HMs in soil and water, respectively. Ss represents the background value of Tibetan soil, with concrete values of As, Cd, Cr, Ni, and Pb being 19.7, 0.081, 76.6, 32.1, and 29.1 mg/kg, respectively [36]. Sw denotes the standard limit value in water, with concrete limit value of As, Cd, Cr, Ni, and Pb being 10, 5, 50, 20, and 10 μg/L, respectively [37]. T r i represents the toxic reaction coefficient of each HM, which was first proposed by Hakanson L (1980) [38]. The toxic reaction coefficients of As, Cd, Cr, Ni, and Pb being 10, 30, 2, 5, and 5, respectively [38]. In Equation (2), RI represents the total of the Potential Ecological Risk Index (PERI) of each HM, with the classification standards detailed in Table 1 [38].

2.5. Redundancy Analysis

Redundancy analysis (RDA) is a sequential method used to elucidate the relationships between elements and the physical and chemical properties of soil. It enables a comprehensive analysis of the influence of multiple variables and an effective evaluation of one group of variables on another. Conceptually, RDA is the principal component analysis of the fitting value matrix of multiple linear regression between the response variable matrix and explanatory variable matrix, and it is also an extension of the multiple response variable regression analysis [39]. The calculation principle of redundancy analysis is illustrated in Figure 4. The Y matrix is the standardized response variable matrix, and the X matrix is the standardized explanatory variable matrix. This method minimizes information loss during processing.

2.6. Geographic Detector Model

The Geographical Detector is a suite of statistical methods designed to identify spatial differentiation and elucidate its underlying factors. The model encompasses four detectors: the factor detector, interaction detector, ecological detector, and risk detector [27]. This paper specifically employs the factor detector based on research requirements.
Factor detector: This component identifies the spatial hierarchical heterogeneity of variable Y by detecting a factor X. It gauges the degree of spatial hierarchical heterogeneity of attribute Y, measured by the q value, as illustrated in the following Formula (3):
q ( Y | h ) = 1 1 N σ 2 h = 1 L N h × σ h 2
where Y is the impact factor, indicating the partition or type of the impact factor. q(Y|h) represents the power of the determinant Y over h. N represents the total number of samples in the study area, and σ 2 represents the variance of h. σ h 2 represents the discrete variance of h over a subregion of the property. The value of q ranges from 0 to 1. If the element content is completely related to an influence factor, then q = 1, while q = 0 means that this association does not exist, and it is a completely random spatial event. Larger q values indicate stronger spatial associations, and q values represent the extent to which element content is determined by a risk factor.

3. Results and Discussion

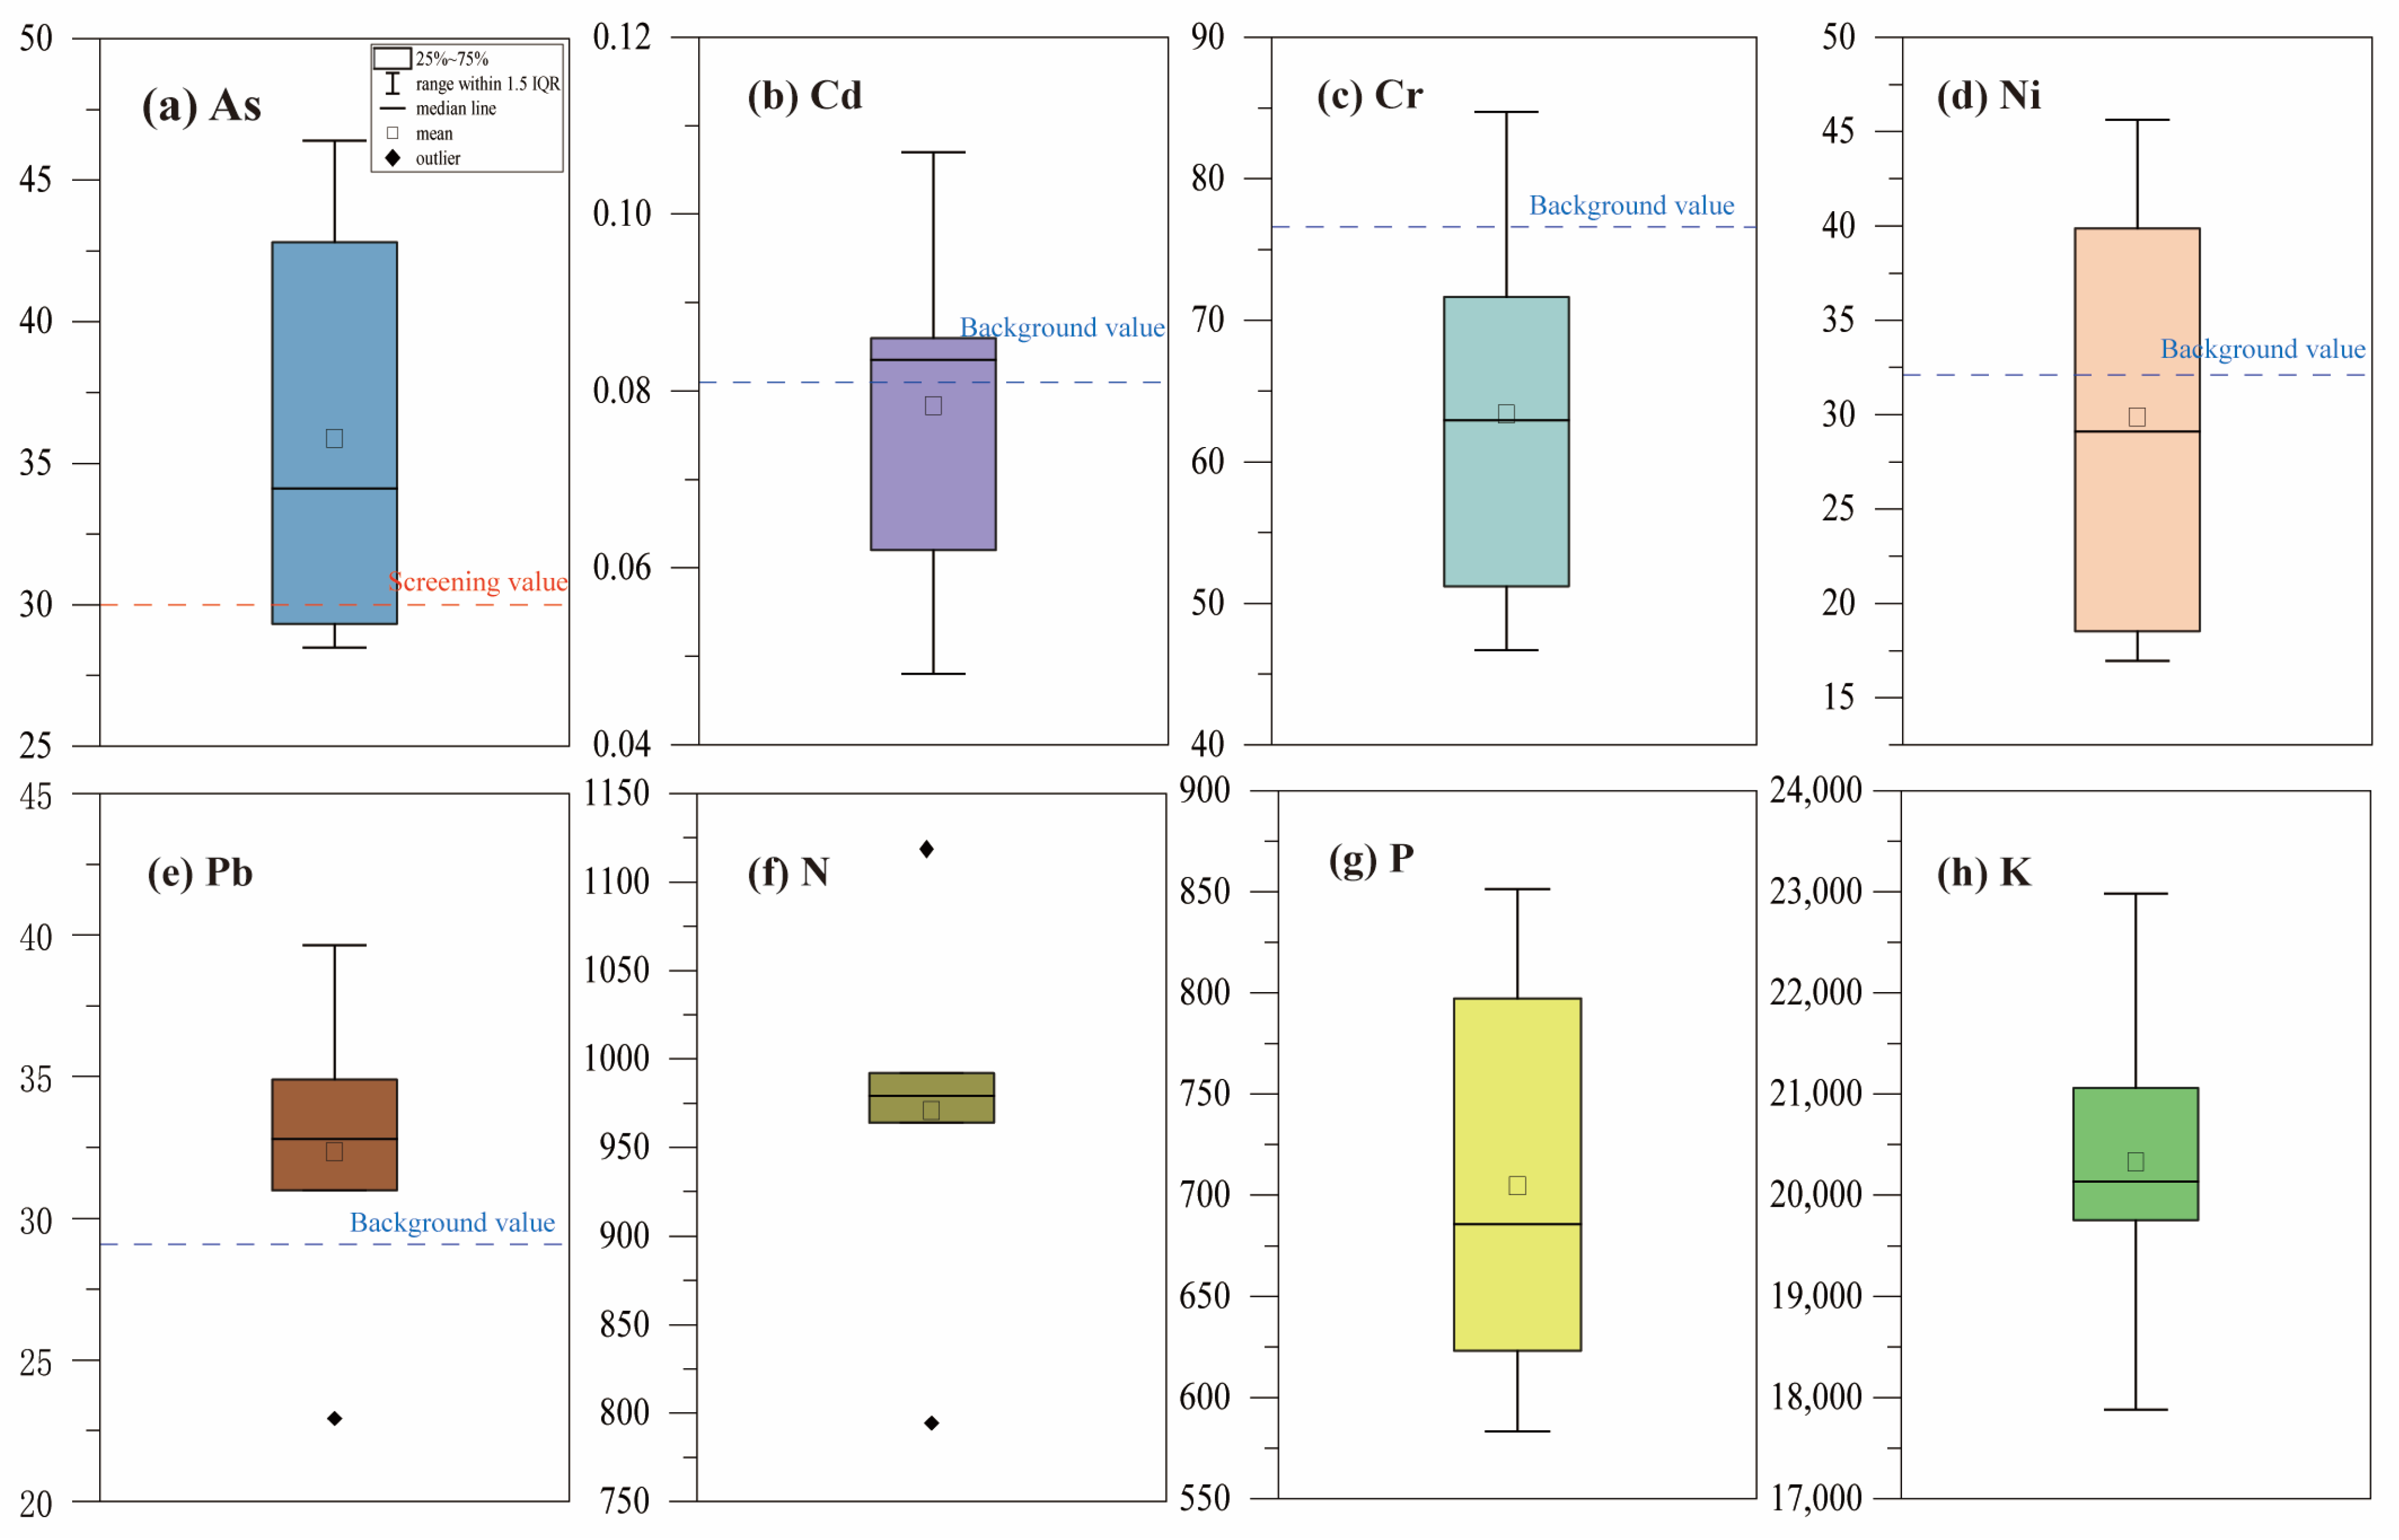
3.1. Descriptive Statistics of Concentrations of Eight Selected Elements

Table 2 presents the descriptive statistical results of the average concentrations of As, Cd, Cr, Ni, Pb, N, P, and K in the soil and water of each township in the study area. The concentrations of As in soil across all townships, Cd in soil in Gangba, Kongma, and Longzhong Townships, Cr in soil in Longzhong Township, Ni in soil in Kongma and Longzhong Townships, and Pb in soil in Changlong, Kongma, and Zhike Townships were slightly above the Tibetan soil background value [36] (Table 2 and Figure 5). With the exception of higher-than-screening-value average concentrations of As in Changlong, Gangba, and Zhike Townships, the average concentrations of Cd, Cr, and Pb in soil across all townships were below the screening value (the screening value of As, Cd, Cr, and Pb being 120, 3, 1000, and 700 mg/kg, respectively) [40]. The average concentrations of all five HMs in the soil were below the control values (the control value of As, Cd, Cr, Ni, and Pb being 30, 0.3, 200, 100, and 120 mg/kg, respectively) [40]. Gangba Township had the highest soil N concentration, while Kongma Township had the lowest. In the study area, the coefficient of variation, kurtosis, and skewness of N and P were higher. A high coefficient of variation indicates significant influence by human activities [41]. The predominant activity in the study area is agriculture, and the use of nitrogen and phosphate fertilizers in agricultural practices contributes to this phenomenon. Overall, the soil quality in the study area was deemed satisfactory.
The average concentrations of As, Cd, Cr, Ni, Pb and N, P, and K in drinking water across the five townships in the study area were all within the standard limits for drinking water quality [37] (Table 2 and Figure 6). Nevertheless, the high kurtosis and skewness of As, Cr, and N, along with the elevated coefficient of variation, suggest that these elements in the water are influenced by both human activities and environmental factors [42]. Overall, the water bodies in the study area are stable, exhibiting good water quality suitable for drinking purposes.

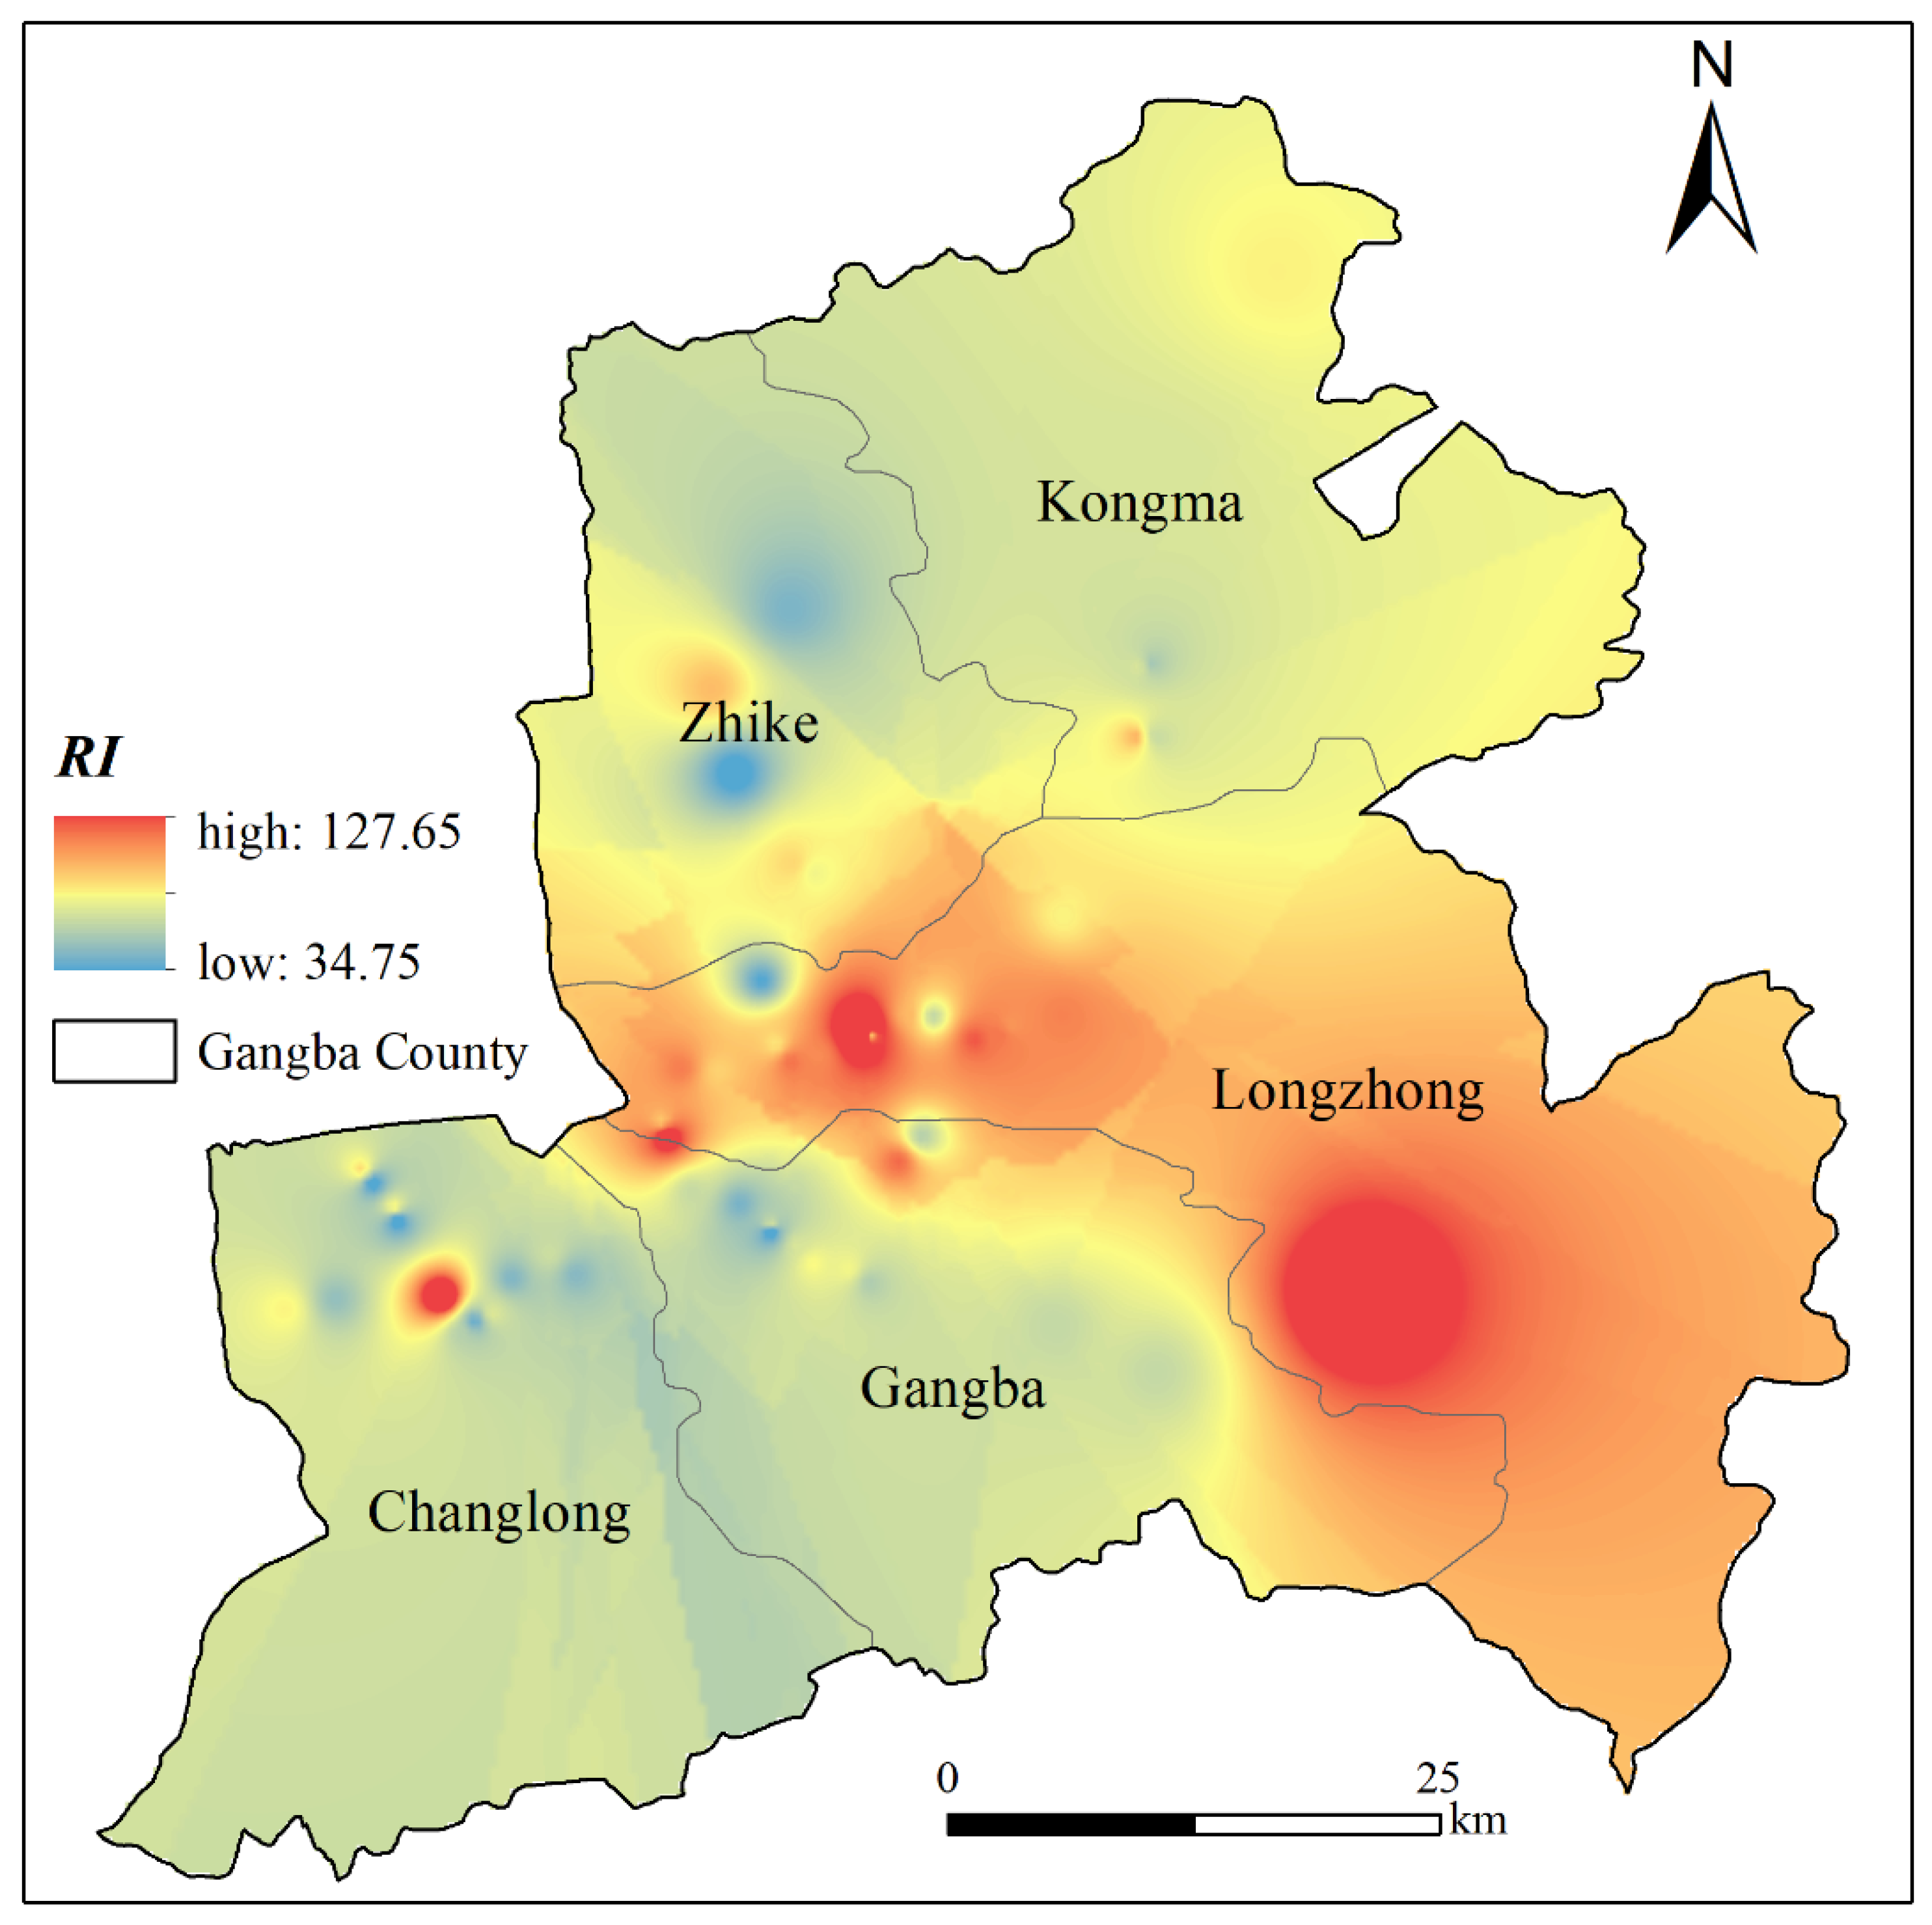
3.2. Spatial Distribution Characteristics of Eight Selected Elements

Figure 7 illustrates the spatial distribution pattern of As, Cd, Cr, Ni, Pb, N, P, and K in both soil and water across the study area, employing the inverse distance interpolation method.
The distribution characteristics of As and Pb in the soil exhibited similarity, with elevated concentrations in Zhike Township in the western region, Changlong Township in southwest region, and the northern part of Kongma Township. The southeastern part, particularly Longzhong Township, represents the high-value area for Cd. The Cr and Ni exhibit similar distribution patterns, with Longzhong Township serving as the boundary, the north corresponds to high-value areas, and the south to low-value areas. The distribution of N, P, and K does not exhibit clear patterns. The N shows a distribution trend with high concentrations in the southeast and predominantly low concentrations in Kongma Township. The P distribution is bound by the east of Zhike and Gangba Townships, with the eastern region showing high concentrations and the western region showing low concentrations, except for the northwest of Changlong Township, which exhibits elevated concentrations. The distribution of K and P exhibited an inverse trend, with the eastern parts of Zhike and Gangba Townships serving as the boundary, high concentrations in the west, and low concentrations in the east.
The spatial distribution of As and Cr in water exhibits lower concentrations in the southwest and higher concentrations in the northeast. The spatial distribution trend of Cd, N, and P is bounded by Zhike and Longzhong Townships, displaying higher concentrations in the northwest-southeast belt shaped area distribution, while the remaining area exhibits lower concentrations. The distribution of Pb is bounded by Longzhong Township, with high concentrations in the north and low concentrations in the south. The distribution of Ni exhibits high concentrations in the areas extending from the northeast to the southwest. The northern part of the study area, primarily comprising Zhike and Kongma Townships, is characterized by lower concentrations, while the southern part, mainly represented by Gangba Township, exhibits higher concentrations. The distribution of K exhibits lower concentrations in the southern regions (Changlong and Gangba Townships), a portion of the central region (Longzhong Township), and the northwestern region (Zhike Township). Conversely, higher concentrations prevail in the remaining areas, lacking discernible distribution patterns.
In general, Gangba and Longzhong Townships exhibit a high concentration of soil elements in the study area. According to China County Statistical Yearbook (Township Volume)-2019 [43], Gangba and Longzhong Townships are the only two townships in the study area with comprehensive stores with a business area of exceeding 50 square meters. Consequently, their economic development surpasses that of others, a progression often accompanied by frequent human activities, such as the irrational use of chemical fertilizers and pesticides in agricultural production. This contributes to elevated soil element concentrations in these townships in the study area compared to others. Additionally, the northern and eastern topography in the study area is more intricate, and the geological activities may be more active, potentially leading to heightened element concentrations through biogeochemical cycles. Conversely, Kongma Township stands out as a water element concentration hotspot. Kongma Township is positioned in the northern part of the study area, and it benefits from richer vegetation types, aiding water storage. Moreover, the study area, being a typical agricultural and pastoral region, sees water from agricultural irrigation, sewage treatment and other behaviors infiltrating groundwater via leaching in biogeochemical circulation, potentially explaining the water body’s elevated element concentrations in this area.

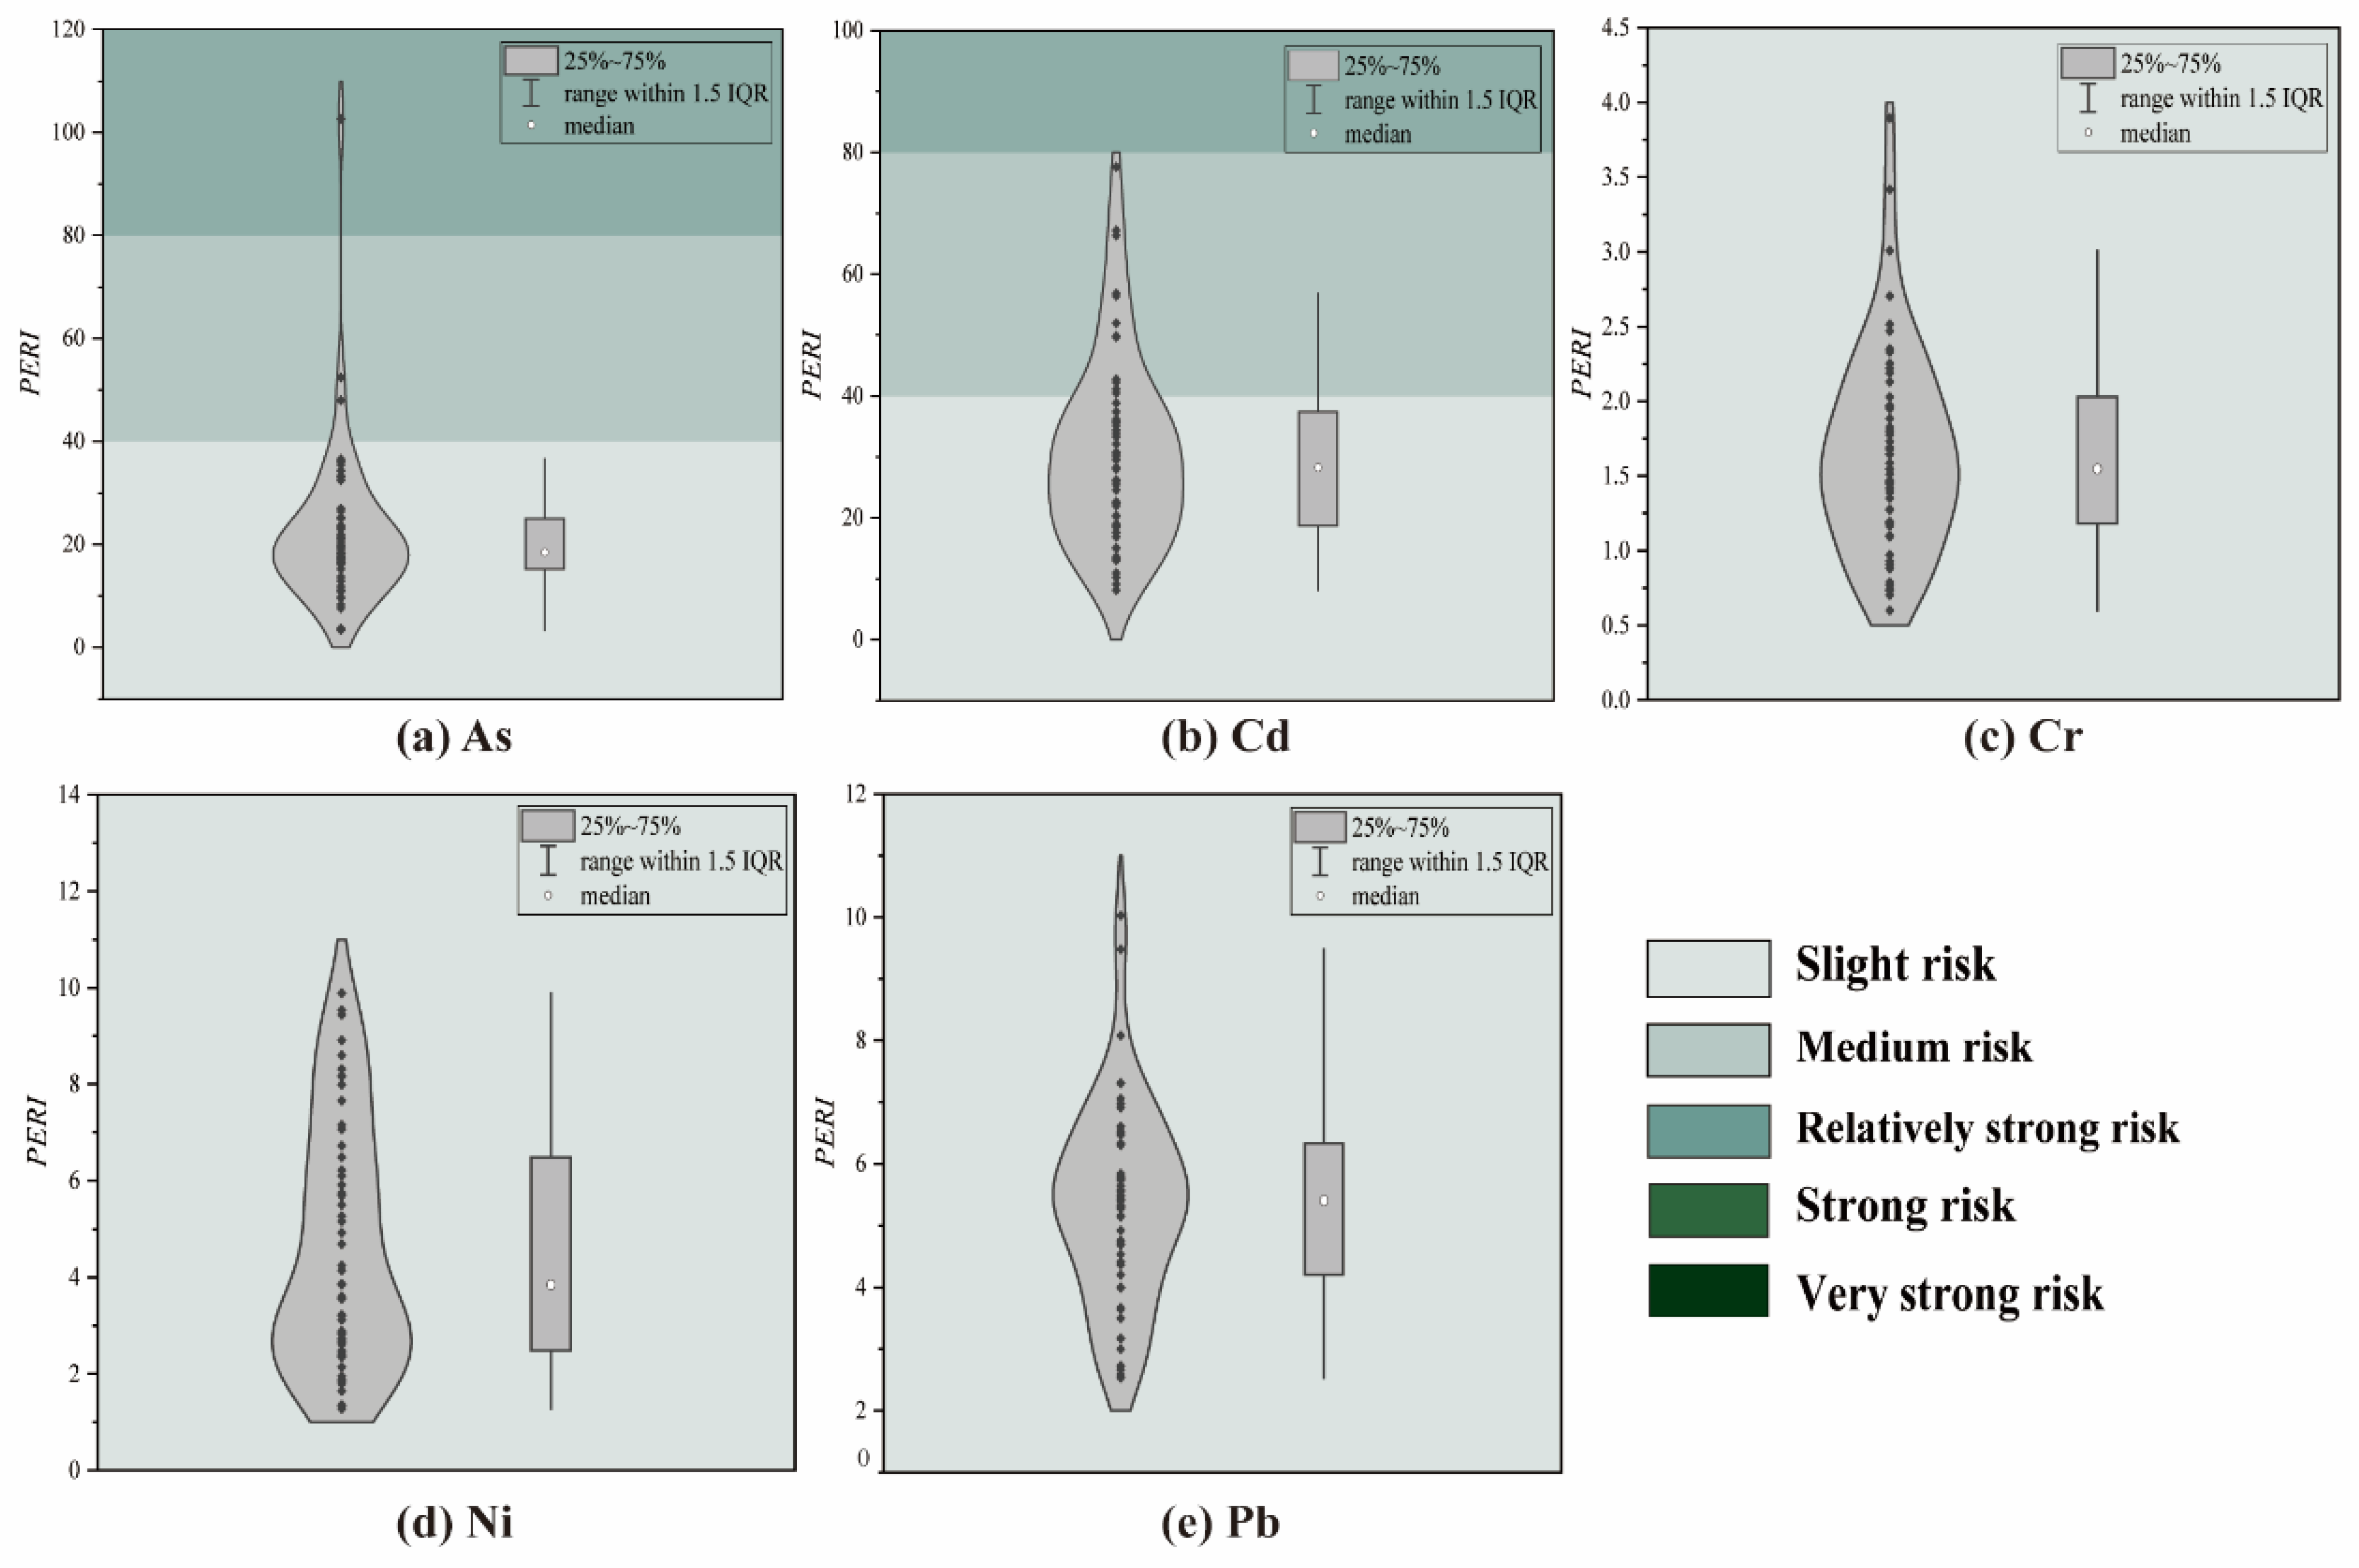
3.3. Pollution Characteristics of Heavy Metals in the Water–Soil System

According to the outcomes of the potential ecological risk assessment, the PERI values for Cr, Ni, and Pb in the investigated area registered 100% at the slight risk level (Figure 8). Additionally, 1.86% and 3.64% of As posed medium and relatively strong risk levels, respectively. Moreover, 21.8% of Cd exhibited a medium risk level (Figure 8). This suggests that HM pollution in the study area is minimal. Overall, the RI values varied from 34.75 to 127.65, all below 160, indicating a low ecological risk throughout the study area. The extent of HM pollution is slight, signifying good soil quality. The zones with higher RI values were primarily concentrated in the western to southeastern regions of the study area, exhibiting a zonal pattern. Specifically, the western part of Longzhong Township and the northwestern segment of Gangba Township were identified as the principal areas with elevated RI values (Figure 9).
The PERI and RI values highlight the significant role of soil as the primary medium for ecological risk in the study area. The PERI associated with five HMs in soil contributes to over 90% of the RI. Xu et al. (2023) [44] underscored the pivotal role of soil in the biogeochemical cycle of HMs. Among the HMs considered, Cd emerges as the primary contributor to the RI, constituting 76.8% of the total. The reason for this result may be due to the higher toxicity response factor of Cd [22]. A comparison of the spatial distribution maps of DEM (Figure 3a) and RI (Figure 9) across the entire study area reveals an inverse relationship: the high RI values in the west and southeast correspond to low DEM values. Danladi et al. (2017) [45] demonstrated that elevated DEM values correspond to reduced ecological risk. Situated in the southeast of the Tethys Himalaya tectonic domain, Gangba County experiences heightened geological tectonic activity, leading to the release of HMs from geological strata into the surface environment. Furthermore, the western to southeastern region of the study area exhibits a high per capita income (Figure 3m), and the proximity of this region to rivers (Figure 3e) and roads (Figure 3n) suggest that human activities contribute to ecological risks. Research indicates that soil pH significantly influences soil ecological processes and functions [46]. The region with elevated soil pH values in the study area (Figure 3r) aligns with the high RI values, corroborating earlier findings. Hence, the ecological risk in the study area is collectively influenced by geography, geology, ecological environment, and human activities.

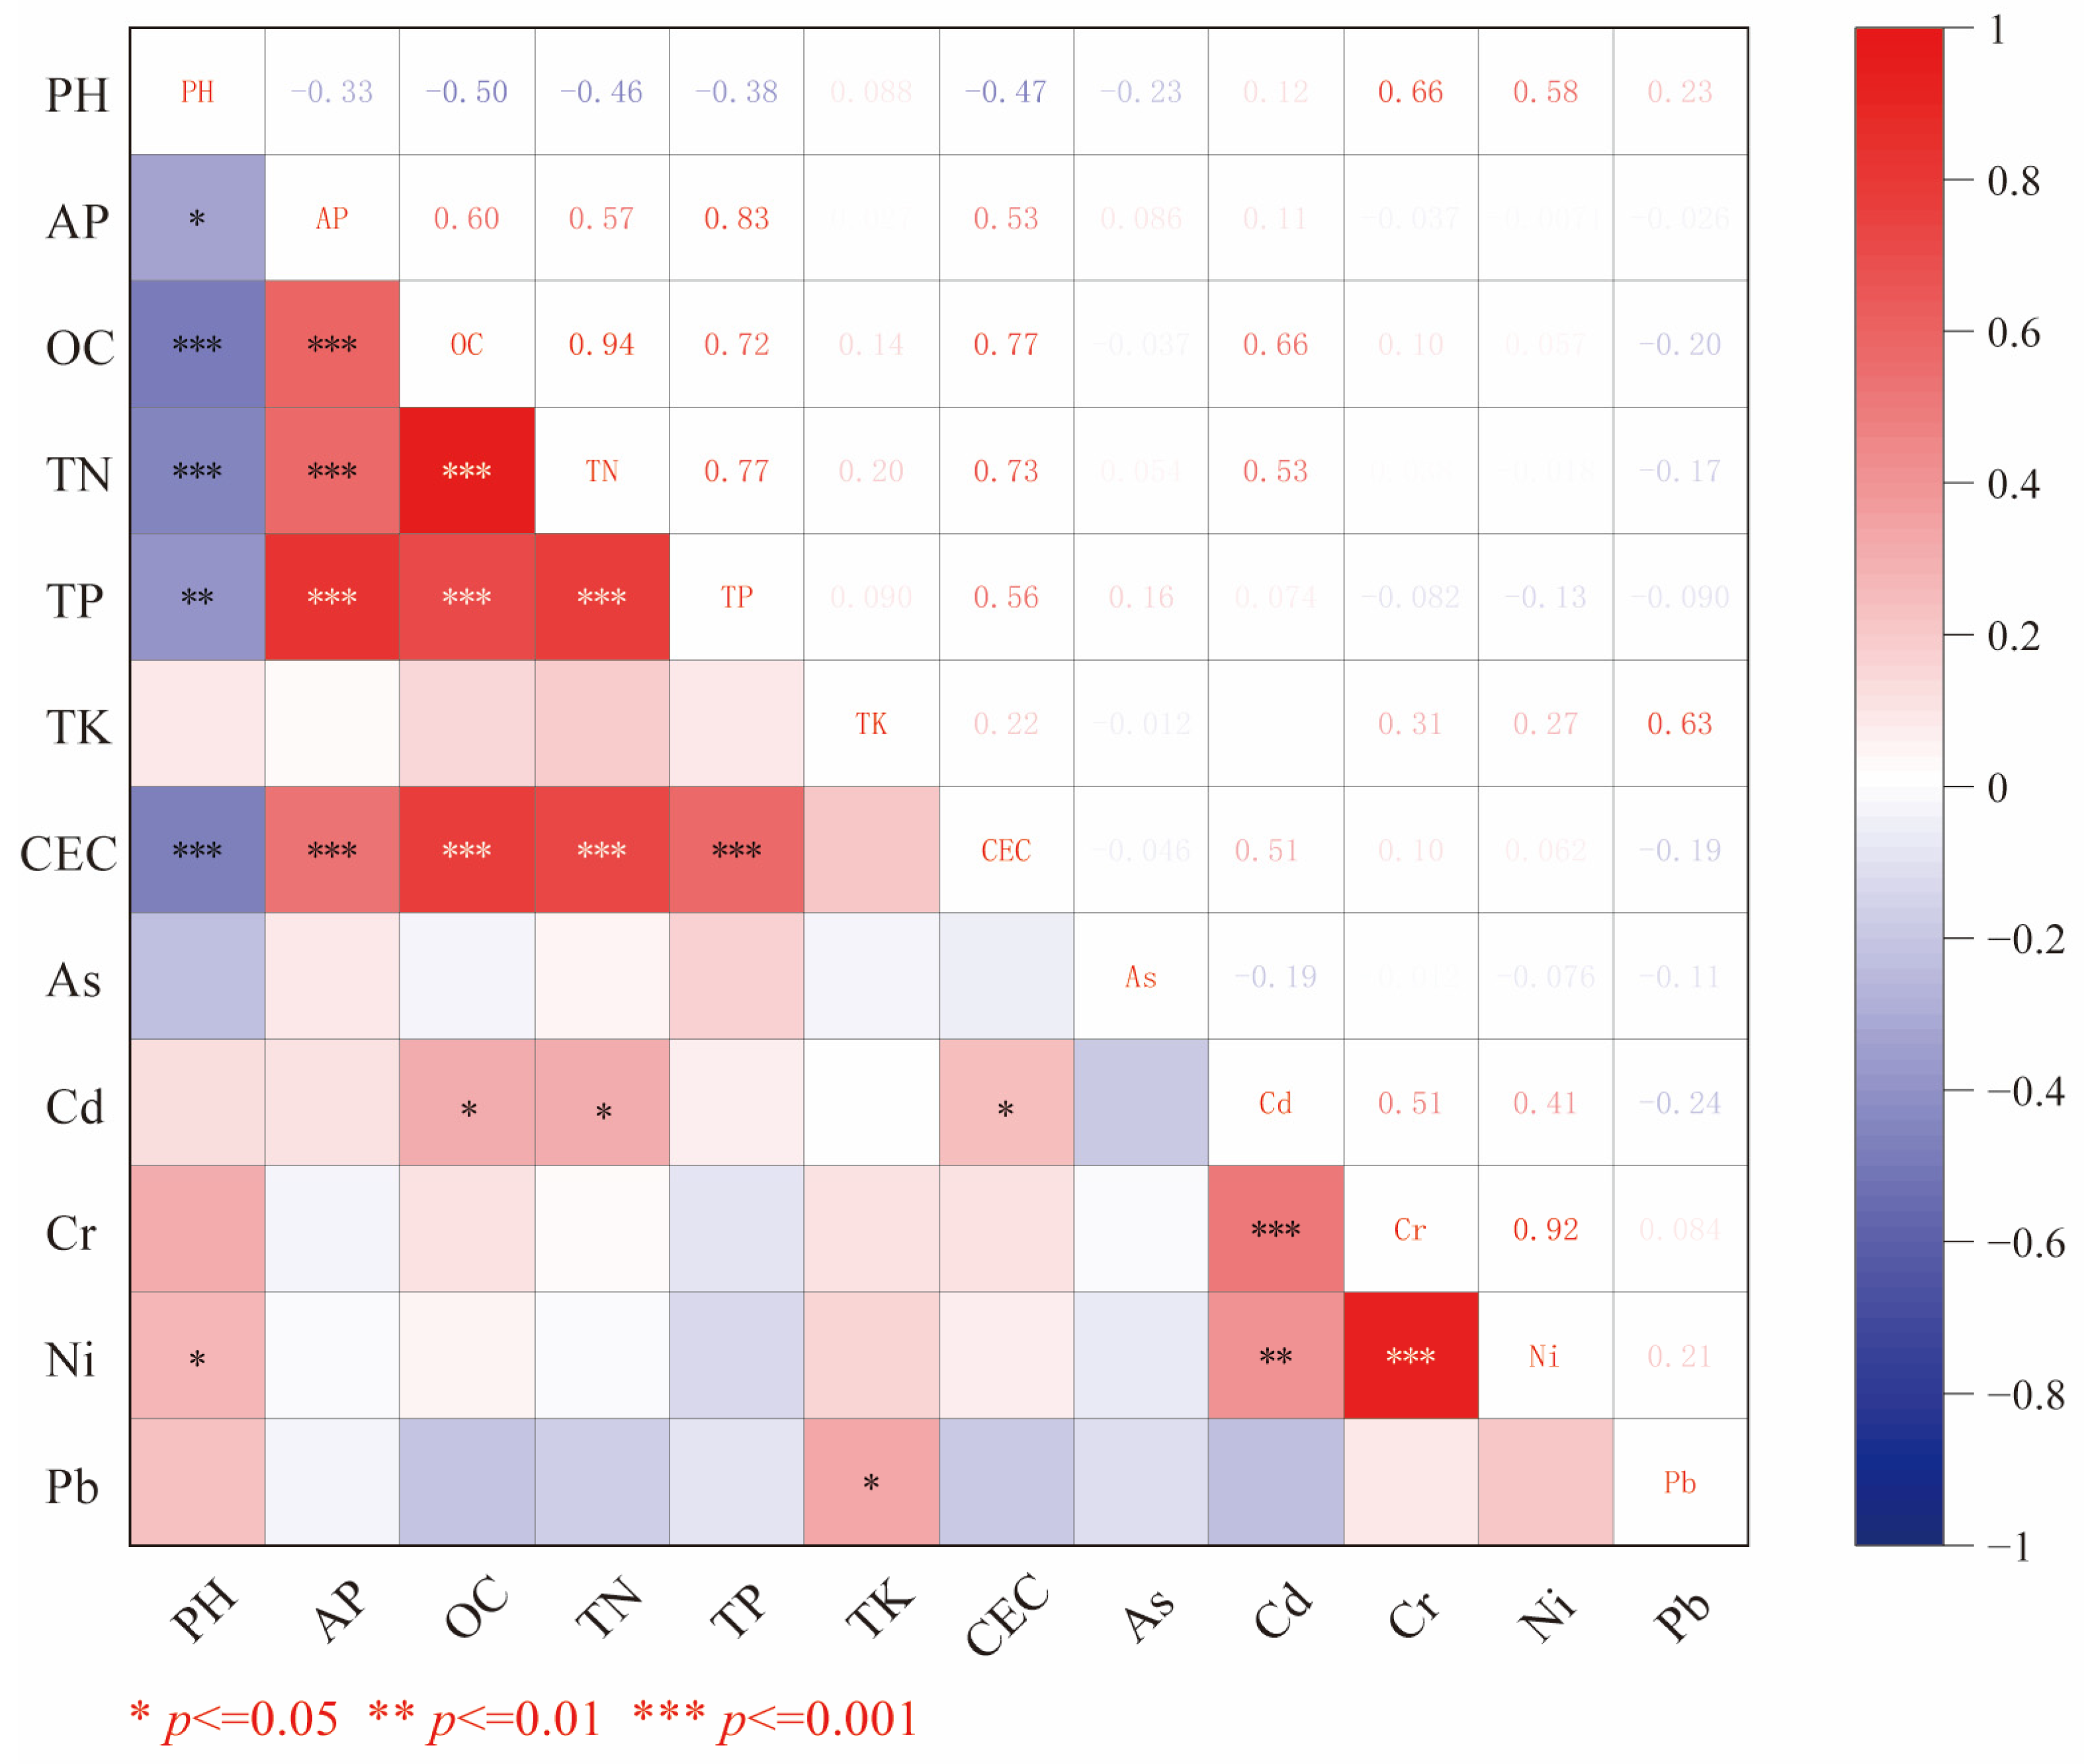
3.4. Effects of Soil Physicochemical Properties on Heavy Metals

The RDA in Canoco 5.0 was employed to investigate the correlation between soil HMs and soil physical and chemical properties. Soil HM concentrations are depicted by blue arrows, while soil physical and chemical factors are represented by red arrows. The length of the arrows indicates the strength of interpretation. A positive correlation between soil HM concentration and physicochemical factors occurs when the arrow angle (β) is between 0° and 90°. A β value of 90° signifies no correlation, while 90° < β < 180° indicates a negative correlation. A smaller angle corresponds to a stronger correlation [47]. The results of RDA physicochemical property analysis revealed that the first and second axes explained 77.71% and 16.99% of the total variation, respectively, contributing to a combined explanation of 94.7% (Figure 10).
Redundancy analysis revealed the order of explanatory importance for soil physical and chemical properties as TK > CEC > pH > OC > TP > TN > AP (Figure 10). The heat map of the correlation coefficient between heavy metals and physical and chemical properties of soil is shown in Figure 11. Combined with the redundancy analysis results and the correlation coefficient heat map, As exhibits positive correlations with TP, AP, and TN, while showing negative correlations with OC, CEC, pH, and TK. Cd strongly correlates positively with TN, OC, and CEC. It also shows positive correlations with TP, AP, and pH, but negatively correlates with TK. Cr strongly correlates positively with pH and shows positive correlations with TK, OC, and CEC. It negatively correlates with AP and TP and exhibits no correlation with TN. Ni strongly correlates positively with pH and shows positive correlations with TK, OC, and CEC. It negatively correlates with AP and TP and exhibits no correlation with TN. Pb strongly correlates positively with TK and shows positive correlations with PH. It negatively correlates with OC, CEC, TN, AP, and TP.
Soil physicochemical properties influence the geochemical behavior of heavy metals [48]. The study area primarily relies on agricultural and pastoral practices, involving the application of fertilizers with N, P, and K, and pesticides to enhance soil fertility for higher grain yields. Research indicates a close correlation between the accumulation of soil As and the improper use of chemical fertilizers and pesticides [49]. However, due to water resource scarcity and increasing costs of fertilizers and pesticides, farmers resort to untreated sewage for irrigating and fertilizing farmland, leading to the buildup of soil As, causing soil HM pollution and agricultural non-point source pollution. Therefore, As is mainly related to human activities. Soil PH directly influences the activity and mobility of HMs [50]. Soil organic matter exhibits strong complexation and enrichment capacity for HMs in the parent material [51]. Studies indicate that Cr and Ni are inherited through biogeochemical cycles from the weathering of the parent material, and the parent material significantly influences the accumulation of Cr and Ni in the soil [52,53,54]. Cd is associated with the base material and coarse debris matrix. Cd in the deposit is leached and transported to the surrounding soil by surface runoff, thereby increasing its concentration [55]. The study area exhibits an active geological structure and strong plate movement, leading to the enrichment of heavy metals, such as Cd, Cr, and Ni. Therefore, Cr, Cd, and Ni are mainly related to natural activities. The accumulation of Pb is significantly influenced by its distribution along farmland roads [56]. The study area, being a typical agricultural and pastoral region, witnesses the emission of waste gas containing Pb from motor vehicles, agricultural machinery, and equipment. The deposition of this waste gas results in soil pollution. Additionally, the accumulation of Pb is influenced by environmental factors, including rainfall and organic matter [57]. Hence, Pb is predominantly associated with agricultural practices and environmental factors.

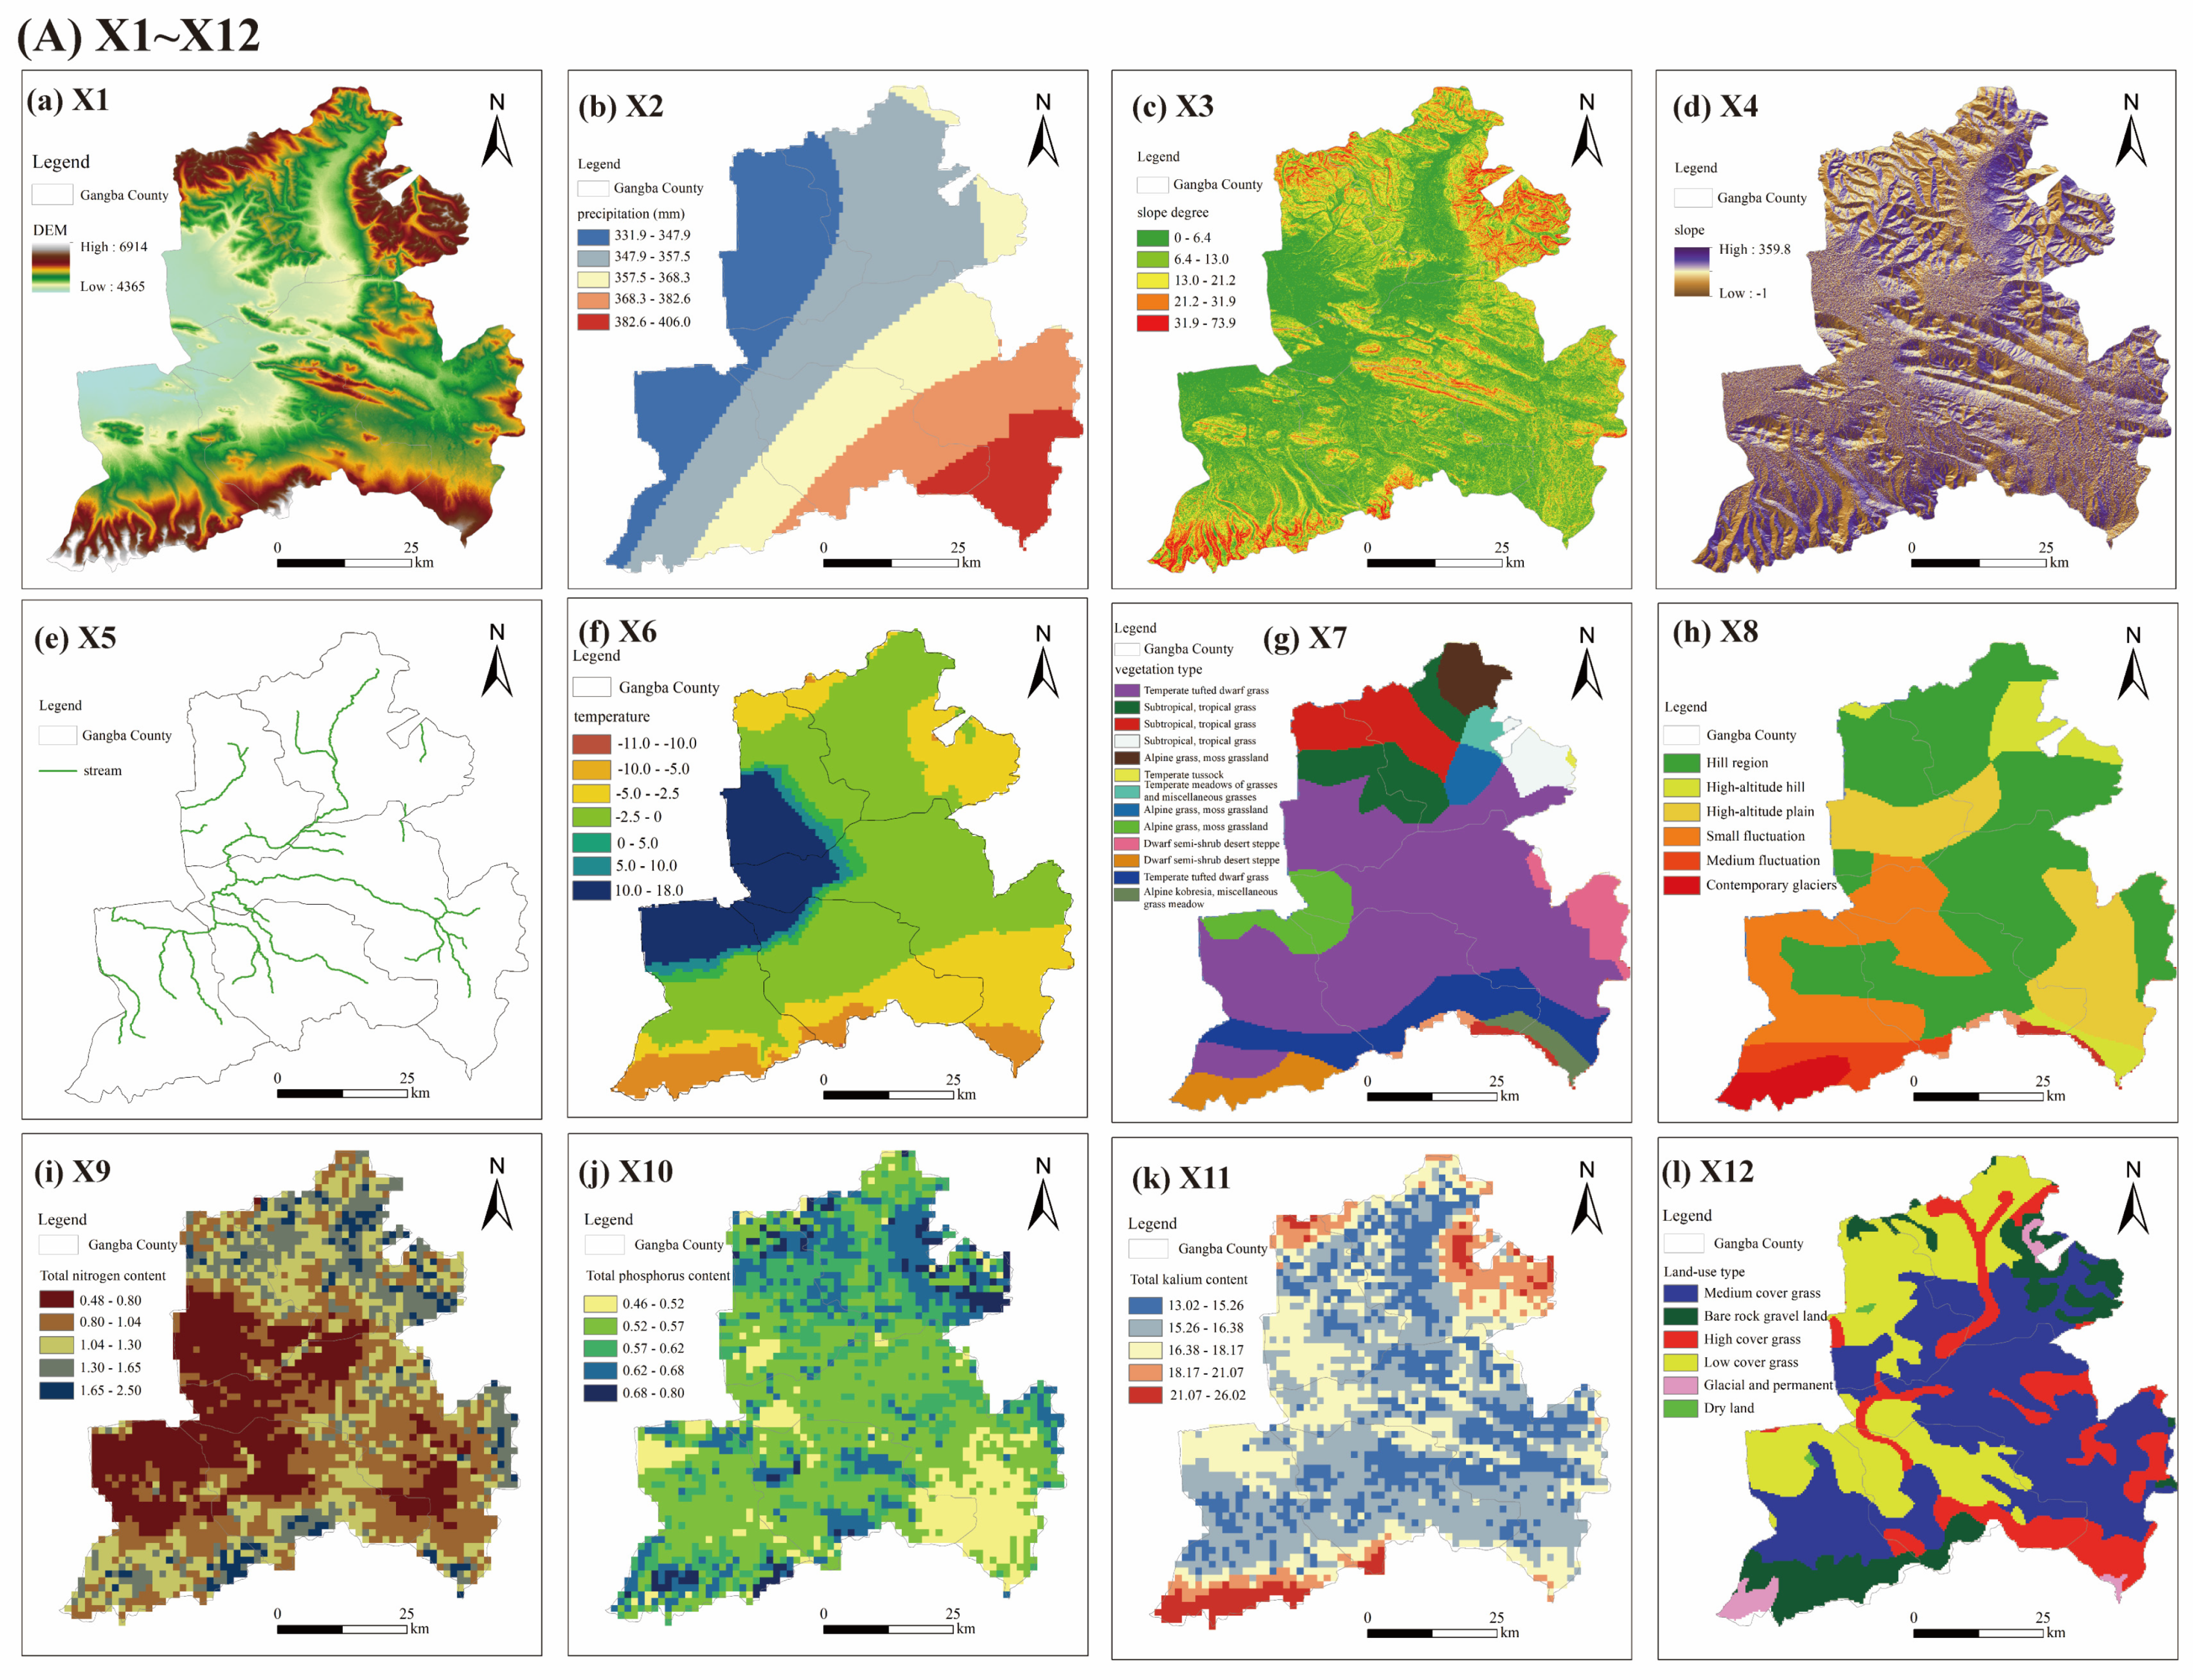
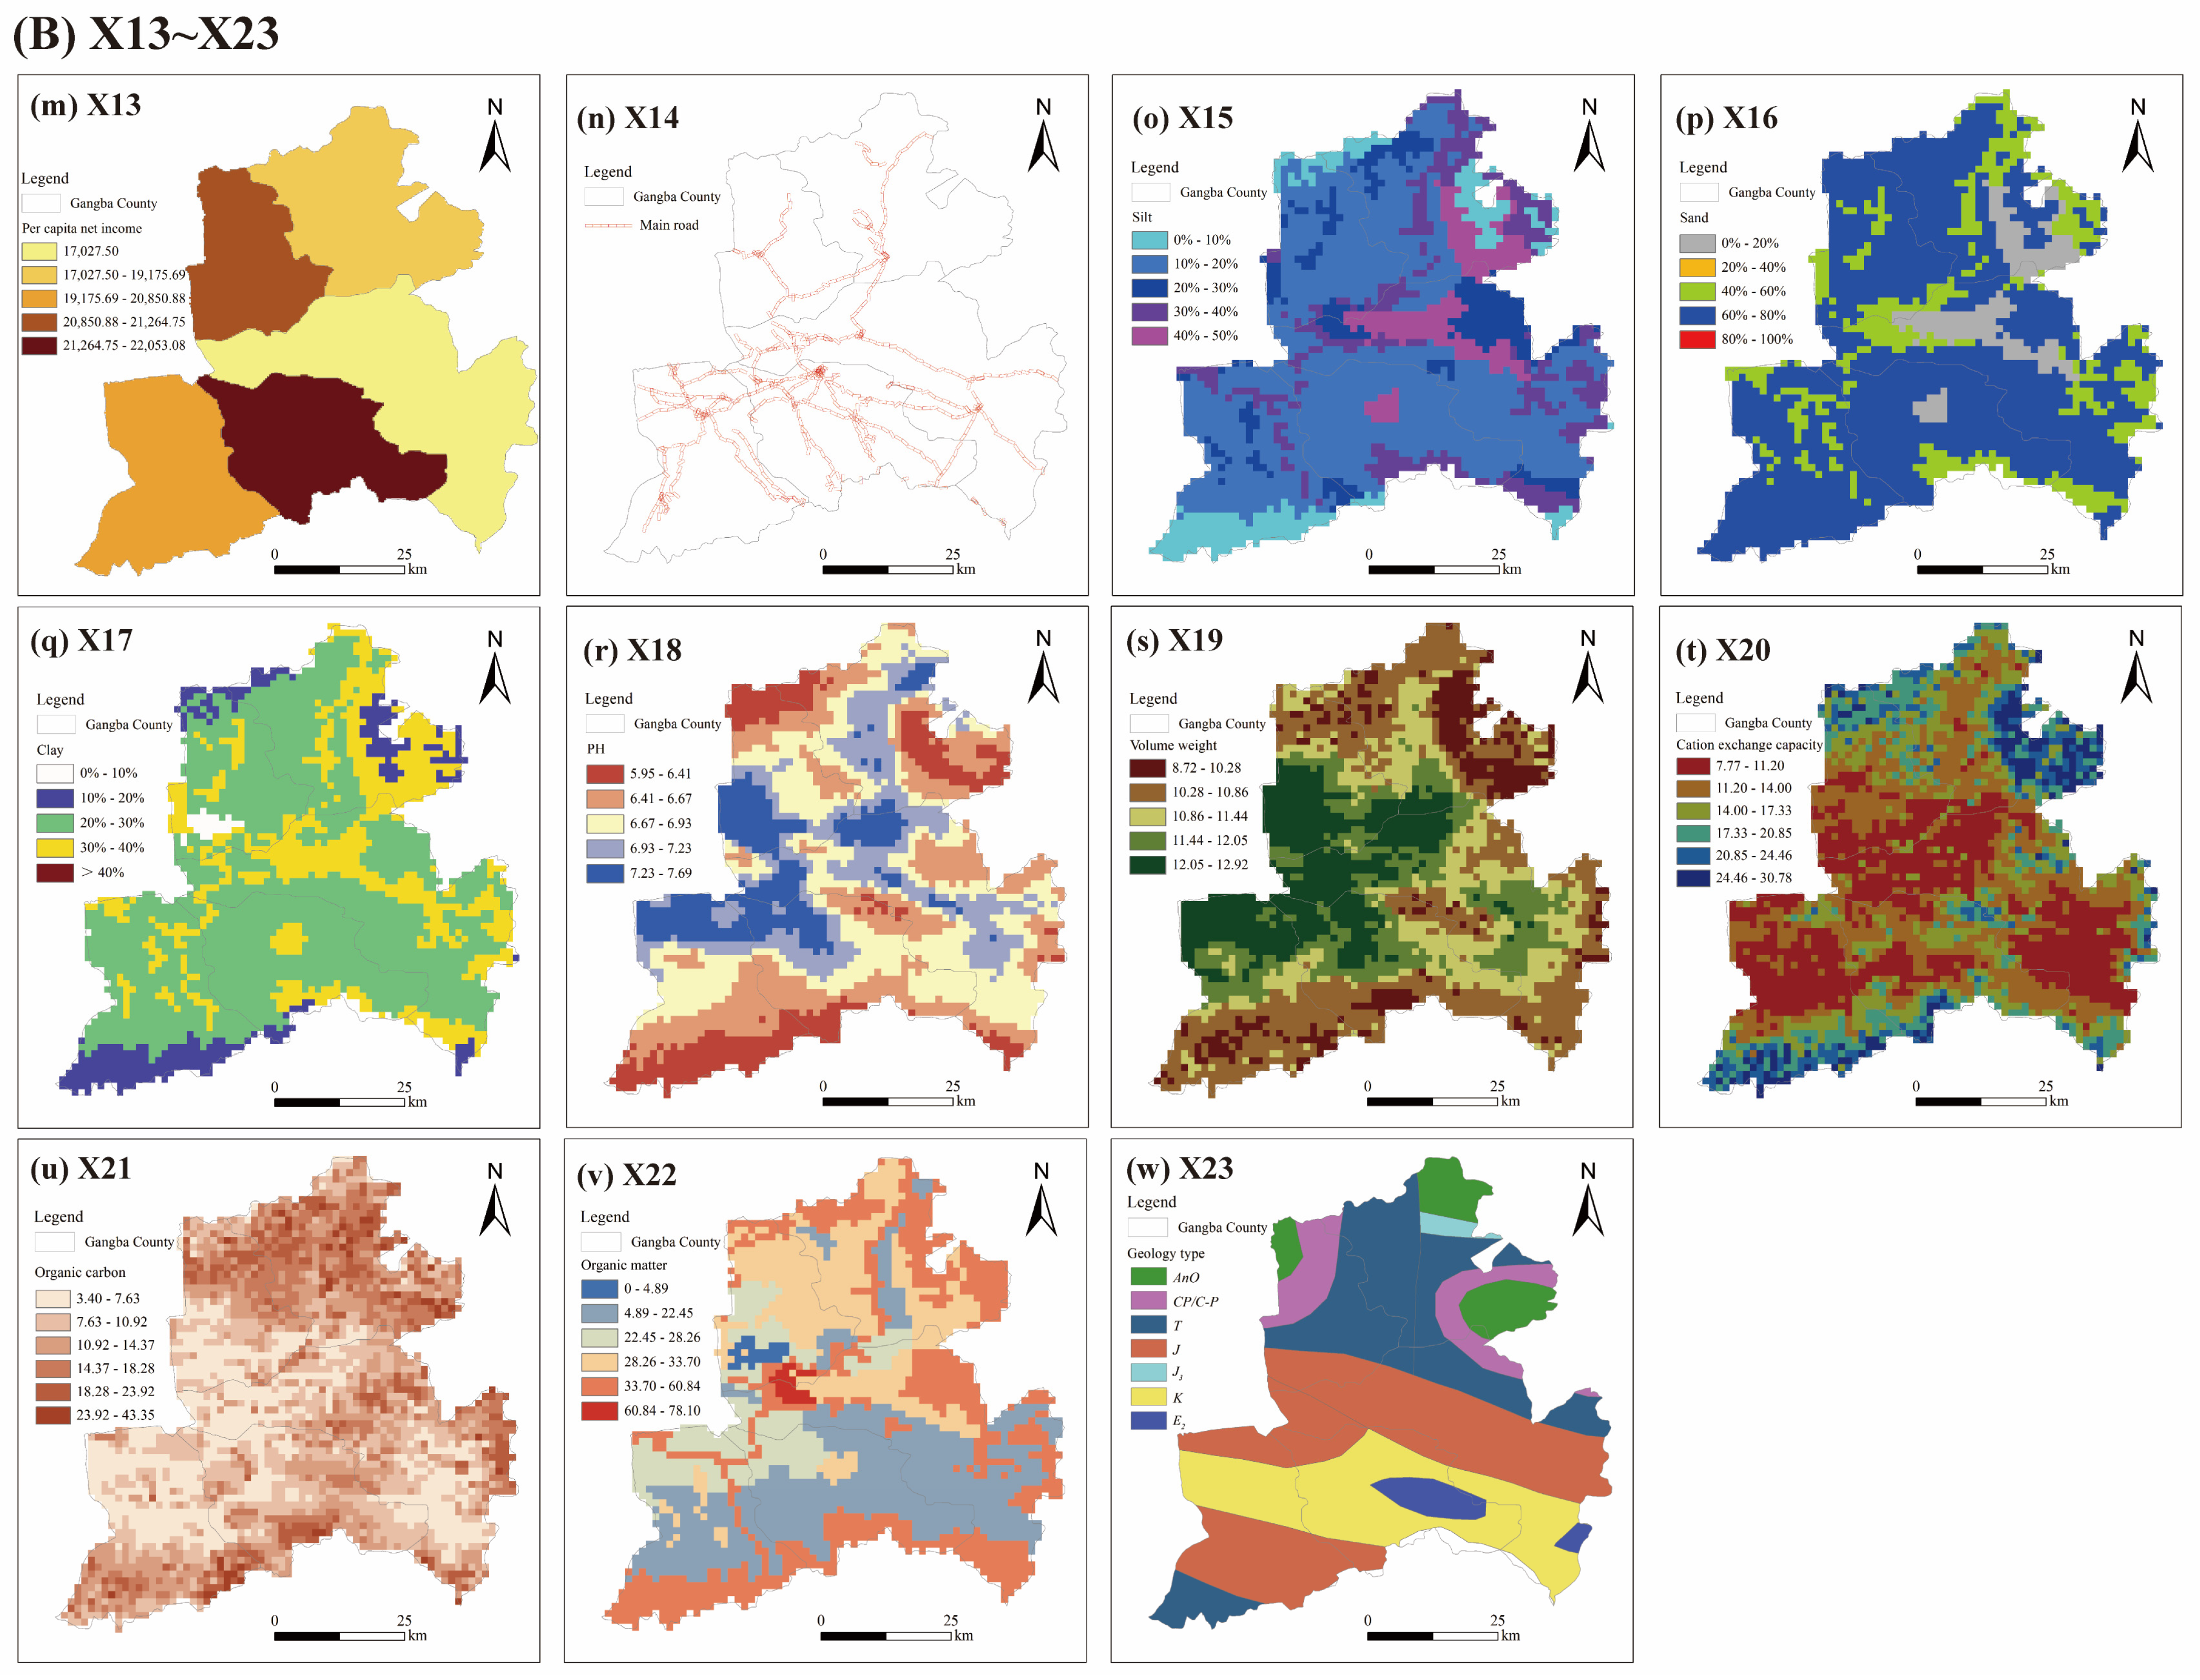
3.5. Factors Affecting the Spatial Distribution of Heavy Metals in Soil

This study synthesizes insights from the literature review and redundancy analysis to identify three key contributors to the spatial distribution of soil HM concentrations: natural, environmental, and human factors. The investigation focuses on eight natural factors (DEM, annual mean precipitation, slope degree, slope direction, distance from river, annual mean temperature, vegetation type, and geomorphic type), six human factors (TN, TP, TK, land-use type, per capita net income, and distance to road), and nine environmental factors (silt, sand, clay, PH, bulk density, cation exchange capacity, organic carbon, organic matter, and geological type) to analyze their impact on the spatial variation of soil HMs. The target attribute Y comprises the measured concentrations of five HMs, while independent variables X1 to X23 encompass the influencing factors. According to the geographic detector model, with the help of R 4.3.2 software, we import the “GD” package, input the corresponding code, and view the factor detection results to obtain the q values of each driving factor (Table 3).
The q values representing the explanatory power of 23 factors, as detected by the factor detector for 5 HMs, are illustrated in Figure 12. Varied driving factors with q > 1 were identified for each HM. Specifically, for As, the prominent factors were per capita income (0.316), geological type (0.136), sand (0.127), organic matter (0.121), annual mean temperature (0.116), silt (0.107), and annual mean precipitation (0.104). In the case of Cd, the driving factors with q > 1 included per capita income (0.655), geomorphic type (0.524), annual mean precipitation (0.523), distance from road (0.391), geological type (0.329), annual mean temperature (0.283), land-use type (0.227), organic matter (0.189), TP (0.156), sand (0.130). For Cr, the driving factors with q > 1 encompassed per capita income (0.593), geological type (0.376), geomorphic type (0.277), silt (0.193), organic matter (0.176), sand (0.173), annual mean temperature (0.123), clay (0.110), distance from road (0.108), and land-use type (0.106). Ni was driven by factors with q > 1, such as per capita income (0.640), geological type (0.468), geomorphic type (0.323), organic matter (0.232), annual mean temperature (0.210), silt (0.199), vegetation type (0.183), sand (0.179), annual mean precipitation (0.149), and clay (0.113). Finally, for Pb, the driving factors with q > 1 included per capita income (0.661), annual mean precipitation (0.628), geomorphic type (0.591), geological type (0.457), annual mean temperature (0.423), organic matter (0.270), vegetation type (0.233), land-use type (0.116), sand (0.115), distance from road (0.114), TP (0.112), TN (0.102), DEM (0.101), and clay (0.100).
Each driving factor exhibits a distinct level of influence on various HMs, highlighting the heterogeneity in the change mechanisms of these elements [58]. Broadly, agricultural and pastoral activities stand out as the primary determinants influencing the spatial distribution of HMs in soil. The study area is predominantly characterized by agriculture and animal husbandry, featuring extensive farmland, orchards, and pasture. Agricultural and pastoral activities, including nutrient soil utilization, fertilization, irrigation, and pesticide application, exert a direct impact on soil physicochemical properties, leading to the introduction of HMs [59,60]. Alterations in soil physicochemical properties directly influence the activity, migration, and transformation of HMs [61]. RDA analysis further indicates significantly positive correlations between TN, TP, TK, OC, PH, and one or more HMs. Consequently, soil physical and chemical properties serve as crucial indicators influencing the spatial distribution of HMs.
Various environmental and human factors significantly influence the presence and distribution of HMs in soil. Organic matter in soil forms complexes with HMs, impacting their migration, transformation, and subsequent accumulation [57,62]. Per capita net income as a human factor has a great impact on soil HMs. Additionally, per capita net income, as a human factor, reflects the intensity of human production and living activities. Higher net income correlates with increased human activities, leading to the accumulation of HMs through domestic waste and sewage irrigation. Among the natural factors, geomorphic type, annual mean temperature, and annual mean precipitation play crucial roles in soil HMs. Studies indicate that topography and geomorphology are primary factors affecting HM differentiation in soil [63,64]. Furthermore, precipitation and temperature influence HM migration by affecting soil moisture and are linked to the wet deposition of HMs in the atmosphere, thus, impacting the distribution of HMs in soil [63,65,66].

4. Conclusions

In this investigation, we undertook a comprehensive analysis of the concentration characteristics and spatial distribution trends of five HMs and three nutrient elements in soil and water in the southeastern typical area within the Tethys Himalaya tectonic domain. Remarkably, 65.46% of the soil samples in the study area exceeded the screening value for As, and the variation coefficients of N and P in the soil were elevated, accompanied by higher kurtosis and skewness. Nevertheless, the concentrations of elements in the water remained below the standard limit, indicating good water quality. Simultaneously, the ecological risk of five HMs in the soil–water system was assessed, and the overall ecological risk was deemed to be light. Additionally, employing redundancy analysis, we scrutinized the impact of soil physicochemical properties on HMs and conducted source allocation. In agricultural and pastoral practices, particular attention should be directed toward the application amount of organic fertilizer. Human-related factors, such as As and Pb, were identified as primarily linked to anthropogenic activities and the environment, whereas Cd, Cr, and Ni were mainly associated with natural processes. Furthermore, the spatial distribution of HMs was analyzed based on the geographical detector considering 23 driving factors. Per capita net income of human factors, organic matter, geological type, and soil texture (silt, sand, and clay) for natural factors, and annual mean temperature, annual mean precipitation, and geomorphic type for environmental factors were the main factors affecting the spatial distribution of HMs in soil. In the context of preventing non-point source and HM pollution, As emerges as a key monitoring target. In daily production and life, efforts should be made to minimize HM pollution resulting from human activities. This includes the preference for green energy over organic fertilizers and pesticides. The findings of this study contribute comprehensive background data on HM pollution in the water and soil of Gangba County, offering effective support for the prevention and control of non-point source pollution in the study area and even in Tibet.

Author Contributions

J.A.: provision of article ideas, sample collection and pretreatment, data collation and write the first draft of the article. H.W.: data collation, draft production, writing the first draft of the article. L.D.: data processing and interpretation of the results. Y.Y.: carried out the analysis. Y.W.: designed the research concept and methodology. J.D.: edited during the writing stage. W.Z.: interpreted the results. X.Z.: resources, project support and administration, revision, and improvement of articles after writing. All authors have read and agreed to the published version of the manuscript.

Funding

This research was jointly funded by the Central Government Guides Local Science and Technology Development Program (Grant No. XZ202201YD0014C and XZ202202YD0009C), and the Tibet Autonomous Region Science and Technology Program Project Unveiled and Hanging Special Program (Grant No. JBGS2023000015).

Data Availability Statement

The data presented in this study are available on request from the corresponding author. The data are not publicly available due to [the difficulty of data acquisition and the difficulty of public sharing of some internal data of the research group].

Conflicts of Interest

The authors declare that they have no known competing financial interests or personal relationships that could have appeared to influence the work reported in this paper.

References

  1. Tahmasebi Nasab, M.; Grimm, K.; Bazrkar, M.H.; Zeng, L.; Shabani, A.; Zhang, X.; Chu, X. SWAT Modeling of Non-Point Source Pollution in Depression-Dominated Basins under Varying Hydroclimatic Conditions. Int. J. Environ. Res. Public Health 2018, 15, 2492. [Google Scholar] [CrossRef] [PubMed]
  2. Yu, Y.; Xu, J.; Zhang, P.; Meng, Y.; Xiong, Y. Controlled Irrigation and Drainage Reduce Rainfall Runoff and Nitrogen Loss in Paddy Fields. Int. J. Environ. Res. Public Health 2021, 18, 3348. [Google Scholar] [CrossRef] [PubMed]
  3. Fučík, P.; Hejduk, T.; Peterková, J. Quantifying Water Pollution Sources in a Small Tile-drained Agricultural Watershed. CLEAN–Soil Air Water 2015, 43, 698–709. [Google Scholar] [CrossRef]
  4. Corradini, F.; Nájera, F.; Casanova, M.; Tapia, Y.; Singh, R. Salazar Od: Effects of maize cultivation on nitrogen and phosphorus loadings to drainage channels in Central Chile. Environ. Monit. Assess. 2015, 187, 697. [Google Scholar] [CrossRef] [PubMed]
  5. Varekar, V.; Yadav, V.; Karmakar, S. Rationalization of water quality monitoring locations under spatiotemporal heterogeneity of diffuse pollution using seasonal export coefficient. J. Environ. Manag. 2021, 277, 111342. [Google Scholar] [CrossRef] [PubMed]
  6. Aliewi, A.; Al-Khatib, I.A. Hazard and risk assessment of pollution on the groundwater resources and residents’ health of Salfit District, Palestine. J. Hydrol. Reg. Stud. 2015, 4, 472–486. [Google Scholar] [CrossRef]
  7. Wang, H.; He, P.; Shen, C.; Wu, Z. Effect of irrigation amount and fertilization on agriculture non-point source pollution in the paddy field. Environ. Sci. Pollut. Res. 2019, 26, 10363–10373. [Google Scholar] [CrossRef]
  8. Chang, M.; McBroom, M.W.; Scott Beasley, R. Roofing as a source of nonpoint water pollution. J. Environ. Manag. 2004, 73, 307–315. [Google Scholar] [CrossRef]
  9. MEE. Bulletin of the Second National Survey of Pollution Sources; Ministry of Ecology and Environment of the People’s Republic of China: Beijing, China, 2017. [Google Scholar]
  10. Vareda, J.P.; Valente, A.J.M.; Durães, L. Assessment of heavy metal pollution from anthropogenic activities and remediation strategies: A review. J. Environ. Manag. 2019, 246, 101–118. [Google Scholar] [CrossRef]
  11. Fei, X.; Lou, Z.; Xiao, R.; Lv, X.; Christakos, G. Contamination and Health Risk Assessment of Heavy Metal Pollution in Soils Developed from Different Soil Parent Materials. Expo. Health 2022, 15, 395–408. [Google Scholar] [CrossRef]
  12. Shi, L.; Li, J.; Palansooriya, K.N.; Chen, Y.; Hou, D.; Meers, E.; Tsang, D.C.W.; Wang, X.; Ok, Y.S. Modeling phytoremediation of heavy metal contaminated soils through machine learning. J. Hazard. Mater. 2023, 441, 129904. [Google Scholar] [CrossRef] [PubMed]
  13. Liu, Z.; Fei, Y.; Shi, H.; Mo, L.; Qi, J. Prediction of high-risk areas of soil heavy metal pollution with multiple factors on a large scale in industrial agglomeration areas. Sci. Total Environ. 2022, 808, 151874. [Google Scholar] [CrossRef] [PubMed]
  14. Ramazanova, E.; Lee, S.H.; Lee, W. Stochastic risk assessment of urban soils contaminated by heavy metals in Kazakhstan. Sci. Total Environ. 2021, 750, 141535. [Google Scholar] [CrossRef] [PubMed]
  15. Mao, C.; Song, Y.; Chen, L.; Ji, J.; Li, J.; Yuan, X.; Yang, Z.; Ayoko, G.A.; Frost, R.L.; Theiss, F. Human health risks of heavy metals in paddy rice based on transfer characteristics of heavy metals from soil to rice. CATENA 2019, 175, 339–348. [Google Scholar] [CrossRef]
  16. Wei, M.; Pan, A.; Ma, R.; Wang, H. Distribution characteristics, source analysis and health risk assessment of heavy metals in farmland soil in Shiquan County, Shaanxi Province. Process Saf. Environ. Prot. 2023, 171, 225–237. [Google Scholar] [CrossRef]
  17. Ran, H.; Guo, Z.; Yi, L.; Xiao, X.; Zhang, L.; Hu, Z.; Li, C.; Zhang, Y. Pollution characteristics and source identification of soil metal(loid)s at an abandoned arsenic-containing mine, China. J. Hazard. Mater. 2021, 413, 125382. [Google Scholar] [CrossRef] [PubMed]
  18. Wu, J.; Lu, J.; Li, L.; Min, X.; Luo, Y. Pollution, ecological-health risks, and sources of heavy metals in soil of the northeastern Qinghai-Tibet Plateau. Chemosphere 2018, 201, 234–242. [Google Scholar] [CrossRef]
  19. Yang, Y.; Yang, X.; He, M.; Christakos, G. Beyond mere pollution source identification: Determination of land covers emitting soil heavy metals by combining PCA/APCS, GeoDetector and GIS analysis. CATENA 2020, 185, 104297. [Google Scholar] [CrossRef]
  20. Liu, L.; Xu, X.; Han, J.; Zhu, J.-M.; Li, S.; Liang, L.; Wu, P.; Wu, Q.; Qiu, G. Heavy metal(loid)s in agricultural soils in the world’s largest barium-mining area: Pollution characteristics, source apportionment, and health risks using PMF model and Cd isotopes. Process Saf. Environ. Prot. 2022, 166, 669–681. [Google Scholar] [CrossRef]
  21. Zhang, Y.; Song, B.; Zhou, Z. Pollution assessment and source apportionment of heavy metals in soil from lead—Zinc mining areas of south China. J. Environ. Chem. Eng. 2023, 11, 109320. [Google Scholar] [CrossRef]
  22. Fei, X.; Lou, Z.; Xiao, R.; Ren, Z.; Lv, X. Source analysis and source-oriented risk assessment of heavy metal pollution in agricultural soils of different cultivated land qualities. J. Clean. Prod. 2022, 341, 130942. [Google Scholar] [CrossRef]
  23. Qiao, P.; Wang, S.; Lei, M.; Guo, G.; Yang, J.; Wei, Y.; Gou, Y.; Li, P.; Zhang, Z. Influencing factors identification and the nested structure analysis of heavy metals in soils in entire city and surrounding the multiple pollution sources. J. Hazard. Mater. 2023, 449, 130961. [Google Scholar] [CrossRef] [PubMed]
  24. Li, Y.; Wang, H.; Deng, Y.; Liang, D.; Li, Y.; Gu, Q. Applying water environment capacity to assess the non-point source pollution risks in watersheds. Water Res. 2023, 240, 120092. [Google Scholar] [CrossRef] [PubMed]
  25. Jeong, H.; Choi, J.Y.; Lee, J.; Lim, J.; Ra, K. Heavy metal pollution by road-deposited sediments and its contribution to total suspended solids in rainfall runoff from intensive industrial areas. Environ. Pollut. 2020, 265, 115028. [Google Scholar] [CrossRef] [PubMed]
  26. He, Y.; Wang, W.; Chen, Y.; Hua, J.; Deng, C.; Li, H. Source-sink response analysis of heavy metals and soil pollution assessment in non-ferrous metal industrial agglomeration areas based on decision unit. Sci. Total Environ. 2023, 906, 167437. [Google Scholar] [CrossRef] [PubMed]
  27. Wang, J.F.; Li, X.H.; Christakos, G.; Liao, Y.L.; Zhang, T.; Gu, X.; Zheng, X.Y. Geographical Detectors-Based Health Risk Assessment and its Application in the Neural Tube Defects Study of the Heshun Region, China. Int. J. Geogr. Inf. Sci. 2010, 24, 107–127. [Google Scholar] [CrossRef]
  28. Ni, J.; Wu, T.; Zhu, X.; Wu, X.; Pang, Q.; Zou, D.; Chen, J.; Li, R.; Hu, G.; Du, Y.; et al. Risk assessment of potential thaw settlement hazard in the permafrost regions of Qinghai-Tibet Plateau. Sci. Total Environ. 2021, 776, 145855. [Google Scholar] [CrossRef]
  29. Li, Y.; Zhou, Z.; Wang, K.; Xu, C. Simulation of Flow and Agricultural Non-Point Source Pollutant Transport in a Tibetan Plateau Irrigation District. Water 2019, 11, 132. [Google Scholar] [CrossRef]
  30. Wang, Q.; Gao, M.; Zhang, H. Agroecological Efficiency Evaluation Based on Multi-Source Remote Sensing Data in a Typical County of the Tibetan Plateau. Land 2022, 11, 561. [Google Scholar] [CrossRef]
  31. Yang, W.; Guo, X.; Yao, T.; Zhu, M.; Wang, Y. Recent accelerating mass loss of southeast Tibetan glaciers and the relationship with changes in macroscale atmospheric circulations. Clim. Dyn. 2016, 47, 805–815. [Google Scholar] [CrossRef]
  32. Sills, J.; Liu, J.; Milne, R.I.; Cadotte, M.W.; Wu, Z.-Y.; Provan, J.; Zhu, G.-F.; Gao, L.-M.; Li, D.-Z. Protect Third Pole’s fragile ecosystem. Science 2018, 362, 1368. [Google Scholar] [CrossRef]
  33. Du, H.; Wang, J.; Wang, Y.; Yao, Y.; Liu, X.; Zhou, Y. Contamination characteristics, source analysis, and spatial prediction of soil heavy metal concentrations on the Qinghai-Tibet Plateau. J. Soils Sediments 2023, 23, 2202–2215. [Google Scholar] [CrossRef]
  34. Yu, L.; Liu, S.; Wang, F.; Liu, Y.; Li, M.; Wang, Q.; Dong, S.; Zhao, W.; Tran, L.-S.P.; Sun, Y.; et al. Effects of agricultural activities on energy-carbon-water nexus of the Qinghai-Tibet Plateau. J. Clean. Prod. 2022, 331, 129995. [Google Scholar] [CrossRef]
  35. GB5750–2006; SAMR, SA. Standard Examination Methods for Drinking Water—General Principles. State Administration for Market Regulation of the People’s Republic of China and Standardization Administration of the People’s Republic of China: Beijing, China, 2006.
  36. MEE. Background Value of Soil Elements in China; China Environmental Science: China National Environmental Monitoring Centre: Beijing, China, 1990. [Google Scholar]
  37. GB5749–2022; SAMR, SA. Standards for Drinking Water Quality. State Administration for Market Regulation of the People’s Republic of China and Standardization Administration of the People’s Republic of China: Beijing, China, 2022.
  38. Hakanson, L. An ecological risk index for aquatic pollution control. A sedimentological approach. Water Res. 1980, 14, 975–1001. [Google Scholar] [CrossRef]
  39. Zheng, W.; Wu, Q.; Rao, C.; Chen, X.; Wang, E.; Liang, X.; Yan, W. Characteristics and interactions of soil bacteria, phytocommunity and soil properties in rocky desertification ecosystems of Southwest China. CATENA 2023, 220, 106731. [Google Scholar] [CrossRef]
  40. GB15618—2018; SAMR, SA. Soil Environmental Quality Risk Control Standard for Soil Contamination of Agricultural Land. State Administration for Market Regulation of the People’s Republic of China and Standardization Administration of the People’s Republic of China: Beijing, China, 2018.
  41. Zhao, G.; Ma, Y.; Liu, Y.; Cheng, J.; Wang, X. Source analysis and ecological risk assessment of heavy metals in farmland soils around heavy metal industry in Anxin County. Sci. Rep. 2022, 12, 10562. [Google Scholar] [CrossRef]
  42. Kumar, S.; Islam, A.R.M.T.; Islam, H.M.T.; Hasanuzzaman, M.; Ongoma, V.; Khan, R.; Mallick, J. Water resources pollution associated with risks of heavy metals from Vatukoula Goldmine region, Fiji. J. Environ. Manag. 2021, 293, 112868. [Google Scholar] [CrossRef]
  43. NBSPRC. China County Statistical Yearbook (Township Volume); National Bureau of statistics of the People’s Republic of China: Beijing, China, 2019. [Google Scholar]
  44. Xu, J.; Li, Y.; Wang, S.; Long, S.; Wu, Y.; Chen, Z. Sources, transfers and the fate of heavy metals in soil-wheat systems: The case of lead (Pb)/zinc (Zn) smelting region. J. Hazard. Mater. 2023, 441, 129863. [Google Scholar] [CrossRef]
  45. Danladi, I.B.; Kore, B.M.; Gül, M. Vulnerability of the Nigerian coast: An insight into sea level rise owing to climate change and anthropogenic activities. J. Afr. Earth Sci. 2017, 134, 493–503. [Google Scholar] [CrossRef]
  46. Zhao, Y.; Dong, Y.; Lin, H.; Liu, C. Influence of soil physical and chemical properries on forms of heavy metals. Agric. Eng. 2018, 8, 38–43. [Google Scholar]
  47. Choi, J.Y.; Seo, J. Copula-Based Redundancy Analysis. Multivar. Behav. Res. 2022, 57, 1007–1026. [Google Scholar] [CrossRef] [PubMed]
  48. Hu, B.; Guo, P.; Wu, Y.; Deng, J.; Su, H.; Li, Y.; Nan, Y. Study of soil physicochemical properties and heavy metals of a mangrove restoration wetland. J. Clean. Prod. 2021, 291, 125965. [Google Scholar] [CrossRef]
  49. Wang, Y.; Zhang, L.; Wang, J.; Lv, J. Identifying quantitative sources and spatial distributions of potentially toxic elements in soils by using three receptor models and sequential indicator simulation. Chemosphere 2020, 242, 125266. [Google Scholar] [CrossRef] [PubMed]
  50. Xu, L.; Guan, J.; Ba, Y.; Chen, W.; Huang, J.; Cheng, Y.; Zhang, Y.; Qu, Q.; Zhao, M. Spatial distribution pattern and driving mechanism of heavy metal elements in soils in middle-alpine hilly region, Yunnan province. Geol. China 2023, 1–27. [Google Scholar]
  51. Dai, L.; Wang, L.; Liang, T.; Zhang, Y.; Li, J.; Xiao, J.; Dong, L.; Zhang, H. Geostatistical analyses and co-occurrence correlations of heavy metals distribution with various types of land use within a watershed in eastern QingHai-Tibet Plateau, China. Sci. Total Environ. 2019, 653, 849–859. [Google Scholar] [CrossRef] [PubMed]
  52. Savignan, L.; Lee, A.; Coynel, A.; Jalabert, S.; Faucher, S.; Lespes, G.; Chéry, P. Spatial distribution of trace elements in the soils of south-western France and identification of natural and anthropogenic sources. CATENA 2021, 205, 105446. [Google Scholar] [CrossRef]
  53. Tan, C.; Wang, H.; Yang, Q.; Yuan, L.; Zhang, Y.; Delgado Martín, J. An integrated approach for quantifying source apportionment and source-oriented health risk of heavy metals in soils near an old industrial area. Environ. Pollut. 2023, 323, 121271. [Google Scholar] [CrossRef] [PubMed]
  54. Zhang, X.; Wei, S.; Sun, Q.; Wadood, S.A.; Guo, B. Source identification and spatial distribution of arsenic and heavy metals in agricultural soil around Hunan industrial estate by positive matrix factorization model, principle components analysis and geo statistical analysis. Ecotoxicol. Environ. Saf. 2018, 159, 354–362. [Google Scholar] [CrossRef]
  55. Anaman, R.; Peng, C.; Jiang, Z.; Liu, X.; Zhou, Z.; Guo, Z.; Xiao, X. Identifying sources and transport routes of heavy metals in soil with different land uses around a smelting site by GIS based PCA and PMF. Sci. Total Environ. 2022, 823, 153759. [Google Scholar] [CrossRef]
  56. Gong, C.; Wang, S.-X.; Lu, H.-C.; Chen, Y.; Liu, J.-F. Research Progress on Spatial Differentiation and Influencing Factors of Soil Heavy Metals Based on Geographical Detector. Environ. Sci. 2023, 44, 2799–2816. [Google Scholar] [CrossRef]
  57. Zeng, F.; Ali, S.; Zhang, H.; Ouyang, Y.; Qiu, B.; Wu, F.; Zhang, G. The influence of pH and organic matter content in paddy soil on heavy metal availability and their uptake by rice plants. Environ. Pollut. 2011, 159, 84–91. [Google Scholar] [CrossRef] [PubMed]
  58. Wang, X.; Sun, Y.; Zhang, L.; Mei, Y. Spatial variation and influence factor analysis of soil heavy metal As based on geoDetector. Stoch. Environ. Res. Risk Assess. 2021, 35, 2021–2030. [Google Scholar] [CrossRef]
  59. Wang, H.; Xu, Y.; Wei, X. Rural Resilience Evaluation and Influencing Factor Analysis Based on Geographical Detector Method and Multiscale Geographically Weighted Regression. Land 2023, 12, 1270. [Google Scholar] [CrossRef]
  60. Qiao, P.; Yang, S.; Lei, M.; Chen, T.; Dong, N. Quantitative analysis of the factors influencing spatial distribution of soil heavy metals based on geographical detector. Sci. Total Environ. 2019, 664, 392–413. [Google Scholar] [CrossRef] [PubMed]
  61. Liu, Z.; Lei, H.; Sheng, H.; Wang, Y. Analysis of soil organic matter influencing factors in the Huangshui River Basin by using the optimal parameter-based geographical detector model. Geocarto Int. 2023, 38, 2246935. [Google Scholar] [CrossRef]
  62. Shi, J.; Jin, R.; Zhu, W. Quantification of Effects of Natural Geographical Factors and Landscape Patterns on Non-point Source Pollution in Watershed Based on Geodetector: Burhatong River Basin, Northeast China as An Example. Chin. Geogr. Sci. 2022, 32, 707–723. [Google Scholar] [CrossRef]
  63. Wen, Q.; Yang, L.; Yu, J.; Wei, B.; Yin, S. Sources and Risk Characteristics of Heavy Metals in Plateau Soils Predicted by Geo-Detectors. Remote Sens. 2023, 15, 1588. [Google Scholar] [CrossRef]
  64. Liu, Q.; Li, M.; Duan, J.; Wu, H.; Hong, X. Analysis on influence factors of soil Pb and Cd in agricultural soil of Changsha suburb based on geographically weighted regression model. Trans. Chin. Soc. Agric. Eng. (Trans. CSAE) 2013, 29, 225–234. [Google Scholar]
  65. Zhao, Y.; Deng, Q.; Lin, Q.; Zeng, C.; Zhong, C. Cadmium source identification in soils and high-risk regions predicted by geographical detector method. Environ. Pollut. 2020, 263, 114338. [Google Scholar] [CrossRef]
  66. Tapia, J.; Mukherjee, A.; Rodríguez, M.P.; Murray, J.; Bhattacharya, P. Role of tectonics and climate on elevated arsenic in fluvial systems: Insights from surface water and sediments along regional transects of Chile. Environ. Pollut. 2022, 314, 120151. [Google Scholar] [CrossRef]
Figure 1. Outline of the research framework.
Water 16 00291 g001
Figure 2. Overview of the study area and sampling points.
Water 16 00291 g002
Figure 3. Spatial distribution of 23 driving factor. (X1~X12 display in (A), X13~X23 display in (B)).
Water 16 00291 g003aWater 16 00291 g003b
Figure 4. Redundancy analysis calculation schematic diagram.
Water 16 00291 g004
Figure 5. Average concentration characteristics of eight selected elements in soil.
Water 16 00291 g005
Figure 6. Average concentration characteristics of eight selected elements in water.
Water 16 00291 g006
Figure 7. Spatial distribution of eight selected elements in soil and water.
Water 16 00291 g007
Figure 8. PERI of HMs in soil–water systems.
Water 16 00291 g008
Figure 9. Overall ecological risk in the study area.
Water 16 00291 g009
Figure 10. Two-dimensional sequence of redundancy analysis between heavy metals and physical and chemical properties of soil (TN, TK, TP, AP, PH, CEC, and OC represent soil total nitrogen, total potassium, total phosphorus, available phosphorus, PH, cation exchange capacity, and organic matter, respectively).
Water 16 00291 g010
Figure 11. Heat map of correlation coefficient between heavy metals and physical and chemical properties of soil.
Water 16 00291 g011
Figure 12. q values of each driving factor.
Water 16 00291 g012
Table 1. Potential ecological risk index classification criteria.
Level of RiskCategoryLevel of RiskCategory
SlightPERI ≤ 40SlightRI ≤ 150
Medium40 < PERI ≤ 80Medium150 < RI ≤ 300
Relatively strong80 < PERI ≤ 160Strong300 < RI ≤ 600
Strong160 < PERI ≤ 320Very strong600< RI
Very strong320 < PERI
Table 2. Descriptive statistical results of heavy metals and nutrient elements in soil and water at the town level in the study area.
Soil (Unit: mg/kg)
TownshipAsCdCrNiPbNPK
Changlong33.73 ± 10.360.062 ± 0.04246.68 ± 27.6718.52 ± 13.2634.90 ± 4.06971.54 ± 436.75671.25 ± 356.6920,037.69 ± 1235.82
Gangba42.80 ± 23.050.086 ± 0.05051.19 ± 16.8816.95 ± 6.4922.94 ± 6.041116.01 ± 540.01583.37 ± 220.4419,755.33 ± 2906.79
Kongma28.49 ± 9.100.084 ± 0.01771.65 ± 16.1439.88 ± 7.7434.55 ± 8.96794.29 ± 327.66851.40 ± 239.1017,882.86 ± 3230.96
Longzhong29.32 ± 16.420.107 ± 0.03184.73 ± 24.0745.62 ± 11.9831.05 ± 9.69986.67 ± 444.76797.29 ± 211.7821,059.33 ± 2728.51
Zhike46.39 ± 24.850.048 ± 0.01662.91 ± 13.0229.04 ± 9.2639.64 ± 11.24964.01 ± 705.36623.22 ± 222.4722,980.00 ± 5233.57
Gangba County34.49 ± 18.160.083 ± 0.04162.94 ± 26.0729.16 ± 16.0930.97 ± 9.27991.82 ± 477.05700.22 ± 269.5220,232.50 ± 3053.82
Background value [36]19.70.08176.632.129.1---
Control value [40]12031000-700---
Screening value [40]300.3200100120---
Water (unit: μg/L)
TownshipAsCdCrNiPbNPK
Changlong4.25 ± 3.600.0010 ± 0.00090.42 ± 0.020.12 ± 0.080.0054 ± 0.00560.0012 ± 0.00040.00030.0017 ± 0.0009
Gangba0.80 ± 0.680.0010 ± 0.00070.19 ± 0.160.20 ± 0.360.0035 ± 0.00170.0036 ± 0.0049n.d.0.0018 ± 0.0021
Kongma21.00 ± 42.550.0006 ± 0.00052.37 ± 2.040.22 ± 0.330.0082 ± 0.00750.0032 ± 0.00180.0004 ± 0.00010.0023 ± 0.0040
Longzhong1.55 ± 2.160.0015 ± 0.00080.13 ± 0.110.16 ± 0.090.0118 ± 0.00610.0065 ± 0.00740.0007 ± 0.00060.0032 ± 0.0032
Zhike6.81 ± 10.240.0014 ± 0.00080.14 ± 0.060.17 ± 0.100.0166 ± 0.00850.0028 ± 0.00170.0013 ± 0.00140.0025 ± 0.0014
Gangba County4.70 ± 14.850.0012 ± 0.00080.38 ± 0.090.17 ± 0.210.0083 ± 0.00710.0033 ± 0.00460.0007 ± 0.00070.0022 ± 0.0023
Standard value [37]105502010---
Table 3. q values of each driving factor.
VariablesAsCdCrNiPb
X10.0510.0960.0490.0500.101
X20.1040.5230.0810.1490.628
X30.0090.0060.0060.0120.018
X40.0020.0020.0120.0180.008
X50.0070.0030.0070.0100.008
X60.1170.2830.1220.2090.423
X70.0790.0740.0990.1830.233
X80.0420.5240.2770.3230.591
X90.0580.0800.0340.0420.102
X100.0090.1560.0060.0340.112
X110.0460.0420.0400.0540.081
X120.0890.2270.1060.0600.116
X130.3160.6550.5930.6400.661
X140.0590.3910.1090.0840.114
X150.1070.0930.1930.1990.088
X160.1270.1300.1730.1790.115
X170.0680.0940.1100.1130.100
X180.0560.0780.0470.0440.050
X190.0560.0690.0190.0260.098
X200.0310.0520.0110.0220.041
X210.0420.0370.0290.0440.051
X220.1210.1900.1760.2320.270
X230.1360.3290.3760.4680.457
Disclaimer/Publisher’s Note: The statements, opinions and data contained in all publications are solely those of the individual author(s) and contributor(s) and not of MDPI and/or the editor(s). MDPI and/or the editor(s) disclaim responsibility for any injury to people or property resulting from any ideas, methods, instructions or products referred to in the content.

