Article

Temporal and Spatial Changes of Hydrographic Connectivity with the Development of Agriculture, Industry, and Urban Areas: A Case Study of the Yellow River Basin in Henan Province during the Last Two Decades

1
Key Laboratory of Land Surface Pattern and Simulation, Institute of Geographic Sciences and Natural Resources Research, Chinese Academy of Sciences, Beijing 100101, China
2
University of Chinese Academy of Sciences, Beijing 100049, China
3
College of Agriculture, Yangtze University, Jingzhou 434025, China
*
Author to whom correspondence should be addressed.
Water 2023, 15(24), 4245; https://doi.org/10.3390/w15244245
Submission received: 17 October 2023 / Revised: 1 December 2023 / Accepted: 1 December 2023 / Published: 11 December 2023

Abstract

:
Hydrographic connectivity stands as a crucial indicator for analyzing the structural dynamics within river and lake systems. Nevertheless, the impact of changes in hydrographic connectivity, including structural and functional connectivity within extensive river basins, on the progression of agriculture, industry, and habitation remain scarcely explored. To bridge this gap, Henan province in China, traversed by the Yellow River, was selected as a case study. The extraction of water information was facilitated by employing a remote sensing-based Modified Normalized Difference Water Index (MNDWI), while Set Pair Analysis was utilized to construct a hydrographic connectivity evaluation system for the study area spanning the preceding two decades (2000–2020). The results revealed that for structural connectivity, agricultural land covers over 50% and prevails as the primary land-use type; reservoir and lake areas initially increased before subsequently decreasing. Human activities have exerted a profound influence on these changes. Meanwhile, the structural form of the water system has gradually improved, exhibiting an increasing complexity of river networks and a stabilizing connectivity configuration. As for functional connectivity, the natural function remains well-preserved, while the social function demonstrates a positive correlation with the expansion of industrial activities, eventually achieving an excellent level from a moderate level. Overall, agriculture dominated the water usage structure, with residential water consumption steadily increasing, thereby positively impacting hydrographic connectivity in the studied area.

1. Introduction

The notion of hydrographic connectivity emerged in the field of landscape ecology during the 1970s as a means of examining the correlation between landscape structure and biotic movements between patches, commonly referred to as landscape connectivity. In recent years, this concept has been increasingly adopted in hydrology and other domains [1,2,3]. Hydrographic connectivity is defined as the capacity of hydrological cycle elements, such as material, energy, and biota, to migrate and transfer through water [4]. Structural and functional connectivity are the two interrelated components that typify hydrographic connectivity. The former relates to the spatial continuity attributes of the landscape, which reflect static processes, while the latter pertains to the transfer and circulation of information, material, and energy that result from the interaction between the water body morphology and the connected body within the watershed, reflecting dynamic processes [5,6].
Currently, research on hydrographic connectivity mostly focuses on flood-prone areas, wetland plains, and small-scale watersheds such as lakes, deltas, and urban rivers, which has limited regional applicability. For instance, Cui et al. [7] evaluated the hydrological connectivity of surface water in the Yellow River delta floodplain from 2006 to 2017 and found that the connectivity of the river system varied with the change in water body patches and spatial distribution; Dai et al. [8] also investigated the hydrological connectivity of small-scale watersheds in the Yellow River delta using dye coverage, quantifying the interaction between hydrological connectivity and the soil–root complex; meanwhile, Lesschen et al. [9] modeled hydrological and erosion processes in the Carcavo watershed in Spain using hydrological connectivity, exploring the influence of scale dependency on hydrological and erosion models; Liu et al. [10] evaluated the hydrological connectivity of the Bositeng Lake from 1990 to 2019 using landscape connectivity methods and analyzed its response to human activities and climate change; Tan et al. [11] developed a connectivity assessment tool, CAST 1.0, and assessed the response of hydrological connectivity to flow rate, water temperature, etc., using Poyang Lake as a case study; Tian et al. [12] conducted a hydrological connectivity analysis and evaluation of the arid plains in the Dongliao River Basin using graph theory and binary water cycle theory. However, there is still a lack of literature on the response and changes of hydrographic connectivity in large-scale platforms and over long time spans concerning industrial and agricultural activities, and human social development. With the rapid development of society, the continuous changes in the environment and the crucial role of water environment in ecological systems and social development, it is urgent to evaluate hydrographic connectivity in large-scale watersheds and changing environments to enhance the understanding of watershed water environment protection and management.
In general, a digital elevation model (DEM) is utilized to determine the watershed scope for studying the spatio-temporal evolution of hydrographic connectivity [13]. However, the traditional DEM-filling method may not be appropriate for studying hydrographic connectivity in flat downstream plain areas of rivers, such as the Henan section of the Yellow River Basin [14,15]. The conventional method for filling depressions in DEM typically relies on calculating the slope based on the height difference between the river and its banks, as well as the direction of the river flow. However, in flat riverine landscapes, where the riverbed is at or above the level of the riverbanks, traditional DEM-based methods are unsuitable for water feature extraction [7,16]. Therefore, an alternative approach known as the water index method has been introduced. These methods utilize the differences in reflectance of specific bands in remote sensing images to calculate and filter out water bodies, without relying on slope information [17]. McFeeters [18] originally derived the normalized difference water index (NDWI) in 1996 from the normalized difference vegetation index (NDVI) as a method for processing specific bands to highlight water information and suppress vegetation information. After several years of development, various improvements have been made, such as the modified normalized difference water index (MNDWI) and the new water index (NWI), providing multiple avenues for water extraction [19].
The Yellow River Basin, specifically in Henan province, plays a crucial role in providing ecological services to the local community. However, its unique hydrological conditions, characterized by high riverbed elevation above the ground level, have limited research and development on the local hydrographic connectivity. In the last two decades, due to the rapid urbanization and population growth in the basin area with hundreds of millions of people living in a city cluster, the utilization and preservation of water resources have become increasingly pressing issues owing to the region’s hydrological scarcity. To better elucidate the impact of urbanization and modern water resource utilization changes on the native hydrological network in the studied urban area, we employed supervised classification and the MNDWI method to enhance the accuracy of water body extraction from remote sensing imagery in the plain river and lake network region. Additionally, we employed a Set Pair Analysis method to construct an evaluation framework for assessing the hydrographic connectivity in the study area. Following an examination of the interrelationships between changes in hydrographic connectivity and human activities during the period from 2000 to 2020, this research aims to provide theoretical support and reference points for sustainable water resource allocation in the Yellow River Basin and other basins, facilitating the optimized utilization of resources.

2. Material and Methods

2.1. Study Area

This study was conducted over a 20,000 km2 area situated in the northern part of Henan Province, which is located in central-eastern China, located between 34°62′–35°95′ N, 112°41′–115°78′ E. The region in question exhibits a humid to sub-humid continental monsoon climate, characterized by an annual mean temperature ranging from 12 to 16 °C, an annual average relative humidity between 65 and 77%, and an annual mean precipitation ranging from 500 to 900 mm. The annual mean evaporation varies from 1300 to 2100 mm. The Yellow River Basin in Henan province is marked by a high concentration of sediment, with an average natural runoff of approximately 50 billion cubic meters and an annual sediment transport at hydrological stations reaching nearly 600 million tons [20]. According to Huayuankou hydrological station monitoring data, the annual average precipitation in the study area is recorded at 660 mm, with a runoff of 39 billion cubic meters. Over the period from 2000 to 2020, the precipitation levels remained around 631 mm, and the lowest rainfall was recorded at 573 mm in 2015, while the highest was 799 mm in 2005. while runoff consistently fell below the average until 2018 when it surpassed the mean. The geographical location of the research area is depicted in Figure 1.

2.2. Data Collection

For this study, 45 images were selected from the China Science and Technology Cloud Platform for Geospatial Data (www.gscloud.cn, accessed on 17 July 2022), including Landsat-5 images from 2000, Landsat-7 images from 2005 and 2010, and Landsat-8 images from 2015 and 2020, with the corresponding Landsat-5 images used for atmospheric correction. All images were selected from the months of April to June and with minimal cloud coverage. Additionally, social and economic data, as well as hydrological and water environmental data, were obtained from the Henan Provincial Bureau of Statistics, “Henan Statistical Yearbook 2000–2020”, the “Bulletin of National Economic and Social Development”, the “Water Resources Bulletin of Henan Province”, the “Environmental Quality Annual Report of Henan Province”, and the “Yellow River Water Resources Bulletin” published by the Yellow River Commission.

2.3. Processing of Satellites Images

Remote sensing images can be affected by radiometric and geometric distortions during the imaging process due to satellite sensor orientation changes, ground elevation angle, orbital height, and atmospheric particle scattering. Therefore, prior to conducting land cover classification and watercourse extraction research using remote sensing images, image preprocessing is necessary. In this study, the following preprocessing steps were applied to the study area images: radiometric calibration, atmospheric correction (input parameters as Table 1), image fusion, and region cropping. In addition, striping correction was performed for Landsat-7 images. ENVI 5.3 and ArcGIS 10.7 software were used to complete these operations [21].
To extract MNDWI, remote sensing imagery must first be used to classify land use in the study area. This study employed a supervised classification method utilizing the Maximum Likelihood Classification (MLC) tool in the remote sensing software ENVI 5.3. The MLC principle involves calculating the likelihood of each pixel belonging to each type and assigning it to the type with the highest probability. This widely used classification method is highly accurate and efficient [22]. Initially, by creating interpretation markers, the study area was divided into six land use types, namely, rivers, reservoirs/lakes, agricultural land, built-up land, forests, and unused land. Additionally, the separability of the training samples was calculated, ensuring an accuracy of over 1.8 to maintain the precision of the training samples. The overall accuracy were calculated to evaluate the accuracy of classification results and, using the Confusion Matrix tool in ENVI 5.3 software, the land use classification results for the five periods (2000–2020) in the study area were obtained with an overall accuracy of 86%, suggesting the satisfactory results of the classification method.
The modified normalized difference water index (MNDWI) is a formula proposed by Hanqiu Xu in 2006 that utilizes the green and mid-infrared bands for calculation [23]. It addresses the limitations of the traditional NDWI in separating water bodies from urban areas in cities. The formula is as follows:
M N D W I = ( G r e e n M I R ) / ( G r e e n + M I R )
In this formula, Green represents the green band of the remote sensing image, and MIR represents the mid-infrared band. In this study, the MNDWI result was obtained using the Band Math tool in ENVI 5.3 by inputting the expression, and a segmentation algorithm was applied to extract the water body by selecting the pixels with a threshold value greater than zero.

2.4. Hydrographic Connectivity Evaluation System Construction

2.4.1. Structural Connectivity Indicators Selection

Indicators used to characterize the structural connectivity of water systems can be divided into two categories: structural form indicators and connectivity form indicators. Structural form indicators typically include river length, water area, and river network density, among others [24]. On the other hand, connectivity form indicators are represented by the α-index, β-index, and γ-index, which, respectively, represent the degree of energy exchange between nodes, the level of difficulty in connecting nodes, and the overall network connectivity [25]. For this study, we selected structural form indicators such as river length (L), water area (A), river network density (Rd), and water surface rate (WP) based on the unique water system characteristics of the study area. In addition, we utilized the water network’s loopiness α-index, nodal connectivity β-index, and water network connectivity γ-index as connectivity form indicators. Table 2 shows the water system structural connectivity evaluation indicator system.

2.4.2. Functional Connectivity Indicators Selection

The functional connectivity of water systems is measured using indicators that evaluate natural and social functions [12]. For this study, we chose five suitable evaluation indicators: river breakage rate and water quality compliance rate to assess natural functions, and the percentage of water supply to urban, agricultural, and industrial purposes to assess social functions (Table 3). The data of each indicator were obtained and calculated from “Water Resources Bulletin of Henan Province” and “Yellow River Water Resources Bulletin”. We established assessment criteria for five indicators, which were determined by referencing pertinent documents such as the “Henan Water Resources Bulletin”, “Henan Provincial Environmental Bulletin”, “Surface Water Environmental Quality Standards” (GB3838-2002) [26], “Hygienic Standards for Drinking Water” (GB5749-2006) [27], and “Quality Standards for Irrigation Water in Farmlands” (GB5084-2005) [28]. Concurrently, representative urban values or planned values within the country were considered in conjunction with relevant policies to tailor these criteria to the specific characteristics of the research area (Table 4).
In this study, we use the Set Pair Analysis (SPA) method to quantitatively evaluate the functional connectivity of the water system in the study area. SPA method is a type of uncertainty theory proposed by Zhao Keqin in 1989 [29]. It involves establishing a data pair composed of two characteristic sets of two related research objects under a specific background [30,31]. By examining the correlation between the two sets, a relational formula of similarity, difference, or inverse relationship can be established between the research object and the evaluation standard. In this study, we combine the evaluation indicators and corresponding standards of the functional connectivity of the water system in the study area into a data pair and conduct discrimination analysis [32]. The evaluation process is presented in Supplementary Materials Text S1.

3. Result and Discussion

3.1. Land Cover

After supervised classification, the land-use type image of the study area was obtained as shown in Figure 2.
To study the land cover categories in the study area from 2000 to 2020, a supervised classification was performed. The resulting categories were exported from ArcGIS software and their respective proportions were calculated and organized (Table 5). In the Henan section of the Yellow River Basin, agricultural land covers more than 50% of the area since 2000 with a gradual decline from 2000 to 2015 and a slight increase after 2015. The built-up land proportion increased from 6% to almost 20%, and forest land proportion increased from 1.5% to 10% in 2015 and then declined to around 5%. The proportion of river area decreased from 4% to 1% before 2010 and then rose to around 3% in 2020. The proportion of reservoir area was the lowest in the study area, remaining around 0.5%, with fluctuations in the last 20 years. Land cover proportions are illustrated in Figure 3.
The Henan section of the Yellow River Basin is a fertile plain region primarily utilized for agriculture, making it the predominant land-use type. Urbanization has led to the continuous expansion of construction land at the expense of agricultural land. In the mid-2010s, the slowing economic growth resulted in the introduction of measures to protect agricultural land, thereby achieving a moderate restoration. In 2022, Niu et al. investigated the spatiotemporal evolution of multifunctional arable land in the Henan section of the Yellow River Basin. The results indicate that since 2010, population growth has posed a significant threat to arable land, and concurrently, the functional attributes of the region’s arable land have shifted gradually from production and ecological functions to production and cultural functions [33]. Consistent with Niu’s findings, since 2010, the increase in protective measures for arable land and cultural investments, the upgrading of industrial structure, and the improvement of living standards have resulted in changes in input factors and directions, thereby influencing the enhancement and transformation of arable land area, structure, and functions. This has also led to an increase in arable land area after 2015, successfully transforming the contradiction between urbanization, population growth, and arable land area into mutually efficient development through the transformation of the new agricultural economy in the region.
From the data of this study, urbanization and population growth have increased the demand for water resources in industrial and agricultural production, exacerbating issues related to water resource misuse and soil erosion, including river drying and water shortages, leading to a continuous decrease in river area. For the source data we selected in this article, according to local statistical data, the rainy season typically commences in mid-July and concludes by the end of September. Moreover, the rainfall during the months of April to June is generally less and exhibits minimal interannual variations, thereby exerting less influence on the waterbody studies addressed in this article. Since the operation of the Xiaolangdi Reservoir, sand-blocking projects have increased the area of reservoirs and lakes, and afforestation projects have expanded forest areas. However, after 2010, the reservoir shifted towards water and sediment regulation, reducing the area of reservoirs and forest land, while policies promoting river dredging and water resource protection led to a moderate increase in river area. This finding aligns with the results of Li and Chen’s study on the Xiaolangdi Reservoir, indicating that ecological water regulation within the reservoir has played a role in increasing surface water area and alleviating fragmentation [34,35].

3.2. Hydrographic Connectivity

The spatial distribution of water bodies in the study area was determined using MNDWI, as illustrated in Figure 4.
For structural and connectivity form indicators, from 2000 to 2020, the total length of rivers in the Henan section of the Yellow River Basin’s main stem and tributaries showed a general increase. The water area reached its minimum in 2000, then increased by almost 52% in 2005, and subsequently fluctuated by less than 10%. The river network density and water surface rate increased by 31% and 50%, respectively, from 2000 to 2005, but did not exhibit significant changes thereafter. The connectivity shape indices, the α, β, and γ indices, decreased continuously from 2000 to 2015, with the α index experiencing the largest drop of 59%, followed by the β index at 28%, and the γ index at 34%. After 2015, the α and β indices showed slight increases, while the γ index remained unchanged, as shown in Table 6. In the Henan section of the Yellow River Basin, the river channel breakage rate decreased annually and reached 0% in 2020, while the water quality compliance rate reached 100% in the same year. The urban water supply percentage has always been the highest, exceeding 80%, while agricultural and industrial water supply percentages are increasing with the former being over 40% and the latter being below 20%, as shown in Figure 5. Overall, between 2000 and 2015, changes in river length, area, and α, β, and γ values indicate substantial impacts on the structural connectivity of the study area’s river network, primarily driven by human activities [33]. Population growth and the expansion of agricultural and built-up areas have altered the river network’s structural morphology, resulting in the proliferation of tributaries and reduced connectivity and material exchange capabilities between nodes [36]. However, since 2015, there has been a gradual improvement in structural connectivity, sustained water quality, and increased urban water supply, possibly influenced by ecological water regulation practices implemented in upstream reservoirs [35].
Using the connectivity analysis approach based on SPA, the assessment grades of functional connectivity in the research area are obtained and presented in Table 7. The results indicate that natural function has remained medium/good over the 20-year period, with minor improvement observed. Meanwhile, social function exhibited poor functionality in 2000 and showed a steady increase, achieving a good rating by 2020. The amalgamated evaluation of both dimensions demonstrates a gradual rise in the integrated function level, with an elevation from medium to excellent grade.
In 2000, the structural indicators of the Henan section of the Yellow River Basin were low due to the damage inflicted on the river morphology by the prior rapid development of the social economy [37]. Since the beginning of the 21st century, the government and society as a whole have been increasingly concerned with environmental protection and water resource conservation, resulting in the implementation of a series of scientifically-based management measures that have facilitated some level of restoration of the study area’s hydrological system, leading to gradual improvements in its structural indicators, such as the length of the river, the water area, and the density of the river network [38]. However, the connectivity indicators decreased gradually between 2000 and 2020 due to human activities. Although the structural indicators of the study area’s hydrological system continue to improve, human interference has led to a more fragmented ecological landscape. This has caused the river channels, small watercourses, and ditches to proliferate, leading to a reduction in the flow and sediment transport of the main channel, fragmentation of the hydrological system, decreased connectivity and material transport capability between nodes of the river network, and has ultimately weakened the connectivity of the hydrological system, which only stabilized after 2010. In 2022, Wang studied the coupling and coordination relationships among the water resources, economic, and ecosystem systems in the Henan section of the Yellow River Basin. The results indicated a gradual increase in the overall coordination of the system during the period from 2000 to 2019, with the water resources system identified as the most influential subsystem within the comprehensive system [39]. This finding further demonstrates that changes in the structure and hydrological morphology of the river network not only affect its structural connectivity but also have implications for functional connectivity.
According to the integrated evaluation level of water system functional connectivity obtained through SPA method, the natural functional connectivity in the study area remained stable between 2000 and 2020, while the social and comprehensive functional connectivity showed a steady increase. The natural functional value had a slight increase from 2000 to 2005 and then remained stable, mainly due to the increased attention and remediation efforts towards the Yellow River’s flow discontinuity, with an increasing proportion of river sections meeting water quality standards. The social functional connectivity had a greater impact on the comprehensive functional connectivity of the study area. As river structure and natural function were restored and the social economy developed, the dependence on river systems for various demands increased, leading to a significant growth in social functional value, surpassing the natural functional value in 2015. The impact of human activities on the hydrological characteristics of rivers is multifaceted, and the increasing demands for social functions indirectly accelerate the restoration of natural functions [40]. The comprehensive functional connectivity evaluation of the study area reached a medium-high level in 2010 and an excellent level in 2020. The primary function connectivity values are shown in Figure 6.

3.3. Water Usage Distribution

Agricultural water use remains the highest in the Henan section of the Yellow River Basin, but has decreased over the past 20 years, while industrial water use increased until 2010 and then declined. Domestic water use has continued to rise and surpassed industrial water use in 2015. Total water use has increased, while per capita water use has decreased due to population growth. See Figure 7 for details on water use for each type.
In the wake of the 21st century, concomitant with rapid societal advancement, the Henan segment of the Yellow River Basin has witnessed a marginal diminishment in agricultural and unused land extents. Simultaneously, built-up land has burgeoned nearly threefold, primarily focalized in the radial expansion emanating from major urban centers. Figure 8 contrasts land utilization types for the years 2000 and 2020, centering on Zhengzhou city and its periphery. Evidently, buildings manifest a discernible east–west directional proliferation. Moreover, built-up land is widely dispersed in diminutive clusters, encroaching upon substantial tracts of agricultural land and partial forest land. This phenomenon constitutes a significant driver contributing to the gradual decrement in agricultural water consumption over the past two decades.
The water usage structure in the study area is dominated by agricultural water use, which is far higher than industrial and domestic water use. However, agricultural water usage steadily decreased between 2000 and 2015 due to the reduction in agricultural land area. In recent years, despite a slight increase in agricultural land area, agricultural water use has decreased due to the adoption of more precise irrigation techniques and more efficient water use in agriculture [41]. Meanwhile, industrial water use has continued to rise between 2000 and 2010 but decreased significantly after 2010 due to a slowdown in economic growth, the closure of environmentally unfriendly industries, and the development of high-tech and low-pollution industries [42].
Examining Zhengzhou city as a representative case in Figure 9, it becomes apparent that between 2000 and 2020, shifts in river course morphology occurred alongside an expansion in total area. The river network demonstrates a localized augmentation encircling the agricultural expanse proximate to Zhengzhou and its outskirts, marked by heightened network density. Furthermore, there is a notable proliferation of water channels, tributaries, and a conspicuous increase in reservoirs and lakes. The substantive contribution of urban greening and landscape construction to the amplification of aquatic domains is noteworthy. This pattern of aquatic structural evolution is not confined to Zhengzhou alone; the five other principal cities in the study area—namely Kaifeng, Luoyang, Xinxiang, Jiaozuo, and Puyang—exhibit comparable trends. Simultaneously, an analysis of water utilization transitions across these urban centers reveals a consistent upswing in residential water consumption throughout the two-decade interval. This underscores the pronounced influence of ongoing human socio-urbanization processes on the water utilization paradigm within the study area. The perpetually expanding urban terrain and the relentless surge in urban populace have culminated in an escalating predominance of residential water demand. Nevertheless, this escalation rate falls short of the surge in water requisition spurred by demographic growth, thereby resulting in a diminished per capita water utilization within the study area.
Figure 8 and Figure 9, respectively, illustrate the gradual decline in agricultural water usage resulting from changes in land use around typical urban areas in the study area and the expansion of water systems leading to a rapid increase in urban water usage. This pattern of change is evident in various major cities and their surrounding areas within the study area. During the period from 2000 to 2010, industrial and domestic water usage increased annually at nearly the same rate, aligning with the practical trend of coordinated development between industrialization and urbanization. However, in 2010, due to water resource conservation efforts and industrial transformation, numerous factories ceased operations or relocated, resulting in a decline in industrial water usage within the study area, which reached a level comparable to that of 2000 by the year 2020. Meanwhile, since 2015, the inclusion of ecological water usage in water statistics, integrated into the accounting of domestic water consumption, has led to a notable acceleration in its growth rate, surpassing that of industrial water usage. The social function connectivity of the water system in the study area is mainly contributed by urban domestic water use. Despite the decrease in per capita water use, the overall per capita water use in the study area remains above the national average [43]. Thus, the water usage structure in the study area is reasonable and positively correlated with the water system connectivity of the Yellow River Henan section.

4. Conclusions

Between 2000 and 2020, the land use composition in the Henan section of the Yellow River Basin underwent significant changes, driven primarily by urbanization and socio-economic development. Agricultural land emerged as the dominant land-use type during this period, while rivers and reservoirs were the least utilized. Notably, the expansion of built-up areas experienced substantial growth, altering the landscape of the study area.
During this timeframe, the implementation of various hydraulic engineering projects and water resource protection policies contributed to the improved structural form and enhanced integrity of the water system in the study area. However, the construction of diversion canals and the sediment accumulation in the mainstream reservoirs resulted in a reticular water system with reduced sediment transport capacity, limited material exchange between nodes, and decreased overall connectivity. It was only after 2010, with the introduction of reservoir regulation and ecological environment protection measures, that the connectivity of the water system stabilized.
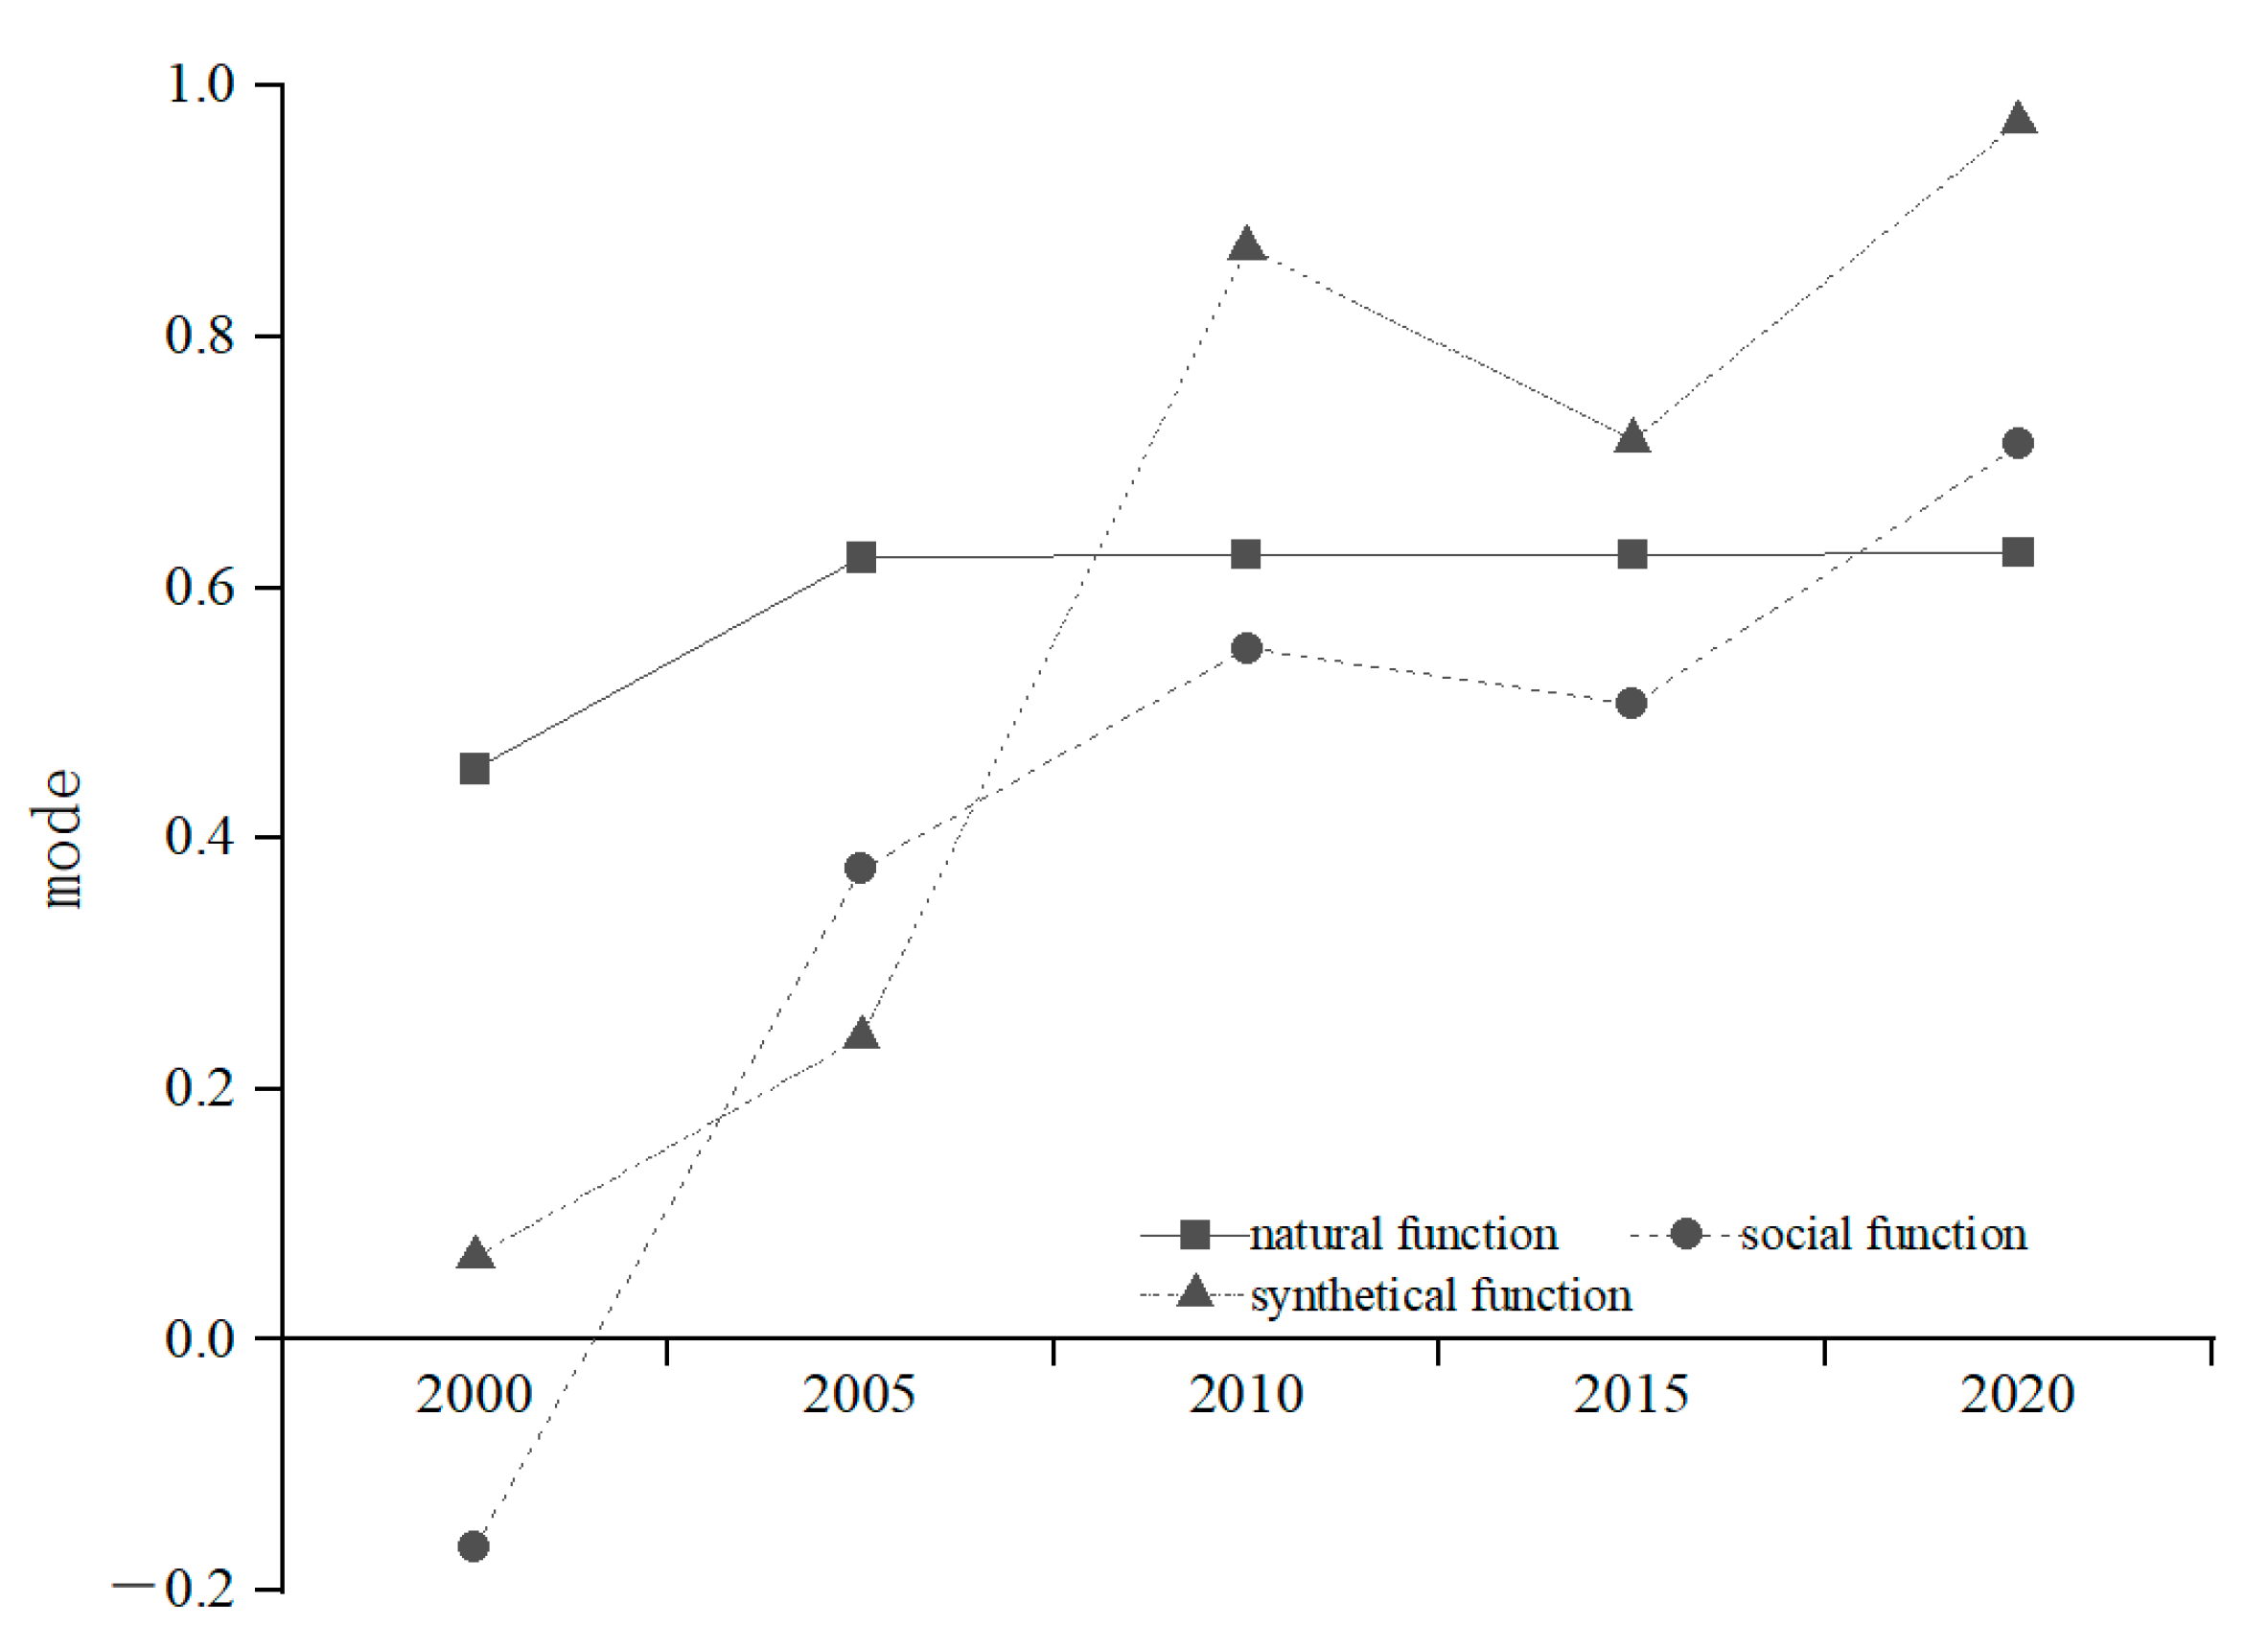
The functional connectivity of the water system in the study area exhibited a gradual and positive trend, reaching a satisfactory level overall. In the early 21st century, the natural function was rated as medium but steadily improved to a good level while remaining stable. On the other hand, the social function initially faced challenges such as interrupted flow and high sediment content, leading to a poor rating. However, as the structural connectivity of the water system increased, the social function also improved and eventually achieved a good rating. The integrated functional connectivity of the water system in the study area, primarily influenced by the social function, progressively improved over the 20-year period, culminating in an optimal rating in 2020. This signifies that the functional connectivity of the water system in the study area has consistently advanced over the past two decades, reaching its peak in 2020.
Within the study area, the agricultural sector emerged as the largest water consumer, with domestic water usage experiencing the most significant growth. Although per capita water consumption decreased due to population expansion, it still exceeded the national average. Despite the pressures exerted on the water system by urban expansion and population growth, recent changes in the water usage structure have had a positive impact on the functional connectivity of the water system in the study area.
It is suggested that future work can be carried out in the following aspects: First, by improving the accuracy of front-end data sources. The spatial and temporal limitations of remote sensing interpretation of water body and water system data have restricted the overall accuracy of the framework. Second, from the perspective of integrating management and theory, by combining relevant evaluation and optimization frameworks with big data platforms to construct a watershed management intelligent platform, which can provide real-time data prediction for comprehensive decision-making by management departments.

Supplementary Materials

The following supporting information can be downloaded at: https://www.mdpi.com/article/10.3390/w15244245/s1, Table S1: Comparative analysis of two different n-dimensional correlation coefficient calculation methods for distinct types of indicators using the Set Pair Analysis approach; Table S2: Relation number of the criterion layer comprehensive evaluation using Set Pair Analysis.

Author Contributions

Z.L.: Data curation, Visualization, Writing—original draft. C.W.: Investigation, Supervision, Writing—review and editing. J.Z.: Resources, Validation. F.Y.: Project administration, Supervision, Methodology. All authors have read and agreed to the published version of the manuscript.

Funding

This study was funded by the Strategic Priority Research Program of Chinese Academy of Sciences (XDA19040102), and The Third Xinjiang Scientific Expedition Program of Chinese Academy of Sciences (2022xjkk0902).

Data Availability Statement

All data generated or analyzed during this study are included in this article.

Conflicts of Interest

The authors declare that they have no known competing financial interests or personal relationships that could have appeared to influence the work reported in this paper.

References

  1. Freeman, M.C.; Pringle, C.M.; Jackson, C.R. Hydrologic connectivity and the contribution of stream headwaters to ecological integrity at regional scales. J. Am. Water Resour. Assoc. 2007, 43, 5–14. [Google Scholar] [CrossRef]
  2. Pringle, C. What is hydrologic connectivity and why is it ecologically important? Hydrol. Process. 2003, 17, 2685–2689. [Google Scholar] [CrossRef]
  3. Bracken, L.J.; Wainwright, J.; Ali, G.A.; Tetzlaff, D.; Smith, M.W.; Reaney, S.M.; Roy, A.G. Concepts of hydrological connectivity: Research approaches, pathways and future agendas. Earth-Sci. Rev. 2013, 119, 17–34. [Google Scholar] [CrossRef]
  4. Liu, J.; Engel, B.A.; Zhang, G.; Wang, Y.; Wu, Y.; Zhang, M.; Zhang, Z. Hydrological connectivity: One of the driving factors of plant communities in the Yellow River Delta. Ecol. Indic. 2020, 112, 106150. [Google Scholar] [CrossRef]
  5. Turnbull, L.; Wainwright, J.; Brazier, R.E. A conceptual framework for understanding semi-arid land degradation: Ecohydrological interactions across multiple-space and time scales. Ecohydrology 2008, 1, 23–34. [Google Scholar] [CrossRef]
  6. Deng, X.; Xu, Y.; Han, L.; Song, S.; Xu, G.; Xiang, J. Spatial-temporal changes in the longitudinal functional connectivity of river systems in the Taihu Plain, China. J. Hydrol. 2018, 566, 846–859. [Google Scholar] [CrossRef]
  7. Cui, Y.; Xiao, R.; Zhang, M.; Wang, C.; Ma, Z.; Xiu, Y.; Wang, Q.; Guo, Y. Hydrological connectivity dynamics and conservation priorities for surface-water patches in the Yellow River Delta National Nature Reserve, China. Ecohydrol. Hydrobiol. 2020, 20, 525–536. [Google Scholar] [CrossRef]
  8. Dai, L.Y.; Zhang, Y.H.; Liu, Y.; Xie, L.M.; Zhao, S.Q.; Zhang, Z.M. Thick roots and less microaggregates improve hydrological connectivity. Chemosphere 2021, 266, 9. [Google Scholar]
  9. Lesschen, J.P.; Schoorl, J.M.; Cammeraat, L.H. Modelling runoff and erosion for a semi-arid catchment using a multi-scale approach based on hydrological connectivity. Geomorphology 2009, 109, 174–183. [Google Scholar] [CrossRef]
  10. Liu, C.X.; Chen, Y.N.; Fang, G.H.; Zhou, H.H.; Huang, W.J.; Liu, Y.C.; Wang, X.X.; Li, Z. Hydrological connectivity improves the water-related environment in a typical arid inland river basin in Xinjiang, China. Remote Sens. 2022, 14, 18. [Google Scholar] [CrossRef]
  11. Tan, Z.Q.; Li, Y.L.; Zhang, Q.; Liu, X.G.; Song, Y.Y.; Xue, C.Y.; Lu, J.Z. Assessing effective hydrological connectivity for floodplains with a framework integrating habitat suitability and sediment suspension behavior. Water Res. 2021, 201, 9. [Google Scholar] [CrossRef]
  12. Tian, N.; Zhang, Y.; Li, J.; Du, W.; Liu, X.; Jiang, H.; Bian, H. Evaluation and optimization of hydrological connectivity based on graph theory: A case study in Dongliao river basin, China. Water 2022, 14, 3958. [Google Scholar] [CrossRef]
  13. Ocallaghan, J.F.; Mark, D.M. The extraction of drainage networks from digital elevation data. Comput. Vis. Graph. Image Process. 1984, 28, 323–344. [Google Scholar] [CrossRef]
  14. Karim, F.; Kinsey-Henderson, A.; Wallace, J.; Arthington, A.H.; Pearson, R.G. Modelling wetland connectivity during overbank flooding in a tropical floodplain in north Queensland, Australia. Hydrol. Process. 2012, 26, 2710–2723. [Google Scholar] [CrossRef]
  15. Grimm, K.; Chu, X. Modeling of spatiotemporal variations in runoff contribution areas and analysis of hydrologic connectivity. Land. Degrad. Dev. 2018, 29, 2629–2643. [Google Scholar] [CrossRef]
  16. Feng, J.; Li, Q.; Liang, C.; Zhang, X.; Yue, Y.; Gao, J. Landscape index analysis of hydrological connectivity dynamics in the Yellow River Delta. J. Beijing Norm. Univ. Nat. Sci. 2021, 57, 12–21. [Google Scholar]
  17. Liu, X.; Zhang, Q.; Li, Y.; Tan, Z.; Werner, A.D. Satellite image-based investigation of the seasonal variations in the hydrological connectivity of a large floodplain (Poyang Lake, China). J. Hydrol. 2020, 585, 124810. [Google Scholar] [CrossRef]
  18. McFeeters, S.K. The use of the normalized difference water index (NDWI) in the delineation of open water features. Int. J. Remote. Sens. 1996, 17, 1425–1432. [Google Scholar] [CrossRef]
  19. Ding, F. A new method for fast information extraction of water bodies using remotely sensed data. Remote Sens. Technol. Appl. 2009, 24, 167–171. [Google Scholar]
  20. Yin, L.; Feng, X.; Fu, B.; Wang, S.; Wang, X.; Chen, Y.; Tao, F.; Hu, J. A coupled human-natural system analysis of water yield in the Yellow River basin, China. Sci. Total Environ. 2021, 762, 143141. [Google Scholar] [CrossRef]
  21. Chen, H.; Jeanne Huang, J.; McBean, E.; Singh, V.P. Evaluation of alternative two-source remote sensing models in partitioning of land evapotranspiration. J. Hydrol. 2021, 597, 126029. [Google Scholar] [CrossRef]
  22. Liao, Y.; Liao, Y.Q.; Zhao, W.J.; Chen, Q.H.; Li, T.; Yang, T.J. Study on mangrove of maximum likelihood: Reclassification method in Xiezhou bay. J. Coast. Res. 2020, 102, 334–343. [Google Scholar] [CrossRef]
  23. Xu, H. Modification of normalised difference water index (NDWI) to enhance open water features in remotely sensed imagery. Int. J. Remote. Sens. 2007, 27, 3025–3033. [Google Scholar] [CrossRef]
  24. Zhang, Y.; Huang, C.; Zhang, W.; Chen, J.; Wang, L. The concept, approach, and future research of hydrological connectivity and its assessment at multiscales. Environ. Sci. Pollut. Res. 2021, 28, 52724–52743. [Google Scholar] [CrossRef]
  25. Zhang, Z.; Yu, X.; Song, X.; Xue, Z.; Wu, H. Impacts of hydrological connectivity on key ecological processes and functions in wetlands: A general review. Wetl. Sci. 2019, 17, 1–8. [Google Scholar]
  26. GB3838-2002; Environmental Quality Standards for Surface Water. Ministry of Ecology and Environment of the People’s Republic of China: Beijing, China, 2002.
  27. GB5749-2006; Standards for Drinking Water Quality. State Administration for Market Regulation: Beijing, China, 2006.
  28. GB5084-2005; Standard for Irrigation Water Quality. Ministry of Ecology and Environment of the People’s Republic of China: Beijing, China, 2005.
  29. Wang, W.S.; Jin, J.L.; Ding, J.; Li, Y.Q. A new approach to water resources system assessment—Set pair analysis method. Sci. China Ser. E-Technol. Sci. 2009, 52, 3017–3023. [Google Scholar] [CrossRef]
  30. Wu, K.; Jin, J.; Wang, W. Combination evaluation model based on Set Pair analysis and Its application. Math. Pract. Theory 2013, 43, 1–6. [Google Scholar]
  31. Wang, W.S.; Li, Y.Q.; Jin, J. Relation analysis of hydrological variables based on Set Pair principle. J. Sichuan Univ. Eng. Sci. Ed. 2009, 41, 1–5. [Google Scholar]
  32. Jin, J.; Wei, Y.; Wang, W. Set pair analysis based on similarity forecast model of water resources. J. Hydroelectr. Eng. 2009, 28, 72–77. [Google Scholar]
  33. Niu, H.; Zhao, X.; Xiao, D.; An, R.; Liu, M. Spatial-temporal pattern evolution and trade-off relationship of cultivated land multifunction in the Yellow River Basin (Henan Section). Trans. Chin. Soc. Agric. Eng 2022, 38, 223–236. [Google Scholar]
  34. Li, A.; Xia, G.; Xu, J.; Yan, C. Analysis of the spatial and temporal variation of the lower yellow river channel before and after the operation of Xiaolangdi reservoir. J. Geomat. Sci. Technol. 2018, 35, 373–375+382. [Google Scholar]
  35. Chen, X.X.; Ye, S.; Pan, H.; Wang, J.; Ran, Q.H. The impacts of reservoir operation on river hydrological regime: A case study of Longyangxia reservoir and Xiaolangdi reservoir. Chin. Rural Water Hydropower 2022, 15, 96–104. [Google Scholar]
  36. Shao, Y.; Xu, Y.; Ma, S. Change of river structure and stream network connectivity in the Taihu lake basin under the unbanization development -a case study in urban Suzhou. Resour. Environ. Yangtze Basin 2012, 21, 1167–1172. [Google Scholar]
  37. Wei, H.; Zhang, Y.; Zhu, N.; Li, X. Temporal-spatial changes of farmland productivity in Henan province using MODIS data. Sci. Surv. Mapp 2014, 39, 67–71. [Google Scholar]
  38. Tao, J.; Qiao, W.Z.; Li, H.; Qu, X.N.; Gan, R. Spatial and temporal evolution characteristics and causes of drought and flood in the Henan section of the Yellow River. Nat. Hazards 2022, 113, 997–1016. [Google Scholar] [CrossRef]
  39. Wang, S.S.; Yang, J.Y.; Wang, A.L.; Yan, Y.F.; Liu, T.F. Coupled coordination of water resources-economy-ecosystem complex in the Henan section of the Yellow River basin. Water Supply 2022, 22, 8835–8848. [Google Scholar] [CrossRef]
  40. Cui, B.; Cai, Y.; Xie, T.; Ning, Z.; Hua, Y. Ecological effects of wetland hydrological connectivity: Problems and prospects. J. Beijing Norm. Univ. Nat. Sci. 2016, 52, 738–746. [Google Scholar]
  41. Yao, S.; Wu, D.; Yang, H.; Yang, W.; Feng, S.; Li, G. Preliminary study on problems and solutions in soil and water-environment of agricultural irrigation system in Henan province. J. Water Resour. Water Eng. 2010, 21, 35. [Google Scholar]
  42. Xu, F.; Shi, J.; Han, Y.; Zhao, H.; Wang, F. Evolution of water use structure and evaluation of spatial equilibrium in the Yellow river basin of Henan province. J. North Chin. Univ. Water Resour. Electr. Power (Nat. Sci. Ed.) 2023, 44, 41–48. [Google Scholar]
  43. Sun, S.; Tang, Q. Spatiotemporal patterns and driving factors of water resources use in the Yellow River Basin. Resour. Sci. 2020, 42, 2261–2273. [Google Scholar] [CrossRef]
Figure 1. Geographical location of the study area.
Water 15 04245 g001
Figure 2. The remote sensing images covering the study area were subjected to maximum likelihood supervised classification using ENVI software to determine the distribution and types of six land use categories during five time periods spanning from 2000 to 2020.
Water 15 04245 g002
Figure 3. Proportional changes of six land use types in the study area during the period from 2000 to 2020.
Water 15 04245 g003
Figure 4. The MNDWI method was employed in the ENVI software to extract water body information and its distribution within the study area for five time periods spanning from 2000 to 2020.
Water 15 04245 g004
Figure 5. Temporal variations in the proportions of urban, industrial, and agricultural water supply in the study area between 2000 and 2020.
Water 15 04245 g005
Figure 6. Temporal variations of the principal values derived from the Set Pair Analysis of the natural function, social function, and synthetical function of the river system in the study area during the period from 2000 to 2020.
Water 15 04245 g006
Figure 7. Variations in agricultural, industrial, and domestic water consumption in the study area during the period from 2000 to 2020.
Water 15 04245 g007
Figure 8. Land-Use Type Changes in Zhengzhou City and Its Surrounding Areas (2000/2020).
Water 15 04245 g008
Figure 9. Hydrological changes in Zhengzhou city and its surrounding areas (2000/2020).
Water 15 04245 g009
Table 1. Geographical parameters of the study area inputted into the FLAASH atmospheric correction model in ENVI software, aiming to eliminate a series of effects caused by solar radiation passing through the atmosphere in remote sensing imagery.
ParametersValueParametersValue
Sensor typeLandsatSensor height (km)705
Pixel size (m)30Ground elevation (km)0.494
Aerosol modelSuburban modelAtmospheric modelMidlatitude summer
Water vapor inversionNoneAerosol retrieval2-Band (K-T)
Table 2. Selected evaluation indicators for the structural connectivity of the study area’s water network, including four indicators related to structural form and three indicators related to connectivity form.
CategoryIndicator NameEquationNotes
Structural form indicatorsLength of river (L)LTotal length of rivers in the region
Water area (A)AwArea occupied by all water surface under the average water level in the region
Density of river network (Rd) R d = L / A A: Total area of the region
Water surface rate (WP) W P = ( A w / A ) 100 %
Connectivity form indicatorsα index α = n v + 1 / ( 2 v 5 ) n: Number of water systems in the river network
v: Number of river network nodes
β index β = n / v
γ index γ = n / 3 ( v 2 )
Table 3. Selected evaluation indicators for functional connectivity of the water network in the study area, including two natural functional indicators and three social functional indicators.
Target LayerGuideline LayerIndicator LayerNotes
Natural FunctionsMaterial–energy transferRiver breakage rateThe share of disconnected rivers in the water system
Water environment purificationWater quality compliance rateProportion of compliant watercourse length in the water system.
Social FunctionsWater allocationPercentage of urban water supplyThe proportion of surface water in urban water supply
Percentage of industrial water supplyThe proportion of surface water in industrial water use
Percentage of agricultural water supplyThe proportion of surface water in agricultural water use
Table 4. Evaluation criteria for the selected study area’s functional connectivity indicators.
Indicator LayerExcellentGoodMediumPoor
River breakage rate10%30%60%100%
Water quality compliance rate95%60%40%20%
Percentage of urban water supply100%90%80%70%
Percentage of industrial water supply40%20%10%5%
Percentage of agricultural water supply80%60%30%10%
Table 5. Area values and changes in various land use types within the study area during the period from 2000 to 2020.
2000 (km2)2005 (km2)2010 (km2)2015 (km2)2020 (km2)
Built-up land1176.912408.962725.574403.193762.83
Unused land2344.592198.562092.832547.141537.43
Forests286.971423.292249.701598.021022.06
Agricultural land15,854.7813,706.3112,734.6711,435.3612,274.25
Reservoirs/lakes65.59277.19332.02122.24114.73
Rivers677.88377.408260.38283.57394.55
Total20,406.7020,391.7220,395.1720,389.5219,105.84
Table 6. Variations in connectivity morphology indicators in the study area from 2000 to 2020.
20002005201020152020
River network Density Rd0.0420.0550.0600.0550.073
River network Nodes V1214191727
α0.370.220.090.070.08
β1.501.291.111.061.11
γ0.600.500.410.400.40
Note: α as the water network’s loopiness, β as the nodal connectivity, and γ as the water network connectivity.
Table 7. Variation in evaluation indices for the target layer in the study area from 2000 to 2020.
Target Layer20002005201020152020
Main ValueGradeMain ValueGradeMain ValueGradeMain ValueGradeMain ValueGrade
Natural function0.46Medium0.62Good0.63Good0.63Good0.63Good
Social function−0.17Poor0.38Medium0.55Good0.51Medium0.71Good
Integrated functions0.07Medium0.24Medium0.87Good0.72Good0.97Excellent
Note: The range of −0.17 to 0.0 represents a poor rating, 0.01 to 0.51 represents a medium rating, 0.52 to 0.90 represents a good rating, and 0.91 to 1 represents an excellent rating.
Disclaimer/Publisher’s Note: The statements, opinions and data contained in all publications are solely those of the individual author(s) and contributor(s) and not of MDPI and/or the editor(s). MDPI and/or the editor(s) disclaim responsibility for any injury to people or property resulting from any ideas, methods, instructions or products referred to in the content.

