Article

The Value of Surface Freshwater Supply Services in the Wetlands of Jilin Province, China

1
Institute of Wetland Research, Chinese Academy of Forestry, Beijing 100091, China
2
Institute of Ecological Conservation and Restoration, Chinese Academy of Forestry, Beijing 100091, China
3
Beijing Key Laboratory of Wetland Services and Restoration, Beijing 100091, China
4
Jilin Provincial Academy of Forestry Sciences, Changchun 130033, China
*
Author to whom correspondence should be addressed.
Water 2024, 16(2), 203; https://doi.org/10.3390/w16020203
Submission received: 12 November 2023 / Revised: 24 December 2023 / Accepted: 3 January 2024 / Published: 6 January 2024

Abstract

:
Wetlands are ecologically and socioeconomically crucial areas. The application of economic valuation methods could ensure the sustainable utilization of wetlands. Utilizing wetland survey data from Jilin Province, China, representative of the years 2013 and 2017, we assessed the market value of water obtained from wetlands. Simultaneously, we employed the PLUS model to predict changes in wetland areas of different types over the next decade and analyzed their impact on the value of freshwater resource supplies. The results indicate the following points: (1) the area of wetlands decreased from 10,852.84 km2 in 2013 to 10,794.46 km2 in 2017 and that, in 2027, this was projected to further decrease to 10,614.37 km2, with river wetlands experiencing the most substantial decline; (2) the freshwater volumes in 2013 and 2017 were 20.81 × 10⁸ and 20.09 × 10⁸ m3, respectively, representing a 3.58% decrease. The volume for 2027 was projected to further reduce to 19.74 × 10⁸ m3, with lake wetlands contributing the most to water resources and marsh wetlands contributing the least; and (3) the obtained total value of freshwater continuously increased, rising from CNY 8.384 billion in 2013 to CNY 8.642 billion in 2017, and this was projected to further increase to CNY 9.101 billion in 2027. There was regional variation in the value of wetland freshwater resource supplies, with differences in the per unit area and per capita value among administrative units. These findings can facilitate the optimal allocation of freshwater resources in Jilin Province, promoting its sustainable development while ensuring wetland conservation.

1. Introduction

The environmental conditions and materials necessary for human survival are collectively referred to as ecosystem services, highlighting the interdependence of humans and nature. Understanding and maintaining these ecosystem services is crucial for maintaining ecological balance, promoting sustainable development, and enhancing the quality of human life [1]. Ecosystem service assessments primarily reveal the economic value of ecosystems through economic methods, allowing people to understand the contributions and importance of ecosystems to human society more intuitively. Quantifying the economic benefits of and human preferences for ecosystems can provide a theoretical basis for the construction of an ecological civilization and play a significant role in increasing human awareness of ecosystem protection [2,3].
Various methods have been used to assess ecosystem services. Choosing an appropriate assessment method, such as market value or cost reset methods, for the quantification of ecosystem services can assist in the management and protection of ecological resources, provide a theoretical basis for policymaking, and promote the ecological and sustainable development of the socio-economy [4]. Extensive research has been conducted worldwide to evaluate different types of ecosystem services [5,6,7,8]. Wetland ecosystems are complex ecosystems formed by the interaction of water and land. Along with marine and forest ecosystems, they are considered one of the three most important ecosystems on Earth, with significant ecological and socioeconomic value [9,10]. Wetlands possess unique functions and material supply capabilities. They play an irreplaceable role in climate regulation, water purification, flood control, and storage, and can provide substantial ecological, economic, and social benefits [11]. Daily et al. [12] first proposed the concept of wetland ecosystem services and methods for evaluation. Some scholars have discussed valuation frameworks, including the estimation of the total economic value of restoring and protecting ecosystem services from a sustainability perspective. According to the United Nations Millennium Ecosystem Assessment, wetland ecosystem services are categorized into four major types (i.e., provisioning, regulating, supporting, and cultural services) based on the actual conditions of different wetlands and their ecosystem structural characteristics [13,14]. Among these, the freshwater supply function (water provision) is one of the most important. Wetlands, such as rivers and lakes, typically have high water levels and are capable of accumulating and storing high volumes of freshwater. Moreover, wetlands recharge the surrounding groundwater through seepage and hydrological processes, thereby maintaining groundwater levels and reserves [15]. The freshwater in wetlands can also supply drinking water to society, provide freshwater resources for agricultural irrigation, and support the biodiversity of various ecosystems. Therefore, quantifying the economic value of freshwater supply through economic valuation with respect to the efficient use of freshwater resources in wetlands is crucial for the economic prosperity and sustainable development of society and nations [16]. The currently employed methods to determine the value of freshwater resources primarily involve the consultation of relevant data on regional water flows and the collection of water resource values based on local water prices [17]. However, different wetland types have varying water storage capacities, and some may not be directly usable for water resource provision [18]. Thus, it is essential to consider these aspects when calculating the value of wetland freshwater supplies.
Jilin Province, located in northeastern China, has abundant wetland resources [19]. Huang et al. [20] conducted a study on the wetland ecosystem service values of 19 different types within Momoer National Nature Reserve in Jilin Province. Yu et al. [21] found that the wetlands of Jilin Province could provide approximately CNY 58.328 × 10⁹ of the ecosystem service value annually. Zhang et al. [22] discovered that in the western part of Jilin, marshes, farmland, water bodies, and grasslands primarily contribute to the ecosystem service value. Cai et al. [23] focused on the ecological service value of an interconnected river system network project in western Jilin Province. However, current research on wetland ecosystem services in Jilin Province mainly focuses on the assessment of ecological service values within a single time frame, with limited attention to the spatiotemporal changes in the value of wetland resources [17,24]. Moreover, there is still a need for in-depth studies on future changes in wetland areas and the value of freshwater resource supplies.
Therefore, based on two rounds of wetland resource surveys in Jilin Province, we analyzed changes in wetland areas and freshwater supplies and calculated the freshwater supply value of wetlands in Jilin Province. The PLUS model was employed to identify changing patterns in land use in Jilin Province from 2013 to 2017 and predict the value of wetland freshwater resources in 2027. This research provides essential support for the optimal allocation of wetland freshwater resources, the sustainable development of socio-economic and ecological environments, and wetland conservation in Jilin Province.

2. Materials and Methods

2.1. Overview of the Study Area

Jilin Province (40°52′–46°18′ N, 121°38′–131°19′ E) is in the central part of the northeastern region of China, with a total area of approximately 187,400 km2 (Figure 1). The province mainly experiences a temperate continental monsoon climate, with most areas having an annual average temperature of 3–5 °C and annual precipitation ranging from 450 to 910 mm [25]. Jilin Province serves as the headwater province for major rivers in the northeastern region, with a total wetland area of approximately 230,300 ha, as per the Third National Land Survey. The topography of Jilin Province can be divided into two major regions: the western plain and eastern mountainous areas. In the eastern mountainous region, riverine wetlands are the predominant wetland type, and these wetlands are primarily distributed in the Changbai Mountain region and some low mountainous and hilly areas. Lake wetlands are mainly concentrated in the western plain area of Jilin Province, with Bai Cheng and Songyuan having the highest number of lakes. Marsh wetlands are primarily located in the Songyuan, Bai Cheng, Yanbian, and Yanji areas, and these marsh wetlands are crucial for wetland ecosystems and biodiversity conservation. Artificial wetlands include reservoirs, ponds, and canals for water conveyance. These wetland resources play significant roles in ecological protection, water resource management, and agricultural production in Jilin Province [26,27].

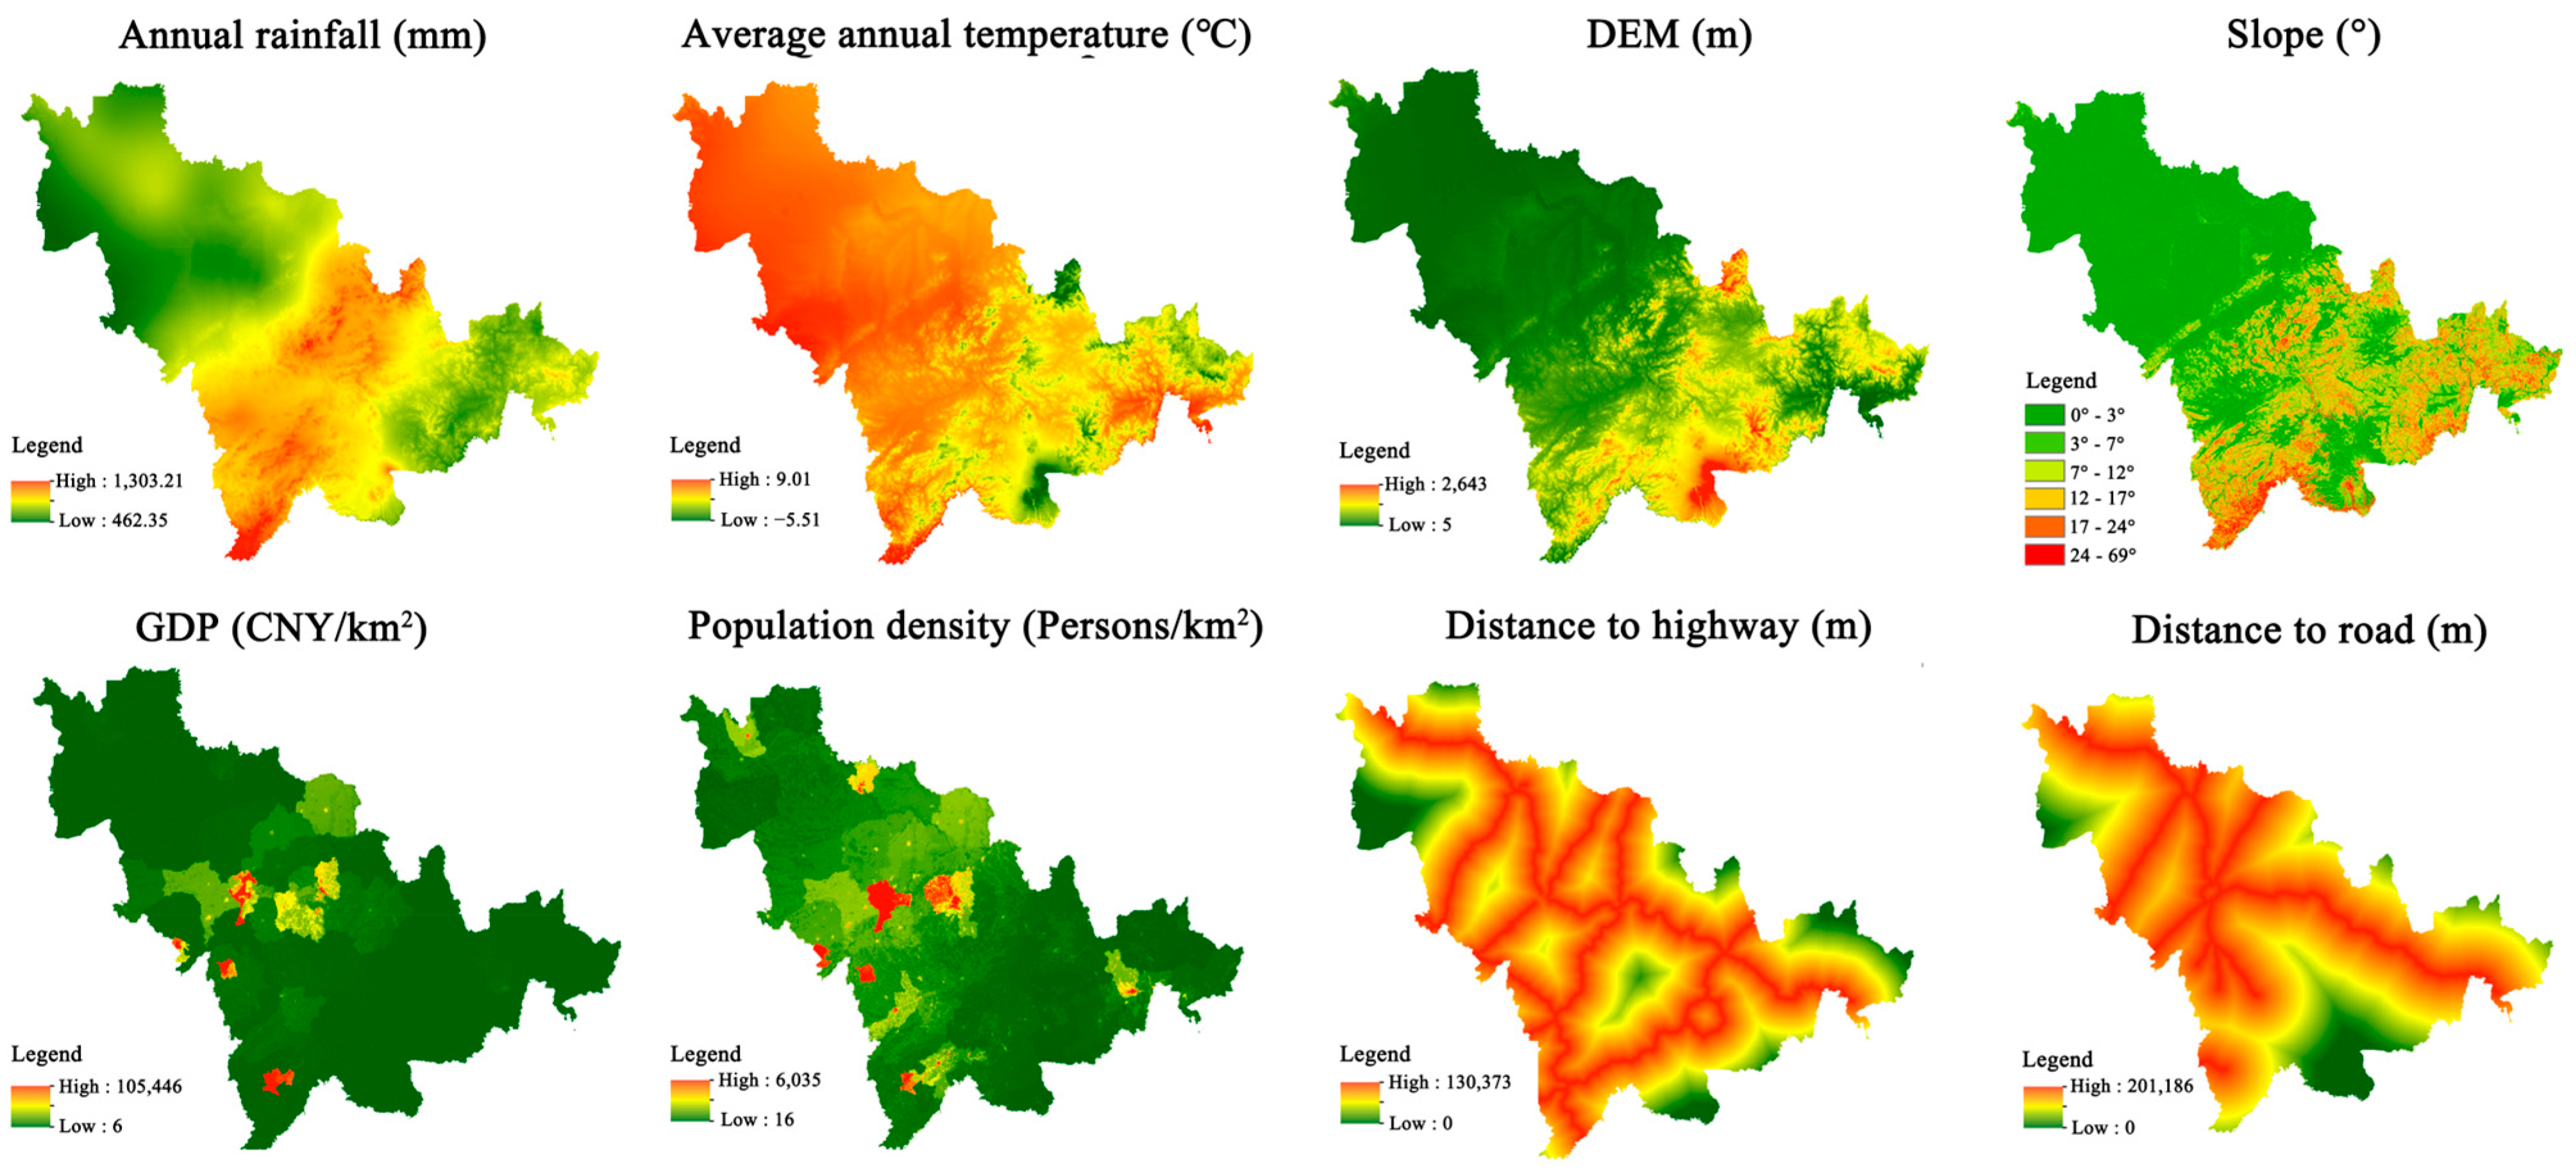
2.2. Data Collection and Selection

2.2.1. Data Collection

The relevant wetland data in this paper mainly originate from the wetland resource survey of Jilin Province, including the distribution of wetland patches and original data on water depth. The land use type, GDP, annual precipitation, annual average temperature, soil, and digital elevation model (DEM) were all sourced from the Chinese Academy of Sciences Resource and Environment Science Data Center [28]. Population density raster data were sourced from the WorldPop website [29]. Vector data for roads, railways, and other transportation networks at various levels were obtained via the AMap API using Python. Socioeconomic data were sourced from the ‘Statistical Yearbook of Jilin Province’ [30]. The water prices were sourced from the ‘China Water Network Platform’ [31].

2.2.2. Selection of Water Resource Supply Values for Different Wetland Types

The freshwater supply of wetlands varies across wetland types. Therefore, we selected wetland types capable of providing freshwater resources based on their value and characteristics (Table S1). Riverine wetlands were categorized into two secondary classes: permanent rivers and seasonal or intermittent rivers. Marsh wetlands included herbaceous marshes, lake wetlands including permanent freshwater lakes, and artificial wetlands encompassing reservoirs.

2.3. Methodology

In this study, we primarily utilized field surveys to verify the original wetland data for two periods. The data were input into ArcGIS to calculate the corresponding wetland areas. SPSS (version 26.0) was employed to compute the freshwater storage in wetlands, and the market valuation method was applied to assess the freshwater supply value of existing wetlands. The analysis focused on changes in wetland area, freshwater supply quantity, and freshwater supply value. The PLUS model was applied to predict future changes in wetland areas in Jilin Province. The equivalent method was used to forecast the future freshwater resource supply value of the wetlands.

2.3.1. Markov Chain Model

Markov chains are widely utilized in the study of land use and land cover changes [32]. By using the Markov chain model, the transition probabilities of land use changes were stochastically derived from two-period land use data. This simulated a matrix representing the temporal evolution of land use, serving as the foundation for predicting subsequent changes. The calculation formula is as follows:
P i j = P 11 P 12 P 21 P 22 P 1 n P 2 n P n 1 P n 2 P n n ^ j = 1 n P i j = 1 ( i , j = 1,2 , , n )
S t + 1 = P i j × S t
where Pij represents the transition probability matrix for land use types; St and St+1 represent the land use at time periods t and t + 1, n, respectively; and n denotes the land use type.

2.3.2. PLUS Model

The PLUS model is a land use change simulation model that integrates a land expansion strategy analysis module and a cellular automaton model based on multi-class random patch seeds [33]. The rule mining method of the land expansion analysis strategy (LEAS) module extracts partial information on land use change between two periods. The random forest algorithm was applied to systematically mine factors associated with the changes in and driving forces for each land use type. This process yielded the development probabilities for various land use categories and aided in assessing the contribution of driving factors of changes in each land use category during the specified time period. The cellular automaton (CA) model based on a multi-type random seed mechanism was employed. This model combined random seed generation and a threshold-decreasing mechanism to dynamically simulate the self-generation of patches in space and time under the constraints of development probabilities.

2.3.3. Model for Calculating Water Resource Supply Prices

The market value approach was applied to determine the unit accounting value of freshwater supplies in Jilin Province’s wetland ecosystems. Due to the complexity of groundwater resource replenishment processes, such processes were not considered in this study. Public data published by authoritative agencies were used to obtain the prices of industrial, agricultural, domestic, and ecological water in Jilin Province (in CNY per cubic meter). Due to the inability to predict the unit price of freshwater, the equivalent method was employed using the water prices from the most recent years. This was calculated as follows:
C = i = 1 n A i × H i
L ¯ = e 1 L 1 + e 2 L 2 + e 3 L 3
V w a t e r = C × L ¯
where C is the water supply volume (m3), Ai is the wetland area (m2), Hi is the average water depth of the wetland (m), Vwater is the water supply value, L ¯ is the unit price (CNY), L1 stands for the comprehensive price of industrial and agricultural water use, L2 represents the domestic water price, L3 signifies the ecological water price, e1 corresponds to the proportion of industrial and agricultural water use, e2 denotes the proportion of domestic water use, and e3 represents the proportion of ecological water use.

3. Results

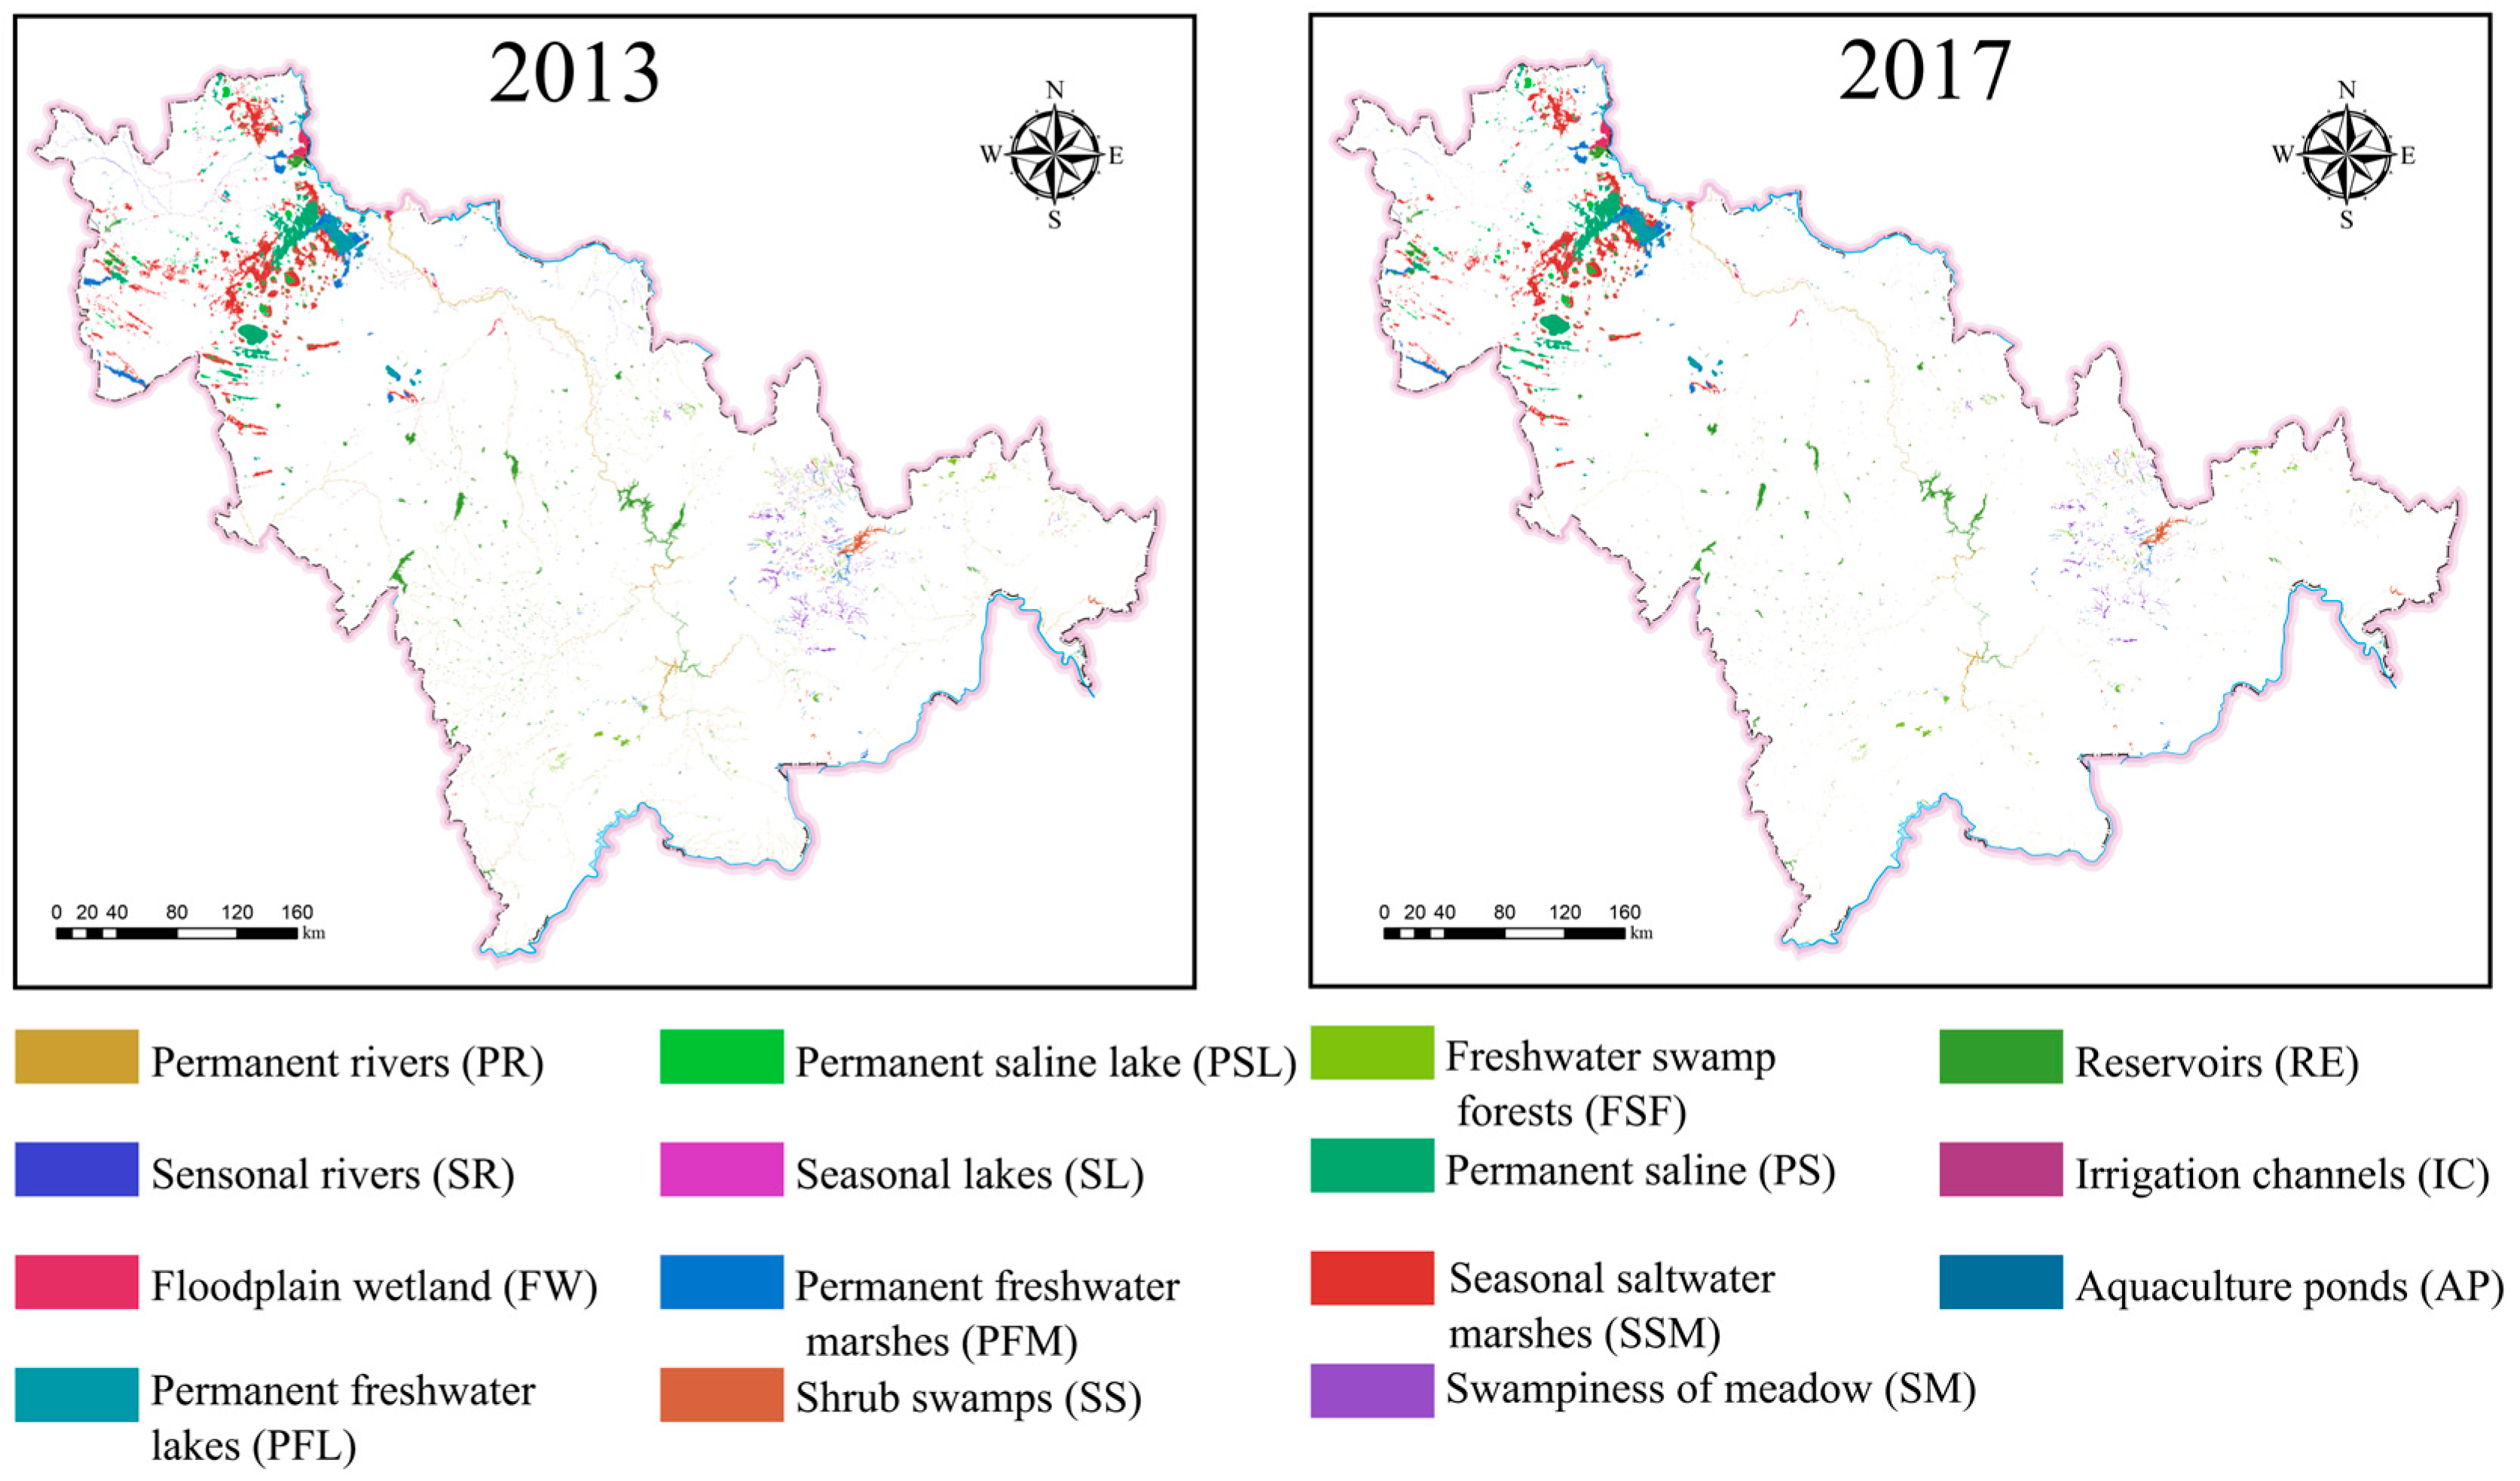
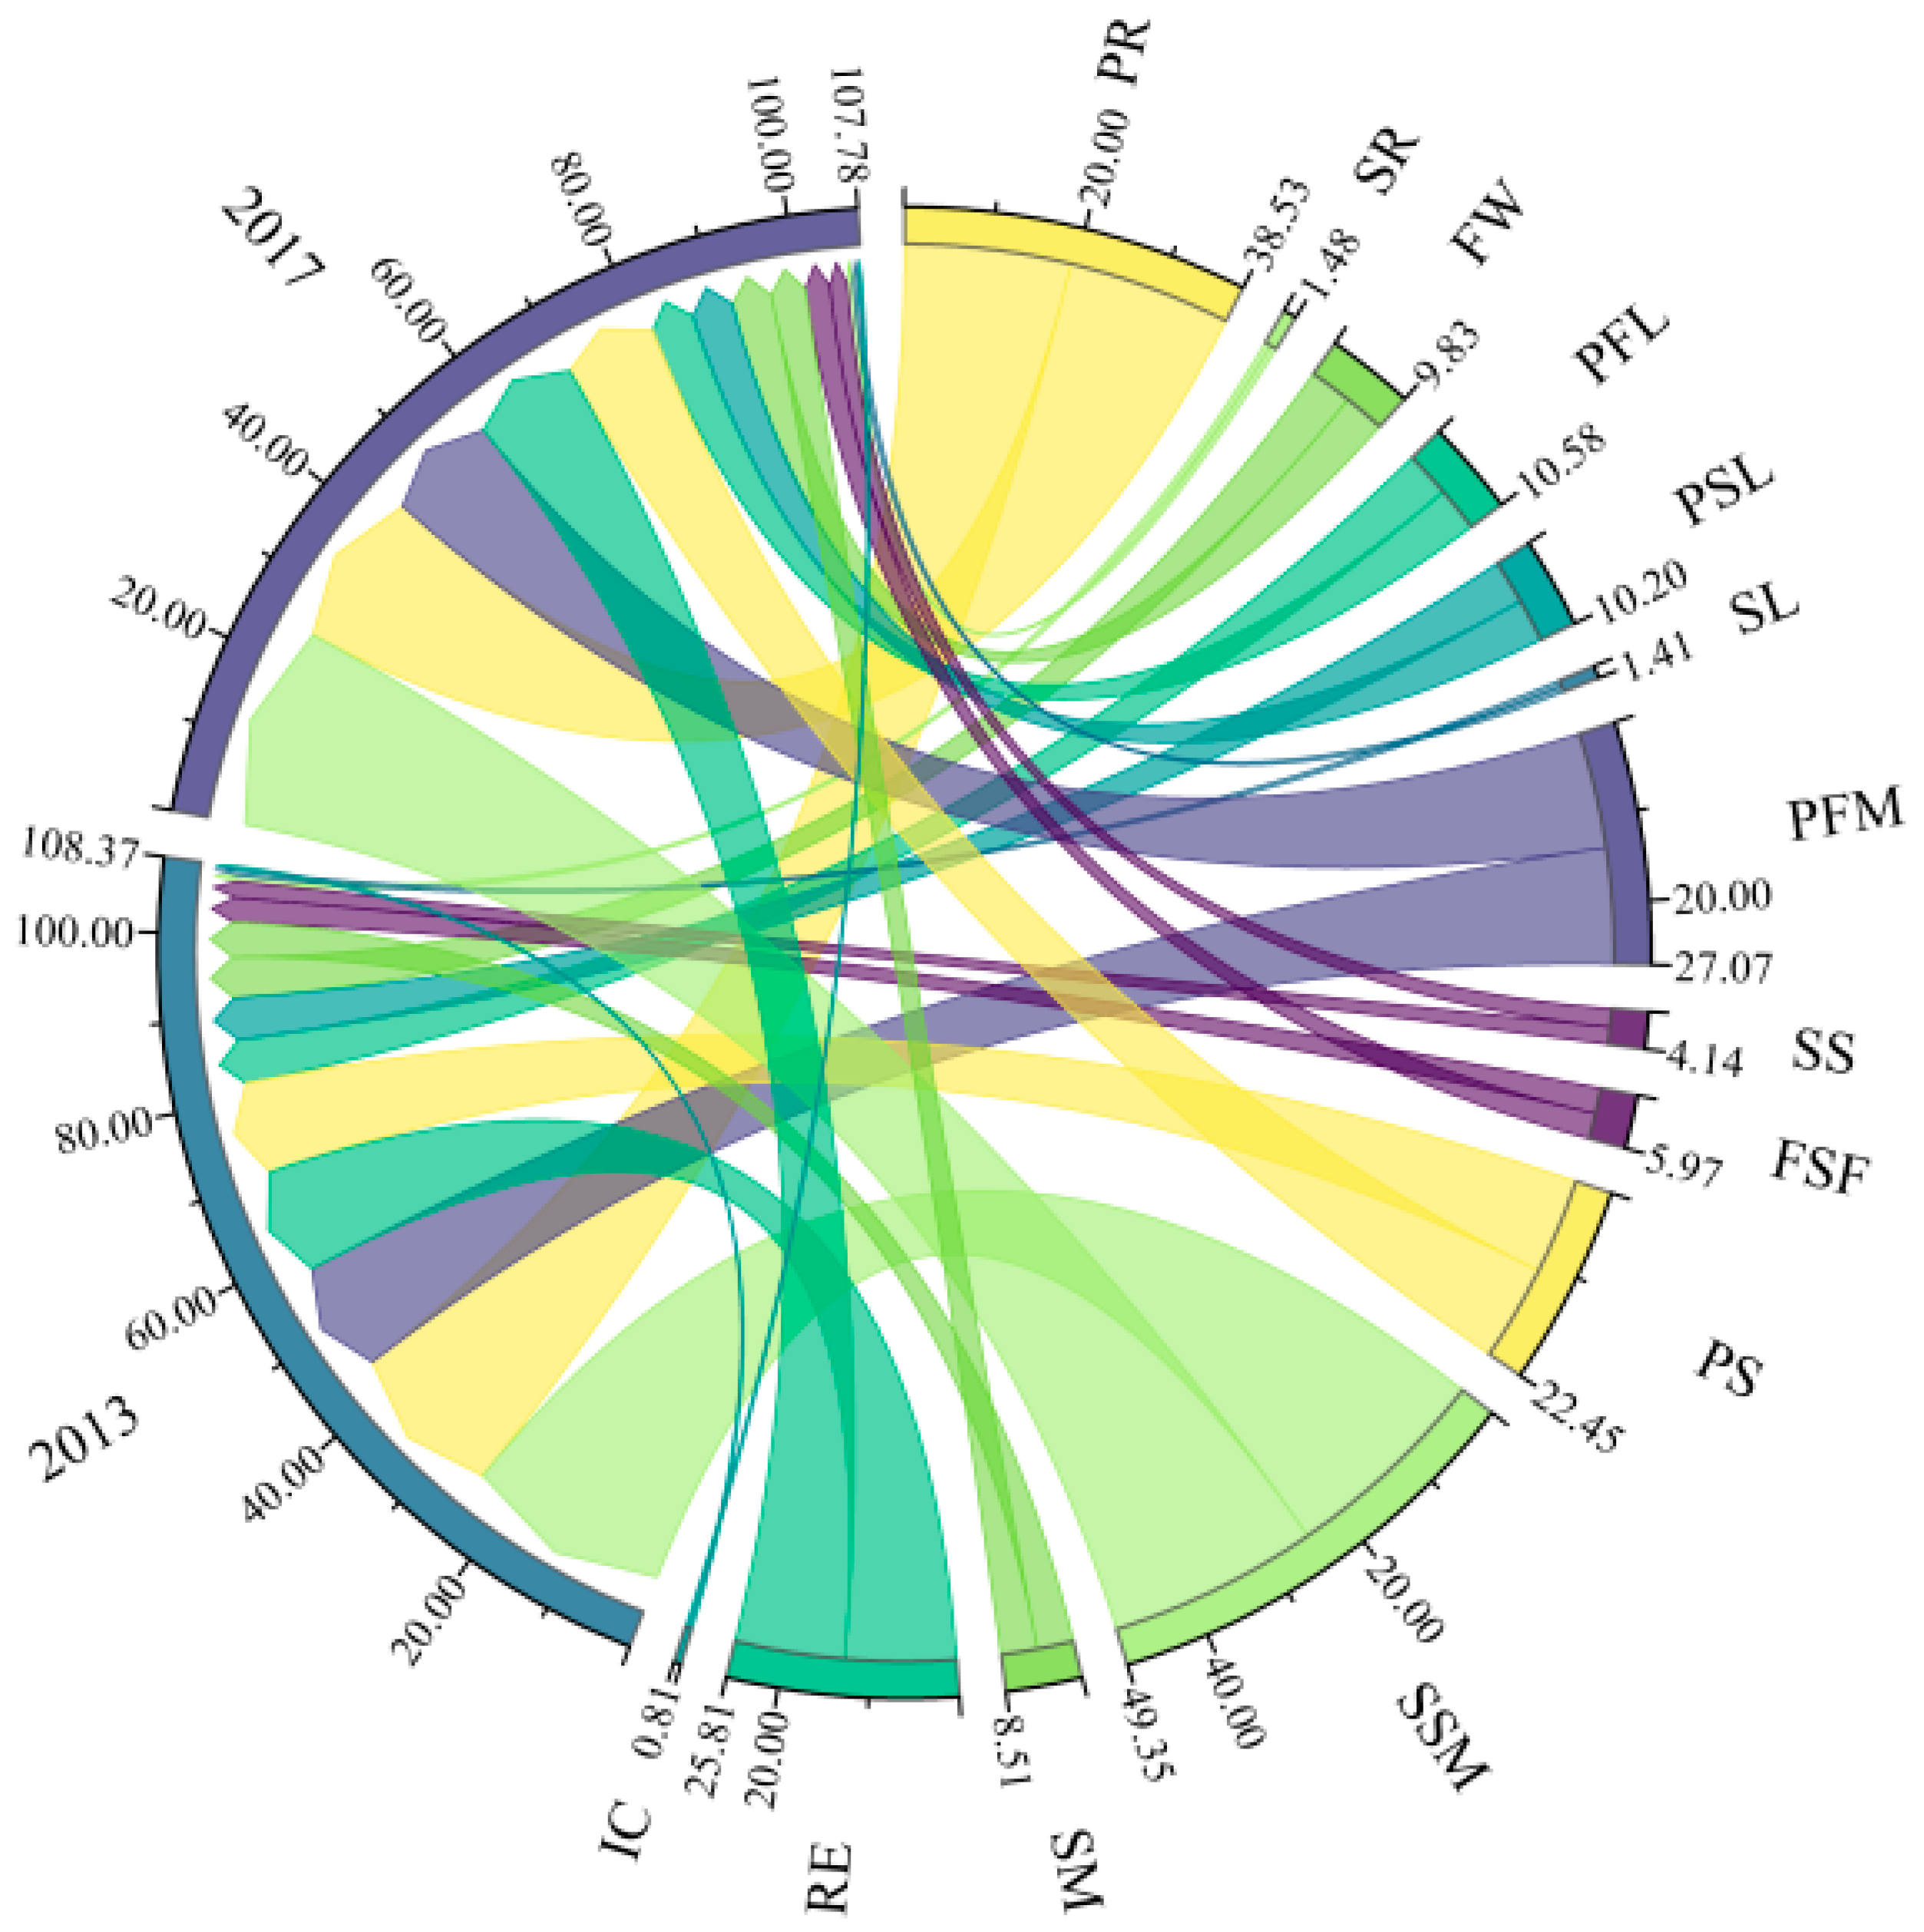
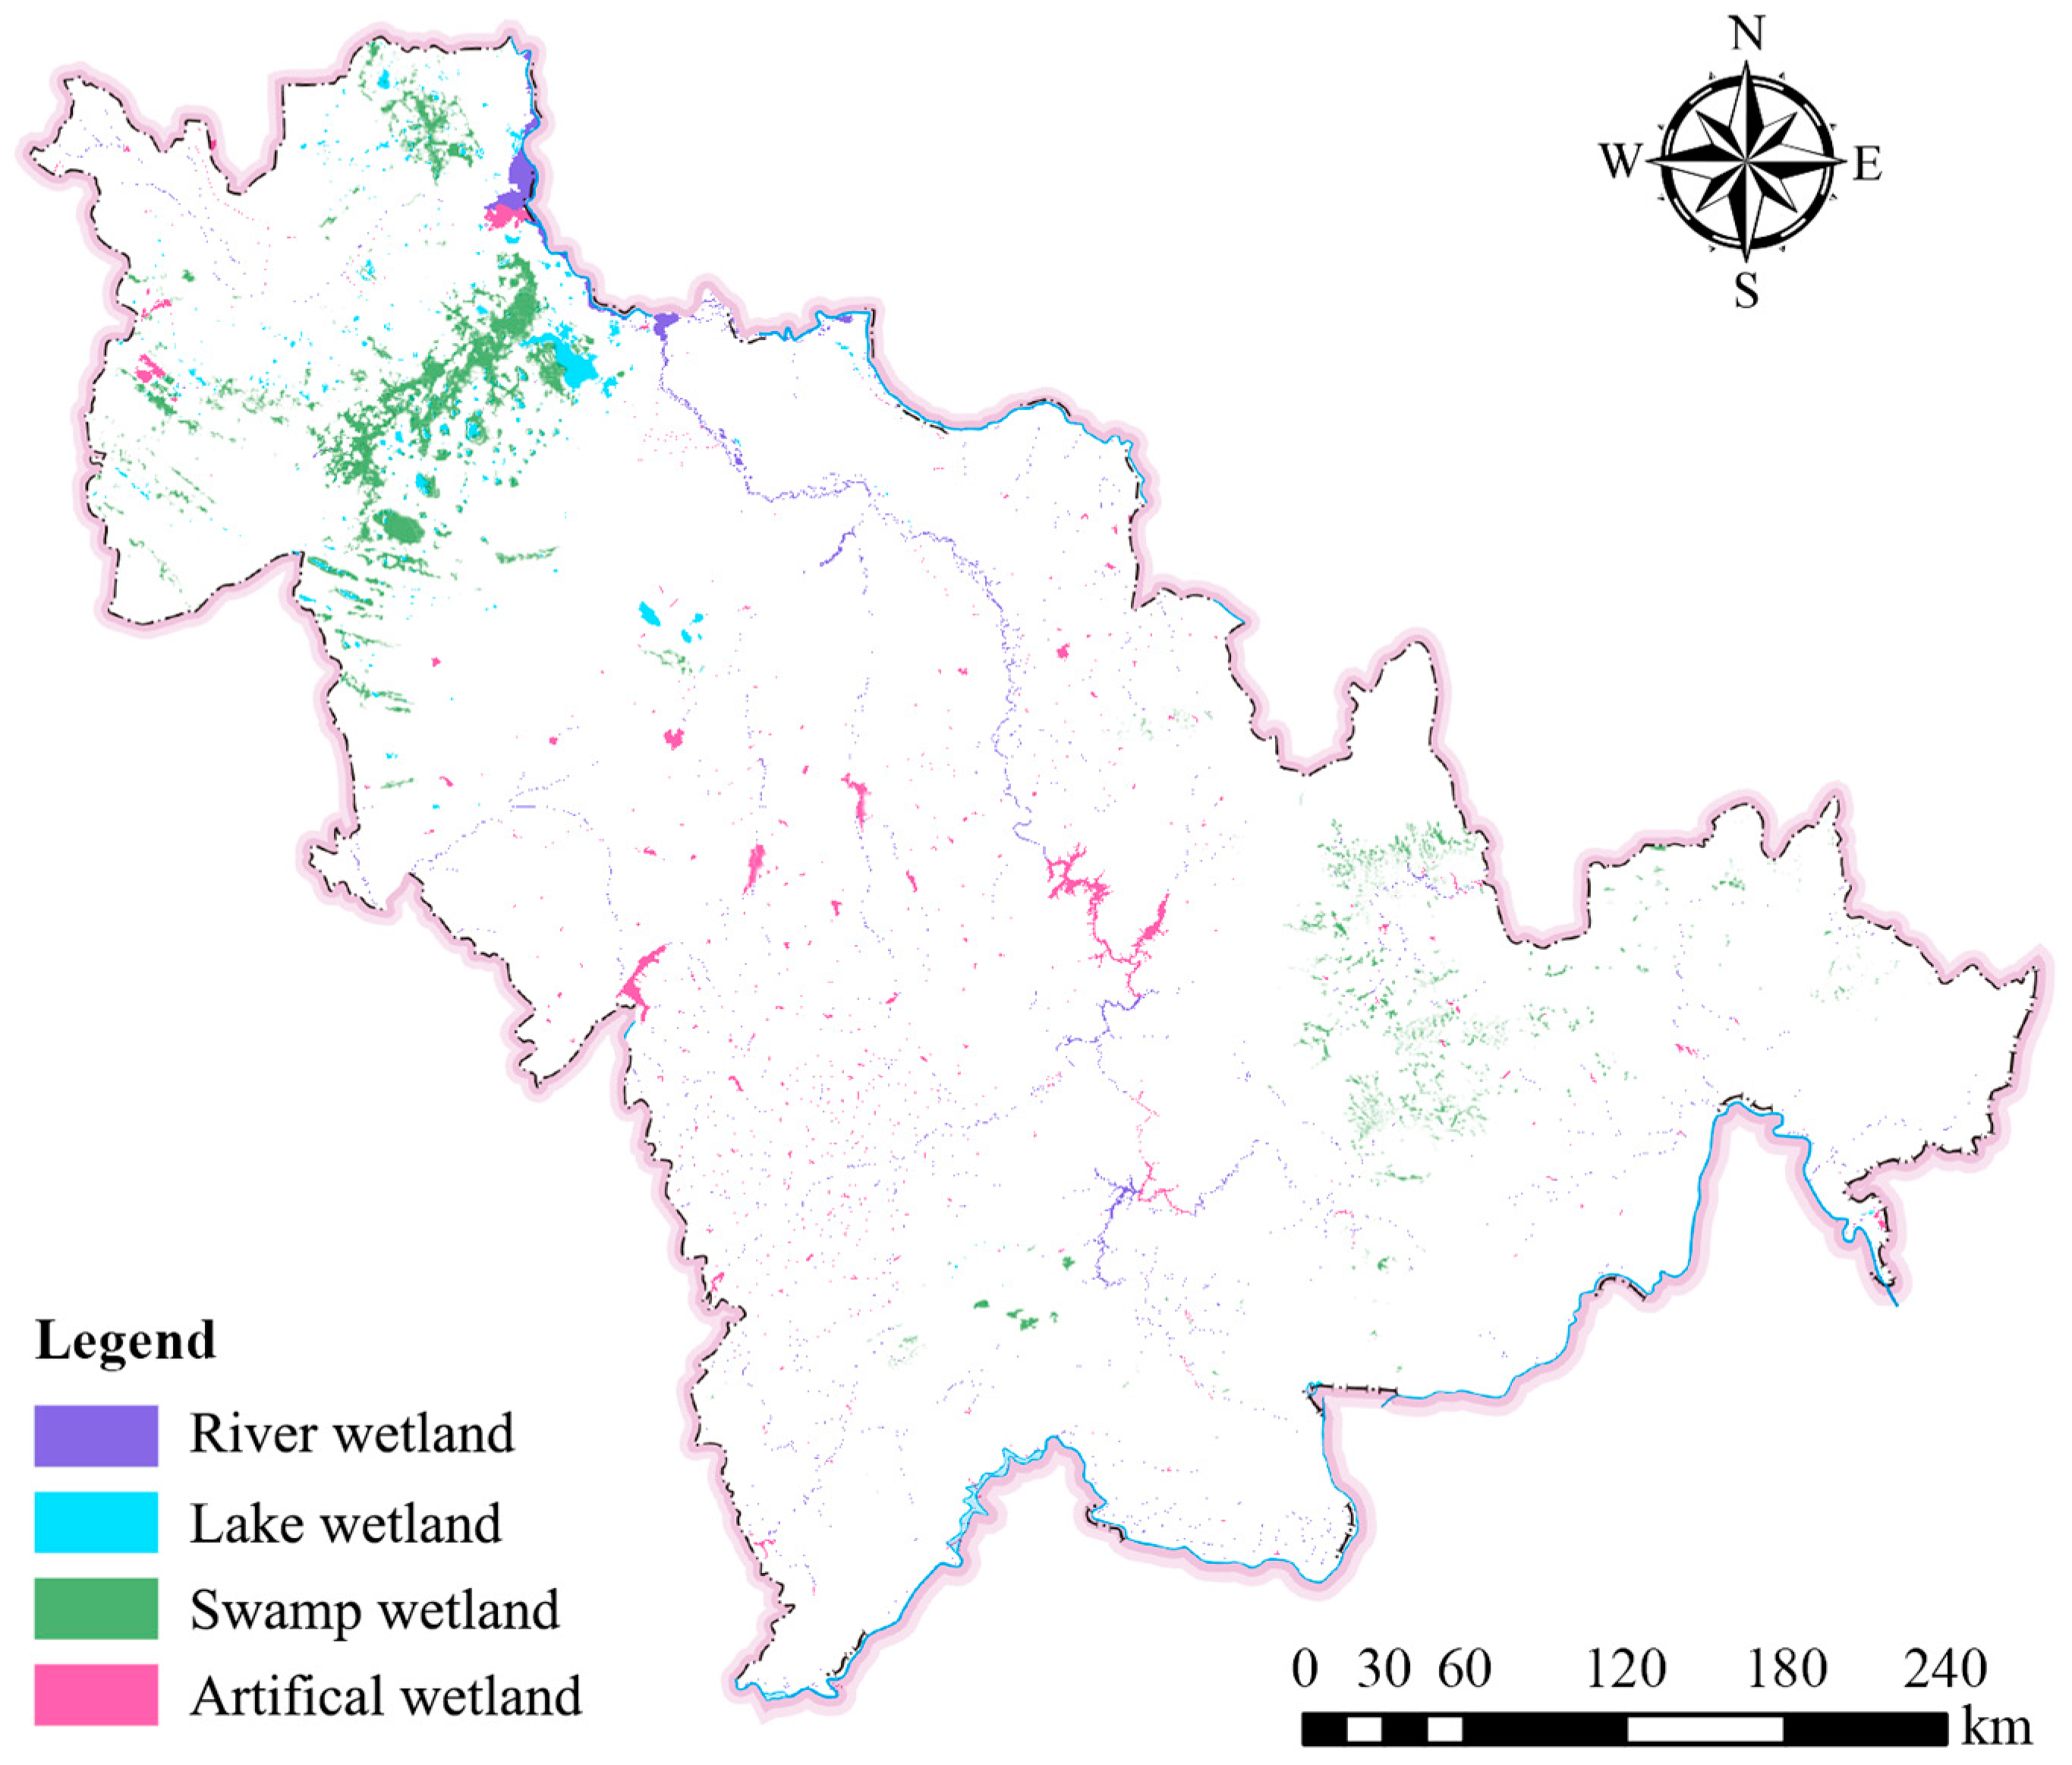
3.1. Spatiotemporal Changes in the Wetland Area in Jilin Province

In Jilin Province, the spatial distribution of freshwater supply is primarily concentrated in the northwestern region and mainly provided by lake, riverine, and marsh wetlands. In contrast, the central region relies mainly on artificial wetlands, with pond wetlands being the primary source of freshwater (Figure 2). Between 2013 and 2017, changes in wetland area and spatial distribution were observed in Jilin Province. The total wetland area decreased from 10,852.84 km2 in 2013 to 10,794.46 km2 in 2017, a decrease of 0.53%. The area of different types of wetlands, i.e., that of lake, riverine, and artificial wetlands, decreased as well. Among these, riverine wetlands experienced the most significant reduction, decreasing from 2510.73 km2 in 2013 to 2473.27 km2 in 2017, a decrease of 37.46 km2, with the largest reduction occurring in permanent riverine wetlands (PR), the area of which decreased by approximately 22.69 km2 (Figure 3).

3.2. Simulation of Future Changes in Wetland Areas

Utilizing the Extract Land Expansion module embedded in the PLUS model, land-use-type raster data for 2013 and 2017 were overlaid to obtain wetland change data for the period between 2013 and 2017. Referring to existing studies and considering the current status of the study area [34,35], four environmental factors, including DEM, slope, annual precipitation, and annual average temperature, and four anthropogenic factors, including GDP, population density, distance to railways, and distance to roads, were selected as driving factors for changes in wetland areas (Figure 4). The LEAS module was employed to identify driving forces, with default values set for the parametrization of the random forest decision tree: a minimum split size of 20, a sampling rate of 0.01, and 17 features for training the random forest. This resulted in suitability maps for four types of wetlands. The suitability maps for each land use type and the 2017 land use images were input into the CARS module of the model. Using the Markov chain prediction results for 2017, the model simulated wetland area changes in Jilin Province for the year 2027, as illustrated in Figure 5. The results indicate that the total wetland area in Jilin Province in 2027 will be 10,614.37 km2, with river wetlands covering 2373.65 km2, lake wetlands covering 1098.04 km2, swamp wetlands covering 5835.93 km2, and artificial wetlands covering 1334.74 km². Compared to 2017, the overall wetland area in 2027 was projected to decrease by 180.09 km2. River wetlands showed the largest decline, decreasing by 99.61 km2.

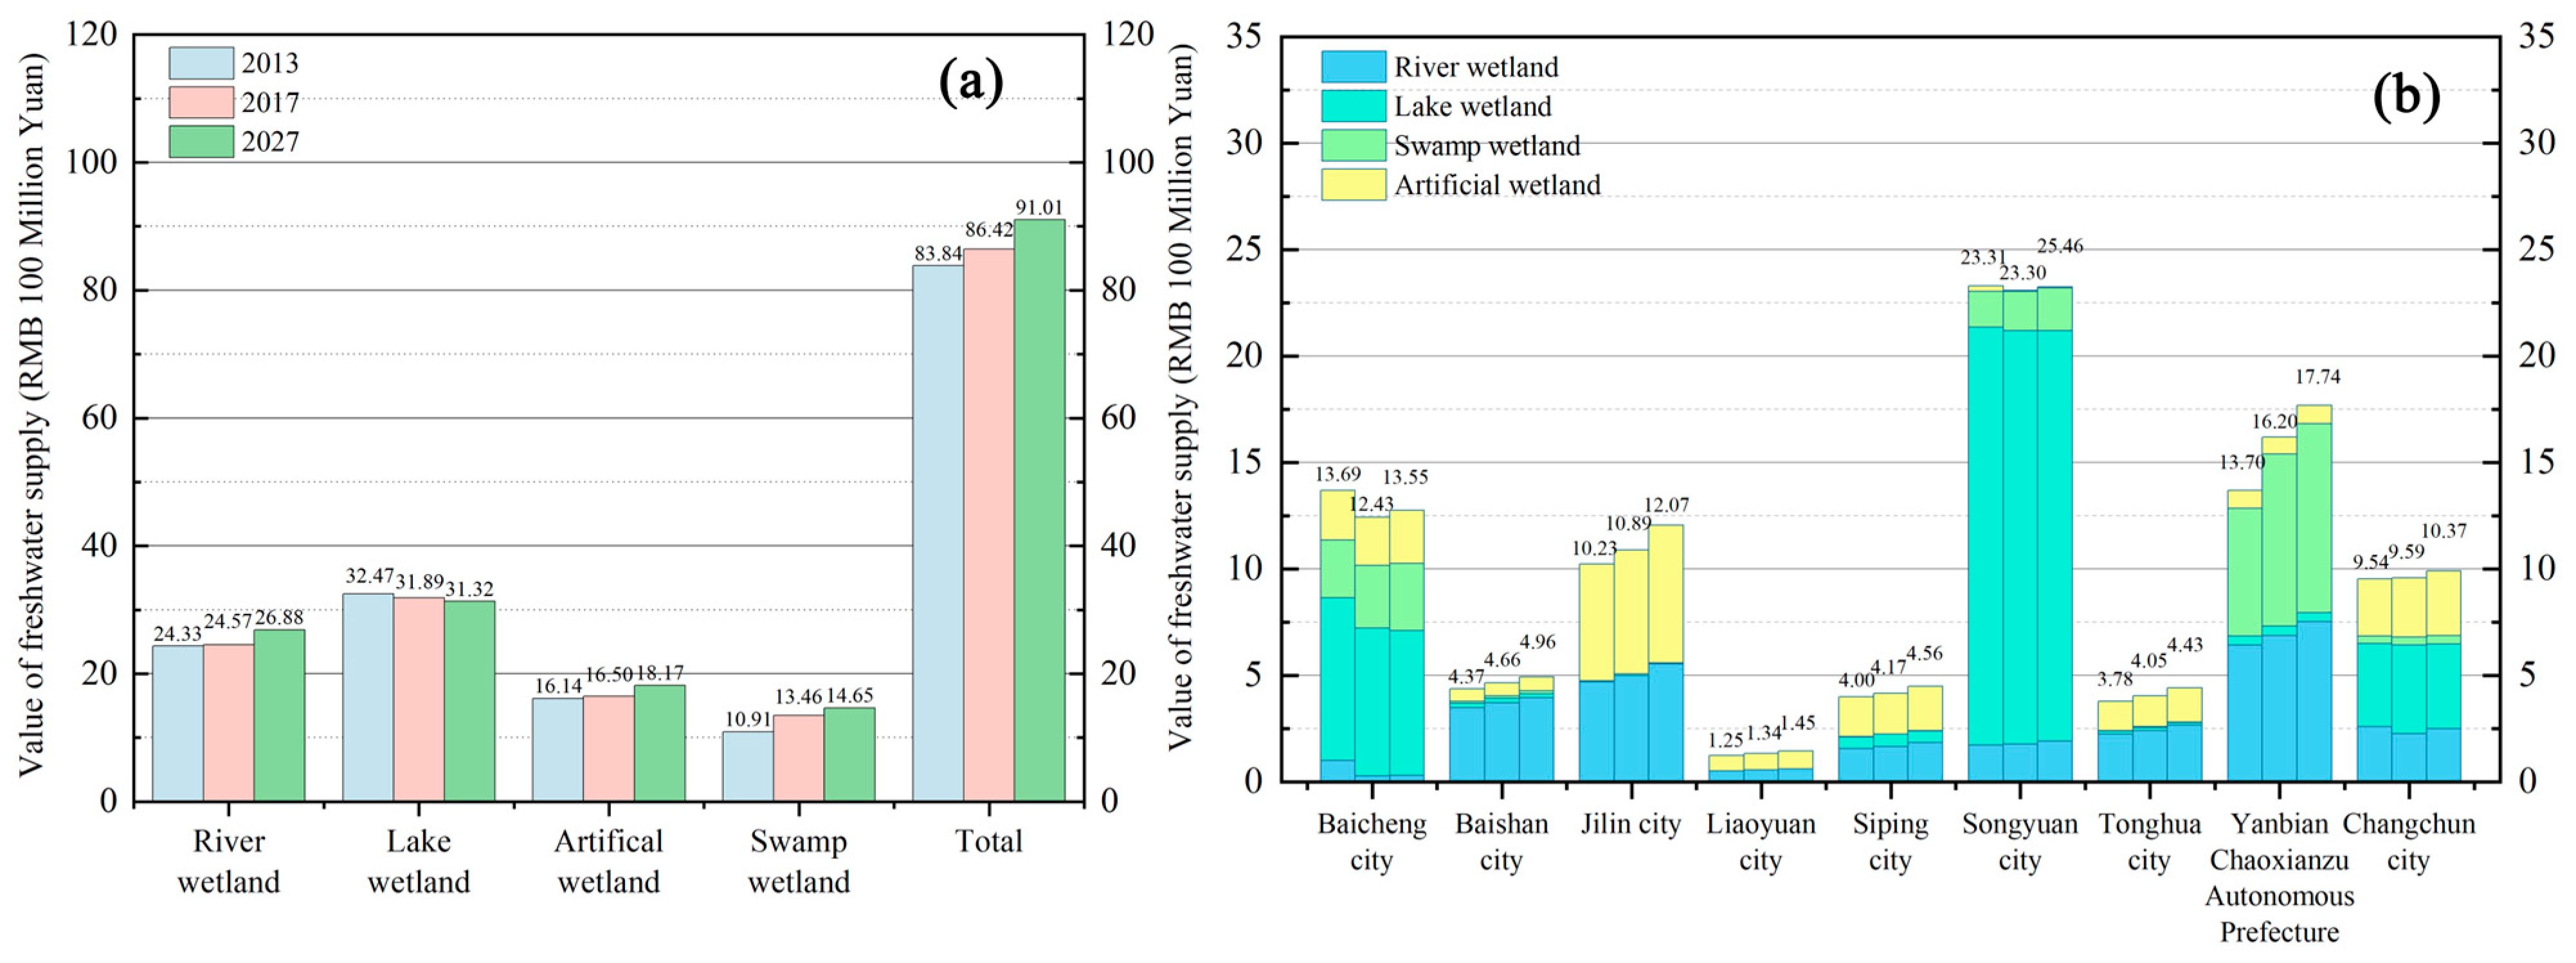
3.3. Wetland Freshwater Supply Volume

In this study, we analyzed spatiotemporal changes in wetland freshwater supply in Jilin Province. In 2013, the surface freshwater supply in Jilin Province was approximately 20.81 × 10⁸ m3. However, by 2017, the surface freshwater supply in Jilin Province had slightly decreased to approximately 20.09 × 10⁸ m3. The predicted total freshwater supply for the year 2027 was 19.74 × 10⁸ m3, representing a decrease of 0.35 × 10⁸ m3 compared to 2017. Overall, the freshwater resource supply in Jilin Province’s wetlands exhibited a continuous downward trend (Table 1). Among the wetland types, lake wetlands, river wetlands, and artificial wetlands all showed varying degrees of decline in freshwater resource supply. Lake wetlands, in particular, experienced the most significant reduction, with a decrease of 0.14 × 10⁸ m3 in freshwater supply. Moreover, swamp wetlands exhibited an initial increasing trend followed by a subsequent decrease over time.

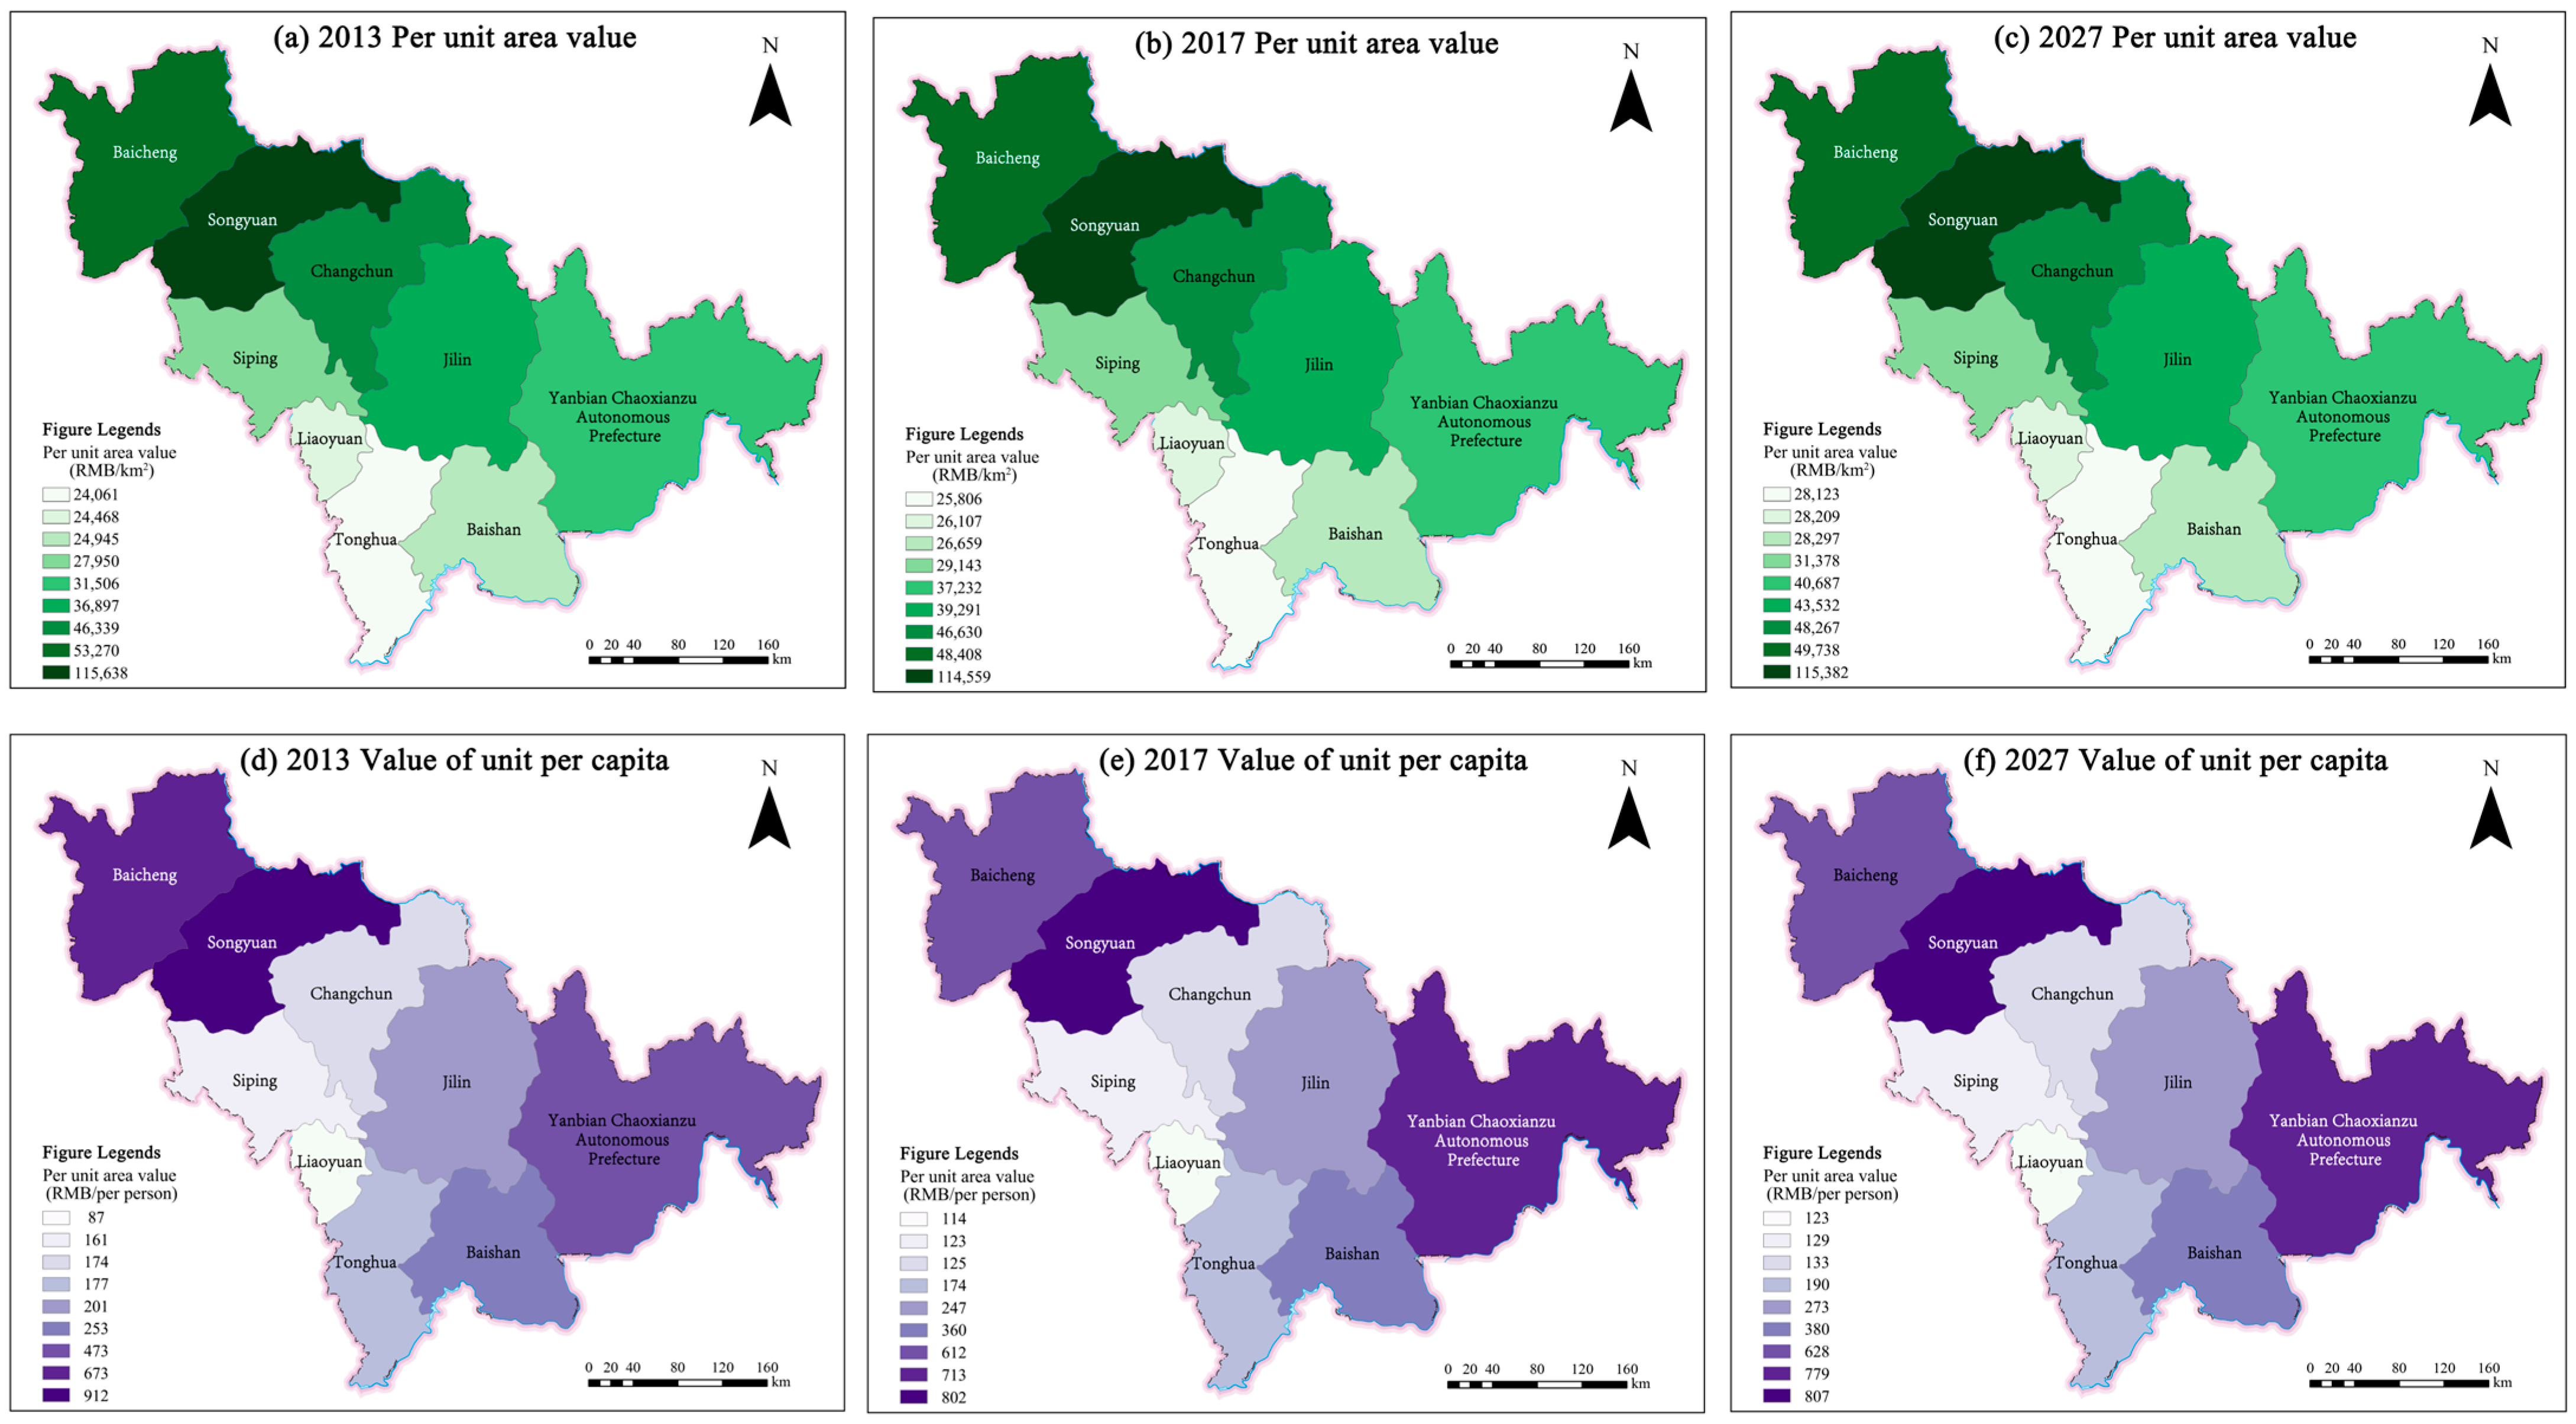
3.4. Analysis of Wetland Water Resource Supply Value

The freshwater resource supply values for Jilin Province in 2013, 2017, and those projected for 2027 are depicted in Figure 6. In 2013, the total value of freshwater supplies from wetlands in Jilin Province was approximately CNY 8.384 billion, while in 2017, it reached CNY 8.642 billion. The projected value of freshwater resource supplies in 2027 was CNY 9.101 billion. Thus, the freshwater resource supply value in Jilin Province exhibited an upward trend over the years. Lake wetlands consistently had the largest water resource supply value, accounting for 38.73, 36.90, and 33.74% of the total value in 2013, 2017, and 2027, respectively. However, over time, their value continuously declined. In contrast, swamp wetlands exhibited the opposite trend, accounting for 13.01, 15.58, and 17.57% in 2013, 2017, and 2027, respectively, indicating a continuous increase in the freshwater resource supply value (Figure 6a). From a regional perspective, Songyuan City had the highest wetland freshwater supply value among all regions, while Liaoyuan City had the lowest value (Figure 6b). Our three-year comparison revealed variations in freshwater supply values across different regions, in which different wetland types contributed to varying degrees of freshwater supply values. However, the overall freshwater supply value in Jilin Province increased and was projected to increase further.
In 2013, the freshwater supply per unit area in Jilin Province was CNY 44,100/km2. By 2017, it had increased to CNY 45,428/km2. The projected value for 2027 was CNY 47,839/km2, indicating an overall upward trend in the freshwater supply value per unit area. Songyuan City had the highest freshwater supply value per unit area. On the other hand, Tonghua City had the lowest value per unit area. When comparing the data over the three investigated years, the freshwater supply value per unit area for both Songyuan City and Baicheng City initially decreased and then increased, while that for other cities consistently increased (Figure 7a–c).
In 2013, the per capita freshwater supply in Jilin Province was CNY 305.3 per person. By 2017, the value had increased to CNY 314.6 per person. The projected value for 2027 was CNY 331.4 per person, indicating a continuous upward trend in the per capita supply value. Songyuan City had the highest per capita freshwater supply value, while Tonghua City had the lowest. When comparing the data over the three investigated years, the per capita supply value for the cities of Siping, Changchun, Songyuan, and Baicheng initially decreased and then increased, while that of the other cities steadily increased (Figure 7d–f). Overall, there were variations in both the freshwater supply value per unit area and that per capita among different regions in Jilin Province.

4. Discussion

4.1. Comparison of Water Resource Supply Value

Wetlands provide freshwater by absorbing, storing, filtering, and releasing water. They accumulate water from rainfall, snowmelt, and runoff from nearby rivers, while vegetation and soil help purify groundwater. Research on the dynamic ecological service value of wetlands helps uncover their significance in the ecological environment, supporting wetland conservation and sustainable management [36]. To ensure data consistency, we used the consumer price index (CPI) for different years, transforming the economic values from various study periods into the freshwater resource supply values of 2017 [37]. For the foreign components of this study, we converted the local currency value to RMB at the exchange rate at the time of the study and then converted it to the 2017 value through the CPI. The value of water resources per square meter in Jilin Province surpasses that of all other regions (Table 2). Jilin Province possesses extremely abundant wetland resources, including internationally renowned wetlands such as the Xianghai, Momoge, and Chagan Lake Wetlands. The richness of wetland resources is a key factor contributing to the high value of freshwater resources [38]. However, due to different research methods, there are variations among various studies in defining wetland ecosystem service functions, identifying ecological values, and subdividing the internal components of ecosystems. This may lead to certain errors in assessing freshwater supply values. Nevertheless, the freshwater resource value of wetlands in Jilin Province remains relatively high.

4.2. Characteristics of Wetland Degradation and Analysis of Causes

The total wetland area of Jilin Province decreased from 10,852.84 km2 in 2013 to 10,794.46 km2 in 2017 and was projected to further decrease to 10,614.37 km2 by 2027. This indicates a continuous decline in the wetland area of Jilin Province. Natural and anthropogenic factors influence wetland degradation. Natural factors include temperature, precipitation, and evaporation, whereas human factors include pollution, irrigation, land reclamation, and other activities [47,48,49]. Water plays a crucial role in the structure of wetland ecosystems, and water levels affect wetland areas [25]. Over the past four decades, influenced by global warming, Jilin Province has experienced a continuous increase in the annual average temperature and a decreasing trend in annual precipitation. Original water resources in wetlands have been subject to increasing losses due to higher temperatures [50]. Zhang et al. [51] found that the annual runoff exhibited an overall decreasing trend in the eastern Liao River Basin in Jilin Province. In particular, summer runoff decreased by 1.97 m3/s every decade. As a result, riverine wetlands have transformed into marshes and saline–alkali lands owing to water shortages, leading to a continuous decline in water storage and flood control. In recent years, the wetlands of Jilin Province have been affected by urbanization, land development, water resource extraction, and climate change, leading to varying degrees of wetland area reduction. This reduction is particularly evident for lake wetlands. The expansion of urban areas, driven by population growth and the increasing demand for residential and infrastructure spaces, has contributed to the consumption of wetland resources, especially urban lakes and reservoirs. Concurrently, the continuous exploitation of wetland water resources has reduced the volume and area of wetlands [52,53,54]. Zheng et al. [55] found that in the nearly ten years following the construction of the Nenjiang Dam in western Jilin Province, extensive reductions in riparian wetland areas occurred downstream of the dam, and riverine wetland areas decreased by 44%. These factors are likely the primary reason for the decline in wetland areas in Jilin Province.

4.3. Analysis of Freshwater Supply in Wetlands

In 2013, the surface freshwater resource supply in Jilin Province was approximately 20.81 × 10⁸ m3. By 2017, it had decreased to 20.09 × 10⁸ m3, and the projected value for 2027 indicated a further decrease to 19.74 × 10⁸ m3. With the exception of marsh wetlands, the freshwater supply of the other three wetland types (rivers, lakes, and artificial wetlands) exhibited a declining trend, with that of lake wetlands being the most significant. Wetlands directly supply freshwater services through rivers, lakes, marshes, and artificial wetlands, or by absorbing and storing rainfall in vegetation, soil, and sediment, which maintains a stable and continuous output of freshwater resources. Changes in wetland areas can significantly impact freshwater resource supplies in nearby areas [56,57]. Water input and output, represented by precipitation and evapotranspiration, are the two core factors that determine water resource supplies in ecosystems [58,59]. According to the Jilin Province Water Resources Bulletin, the average precipitation for the entire province was 791.9 mm in 2013 but only 595.9 mm in 2017. During low-flow years, water scarcity can lead to adjustments to existing water replenishment plans and a reduction in the value of ecosystem services [23]. Therefore, the decline we found in freshwater supplies may be related to changes in wetland areas and reduced precipitation.

4.4. Analysis of Changes and Factors Affecting Wetland Water Resource Supply Values

Wetlands play a crucial role in sustaining life and health. They support agriculture, industry, energy production, and the ecological balance; promote tourism; and aid in flood control. Wetlands directly affect socioeconomic development and the normal functioning of ecosystems. Therefore, investigating the dynamic changes in the freshwater supply value of wetlands is of the utmost importance [60,61]. Our assessment of Jilin Province’s wetland freshwater supply values indicated that these values were CNY 8.384 and 8.642 billion in 2013 and 2017, respectively. The projected value for 2027 was CNY 9.101 billion, which indicated an overall increasing trend. These results also signify the growing contribution of wetland freshwater supply values to and their indispensable role in regional development. The increasing trend in freshwater supply values is closely related to the per capita disposable income of urban residents and the CPI, with rising water prices being the key factor influencing freshwater supply values [62,63,64]. In recent years, influenced by improvements in living standards, both the per capita disposable income and the CPI have continuously risen in Jilin Province. In 2017, the CPI was 1.071 times higher than that in 2013. Water prices have also increased to some extent in different regions of Jilin Province. Therefore, while wetland areas decreased, changes in the CPI and water price adjustments were the main reasons for the overall increase in the freshwater supply values.

4.5. Recommendations for Enhancing the Value of Wetland Resources in Jilin Province

This study indicates that while the overall value of freshwater resources in Jilin Province is continually increasing, the areas and supply of freshwater resources from different types of wetlands are consistently decreasing. In light of this, to further safeguard the wetlands in Jilin Province and enhance freshwater resource values, the following recommendations are put forth: (1) From an overall perspective, it is essential to strengthen the protection of Jilin Province’s wetlands, reduce the loss rate of wetlands, and take necessary measures to maintain the balance of the wetland ecosystem, ensuring its sustainable development. (2) It is also important to enhance wetland monitoring and assessment by establishing a robust wetland monitoring system to regularly assess various types of wetlands. Through monitoring and assessment, the timely identification of changes and issues in the freshwater resources of wetlands provides a basis for informed decision making, ensuring the sustainable utilization of wetland resources. (3) The establishment of interdepartmental cooperation mechanisms is also vital. Interdepartmental cooperation mechanisms should be created to foster a collaborative approach, strengthening coordination among environmental protection, water resource management, land planning, and other relevant departments to collectively promote the protection and enhancement of wetland freshwater resources. Only by strengthening these recommendations can the sustainable utilization of wetland freshwater resources be maintained and the value of wetland freshwater resources continuously rise.

4.6. Limitations

This study had some limitations. For instance, in determining the value of freshwater resource supplies, we did not fully consider factors such as the water vapor transpiration induced by wetland plants, the exchange between groundwater and surface water, and the impact of precipitation on wetland freshwater resources. Moreover, the uncertainty associated with trends in economic development may result in significant disparities between predicted and actual changes in freshwater supply values. Considering the complexity and uncertainty of wetland ecosystem service value assessments, there is an urgent need for long-term wetland observational data and advancements in assessment technologies. Therefore, we will conduct specific and in-depth research, integrating existing monitoring data and initiating new monitoring programs to track changes in wetland conditions over time. This is to address the lack of monitoring data and minimize uncertainties in the assessment of freshwater resource values. Despite these limitations, our study provides a reference for various wetland water resource conservation policies in Jilin Province and other regions.

5. Conclusions

This study accounts for the dynamic changes in the wetland water supply and value in Jilin Province in 2013 and 2017 and can help to optimally allocate water resources, adjust socio-economic structures, and improve wetland protection awareness in Jilin Province. The results indicate the following points: (1) the area of wetlands decreased from 10,852.84 km2 in 2013 to 10,794.46 km2 in 2017, and the area for 2027 was projected to further decrease to 10,614.37 km2, with river wetlands experiencing the most substantial decline; (2) the freshwater volume in wetlands in 2013 and 2017 was 20.81 × 10⁸ and 20.09 × 10⁸ m3, respectively, representing a decrease of 3.58%. The volume for 2027 was projected to further decrease to 19.74 × 10⁸ m3, with lake wetlands contributing the most and marsh wetlands contributing the least to water resources; and (3) the total freshwater supply value continuously increased from CNY 8.384 billion in 2013 to CNY 8.642 billion in 2017. This value was projected to further increase to CNY 9.101 billion in 2027. There was regional variation in the value of wetland freshwater supplies, with differences in the per unit area and per capita values among administrative units. We further found that due to the continuous increase in water prices, the value of water resource supplies has increased and will likely continue to increase. Based on our results, wetland conservation efforts in Jilin Province face significant long-term challenges.

Supplementary Materials

The following supporting information can be downloaded at https://www.mdpi.com/article/10.3390/w16020203/s1. Table S1. Selection for calculating the supply value of freshwater resources in Jilin Province wetlands.

Author Contributions

Z.W.: conceptualization, data curation, writing—original draft, formal analysis, and validation. X.Z. (Xinsheng Zhao): methodology, visualization, writing—review and editing, and investigation. Q.M.: investigation and validation. L.C.: supervision. X.Z. (Xueyan Zuo): validation and investigation. Y.L.: methodology. Y.C.: validation and investigation. Z.D.: investigation, methodology, and validation. W.L.: writing—review and editing, resources, project administration, and funding acquisition. All authors have read and agreed to the published version of the manuscript.

Funding

This research was funded by the Jilin Provincial Forestry Department for the following projects: “Evaluation of the Value of Wetland Ecosystem Service Function in Jilin Province” (grant number: 2013-020) and “Evaluation of the Value of Wetland Ecosystem Service Function in Jilin Province in 2017” (grant number: 2018-002).

Data Availability Statement

Restrictions apply to the availability of these data. Data was obtained from Institute of Wetland Research, Chinese Academy of Forestry and are available from the correspondence author with the permission of Institute of Wetland Research, Chinese Academy of Forestry.

Conflicts of Interest

The authors declare that they have no competing financial interests or personal relationships that may have influenced the work reported in this study.

References

  1. Li, Y.Y.; Yao, S.B.; Deng, Y.J.; Jia, L.; Hou, M.Y.; Gong, Z.W. Spatio-Temporal study on supply and demand matching of ecosystem water yield service—A case study of wei river basin. Pol. J. Environ. Stud. 2021, 30, 1677–1693. [Google Scholar] [CrossRef]
  2. Costanza, R.; Groot, R.D.; Sutton, P.; Ploeg, S.V.D.; Anderson, S.J.; Kubiszewski, I.; Farber, S.; Turner, R.K. Changes in the global value of ecosystem services. Glob. Environ. Chang. 2014, 26, 152–158. [Google Scholar] [CrossRef]
  3. Li, F.; Zhang, S.W.; Yang, J.C.; Chang, L.P.; Yang, H.J.; Bu, K. Effects of land use change on ecosystem services value in West Jilin since the reform and opening of China. Ecosyst. Serv. 2018, 31, 12–20. [Google Scholar]
  4. Sherrouse, B.C.; Clement, J.M.; Semmens, D.J. A GIS application for assessing, mapping, and quantifying the social values of ecosystem services. Appl. Geogr. 2011, 31, 748–760. [Google Scholar] [CrossRef]
  5. Beuel, S.; Alvarez, M.; Amler, E.; Behn, K.; Kotze, D.; Kreye, C.; Leemhuis, C.; Wagner, K.; Willy, D.K.; Ziegler, S.; et al. A rapid assessment of anthropogenic disturbances in East African wetlands. Ecol. Indic. 2016, 67, 684–692. [Google Scholar] [CrossRef]
  6. Wiederholt, R.; Stainback, G.A.; Paudel, R.; Khare, Y.; Naja, M.; Davis, S.E.; Lent, T.V. Economic valuation of the ecological response to hydrologic restoration in the Greater Everglades ecosystem. Ecol. Indic. 2020, 117, 106678. [Google Scholar] [CrossRef]
  7. Pascual, U.; Termansen, M.; Hedlund, K.; Brussaard, L.; Faber, J.H.; Foudi, S.; Lemanceau, P.; Jørgensen, S.L. On the value of soil biodiversity and ecosystem services. Ecosyst. Serv. 2015, 15, 11–18. [Google Scholar] [CrossRef]
  8. Zagarola, J.A.; Anderson, C.B.; Veteto, J.R. Perceiving Patagonia: An assessment of social values and perspectives regarding watershed ecosystem services and management in Southern South America. Environ. Manag. 2014, 53, 769–782. [Google Scholar] [CrossRef]
  9. Song, F.; Su, F.L.; Mi, C.X.; Sun, D. Analysis of driving forces on wetland ecosystem services value change: A case in Northeast China. Sci. Total Environ. 2021, 751, 141778. [Google Scholar] [CrossRef]
  10. Hu, S.J.; Niu, Z.G.; Chen, Y.F.; Li, L.F.; Zhang, H.Y. Global wetlands: Potential distribution, wetland loss, and status. Sci. Total. Environ. 2017, 586, 319–327. [Google Scholar] [CrossRef]
  11. Feingold, D.; Koop, S.; Leeuwen, K.V. The city blueprint approach: Urban water management and governance in cities in the U.S. Environ. Manag. 2018, 61, 9–23. [Google Scholar] [CrossRef] [PubMed]
  12. Daily, G.C. Nature’s Services. Societal Dependence on Natural Ecosystems; Island Press: Washington, DC, USA, 1997; p. 392. [Google Scholar]
  13. Acreman, M.C.; Harding, R.J.; Lloyd, C.; McNamara, N.P.; Mountford, J.O.; Mould, D.J.; Purse, B.V.; Heard, M.S.; Stratford, C.J.; Dury, S.J. Trade-off in ecosystem services of the Somerset Levels and Moors wetlands. Hydrol. Sci. J. 2011, 56, 1543–1565. [Google Scholar] [CrossRef]
  14. Ma, X.F.; Zhu, J.T.; Zhang, H.B.; Yan, W.; Zhao, C.Y. Trade-offs and synergies in ecosystem service values of inland lake wetlands in Central Asia under land use/cover change: A case study on Ebinur Lake, China. Glob. Ecol. Conserv. 2020, 24, e1253. [Google Scholar] [CrossRef]
  15. Mason, T.J.; Krogh, M.; Popovic, G.C.; Glamore, W.; Keith, D.A. Persistent effects of underground longwall coal mining on freshwater wetland hydrology. Sci. Total Environ. 2021, 772, 144772. [Google Scholar] [CrossRef] [PubMed]
  16. Dai, E.F.; Wang, Y.H. Attribution analysis for water yield service based on the geographical detector method: A case study of the Hengduan Mountain region. J. Geogr. Sci. 2020, 30, 1005–1020. [Google Scholar] [CrossRef]
  17. Lu, Q.; Hua, D.; Li, Y.J.; Wang, D.Z. Estimation of water resource ecosystem service value in Tarim River Basin—From a full value chain perspective. Water 2022, 14, 2355. [Google Scholar] [CrossRef]
  18. Li, L.J.; Li, J.Y.; Liang, L.Q.; Liu, Y.M. Method for calculating ecological water storage and ecological water requirement of marsh. J. Geogr. Sci. 2009, 19, 427–436. [Google Scholar] [CrossRef]
  19. Wang, Z.Q.; Zhang, B.; Yang, G.; Wang, Z.M.; Zhang, S.Q. Responses of wetland eco-security to land use change in Western Jilin Province, China. Chin. Geogr. Sci. 2005, 15, 330–336. [Google Scholar] [CrossRef]
  20. Huang, J.; Yang, H.; He, W.; Li, Y. Ecological service value tradeoffs: An ecological water replenishment model for the Jilin Momoge National Nature Reserve, China. Int. J. Environ. Res. Public Health 2022, 19, 3263. [Google Scholar] [CrossRef]
  21. Yu, S.X.; Shang, J.C.; Guo, H.C. Evaluation of ecological services of Jilin Province, Northeast China. Chin. Geogr. Sci. 2004, 14, 215–220. [Google Scholar] [CrossRef]
  22. Zhang, L.; Hou, G.L.; Zhang, G.X.; Liu, Z.L.; Sun, G.Z.; Li, M.N. Calculation of wetlands ecological water requirement in china’ s western Jilin province based on regionalization and gradation techniques. Appl. Ecol. Environ. Res. 2016, 14, 463–478. [Google Scholar] [CrossRef]
  23. Cai, B.F.; Meng, C.; Wang, X.E.; Li, Y. Application of a fuzzy two-stage chance constrained stochastic programming model for optimization of the ecological services value of the interconnected river system network project in the western Jilin Province, China. Water 2019, 11, 68. [Google Scholar] [CrossRef]
  24. Li, G.D.; Fang, C.L.; Wang, S.J. Exploring spatiotemporal changes in ecosystem-service values and hotspots in China. Sci. Total Environ. 2016, 545, 609–620. [Google Scholar] [CrossRef] [PubMed]
  25. Ren, Y.T.; Zhang, F.; Zhao, C.L.; Cheng, Z.Q. Attribution of climate change and human activities to vegetation NDVI in Jilin Province, China during 1998–2020. Ecol. Indic. 2023, 153, 110415. [Google Scholar] [CrossRef]
  26. Bian, J.M.; Tang, J.; Zhang, L.H.; Ma, H.Y.; Zhao, J. Arsenic distribution and geological factors in the western Jilin province, China. J. Geochem. Explor. 2012, 112, 347–356. [Google Scholar] [CrossRef]
  27. Dong, D.M.; Zhang, L.W.; Liu, S.; Guo, Z.Y.; Hua, X.Y. Antibiotics in water and sediments from Liao River in Jilin Province, China: Occurrence, distribution, and risk assessment. Environ. Earth. Sci. 2016, 75, 1202. [Google Scholar] [CrossRef]
  28. Chinese Academy of Sciences. Resource and Environment Science Data Center. Available online: https://www.resdc.cn/ (accessed on 10 July 2023).
  29. Worldpop. Available online: https://hub.worldpop.org/ (accessed on 12 July 2023).
  30. Statistic Bureau of Jilin. Statistical Yearbook of Jilin Province. Available online: http://tjj.jl.gov.cn/tjsj/tjnj/ (accessed on 12 July 2023).
  31. H2o-China. Available online: https://www.h2o-china.com/price/ (accessed on 24 July 2023).
  32. Li, C.; Wu, Y.M.; Gao, B.P.; Zheng, K.J.; Wu, Y.; Li, C. Multi-scenario simulation of ecosystem service value for optimization of land use in the Sichuan-Yunnan ecological barrier, China. Ecol. Indic. 2021, 132, 108328. [Google Scholar] [CrossRef]
  33. Liang, X.; Guan, Q.; Clarke, K.C.; Liu, S.S.; Wang, B.Y.; Yao, Y. Understanding the drivers of sustainable land expansion using a patch-generating land use simulation (PLUS) model: A case study in Wuhan, China. Comput. Environ. Urban. Syst. 2021, 85, 101569. [Google Scholar] [CrossRef]
  34. Xu, X.L.; Wang, S.Y.; Rong, W.Z. Construction of ecological network in Suzhou based on the PLUS and MSPA models. Ecol. Indic. 2023, 154, 110740. [Google Scholar] [CrossRef]
  35. Zhang, S.H.; Zhong, Q.L.; Cheng, D.L.; Xu, C.B.; Chang, Y.N.; Lin, Y.Y.; Li, B.Y. Landscape ecological risk projection based on the PLUS model under the localized shared socioeconomic pathways in the Fujian Delta region. Ecol. Indic. 2022, 136, 108642. [Google Scholar] [CrossRef]
  36. Yan, J.F.; Du, J.X.; Su, F.Z.; Zhao, S.Y.; Zhang, S.X.; Feng, P.F. Reclamation and Ecological Service Value Evaluation of Coastal Wetlands Using Multispectral Satellite Imagery. Wetlands 2022, 42, 20. [Google Scholar] [CrossRef] [PubMed]
  37. Zhang, Z.Y.; Liu, L.; He, X.L.; Li, Z.Q.; Wang, P.Y. Evaluation on glaciers ecological services value in the Tianshan Mountains, Northwest China. J. Geogr. Sci. 2019, 29, 101–114. [Google Scholar] [CrossRef]
  38. Zhang, L.; Hou, G.; Li, F. Dynamics of landscape pattern and connectivity of wetlands in western Jilin Province, China. Environ. Dev. Sustain. 2020, 22, 2517–2528. [Google Scholar] [CrossRef]
  39. Niu, J.J.; Mao, C.M.; Xiang, J. Based on ecological footprint and ecosystem service value, research on ecological compensation in Anhui Province, China. Ecol. Indic. 2024, 158, 111341. [Google Scholar] [CrossRef]
  40. Chen, W.; Cao, C.X.; Liu, D.; Tian, R.; Wu, C.Y.; Wang, Y.Q.; Qian, Y.F.; Ma, G.Q.; Bao, D.M. An evaluating system for wetland ecological health: Case study on nineteen major wetlands in Beijing-Tianjin-Hebei region, China. Sci. Total Environ. 2019, 666, 1080–1088. [Google Scholar] [CrossRef] [PubMed]
  41. Zhang, B.; Shi, Y.T.; Liu, J.H.; Xu, J.; Xie, G.D. Economic values and dominant providers of key ecosystem services of wetlands in Beijing, China. Ecol. Indic. 2017, 77, 48–58. [Google Scholar] [CrossRef]
  42. Lin, W.P.; Xu, D.; Guo, P.P.; Wang, D.; Lia, J.G.; Gao, J. Exploring variations of ecosystem service value in Hangzhou Bay Wetland, Eastern China. Ecosyst. Serv. 2019, 37, 100944. [Google Scholar] [CrossRef]
  43. Zhu, L.M.; Zhu, K.X.; Zeng, X.L. Evolution of landscape pattern and response of ecosystem service value in international wetland cities: A case study of Nanchang City. Ecol. Indic. 2023, 155, 110987. [Google Scholar] [CrossRef]
  44. Kakuru, W.; Turyahabwe, N.; Mugisha, J. Total Economic Value of Wetlands Products and Services in Uganda. Sci. World. J. 2013, 13, 192656. [Google Scholar] [CrossRef]
  45. Mulatu, D.W.; Ahmed, J.; Semereab, E.; Arega, T.; Yohannes, T.; Akwany, L.O. Stakeholders, Institutional Challenges and the Valuation of Wetland Ecosystem Services in South Sudan: The Case of Machar Marshes and Sudd Wetlands. Environ. Manag. 2022, 69, 666–683. [Google Scholar] [CrossRef]
  46. Gandarillas, R.V.; Jiang, Y.; Irvine, K. Assessing the services of high mountain wetlands in tropical Andes: A case study of Caripe wetlands at Bolivian Altiplano. Ecosyst. Serv. 2016, 19, 51–64. [Google Scholar] [CrossRef]
  47. Shen, G.; Yang, X.C.; Jin, Y.X.; Xu, B.; Zhou, Q.B. Remote sensing and evaluation of the wetland ecological degradation process of the Zoige Plateau Wetland in China. Ecol. Indic. 2019, 104, 48–58. [Google Scholar] [CrossRef]
  48. Zhu, L.J.; Ke, Y.H.; Hong, J.M.; Zhang, Y.H.; Pan, Y. Assessing degradation of lake wetlands in Bashang Plateau, China based on long-term time series Landsat images using wetland degradation index. Ecol. Indic. 2022, 139, 108903. [Google Scholar] [CrossRef]
  49. Jiang, W.G.; Lv, J.X.; Wang, C.C.; Chen, Z.; Liu, Y.H. Marsh wetland degradation risk assessment and change analysis: A case study in the Zoige Plateau, China. Ecol. Indic. 2017, 82, 316–326. [Google Scholar] [CrossRef]
  50. Wang, Z.M.; Huang, N.; Luo, L.; Li, X.Y.; Ren, C.Y.; Song, K.S.; Chen, J.M. Shrinkage and fragmentation of marshes in the West Songnen Plain, China, from 1954 to 2008 and its possible causes. Int. J. Appl. Earth. Obs. 2011, 13, 477–486. [Google Scholar] [CrossRef]
  51. Zhang, L.; Lu, W.X.; Yang, Q.C.; An, Y.K.; Li, D.; Gong, L. Hydrological impacts of climate change on streamflow of Dongliao River watershed in Jilin Province, China. Chin. Geogr. Sci. 2012, 22, 522–530. [Google Scholar] [CrossRef]
  52. Meng, W.Q.; He, M.X.; Hu, B.B.; Mo, X.Q.; Li, H.Y.; Liu, B.Q.; Wang, Z.L. Status of wetlands in China: A review of extent, degradation, issues and recommendations for improvement. Ocean. Coast. Manag. 2017, 146, 50–59. [Google Scholar] [CrossRef]
  53. Acreman, M.; Holden, J. How Wetlands Affect Floods. Wetlands 2013, 33, 773–786. [Google Scholar] [CrossRef]
  54. Grygoruk, M.; Mirosław-Świątek, D.; Chrzanowska, W.; Ignar, S. How Much for Water? Economic Assessment and Mapping of Floodplain Water Storage as a Catchment-Scale Ecosystem Service of Wetlands. Water 2013, 5, 1760–1779. [Google Scholar] [CrossRef]
  55. Zheng, Y.X.; Zhang, G.X.; Wu, Y.F.; Xu, Y.J.; Dai, C.L. Dam Effects on Downstream Riparian Wetlands: The Nenjiang River, Northeast China. Water 2019, 11, 2038. [Google Scholar] [CrossRef]
  56. Chen, C.; Shao, C.F.; Shi, Y.M. Dynamic Evaluation of Ecological Service Function Value of Qilihai Wetland in Tianjin. Int. J. Environ. Res. Public Health 2020, 17, 7108. [Google Scholar] [CrossRef]
  57. Zhang, Y.R.; Zhou, D.M.; Niu, Z.G.; Xu, F.J. Valuation of lake and marsh wetlands ecosystem services in China. Chin. Geogr. Sci. 2014, 24, 269–278. [Google Scholar] [CrossRef]
  58. Ren, Y.T.; Zhang, F.; Li, J.P.; Zhao, C.L.; Jiang, Q.S.; Cheng, Z.Q. Ecosystem health assessment based on AHP-DPSR model and impacts of climate change and human disturbances: A case study of Liaohe River Basin in Jilin Province, China. Ecol. Indic. 2022, 142, 109171. [Google Scholar] [CrossRef]
  59. Yan, J.W.; Chen, B.Z.; Feng, M.; Innes, J.L.; Wang, G.Y.; Fang, S.F.; Xu, G.; Zhang, H.F.; Fu, D.J.; Wang, H.M.; et al. Research on Land Surface Thermal-Hydrologic Exchange in Southern China under Future Climate and Land Cover Scenarios. Adv. Meteorol. 2013, 2013, 969145. [Google Scholar] [CrossRef]
  60. Hao, C.L.; Yan, D.H.; Qin, T.L.; Zhang, C.; Yin, J. Water Ecosystem Services and their Value—A Case Study in Luan River Basin, North China. Appl. Mech. Mater. 2013, 448, 225–234. [Google Scholar] [CrossRef]
  61. Zhu, P.; Lu, C.X.; Zhang, L.; Cheng, X.L. Urban fresh water resources consumption of China. Chin. Geogr. Sci. 2009, 19, 219–224. [Google Scholar] [CrossRef]
  62. Rolfe, J.; Dyack, B. Testing Temporal Stability of Recreation Values. Ecol. Econ. 2019, 159, 75–83. [Google Scholar] [CrossRef]
  63. OECD. Social Issues in the Provision and Pricing of Water Services; OECD Publishing: Paris, France, 2023. [Google Scholar]
  64. Sun, B.D.; Cui, L.J.; Li, W.; Kang, X.M.; Zhang, M.Y. A Space-Scale Estimation Method based on continuous wavelet transform for coastal wetland ecosystem services in Liaoning Province, China. Ocean. Coast. Manag. 2018, 157, 138–146. [Google Scholar] [CrossRef]
Figure 1. Jilin Province, China.
Water 16 00203 g001
Figure 2. Spatial distribution and area of various wetlands from 2013 to 2017.
Water 16 00203 g002
Figure 3. Changes in the area of each type of wetland.
Water 16 00203 g003
Figure 4. Driving factors of changes in wetland areas.
Water 16 00203 g004
Figure 5. Predicted spatial distribution map of wetlands in Jilin Province in 2027.
Water 16 00203 g005
Figure 6. Freshwater supply value in Jilin Province. (a) Freshwater supply value of different types of wetlands. (b) Freshwater supply value of wetlands in various regions.
Water 16 00203 g006
Figure 7. Value of wetland total water supply per capita by region. Distribution of freshwater resource supply value per unit area of wetlands in various districts in (a) 2013, (b) 2017, and (c) 2027. Value of total per capita supply of water resources by region in (d) 2013, (e) 2017, and (f) 2027.
Water 16 00203 g007
Table 1. Changes in freshwater resource water usage.
Wetland Type (m3)201320172027
River wetlands6.04 × 1085.71 × 1085.61 × 108
Lake wetlands8.06 × 1087.42 × 1087.28 × 108
Swamp wetlands2.71 × 1083.13 × 1083.06 × 108
Artificial wetlands4.00 × 1083.83 × 1083.79 × 108
Total20.81 × 10820.09 × 10819.74 × 108
Table 2. Freshwater resource values in various regions.
RegionArea (km2)Total Water Resource Value (CNY)Unit Water Resource Value (CNY/km2)Reference
Jilin Province18.74 × 10486.42 × 10846,104.59This study
Anhui Province13.9 × 1042.98 × 1082143.88Niu et al. [39]
Beijing–Tianjin–Hebei Region21.6 × 10438.09 × 10817,634.26Li et al. [40]
Beijing City1.64 × 1041.19 × 108284.91Zhang et al. [41]
Hangzhou Bay Area85.34 × 1049.81 × 1081150.57Lin et al. [42]
Nanchang City71.94 × 102--91.15Zhu et al. [43]
Wakiso, Uganda27.40 × 102--213.65Kakuru et al. [44]
Sudd, South Sudan57 × 10369.17 × 105803.94Mulatu et al. [45]
Caripe Wetlands, Bolivian Altiplano4.8527.41 × 1035651.97Gandarillas et al. [46]
Disclaimer/Publisher’s Note: The statements, opinions and data contained in all publications are solely those of the individual author(s) and contributor(s) and not of MDPI and/or the editor(s). MDPI and/or the editor(s) disclaim responsibility for any injury to people or property resulting from any ideas, methods, instructions or products referred to in the content.

