
Developing an Approach for Equitable and Reasonable Utilization of International Rivers: The Nile River
 , , , and
Abstract
:
1. Introduction
2. Provisions of the UNWC towards Equitable and Reasonable Water Utilization
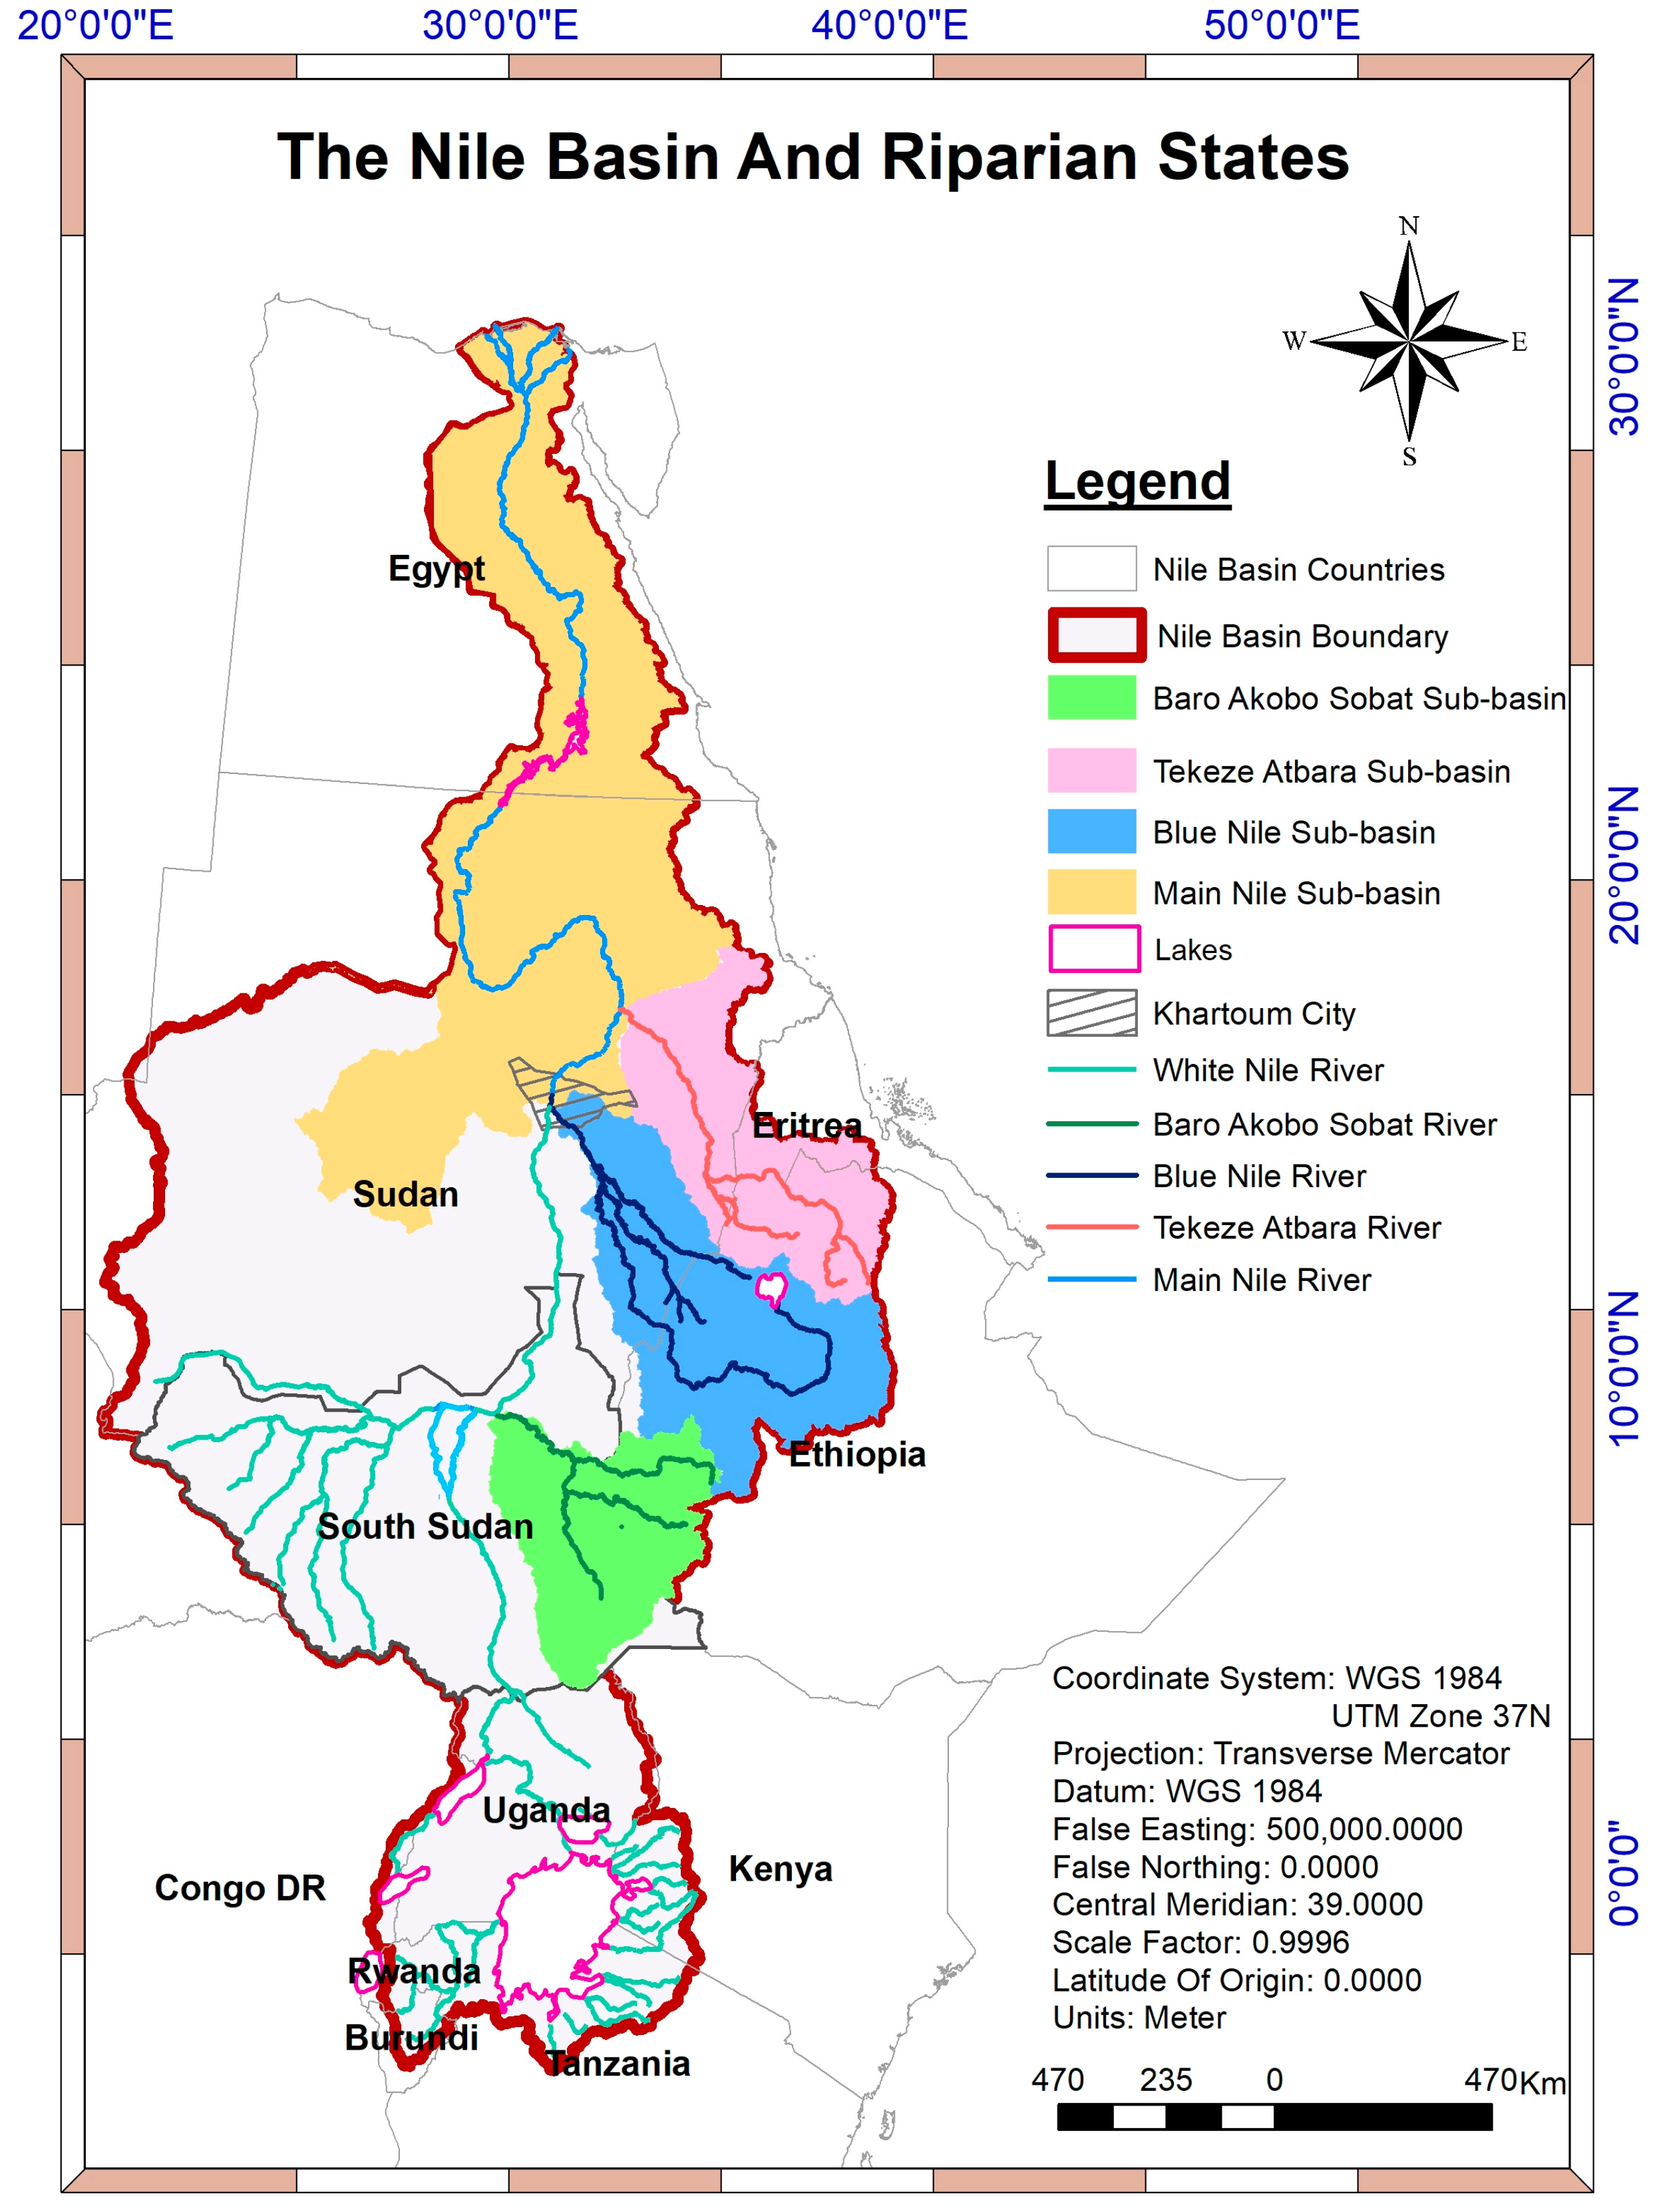
3. Study Area—The Nile River
4. Methodology
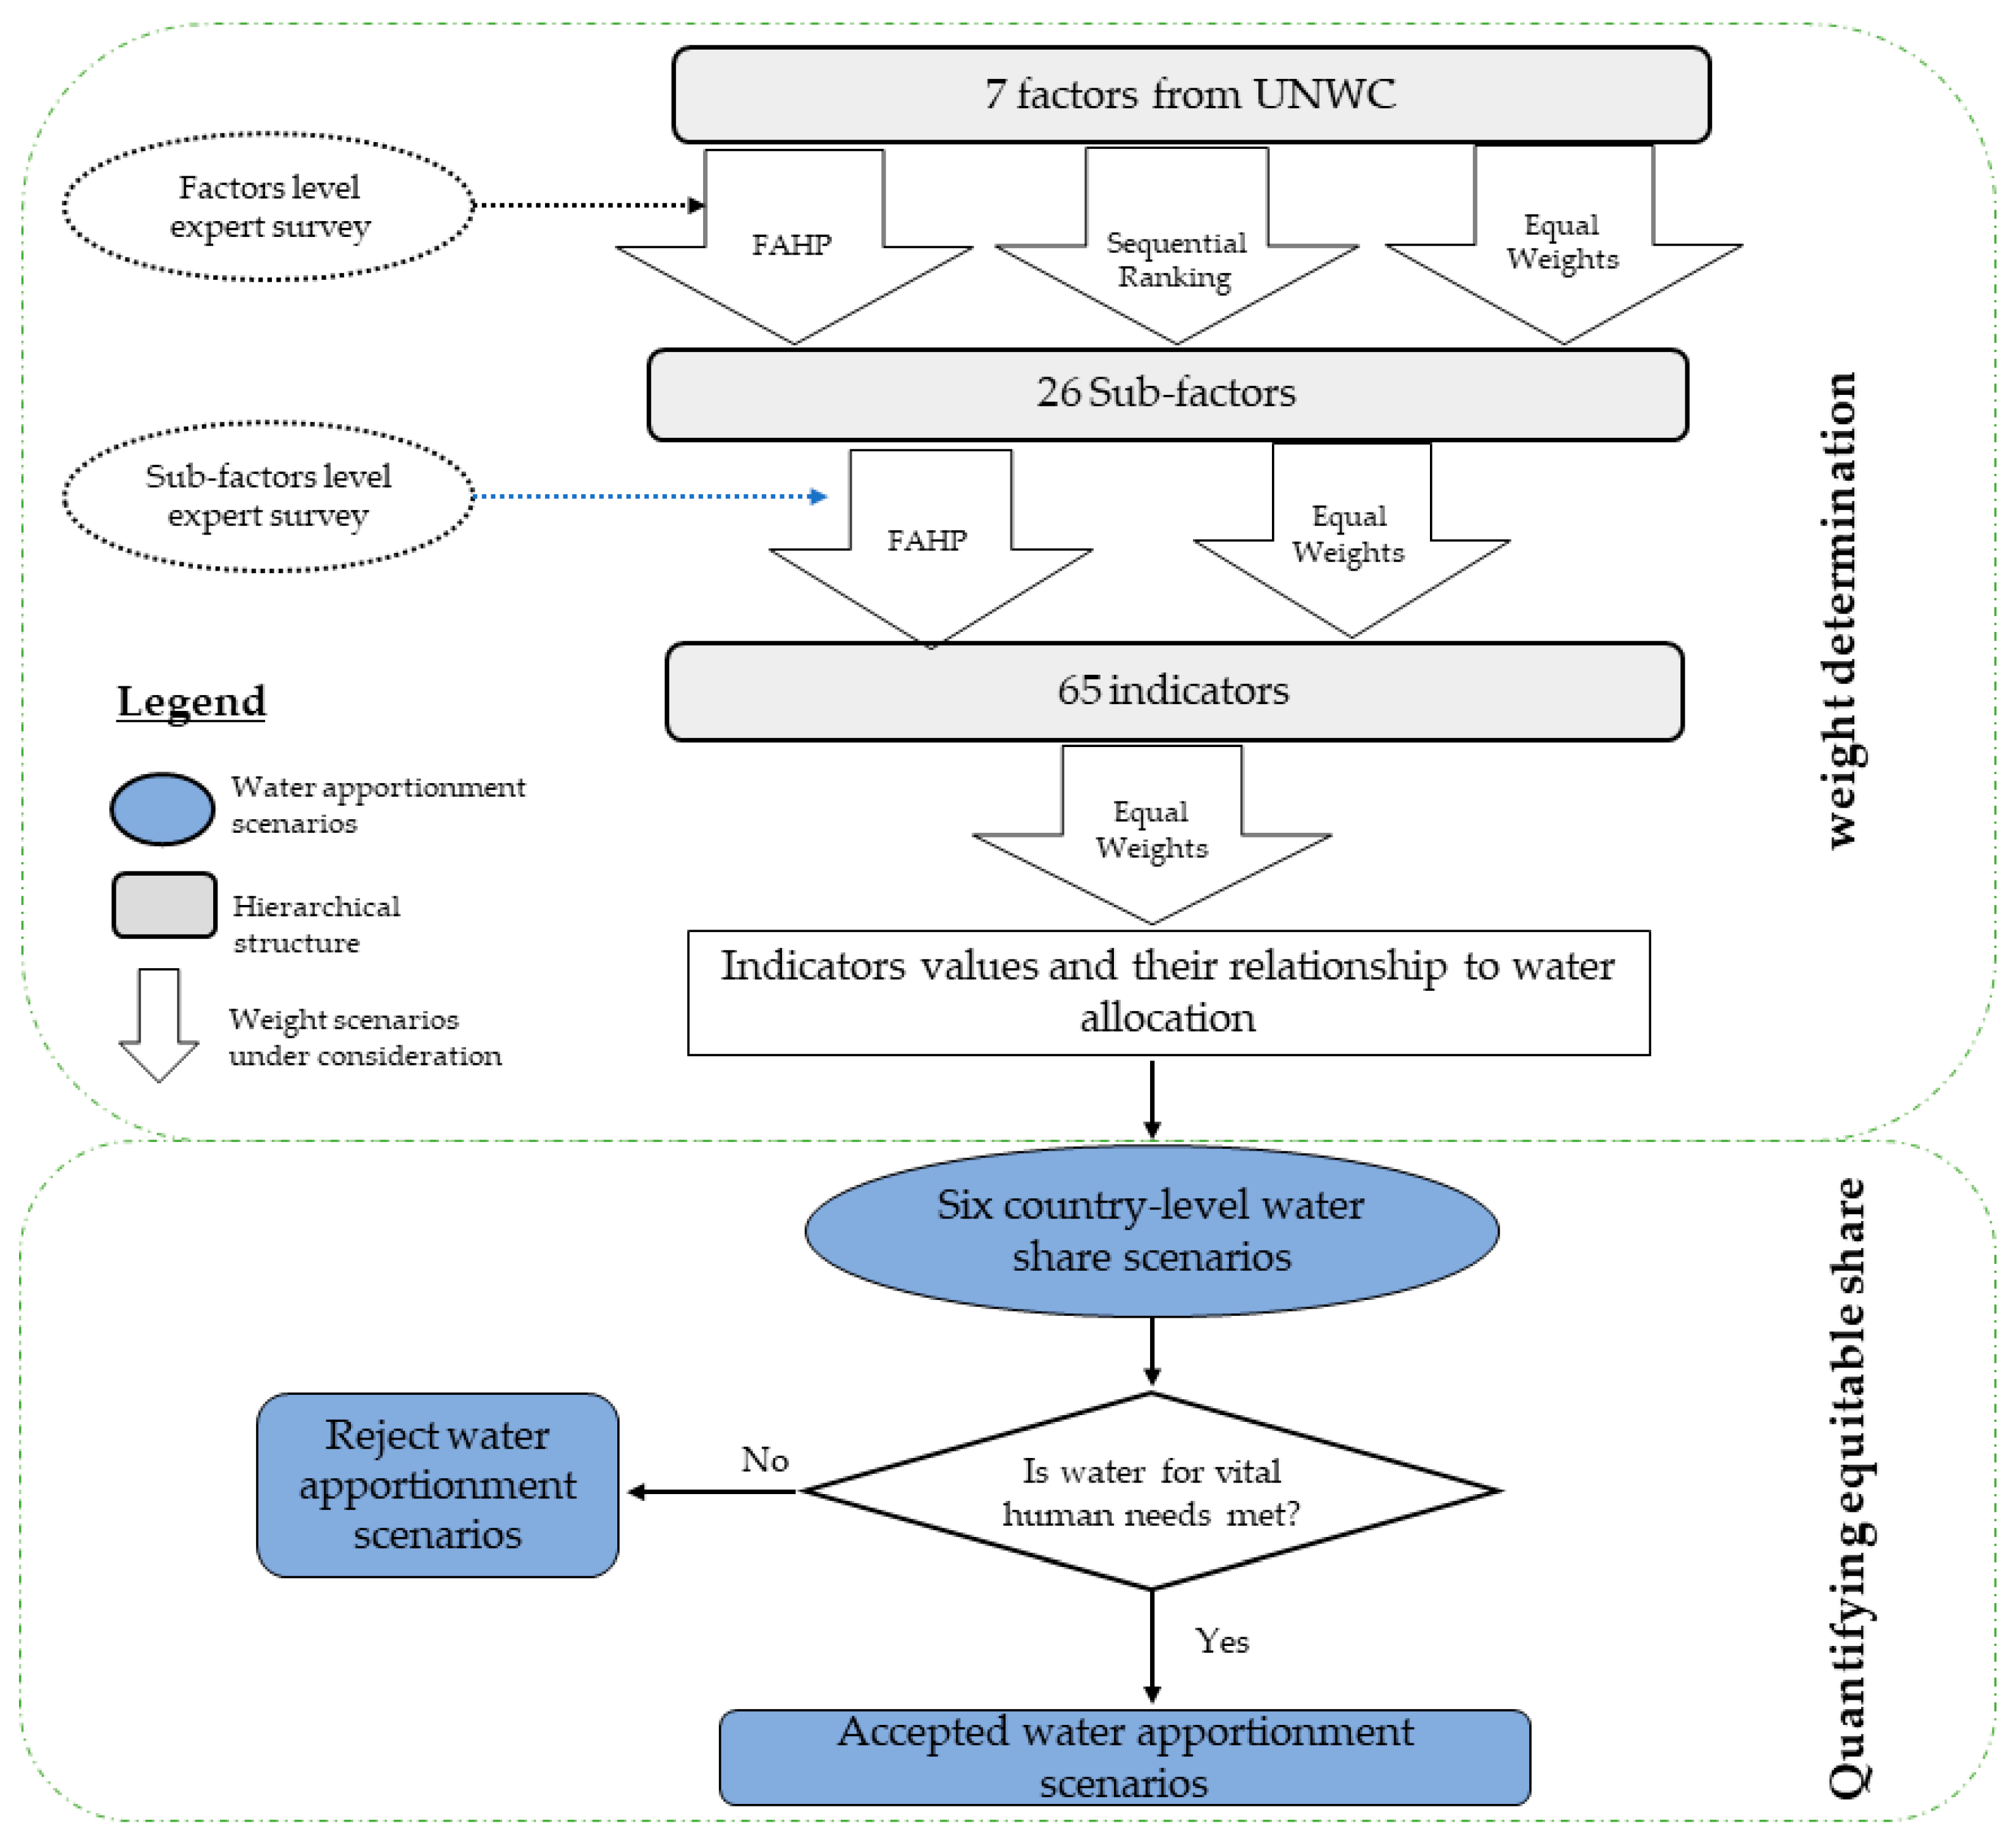
4.1. Equitable Water-Sharing Model
4.1.1. Computational Approach
4.1.2. The Three Weighting Functions
4.1.3. Implementation
- Basin-Wide Indicators Database
- Survey Development and Distribution
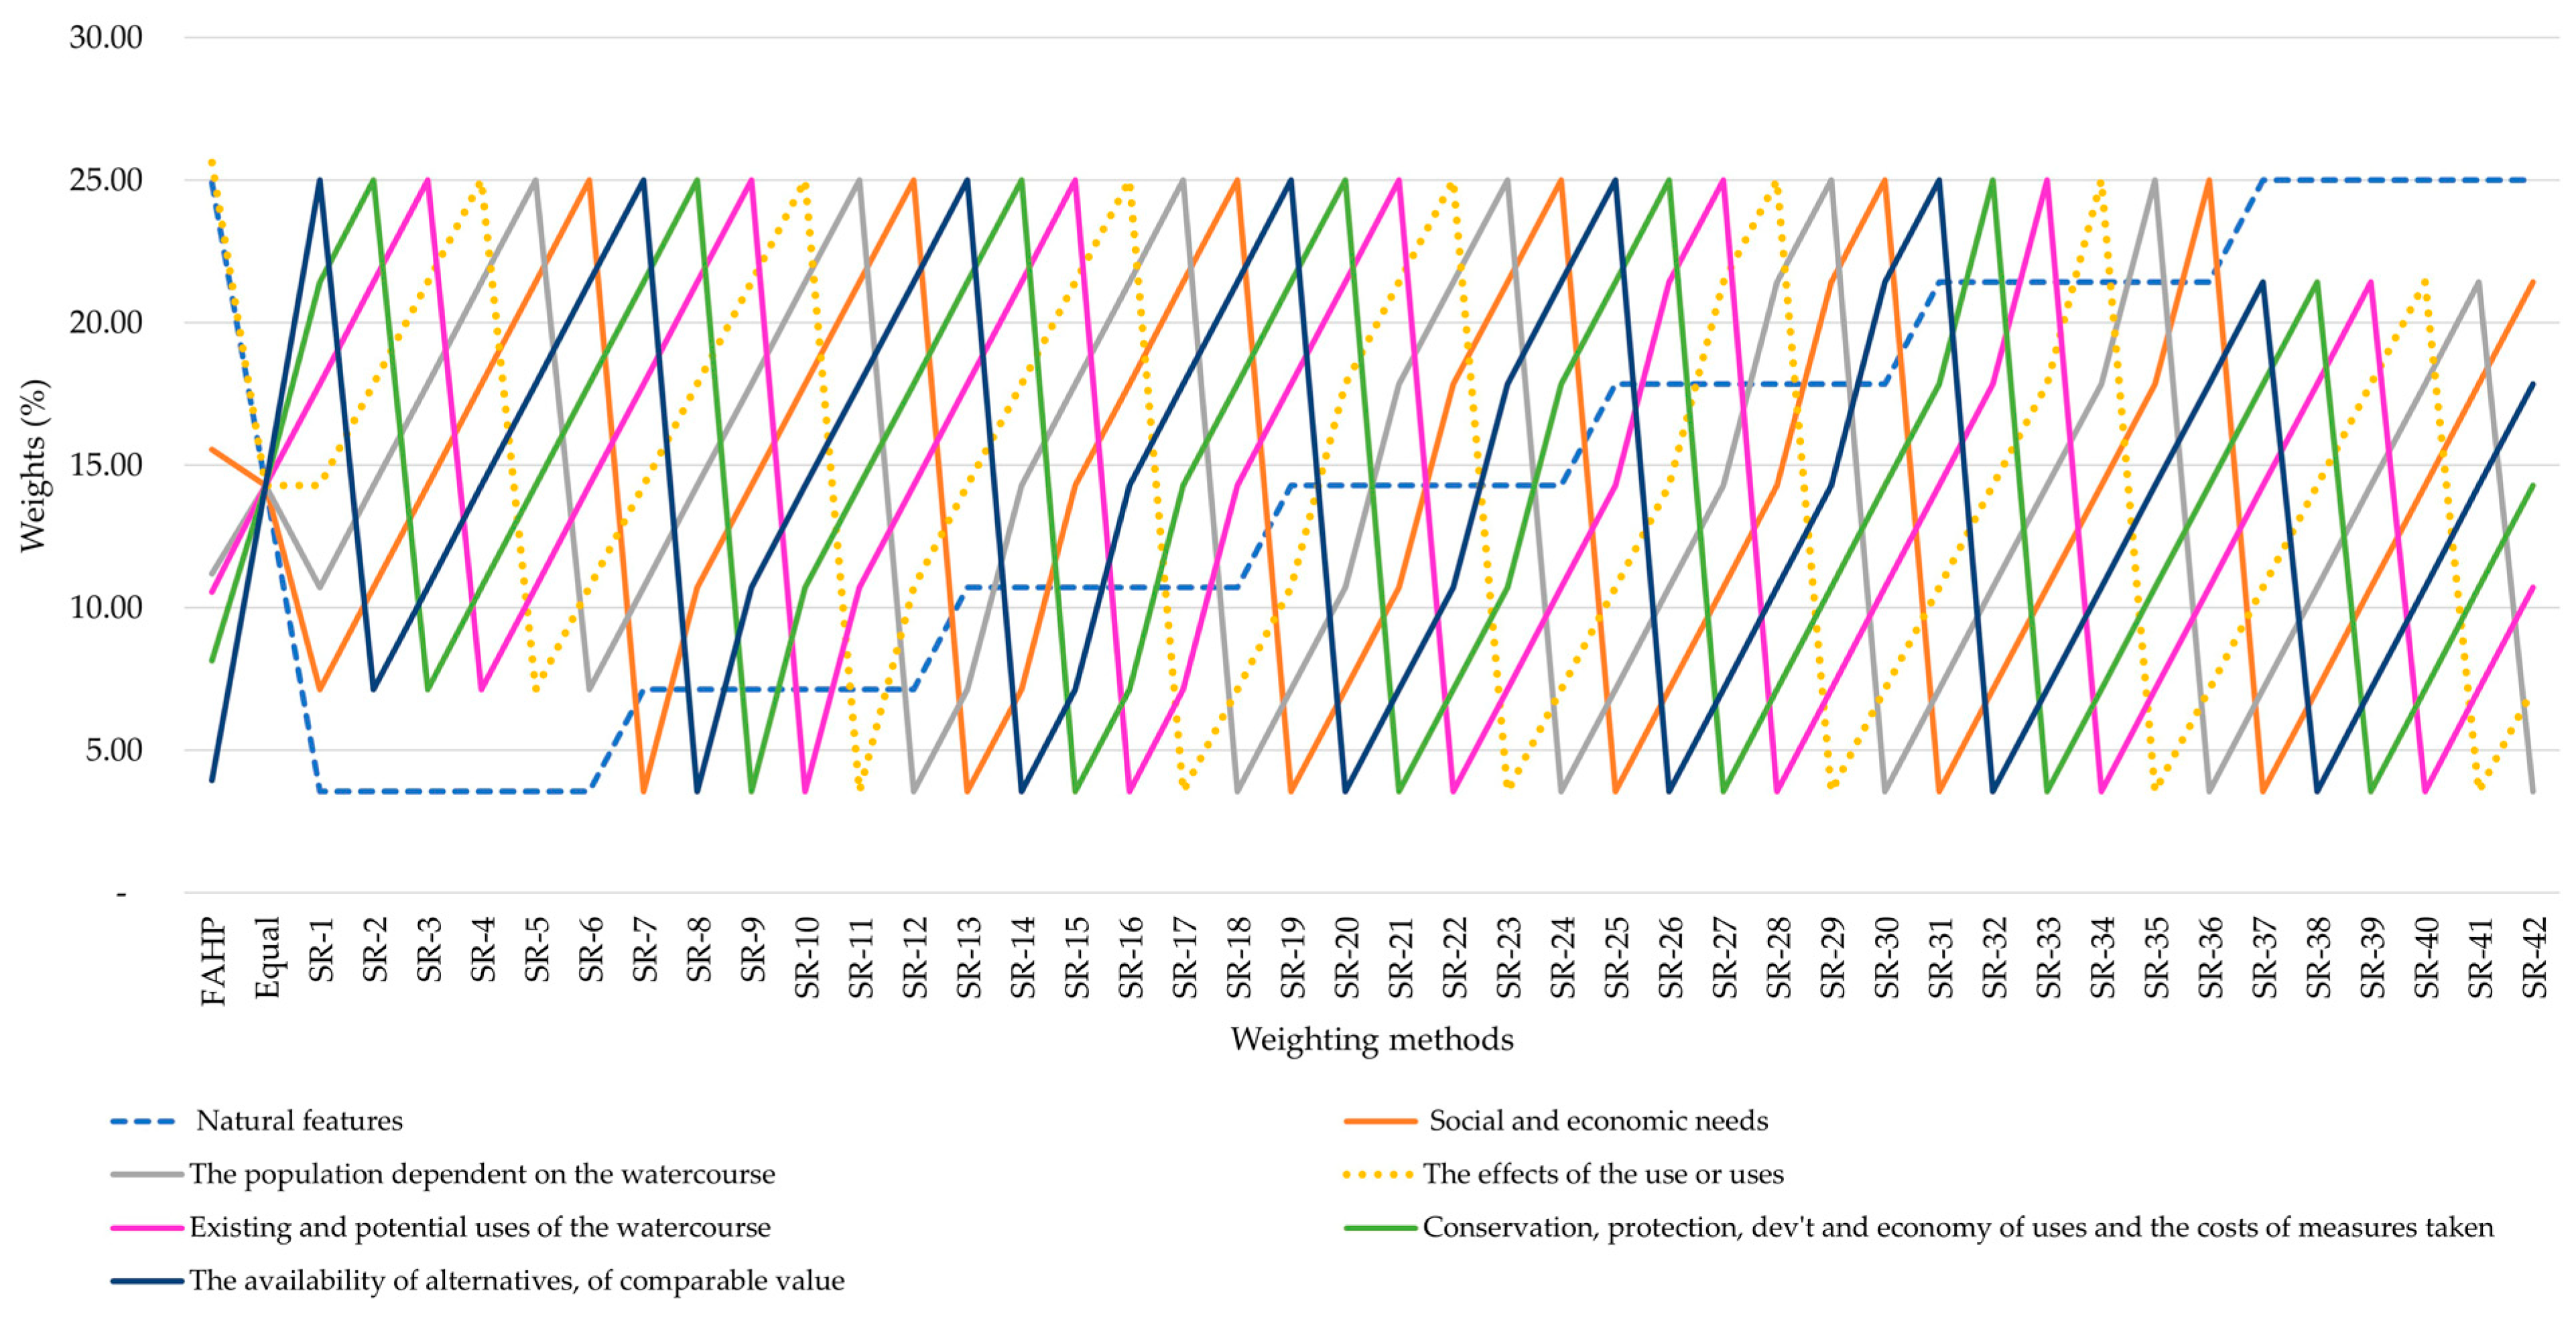
4.2. Application of Weighting Methods
5. Results
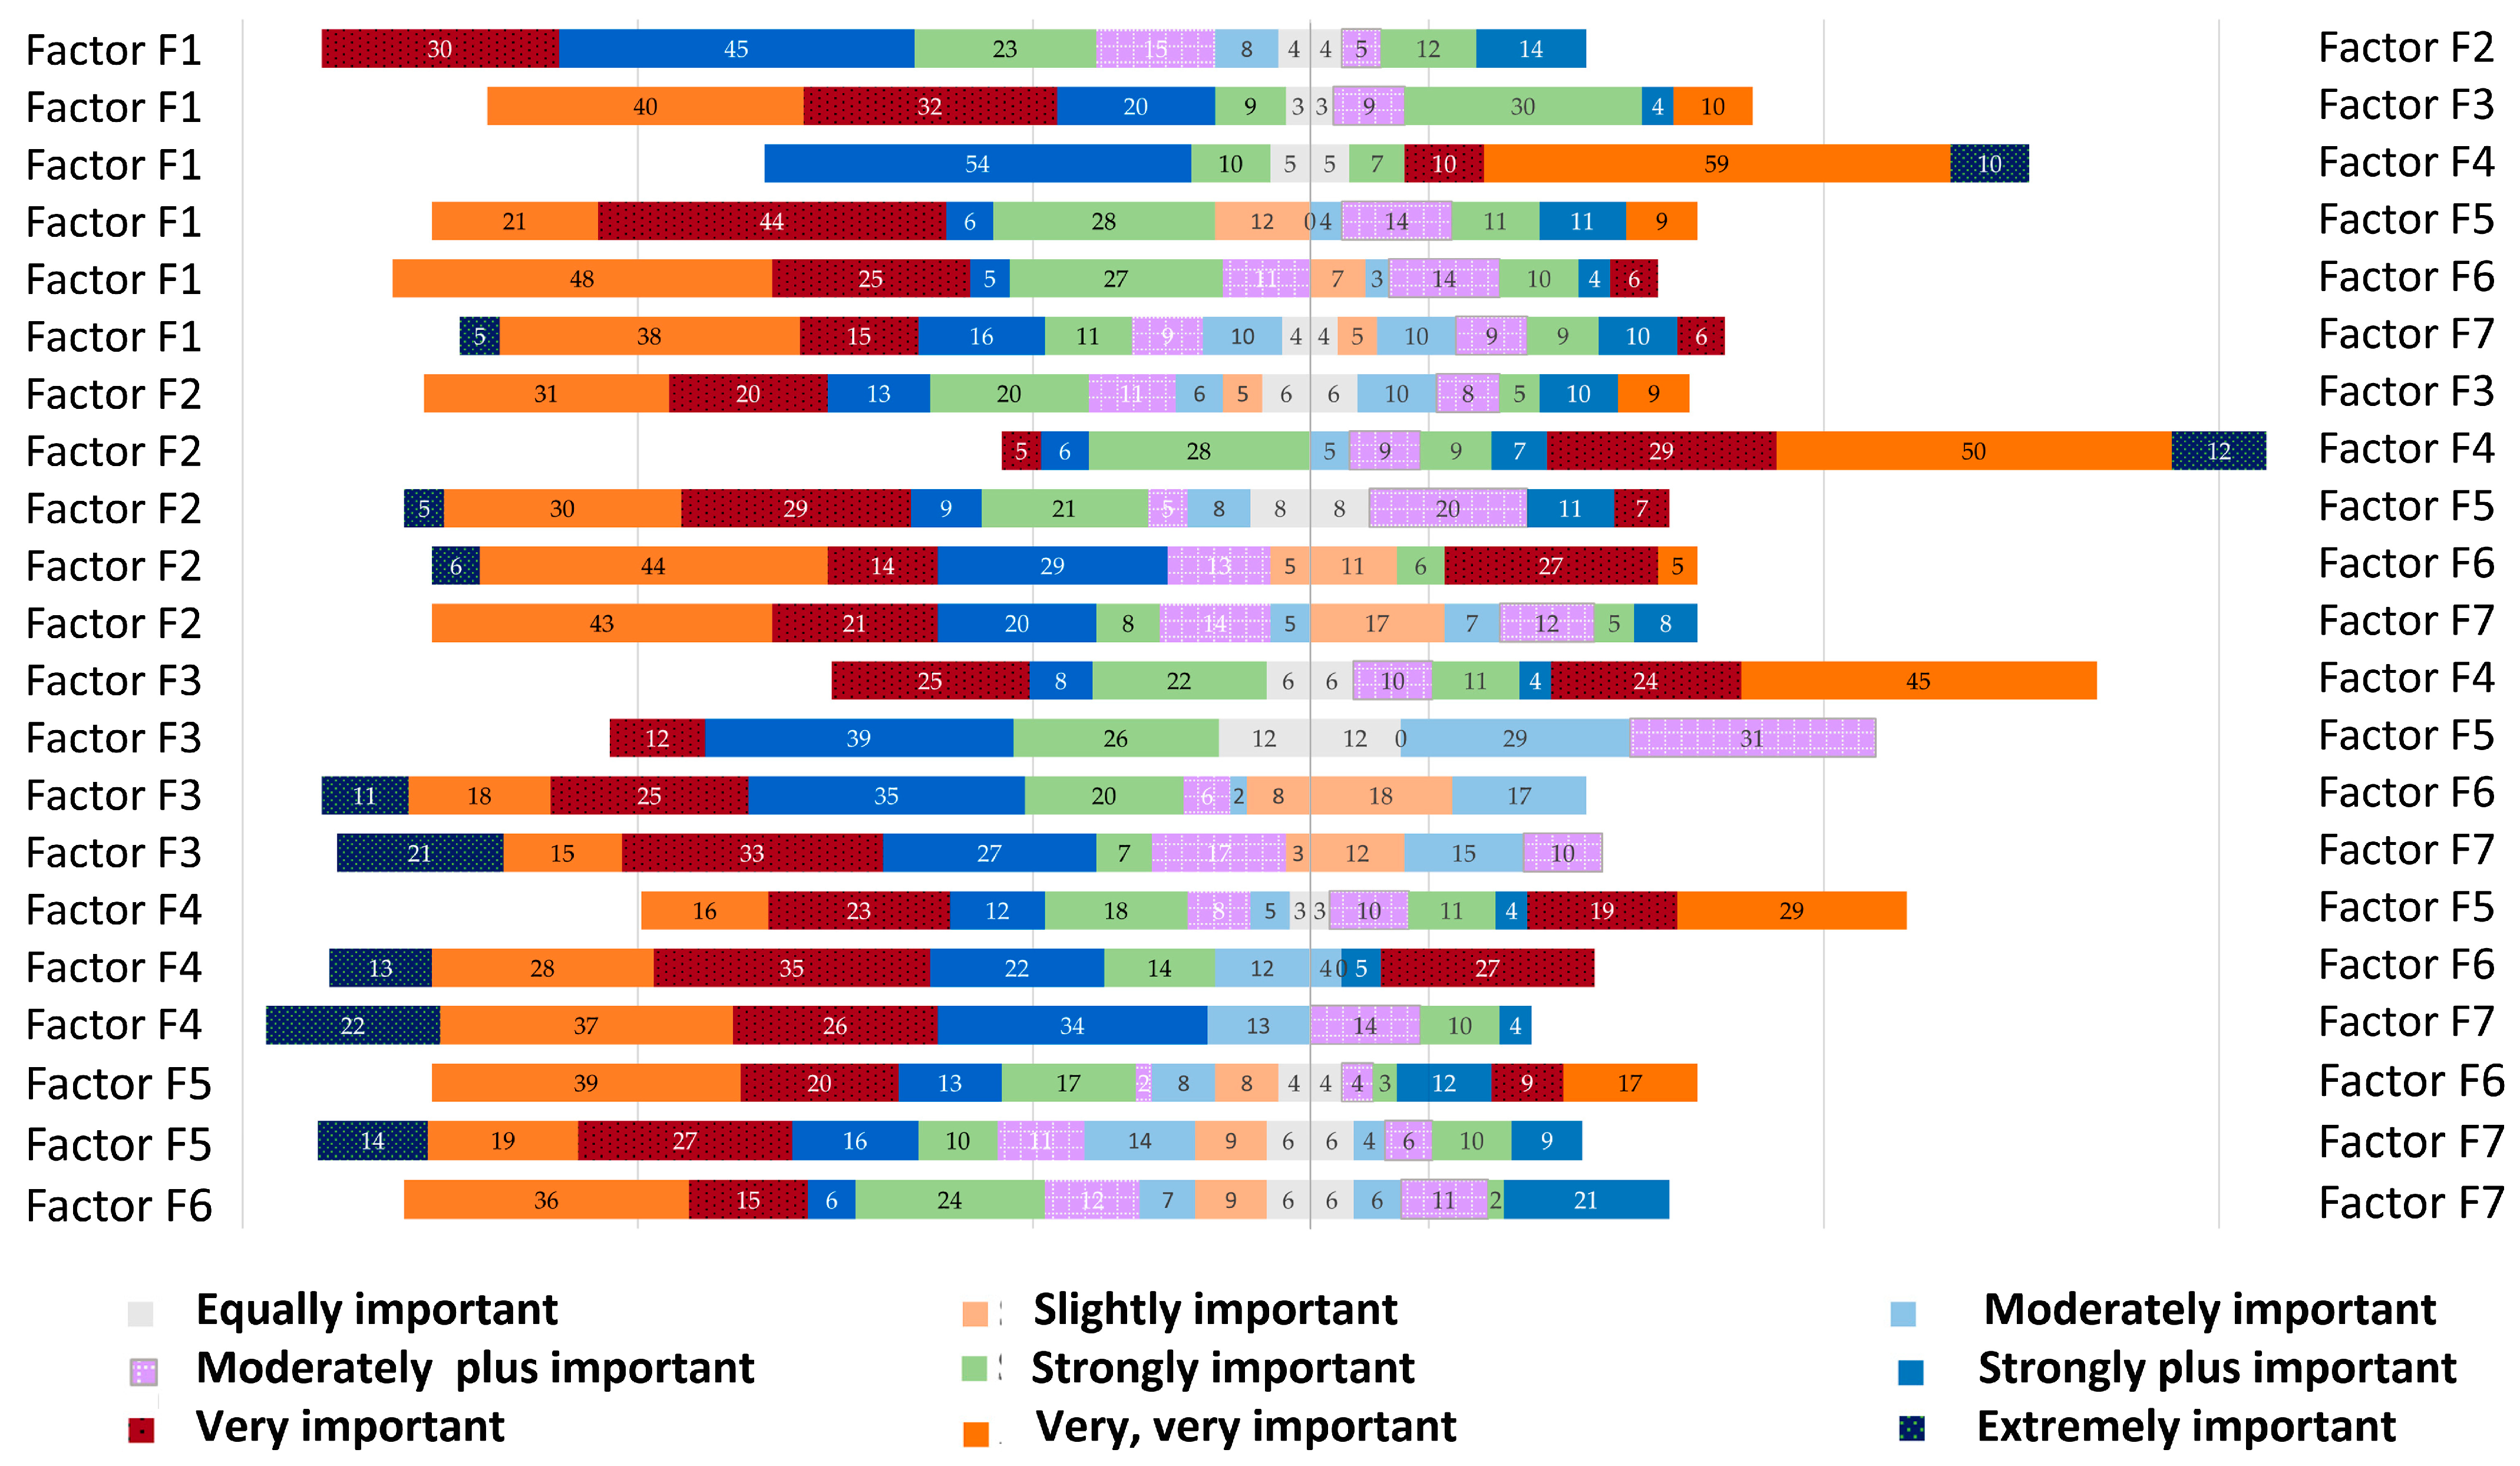
5.1. Survey
5.2. Factors, Subfactors and Indicator Weights
5.2.1. Factors and Subfactor Weights
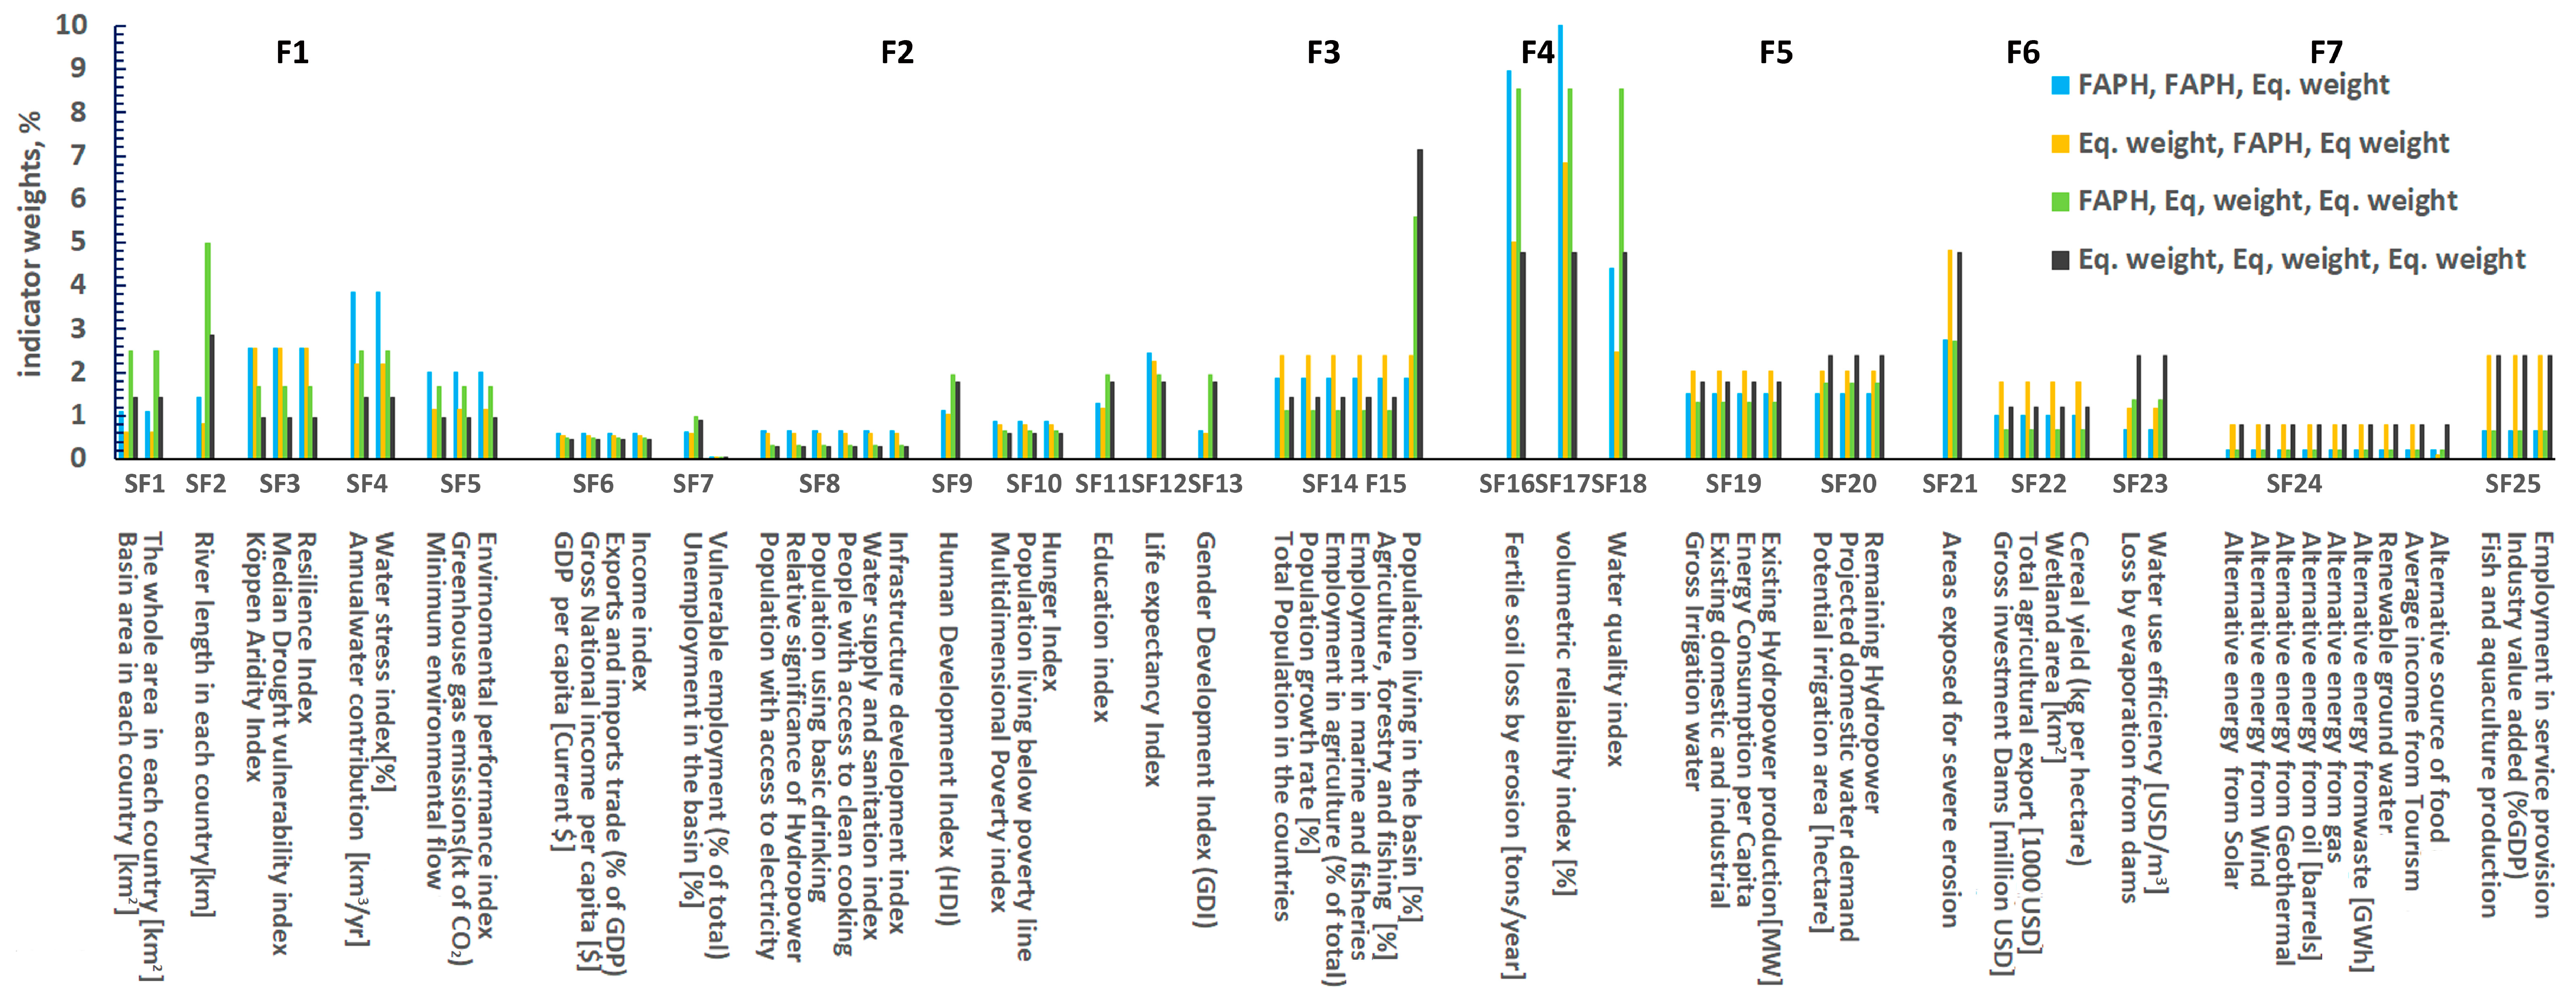
5.2.2. Indicator Weights
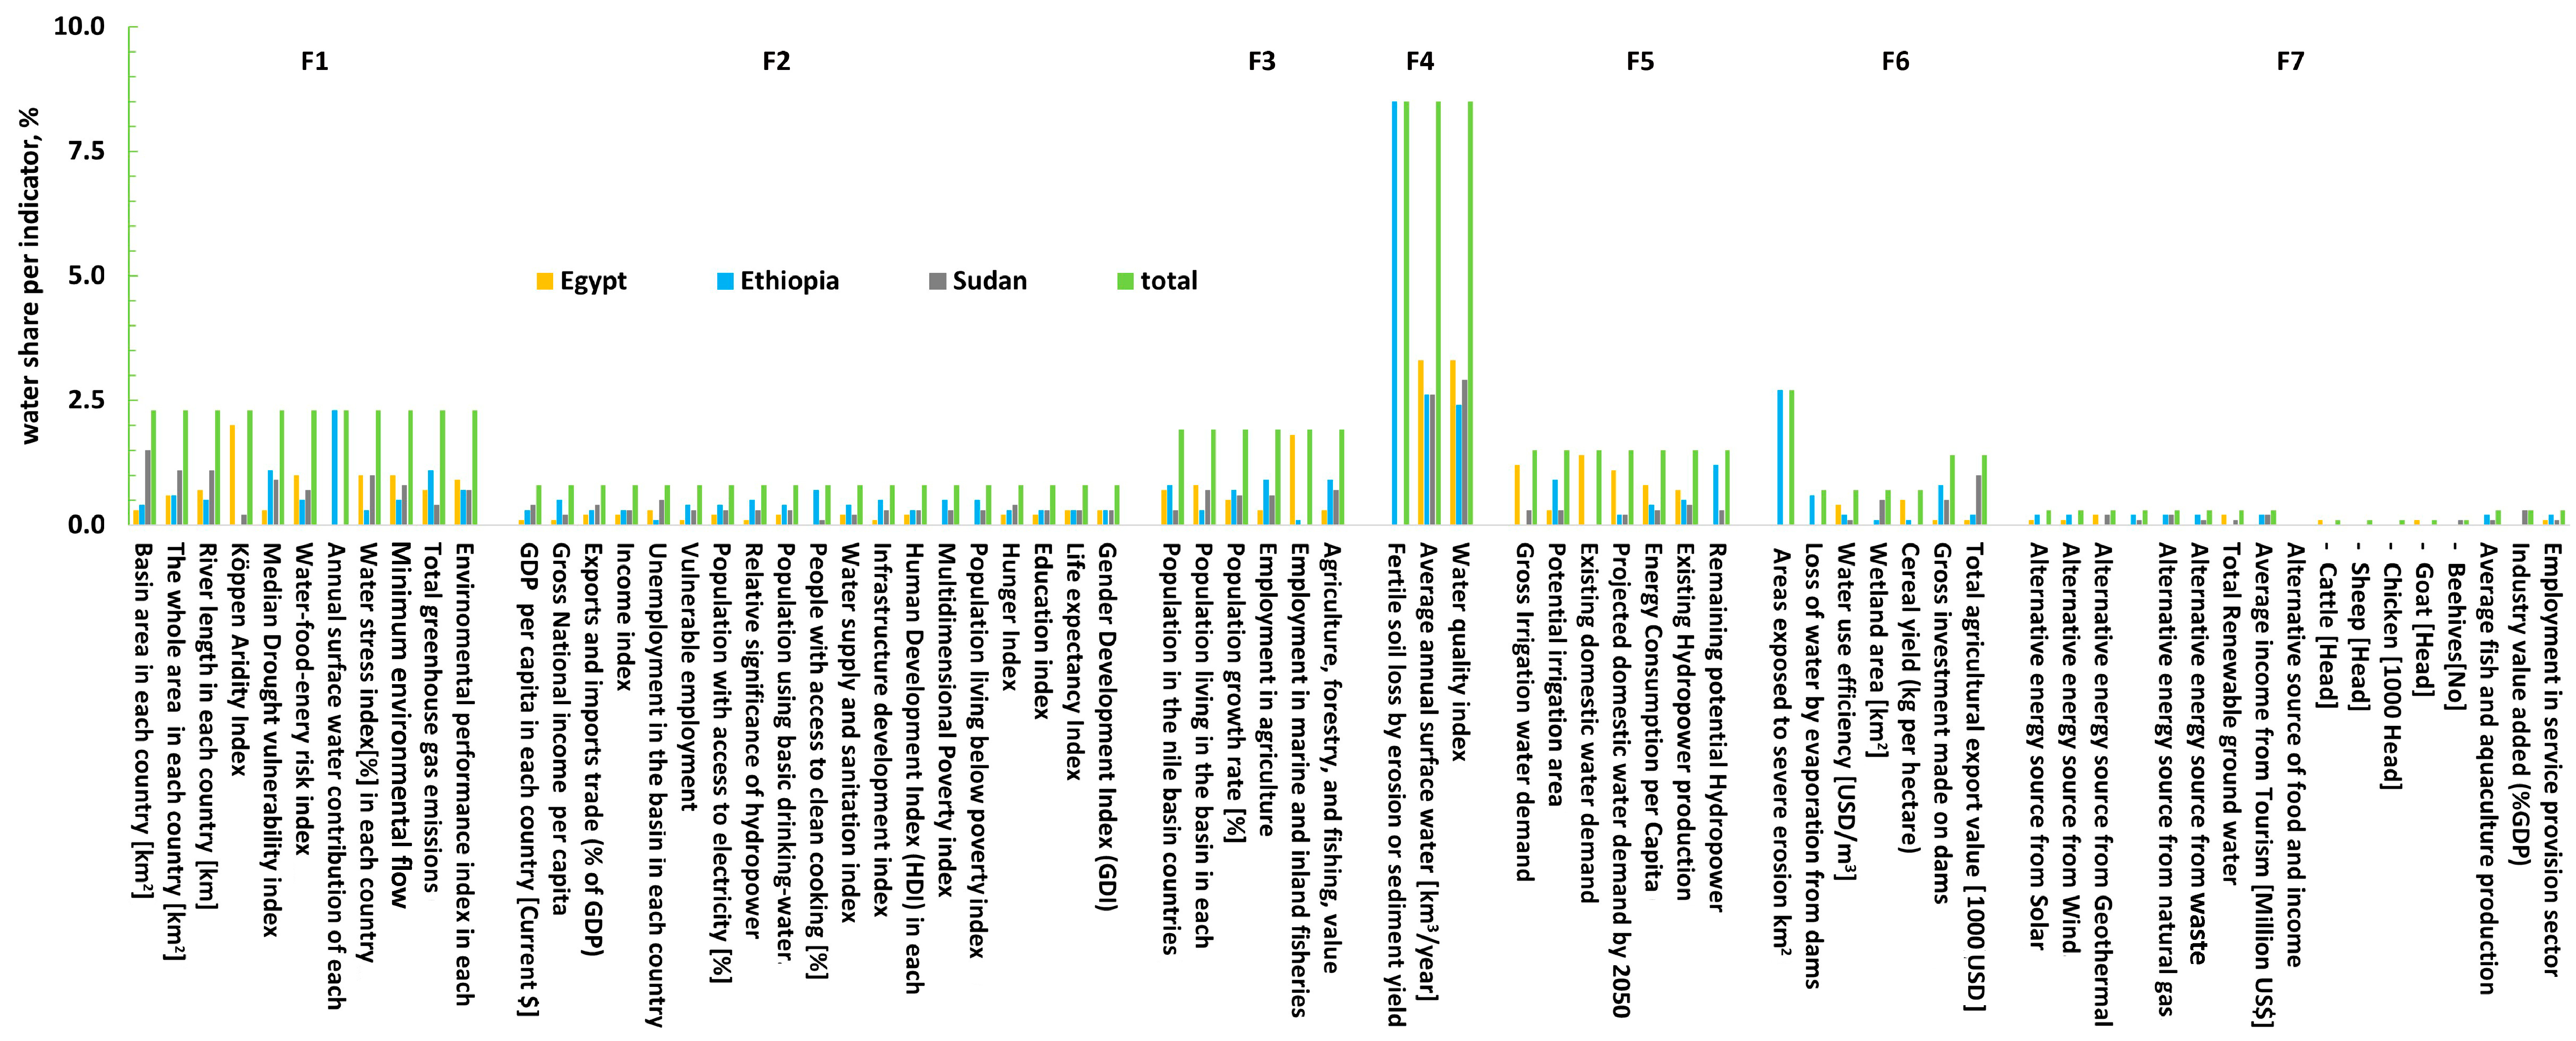
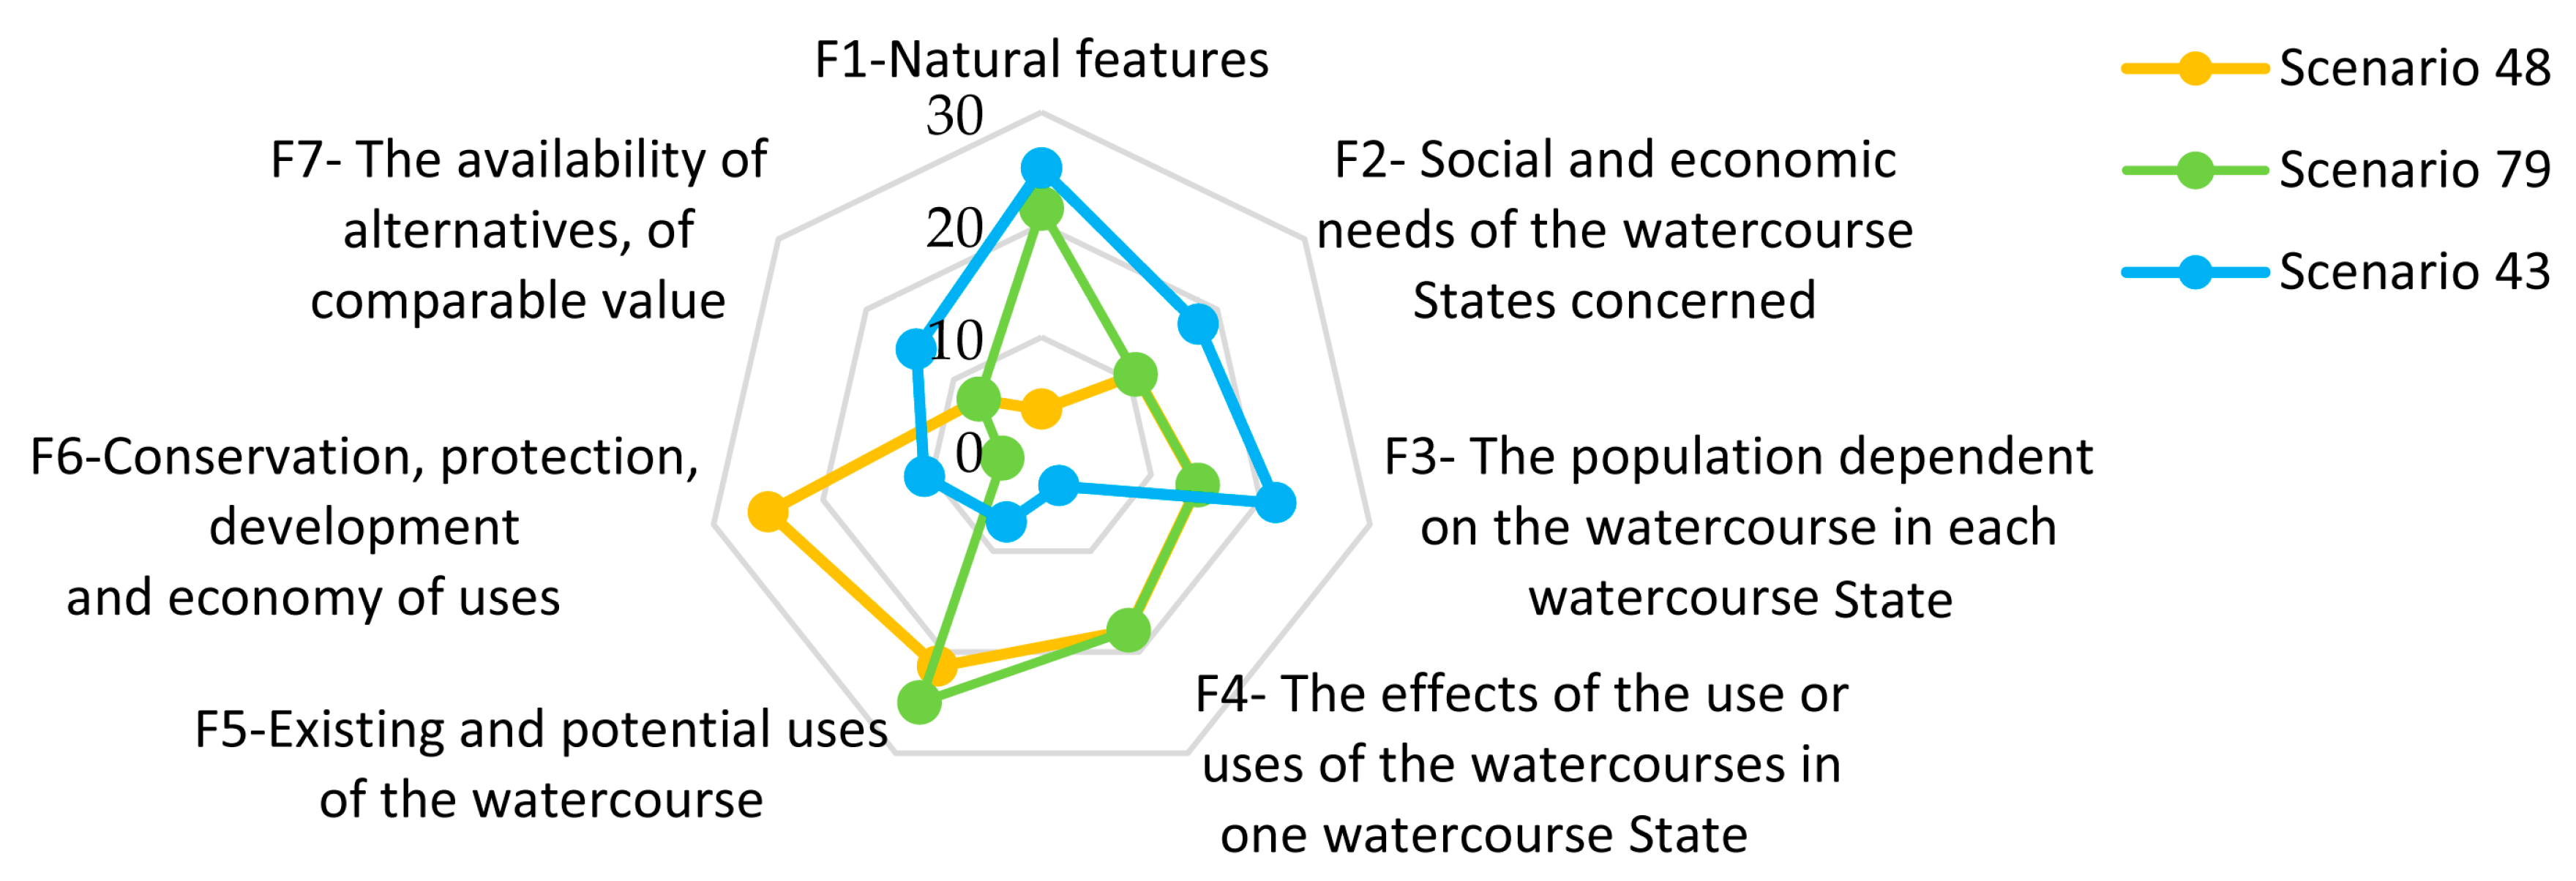
5.3. Sub-Basin and Country-Level Apportionment Ranges
6. Discussion
6.1. Evaluating Weighting Methods and Indicator Value in a Data-Scarce Environment
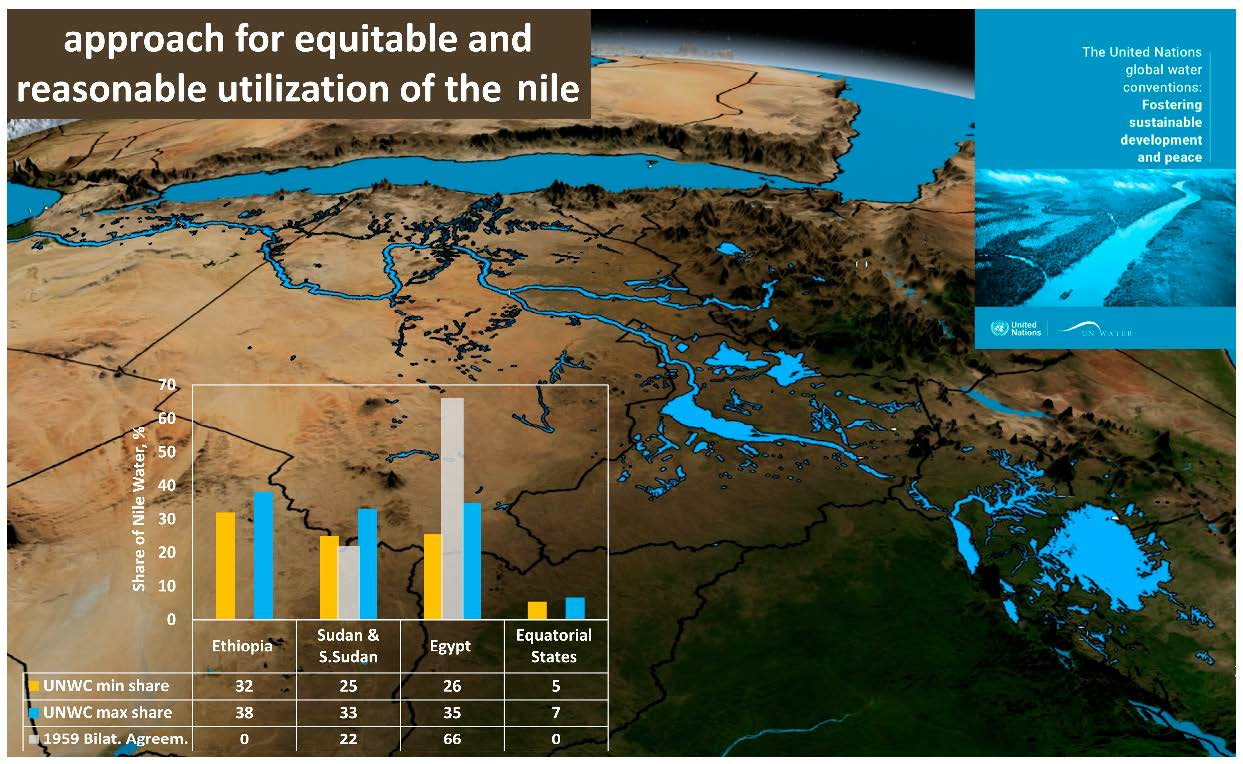
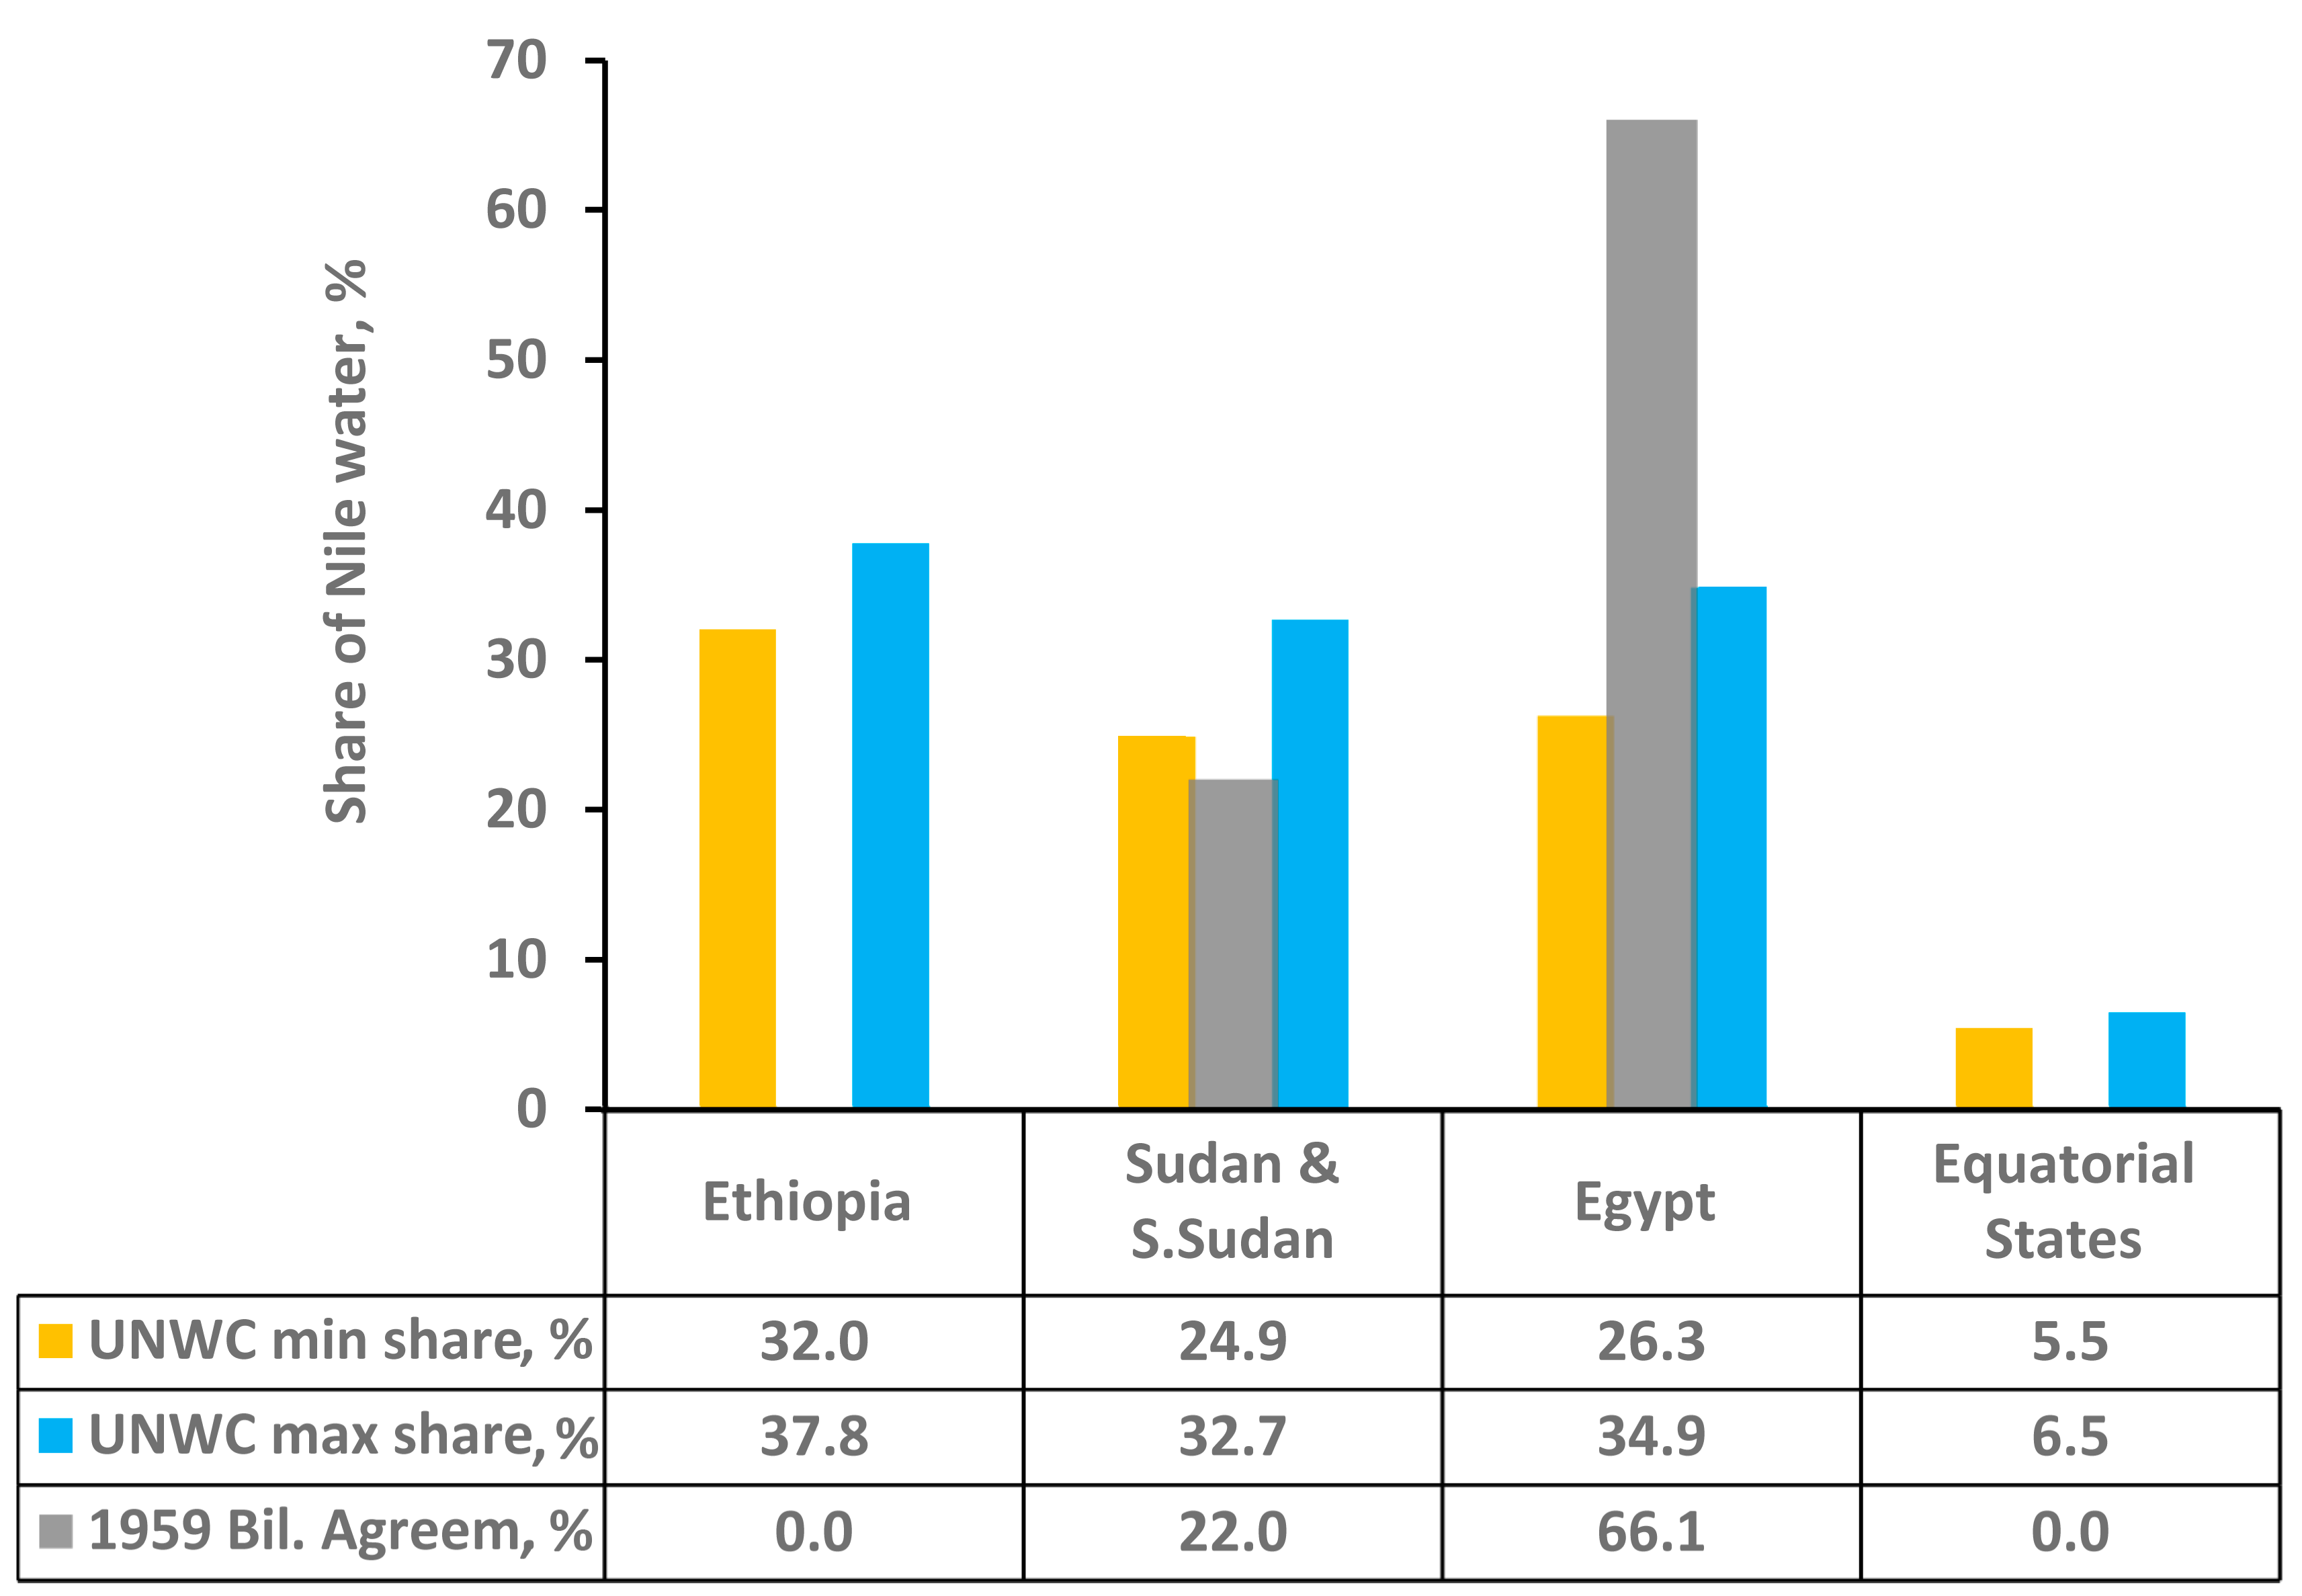
6.2. Sharing the Nile Water
6.3. Limitations and Way Forward
7. Conclusions
Supplementary Materials
Author Contributions
Funding
Data Availability Statement
Acknowledgments
Conflicts of Interest
Appendix A
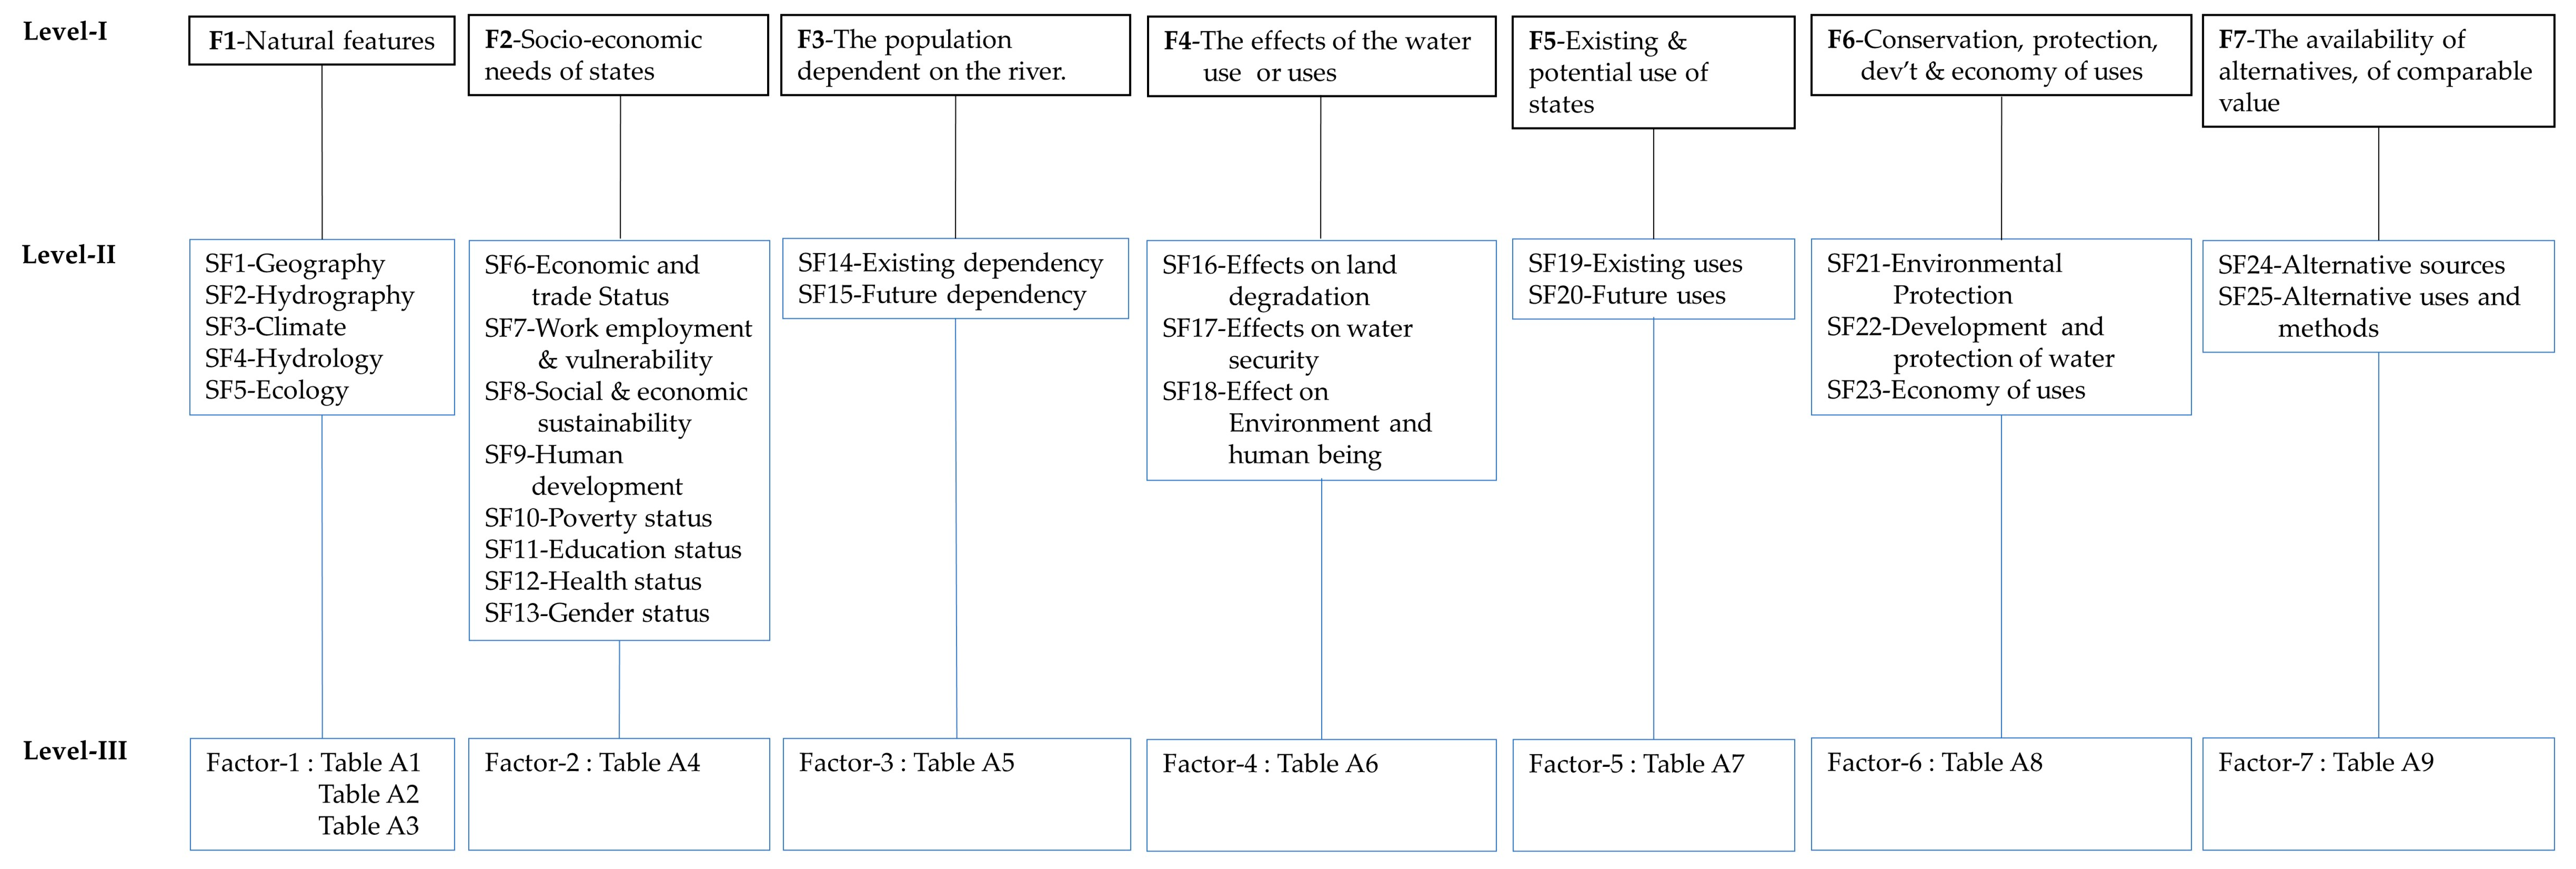
- Section S1: Description of the Factors
- Factor F1—Natural features
- Factor F2—Social and economic needs of states
- Factor F3—The population dependent on the watercourse
- Factor F4—The effects of the use of the watercourses by one state on other states
- Factor F5—Existing and potential uses of the watercourse
- Factor F6—Conservation, protection, development and economy of use of the water resources of the watercourse and the costs of measures taken to that effect
- Factor F7—The availability of alternatives of comparable value to a particular planned or existing use


| Nile Basin Country | Countries Total Area (1000 km2) | Area in the Nile Basin (1000 km2) | Area in the Nile Basin (% of Total Basin Area) | Area in the Country (% of Total Country Area) |
|---|---|---|---|---|
| Egypt | 997 | 302 | 9.5 | 30.3 |
| Eritrea | 122 | 26 | 0.8 | 21.1 |
| Ethiopia | 1144 | 365 | 11 | 31.9 |
| South Sudan | 644 | 621 | 19.5 | 97.7 |
| Sudan | 1864 | 1396 | 43.9 | 75.0 |
| Burundi | 28 | 14 | 0.4 | 49.4 |
| DR Congo | 2345 | 22 | 0.7 | 0.9 |
| Kenya | 593 | 51 | 1.6 | 8.7 |
| Rwanda | 26 | 21 | 0.6 | 84.0 |
| Tanzania | 945 | 119 | 3.7 | 12.7 |
| Uganda | 241 | 240 | 7.6 | 99.5 |
| Total | 8950 | 3177 | 100 |
| Watercourse Countries | Nile Basin System | |||||||||||
|---|---|---|---|---|---|---|---|---|---|---|---|---|
| Blue Nile Sub-System | White Nile Sub-System | Baro-Akobo Sub-System | Tekeze-Atbara Sub-System | |||||||||
| River Len. (km) | Aridity Index | Inflow (km3) | River Len. (km) | Aridity Index | Inflow (k m3) | River Len. (km) | Aridity Index | Inflow (k m3) | River Len. (km) | Aridity Index | Inflow (k m3) | |
| a | b | c | a | b | c | a | b | c | a | b | c | |
| Egypt | 1747 | 0.5 | - | 1747 | 0.5 | - | 1747 | 0.5 | - | 1747 | 0.5 | - |
| Ethiopia | 1321 | 20.0 | 53 | - | - | - | 838 | 21.0 | 12.43 | 1146 | 12.9 | 13.7 |
| Both Sudans | 2827 | 4.26 | - | 3657 | 10.4 | - | 1428 | 10.4 | - | 2307 | 4.3 | - |
| Equatorial states | - | - | - | 969 | 20.5 | 31.3 | - | - | - | - | - | - |
| Natural Feature Indicators | Egypt | Ethiopia | Sudan | South Sudan | Equatorial States |
|---|---|---|---|---|---|
| Drought vulnerability index 1 | 0.20 | 0.72 | 0.61 | 0.61 | 0.65 |
| Resilience index 2 | 1.51 | 2.94 | 2.06 | 2.06 | 2.76 |
| SDG water stress (%) 3 | 117 | 32 | 119 | 61 | 10 |
| Environmental flow (mcm/year) 4 | 2093 | 652 | 1678 | 1678 | 292 |
| Total greenhouse gas emissions (kt of CO2 equivalent) 5 | 295,500 | 185,292 | 491,982 | 491,982 | 197,599 |
| Environmental performance index 6 | 43.30 | 34.40 | 34.8.49 | 34.49 | 33.10 |
| Socio-Economic Indicators | Egypt | Ethiopia * | Sudan | South Sudan | Equatorial States |
|---|---|---|---|---|---|
| GDP per capita [current USD] 1 | 3020 | 857 | 781 | 634 | 887 |
| Gross national income per capita [USD] 2 | 11,350 | 2140 | 4430 | 2885 | 2183 |
| Exports and imports trade (% of GDP) 3 | 48.3 | 31.2 | 22.6 | 38.4 | 46.3 |
| Income index 4 | 0.71 | 0.44 | 0.56 | 0.48 | 0.42 |
| Unemployment [%] 5 | 10.8 | 2.1 | 16.5 | 14.4 | 2.2 |
| Vulnerable employment (% of total) 6 | 21 | 86 | 50 | 67 | 75 |
| Population with access to electricity [%] 7 | 100 | 45 | 60 | 44 | 36 |
| Relative significance of hydropower [%] 8 | 12 | 95 | 49 | 49 | 67 |
| Population using basic drinking water [%] 9 | 99 | 41 | 60 | 51 | 54 |
| People with access to clean cooking [%] 10 | 98 | 4 | 41 | 21 | 4 |
| Water supply and sanitation index 11 | 98 | 40 | 67 | 56 | 58 |
| Infrastructure development index 12 | 88 | 10 | 17 | 11 | 18 |
| Human development index (HDI) [%] 13 | 0.70 | 0.47 | 0.51 | 0.46 | 0.51 |
| Multidimensional poverty index 14 | 0.02 | 0.49 | 0.28 | 0.43 | 0.30 |
| Popul. below income poverty line [%] 15 | 1.3 | 27.3 | 14.9 | 28.8 | 55.2 |
| Hunger Index 16 | 14.6 | 28.9 | 32.8 | 32.8 | 28.4 |
| Education index 17 | 0.61 | 0.34 | 0.34 | 0.32 | 0.48 |
| Life expectancy index 18 | 71.66 | 65.86 | 64.6 | 60.99 | 63.19 |
| Gender development index (GDI) [%] 19 | 0.88 | 0.84 | 0.84 | 0.84 | 0.92 |
| Indicators for Watercourse States Population Dependency | Egypt | Ethiopia | Sudan | Both Sudan | Equatorial States |
|---|---|---|---|---|---|
| Population in the Nile basin countries [in millions] 1 | 100 | 112 | 43 | 54 | 266 |
| Population living in the basin [%] 2 | 94 | 38 | 87 | 93 | 50 |
| Population growth rate [%] 3 | 2.0 | 2.6 | 2.4 | 1.5 | 3.0 |
| Employment in agriculture (% of total employment) 4 | 24 | 66 | 40 | 48 | 68 |
| Employment in marine and fisheries in thousands employed 5 | 796 | 23.4 | 17.4 | 20.9 | 114 |
| Agriculture, forestry, and fishing, value added (% of GDP) 6 | 11 | 34 | 28 | 20 | 26 |
| The Effects of the Use or Uses of the Watercourses on Another Watercourse State | Egypt | Ethiopia | Sudan | Both Sudan | Equatorial States |
|---|---|---|---|---|---|
| Fertile soil loss by erosion [million ton/year] 1 | 0.00 | 140.0 * | 0.00 | 0.87 | 0.47 |
| Average annual volumetric reliability index [%] 2 | 0.80 | 1.00 | 1.00 | 1.00 | 1.00 |
| Water quality index 3 | 78 | 55 | 67 | 67 | 63 |
| Indicators for Existing and Potential Uses of the Watercourse | Egypt | Ethiopia | Sudan | Both Sudans | Equatorial States |
|---|---|---|---|---|---|
| Current net irrigation water demand in each basin country [km3/year.] 1 | 57.1 | 2.0 | 13.3 | 13.3 | 0.79 |
| Projected irrigation water demand by 2050 in each basin country [km3/year.] 2 | 80.5 | 22.2 | 25.5 | 30.4 | 3.1 |
| Potential irrigation area in each basin country [million ha] 3,* | 4.4 | 2.7 | 2.5 | 4.0 | 9.9 |
| Existing domestic and industrial water use in each basin country [km3/year] 4 | 10.2 | 0.0 | 0.3 | 0.3 | 0.1 |
| Projected domestic water demand by 2050 in each basin country [km3/year] 5 | 13.1 | 2.4 | 2.9 | 3.1 | 11.4 |
| Energy consumption per capita (kg of oil equivalent per capita) 6 | 913 | 493 | 342 | 342 | 410 |
| Existing hydropower production in the basin in each country [MW] 7 | 2862 | 1070 | 1592 | 1592 | 713 |
| Potential hydropower generation in the basin in each country [MW] 8 | 2902 | 17,355 | 4873 | 7443 | 5364 |
| Indicators of Conservation, Protection, Development and Economy of Uses and the Costs of Measures Taken | Egypt | Ethiopia | Sudan | Both Sudan | Equatorial States |
|---|---|---|---|---|---|
| Areas exposed to severe soil erosion in each country at a rate of over 80 ton/ha/year [1000 km2] 1 | 0 | 39.3 | 0 | 0 | 16.9 |
| Water loss by evaporation from dams in each basin country [km3/year] 2 | 12.6 | 0.2 | 4.6 | 4.6 | 0.0 |
| Water use efficiency [USD/m3] 3 | 3.8 | 1.9 | 1.6 | 1.6 | 11.6 |
| Wetland area [km2] 4 | 4 | 28 | 108 | 690 | 126 |
| Agricultural (cereal) yield (ton/ha) 5 | 72 | 22 | 6 | 6 | 16 |
| Gross investment made on dams [billion USD] 6 | 1.00 | 7.84 | 4.38 | 4.38 | 0.88 |
| Total agricultural export value [million USD] 7 | 4056 | 2374 | 552 | 552 | 878 |
| Indicators for Availability of Alternative Uses and Comparable Values | Egypt | Ethiopia | Sudan | Both Sudans | Equatorial States |
|---|---|---|---|---|---|
| Alternative energy from solar (both PV and CSP) [TWh/year] 1 | 58,823 | 50,113 | 165,239 | 165,239 | 27,573 |
| Alternative energy from wind [TWh/year] 2 | 36,601 | 14,838 | 61,661 | 61,661 | 7320 |
| Alternative energy from geothermal [MW] 3 | - | 10,000 | - | - | - |
| Alternative energy from oil [proved oil reserves in billion barrels] 4 | 3.33 | - | 1.50 | 5.00 | - |
| Alternative energy from natural gas [proved reserves trillion m3] 5 | 1.8 | - | - | 49,326 | 12,261 |
| Alternative energy from waste recycling via incineration method [GWh] 6 | 287,088 | 49,946 | 107,020 | 107,020 | 37,087 |
| Total renewable groundwater resource [km3/year] 7 | 1.5 | 20.0 | 3.0 | 7.0 | 83.0 |
| Total non-renewable groundwater resource [km3] 8 | 6000 | - | 40 | 40 | - |
| Average tourism income [million USD] 9 | 6900 | 1010 | 1029 | 527 | 902 |
| Alternative source of food and income from livestock resource | |||||
| -Cattle [1000 head] 10 | 5064 | 60,927 | 30,734 | 21,285 | 10,481 |
| -Sheep [1000 head] 11 | 5698 | 31,837 | 40,574 | 29,198 | 5044 |
| -Chicken [1,000,000 head] 12 | 156 | 59 | 48 | 31.65 | 25 |
| -Goat [1000 head] 13 | 4351 | 30,719 | 31,444 | 22,504 | 11,158 |
| -Beehives [1000 no] 14 | 877 | 6140 | 76 | 76 | 983 |
| Average fish and aquaculture production [1000 metric ton/year] 15 | 732 | 12 | 38 | 37 | 139 |
| Industry value added (% GDP), including construction industry 16 | 35 | 27 | 2 | 11 | 22 |
| Employment in service provision sector [% of total employment] 17 | 49 | 22 | 42 | 38 | 22 |
| Country | Continent | Target Survey | Experts Profession | Total Collected Responses | |||||||||
|---|---|---|---|---|---|---|---|---|---|---|---|---|---|
| Water Science | Environmental Science | Socioeconomics | Law | Political Science | |||||||||
| a | b | a | b | a | b | a | b | a | b | ||||
| Egypt | Africa | 10 | 2 | 2 | 2 | 2 | 2 | 2 | 2 | 2 | 2 | 0 | 8 |
| Ethiopia | Africa | 10 | 2 | 2 | 2 | 2 | 2 | 2 | 2 | 2 | 2 | 2 | 10 |
| Eq. states | Africa | 10 | 2 | 2 | 2 | 2 | 2 | 2 | 2 | 2 | 2 | 1 | 9 |
| Sudans | Africa | 10 | 2 | 2 | 2 | 2 | 2 | 2 | 2 | 2 | 2 | 1 | 9 |
| Belgium | Europe | 10 | 2 | 2 | 2 | 2 | 2 | 2 | 2 | 1 | 2 | 1 | 8 |
| England | Europe | 10 | 2 | 2 | 2 | 2 | 2 | 2 | 2 | 1 | 2 | 1 | 8 |
| Italy | Europe | 10 | 2 | 2 | 2 | 2 | 2 | 2 | 2 | 2 | 2 | 1 | 9 |
| Netherlands | Europe | 10 | 2 | 2 | 2 | 2 | 2 | 2 | 2 | 2 | 2 | 1 | 9 |
| China | Asia | 10 | 2 | 2 | 2 | 2 | 2 | 2 | 2 | 2 | 2 | 1 | 9 |
| Jordan | Asia | 10 | 2 | 2 | 2 | 2 | 2 | 2 | 2 | 1 | 2 | 1 | 8 |
| India | Asia | 10 | 2 | 2 | 2 | 2 | 2 | 2 | 2 | 1 | 2 | 1 | 8 |
| Iran | Asia | 10 | 2 | 2 | 2 | 2 | 2 | 2 | 2 | 2 | 2 | 1 | 9 |
| USA | N. America | 20 | 4 | 4 | 4 | 4 | 4 | 4 | 4 | 3 | 4 | 2 | 17 |
| Canada | N. America | 20 | 4 | 4 | 4 | 3 | 4 | 3 | 4 | 3 | 4 | 1 | 14 |
| Brazil | S. America | 20 | 4 | 4 | 4 | 4 | 4 | 3 | 4 | 2 | 4 | 1 | 14 |
| Argentina | S. America | 20 | 4 | 3 | 4 | 4 | 4 | 2 | 4 | 2 | 4 | 1 | 12 |
| Total | 200 | 40 | 39 | 40 | 39 | 40 | 36 | 40 | 30 | 40 | 17 | 161 | |
| Code | Relevant Factors | Sub-factors | Indicators | Relationship |
|---|---|---|---|---|
| F1 | Natural features | |||
| SF1 | Geography | Basin area in each country [km2] | Direct | |
| The whole area in each country [km2] | Direct | |||
| SF2 | Hydrography | River length in each country [km] | Direct | |
| SF3 | Climate conditions | Köppen Aridity Index in each country | Reverse | |
| Median Drought vulnerability index | Direct | |||
| Water-food-energy risk index or [Resilience Index] | Reverse | |||
| SF4 | Hydrology | Annual surface water contribution of each country [km3/year] | Direct | |
| Water stress index [%] in each country | Direct | |||
| SF5 | Ecology and Environment | 95%-time flow exceeded minimum environmental flow with moderate management class [Million m3/year] | Direct | |
| Total greenhouse gas emissions (kt of CO2 equivalent) in each country | Reverse | |||
| Environmental performance index in each country | Direct | |||
| F2 | Social and economic needs of the watercourse States | |||
| SF6 | Economic and trade Status | GDP per capita in each country [Current $] | Reverse | |
| Gross National income per capita in each country [$] | Reverse | |||
| Exports and imports trade (% of GDP) | Reverse | |||
| Income index | Reverse | |||
| SF7 | Work employment and vulnerability | Unemployment in the basin in each country [%] | Direct | |
| Vulnerable employment (% of total employment) | Direct | |||
| SF8 | Social and economic sustainability | Population with access to electricity [%] | Reverse | |
| Relative significance of hydropower in each Nile basin countries [%] | Direct | |||
| Population using basic drinking-water supply [%] | Reverse | |||
| People with access to clean cooking [%] | Reverse | |||
| Water supply and sanitation index | Reverse | |||
| Infrastructure development index | Reverse | |||
| SF9 | Human development | Human Development Index (HDI) in each country [%] | Reverse | |
| SF10 | Poverty status | Multidimensional Poverty index | Direct | |
| Population living below income poverty line [%] | Direct | |||
| Hunger Index | Direct | |||
| SF11 | Education status | Education index | Reverse | |
| SF12 | Health status | Life expectancy Index | Reverse | |
| SF13 | Gender status | Gender Development Index (GDI) in each country [%] | Reverse | |
| F3 | The population dependent on the watercourse in each watercourse state | |||
| SF14 | Existing dependency | Population in the nile basin countries [in millions] in 2019 | Direct | |
| Population living in the basin in each country [%] | Direct | |||
| Employment in agriculture (% of total employment) | Direct | |||
| Employment in marine and inland fisheries [No] | Direct | |||
| Agriculture, forestry, and fishing, value added (% of GDP) | Direct | |||
| SF15 | Future dependency | Population growth rate [%] | Direct | |
| F4 | The effects of the use or uses of the watercourses in one watercourse State on other watercourse states | |||
| SF16 | Effects on land degradation | Fertile soil loss by erosion or sediment yield per year [M tons/year] | Direct | |
| SF17 | Effects on water security | Average annual surface water volumetric reliability index [%] | Reverse | |
| SF18 | Effect on Environment and human being on downstream neighbors | Water quality index | Direct | |
| F5 | Existing and potential uses of the watercourse | |||
| SF19 | Existing uses | Gross Irrigation water demand in each basin countries [km3/yr] | Direct | |
| Existing domestic and industrial water demand in each basin countries [km3/year] | Direct | |||
| Energy Consumption per Capita (Kg of oil equivalent per capita) | Direct | |||
| Existing Hydropower production in the basin in each country [MW] | Direct | |||
| SF20 | Future Uses | Potential irrigation remaining area in each basin country [ha] | Direct | |
| Projected domestic water demand by 2050 in each basin countries [km3/year] | Direct | |||
| Remaining potential Hydropower production in the basin in each country [MW] | Direct | |||
| F6 | Conservation, protection, development and economy of uses and the costs of measures taken | |||
| SF21 | Environmental Protection and Conservation | Areas exposed for severe soil erosion in each country with a rate of (>80 kg/ha/yr) [km2] | Direct | |
| SF22 | Development and protection of water resources | Wetland area [km2] | Direct | |
| Cereal yield (kg per hectare) | Direct | |||
| Gross investment made on hydraulic structures or Dams [million USD] | Direct | |||
| Total agricultural export value (1000) | Reverse | |||
| SF23 | Economy of uses | Loss of water by evaporation from dams in each basin countries [BCM/year] | Reverse | |
| Water use efficiency [USD/m3] | Direct | |||
| F7 | The availability of alternatives, of comparable value | |||
| SF24 | Alternative sources | Alternative energy source from Solar (both PV and CSP) [TWh/year] | Reverse | |
| Alternative energy source from Wind [TWh/year] | Reverse | |||
| Alternative energy source from Geothermal [MW] | Reverse | |||
| Alternative energy source from oil [proved oil reserves in thousand million barrels] | Reverse | |||
| Alternative energy source from natural gas [proved reserves trillion cubic meters] | Reverse | |||
| Alternative energy source from generated waste via incineration method [GWh] | Reverse | |||
| Total Renewable ground water resource[km3/yr] | Reverse | |||
| SF25 | Alternative uses and methods | Average income from Tourism [Million US$] | Reverse | |
| Alternative source of food and income from Livestock resource | ||||
| Average fish and aquaculture production [ metric ton/yr] | Reverse | |||
| Industry value added (%GDP)- including construction industry | Reverse | |||
| Employment in service provision sector [% of total employment] | Reverse |
References
- Kasymov, S. Water Resource Disputes: Conflict and Cooperation in Drainage Basins. Int. J. World Peace 2011, 28, 81–110. [Google Scholar]
- Watkins, K. Human Development Report 2006—Beyond Scarcity: Power, Poverty and the Global Water Crisis; UNDP: New York, NY, USA, 2006. [Google Scholar]
- Haarstrick, A.; Bahadir, M. Water and Its Global Meaning. In Water and Wastewater Management: Global Problems and Measures; Bahadir, M., Haarstrick, A., Eds.; Springer International Publishing: Cham, Switzerland, 2022; pp. 3–14. [Google Scholar]
- Nandalal, K.D.W.; Simonovic, S.P. Resolving conflicts in water sharing: A systemic approach. Water Resour. Res. 2003, 39. [Google Scholar] [CrossRef]
- Wolf, A.T.; Dinar, A. Middle East hydropolitics and equity measures for water-sharing agreements. J. Soc. Political Econ. Stud. 1994, 19, 69. [Google Scholar]
- Chong, A. Silala River Case: The Equitable Utilization Right and the Issues of Water Commodification and Artificial Flows. Wyo. L. Rev. 2023, 23, 129–150. [Google Scholar] [CrossRef]
- Pacific Institute. Wate Conflict Chronology. 2022. Available online: http://www.worldwater.org/water-conflict/ (accessed on 20 January 2022).
- Gunasekara, N.K.; Kazama, S.; Yamazaki, D.; Oki, T. Water Conflict Risk due to Water Resource Availability and Unequal Distribution. Water Resour. Manag. 2014, 28, 169–184. [Google Scholar] [CrossRef]
- Giordano, M.; Drieschova, A.; Duncan, J.A.; Sayama, Y.; De Stefano, L.; Wolf, A.T. A review of the evolution and state of transboundary freshwater treaties. Int. Environ. Agreem. Politics Law Econ. 2014, 14, 245–264. [Google Scholar] [CrossRef]
- Abdalla, I.H. The 1959 Nile Waters Agreement in Sudanese-Egyptian relations. Middle East. Stud. 1971, 7, 329–341. [Google Scholar] [CrossRef]
- Nasr, H.; Neef, A. Ethiopia’s Challenge to Egyptian Hegemony in the Nile River Basin: The Case of the Grand Ethiopian Renaissance Dam. Geopolitics 2016, 21, 969–989. [Google Scholar] [CrossRef]
- Tekuya, M. The Egyptian hydro-hegemony in the Nile basin: The quest for changing the status quo. J. Water Law 2020, 26, 2. [Google Scholar]
- Mbaku, J.M. The controversy over the Grand Ethiopian Renaissance Dam. 2020. Available online: https://www.brookings.edu/blog/africa-in-focus/2020/08/05/the-controversy-over-the-grand-ethiopian-renaissance-dam/ (accessed on 30 November 2020).
- Jeuland, M.; Whittington, D. Water resources planning under climate change: Assessing the robustness of real options for the Blue Nile. Water Resour. Res. 2014, 50, 2086–2107. [Google Scholar] [CrossRef]
- Digna, R.F.; Castro-Gama, M.E.; Van der Zaag, P.; Mohamed, Y.A.; Corzo, G.; Uhlenbrook, S. Optimal Operation of the Eastern Nile System Using Genetic Algorithm, and Benefits Distribution of Water Resources Development. Water 2018, 10, 921. [Google Scholar] [CrossRef]
- Mulat, A.G.; Moges, S.A.; Ibrahim, Y. Impact and Benefit Study of Grand Ethiopian Renaissance Dam (GERD) during Impounding and Operation Phases on Downstream Structures in the Eastern Nile. In Nile River Basin: Ecohydrological Challenges, Climate Change and Hydropolitics; Melesse, A.M., Abtew, W., Setegn, S.G., Eds.; Springer International Publishing: Cham, Switzerland, 2014; pp. 543–564. [Google Scholar]
- Onencan, A.M.; Van de Walle, B. Equitable and reasonable utilization: Reconstructing the Nile basin water allocation dialogue. Water 2018, 10, 707. [Google Scholar] [CrossRef]
- Wehling, P. Implementing the Principle of Equitable and Reasonable Utilization in the Nile Basin. In Nile Water Rights: An International Law Perspective; Springer: Berlin/Heidelberg, Germany, 2020; pp. 219–259. [Google Scholar]
- Gari, Y.; Block, P.; Assefa, G.; Mekonnen, M.; Tilahun, S.A. Quantifying the United Nations’ Watercourse Convention Indicators to Inform Equitable Transboundary River Sharing: Application to the Nile River Basin. Water 2020, 12, 2499. [Google Scholar] [CrossRef]
- Forty-Sixth Session on Draft Articles on the Law of the Non-Navigational Uses of International Watercourses; ILA UN Doc A/49/10; International Law Commission: Geneva, Switzerland, 1994.
- Rieu-Clarke, A.; Moynihan, R.; Magsig, B.-O. UN Watercourses Convention User’s Guide; IHP-HELP Centre for Water Law, Policy and Science (under the auspices of UNESCO): Dundee, UK, 2012; p. 274. [Google Scholar]
- Payne, C.R. Pulp Mills on the River Uruguay (Argentina v. Uruguay). Am. J. Int. Law 2011, 105, 94–101. [Google Scholar] [CrossRef]
- NBI. The Nile Basin Water Resource Atlas; Nile Basin Intiative: Entebbe, Uganda, 2016. [Google Scholar]
- Sutcliffe, J.V.; Parks, Y.P. The Hydrology of the Nile; International Association of Hydrological Sciences: Wallingford, UK, 1999. [Google Scholar]
- Galal, S. Total Hydropower Energy Capacity in Egypt 2012–2022 [Graph]. Statista2022. Available online: https://www.statista.com/statistics/1215510/egypt-total-hydropower-energy-capacity (accessed on 2 December 2022).
- World Bank. Arab Republic of Egypt-Integrated Irrigation Improvement and Management Project and Farm-Level Irrigation Modernization Project: Project Performance Assessment Report. World Bank2022. Available online: https://documents1.worldbank.org/curated/en/099312308182234337/pdf/IDU038134c250e1d904f280abbc0c6368540a0a6.pdf (accessed on 1 December 2023).
- Staff, E.T. Egypt exports 4.8 M tons of agricultural products in 2020. In Egypt Today; Egypt Today: Cairo, Egypt, 2020; Volume 2021. [Google Scholar]
- Avarideh, F.; Attari, J.; Moridi, A. Modelling equitable and reasonable water sharing in transboundary rivers: The case of Sirwan-Diyala river. Water Resour. Manag. 2017, 31, 1191–1207. [Google Scholar] [CrossRef]
- Mimi, Z.A.; Sawalhi, B.I. A decision tool for allocating the waters of the Jordan River Basin between all riparian parties. Water Resour. Manag. 2003, 17, 447–461. [Google Scholar] [CrossRef]
- Bryson, N.; Mobolurin, A.; Ngwenyama, O. Modelling pairwise comparisons on ratio scales. Eur. J. Oper. Res. 1995, 83, 639–654. [Google Scholar] [CrossRef]
- Peng, G.; Han, L.; Liu, Z.; Guo, Y.; Yan, J.; Jia, X. An application of fuzzy analytic hierarchy process in risk evaluation model. Front. Psychol. 2021, 12, 715. [Google Scholar] [CrossRef]
- Yihdego, Z.; Rieu-Clarke, A. An exploration of fairness in international law through the Blue Nile and GERD. Water Int. 2016, 41, 528–549. [Google Scholar] [CrossRef]
- DoP. Agreement on Declaration of Principles between the Arab Republic of Egypt, the Federal Democratic Republic of Ethiopia and the Republic of the Sudan on the Grand Ethiopian Renaissance Dam Project, Signed at Khartoum, Sudan. 2015. Available online: http://www.hornaffairs.com/en/2015/03/25/egypt-ethiopia-sudan-agreement-ondeclaration-of-principles-full-text (accessed on 21 September 2019).
- NBI. Technical Note III: Baseline and Projected Future Water Demand and Use; Nile Basin Initiative Entebe: Entebbe, Uganda, 2017; Volume III. [Google Scholar]
- Dile, Y.T.; Berndtsson, R.; Setegn, S.G. Hydrological response to climate change for gilgel abay river, in the lake tana basin-upper blue Nile basin of Ethiopia. PLoS ONE 2013, 8, e79296. [Google Scholar] [CrossRef]
- Gebrehiwot, S.G.; Ellison, D.; Bewket, W.; Seleshi, Y.; Inogwabini, B.-I.; Bishop, K. The Nile Basin waters and the West African rainforest: Rethinking the boundaries. Wiley Interdiscip. Rev. Water 2019, 6, e1317. [Google Scholar] [CrossRef]
- Fisseha, G.; Gebrekidan, H.; Kibret, K.; Yitaferu, B.; Bedadi, B. Analysis of land use/land cover changes in the Debre-Mewi watershed at the upper catchment of the Blue Nile Basin, North West Ethiopia. J. Biodivers. Environ. Sci 2011, 1, 184–198. [Google Scholar]
- Musa, N.G. Potential Combaction of Deforestation through Adoption of Some Energy Substitutes, Case of White Nile State. Ph.D. Thesis, University of Khartoum, Khartoum, Sudan, 2007. [Google Scholar]
- Abebaw, W.A. Review on impacts of land degradation on agricultural production in ethiopia. J. Resour. Dev. Manag. 2019, 57, 21–29. [Google Scholar] [CrossRef]
- Amsalu, A.; de Graaff, J. Farmers’ Views of Soil Erosion Problems and Their Conservation Knowledge at Beressa Watershed, Central Highlands of Ethiopia. Agric. Hum. Values 2006, 23, 99–108. [Google Scholar] [CrossRef]
- Gebreselassie, S.; Kirui, O.K.; Mirzabaev, A. Economics of Land Degradation and Improvement in Ethiopia. In Economics of Land Degradation and Improvement—A Global Assessment for Sustainable Development; Nkonya, E., Mirzabaev, A., von Braun, J., Eds.; Springer International Publishing: Cham, Switerland, 2016; pp. 401–430. [Google Scholar]
- Kassa, H.; Dondeyne, S.; Poesen, J.; Frankl, A.; Nyssen, J. Impact of deforestation on soil fertility, soil carbon and nitrogen stocks: The case of the Gacheb catchment in the White Nile Basin, Ethiopia. Agric. Ecosyst. Environ. 2017, 247, 273–282. [Google Scholar] [CrossRef]
- Yasir, S.A.; Crosato, A.; Mohamed, Y.A.; Abdalla, S.H.; Wright, N.G. Sediment Balances in the Blue Nile River Basin. Int. J. Sediment Res. 2014, 29, 316–328. [Google Scholar]
- UN DESA. World Population Prospects 2019. In Department of Economic and Social Affairs. World Population Prospects 2019; United Nations: New York, NY, USA, 2019. [Google Scholar]
- Sadoff, C.W.; Grey, D. Beyond the river: The benefits of cooperation on international rivers. Water Policy 2002, 4, 389–403. [Google Scholar] [CrossRef]
- Tran, T.A.; Suhardiman, D. Laos’ hydropower development and cross-border power trade in the Lower Mekong Basin: A discourse analysis. Asia Pac. Viewp. 2020, 61, 219–235. [Google Scholar] [CrossRef]
- Dellapenna, J. The Nile as a legal and political structure. The Scarcity of Water: Emerging Legal and Policy Responses. 1997, pp. 121–134. Available online: https://www.researchgate.net/profile/Joseph-Dellapenna/publication/288014044_'The_Nile_as_a_legal_and_political_structure'/links/574acdf408ae2e0dd3019291/The-Nile-as-a-legal-and-political-structure.pdf (accessed on 13 June 2019).
- Salman, S.M.A. Downstream riparians can also harm upstream riparians: The concept of foreclosure of future uses. Water Int. 2010, 35, 350–364. [Google Scholar] [CrossRef]
- FAO. Aquastat Online Database. Available online: https://www.fao.org/aquastat/en/ (accessed on 14 September 2021).
- Wendling, Z.; Emerson, J.; de Sherbinin, A.; Esty, D. Environmental Performance Index 2020; Yale Center for Environmental Law & Policy: New Haven, CT, USA, 2020. [Google Scholar]
- Srebotnjak, T.; Carr, G.; de Sherbinin, A.; Rickwood, C. A global Water Quality Index and Hot-Deck Imputation of Missing Data. Ecol. Indic. 2012, 17, 108–119. [Google Scholar] [CrossRef]
- Klaus, G.V, Bernstein, J, Patterson, F, Wiemers M, Chéilleachair R, Foley C, Gitter S, Ekstrom K, and Fritschel H Global Hunger Index: The Challange of Hunger and Climate Change. Global Hunger Index, Dublin/Bonn 2019. Available online: https://www.globalhungerindex.org/results.html (accessed on 10 May 2019).
- NBI. Comprehensive Basin Wide Study of Power Development Options and Trade Opportunities (CBWS); RSW International Inc.: Dar es Salaam, Tanzania, 2011. [Google Scholar]
- De Graaf, G.; Garibaldi, L. The value of African fisheries. In FAO Fisheries and Aquaculture Circular; FAO: Rome, Italy, 2015; no. C1093; p. I. [Google Scholar]
- Barange, M. Fishery and aquaculture statistics. In FAO Yearbook. Fishery and Aquaculture Statistics= FAO Annuaire. Statistiques des Peches et de l’Aquaculture= FAO Anuario. Estadisticas de Pesca y Acuicultura; FAO: Rome, Italy, 2018; p. I-82. [Google Scholar]
- Kiringu, K.; Basson, G. Sediment yield analysis of the Baro-Akobo-Sobat Sub-basin in Ethiopia. In Proceedings of the Sedimentation and Hydrologic Modeling SEDHYD 2019, Reno, NV, USA, 24–28 June 2019. [Google Scholar]
- Frenken, K.; Gillet, V. Aquastat. In Irrigation Water Requirement and Water Withdrawal by Country; FAO: Rome, Italy, 2012. [Google Scholar]
- Borrelli, P.; Robinson, D.A.; Fleischer, L.R.; Lugato, E.; Ballabio, C.; Alewell, C.; Meusburger, K.; Modugno, S.; Schütt, B.; Ferro, V.; et al. An Assessment of the Global Impact of 21st Century Land Use Change on Soil Erosion. Available online: https://esdac.jrc.ec.europa.eu/content/global-soil-erosion (accessed on 20 September 2021).
- Hermann, S.; Miketa, A.; Fichaux, N. Estimating the Renewable Energy Potential in Africa; IRENA-KTH Working Paper; International Renewable Energy Agency: Abu Dhabi, United Arab Emirates, 2014. [Google Scholar]
- Kebede, S. Geothermal exploration and development in Ethiopia: Country update. Short Course IX Explor. Geotherm. Resour. 2014, 15, 8. [Google Scholar]
- British Petroleum. Statistical Review of World Energy 2019. Br. Pet2019, Volume 66. Available online: https://www.bp.com/en/global/corporate/energy-economics/statistical-review-of-world-energy/downloads.html (accessed on 27 October 2021).
- Mwangomo, E.A. Potential of Waste to Energy in African Urban Areas. Adv. Recycl. Waste Manag. 2018, 3, 162–173. [Google Scholar] [CrossRef]
- Scarlat, N.; Motola, V.; Dallemand, J.F.; Monforti-Ferrario, F.; Mofor, L. Evaluation of Energy Potential of Municipal Solid Waste from African Urban Areas. Renew. Sustain. Energy Rev. 2015, 50, 1269–1286. [Google Scholar] [CrossRef]
- OSS and UNESCO. Water Resources in the OSS Countries Evaluation, Use and Management. OSS and UNESCOSC.95/WS/24. 1995. Available online: https://unesdoc.unesco.org/ark:/48223/pf0000111736 (accessed on 10 August 2020).


| Ranking | |||||||
|---|---|---|---|---|---|---|---|
| Experts | 1 | 2 | 3 | 4 | 5 | 6 | 7 |
| Water resources | F1 | F5 | F4 | F2 | F3 | F6 | F7 |
| Environmental science | F1 | F5 | F4 | F2 | F6 | F3 | F7 |
| Socio-economics | F4 | F2 | F1 | F3 | F5 | F6 | F7 |
| Law | F4 | F2 | F1 | F3 | F5 | F7 | F6 |
| Political science | F4 | F1 | F2 | F3 | F5 | F6 | F7 |
| Level I Factors | Level II Subfactors | FAHP | Equal Weighting , | Seq. Ranking |
|---|---|---|---|---|
| F1 | 24.9 | 14.3 | 3.57–25 | |
| SF1 | 8.7 | 20 | ||
| SF2 | 5.6 | 20 | ||
| SF3 | 30.8 | 20 | ||
| SF4 | 30.8 | 20 | ||
| SF5 | 24 | 20 | ||
| F2 | 15.6 | 14.3 | 3.57–25 | |
| SF6 | 15.2 | 12.5 | ||
| SF7 | 8.1 | 12.5 | ||
| SF8 | 24.9 | 12.5 | ||
| SF9 | 7.2 | 12.5 | ||
| SF10 | 16.6 | 12.5 | ||
| SF11 | 8.3 | 12.5 | ||
| SF12 | 15.7 | 12.5 | ||
| SF13 | 4.1 | 12.5 | ||
| F3 | 11.2 | 14.3 | 3.57–25 | |
| SF14 | 50 | 50 | ||
| SF15 | 50 | 50 | ||
| F4 | 25.6 | 14.4 | 3.57–25 | |
| SF16 | 35 | 33.3 | ||
| SF17 | 47.8 | 33.3 | ||
| SF18 | 17.2 | 33.3 | ||
| F5 | 10.6 | 14.3 | 3.57–25 | |
| SF19 | 50 | 50 | ||
| SF20 | 50 | 50 | ||
| F6 | 8.2 | 14.3 | 3.57–25 | |
| SF21 | 33.7 | 33.3 | ||
| SF22 | 49.8 | 33.3 | ||
| SF23 | 16.5 | 33.3 | ||
| F7 | 3.9 | 14.3 | 3.57–25 | |
| SF24 | 50 | 50 | ||
| SF25 | 50 | 50 |
| Weighting Type Factor-Subfactor-Indicator | # of Scenarios | Apportionment Blue Nile | Apportionment Tekeze-Atbara | ||||
|---|---|---|---|---|---|---|---|
| Ethiopia | Sudan | Egypt | Ethiopia | Sudan | Egypt | ||
| FAHP-FAHP-Eq.W. | 1 | 43.5 | 26.3 | 30.2 | 41.8 | 27.5 | 30.7 |
| FAHP-Eq. W-Eq.W. | 1 | 41.5 | 29.1 | 29.4 | 39.6 | 29.9 | 30.5 |
| Seq. rank.-Eq.W.-Eq.W. | 42 | 38.7–43.7 | 26.4–32.3 | 26.4–33.3 | 35.3–42.2 | 28.7–33.1 | 26.5–34.0 |
| Seq. rank.-FAHP-Eq.W. | 42 | 39.8–45.1 | 23.9–29.7 | 26.3–34.7 | 36.6–43.8 | 26.0–30.5 | 26.5–35.3 |
| Eq.W.-FAHP-Eq.W. | 1 | 42.9 | 27.1 | 30 | 41.1 | 28.4 | 30.5 |
| Eq.W.-Eq.W-Eq.W. | 1 | 41.3 | 29.5 | 29.2 | 39.5 | 30.8 | 29.7 |
| Weighting type Factor-Subfactor-Indicator | # of Scenarios | Apportionment Baro-Sobat | Apportionment White Nile | ||||
| Ethiopia | Both Sudans | Egypt | Equa. States | Both Sudans | Egypt | ||
| FAHP-FAHP-Eq.W. | 1 | 42.5 | 26.4 | 31.2 | 37.2 | 32.2 | 30.6 |
| FAHP-Eq. W-Eq.W. | 1 | 40.2 | 28.4 | 31.4 | 36.2 | 34.7 | 29.0 |
| Seq. rank.-Eq.W.- Eq.W. | 42 | 37.4–43.3 | 26.3–31.9 | 27.8–34.4 | 35.4–41.6 | 30.5–34.4 | 25.3–32.2 |
| Seq. rank.-FAHP-Eq.W. | 42 | 38.4–44.3 | 24.6–30.2 | 27.3–35.5 | 35.2–42.2 | 28.3–32.6 | 25.5–34.5 |
| Eq.W.-FAHP-Eq.W. | 1 | 41.8 | 27.0 | 31.2 | 39.8 | 30.4 | 29.8 |
| Eq.W.-Eq.W-Eq.W. | 1 | 40.5 | 28.7 | 30.8 | 39.1 | 32.3 | 28.4 |
Disclaimer/Publisher’s Note: The statements, opinions and data contained in all publications are solely those of the individual author(s) and contributor(s) and not of MDPI and/or the editor(s). MDPI and/or the editor(s) disclaim responsibility for any injury to people or property resulting from any ideas, methods, instructions or products referred to in the content. |
© 2023 by the authors. Licensee MDPI, Basel, Switzerland. This article is an open access article distributed under the terms and conditions of the Creative Commons Attribution (CC BY) license (https://creativecommons.org/licenses/by/4.0/).
Share and Cite
Gari, Y.; Block, P.; Steenhuis, T.S.; Mekonnen, M.; Assefa, G.; Ephrem, A.K.; Bayissa, Y.; Tilahun, S.A. Developing an Approach for Equitable and Reasonable Utilization of International Rivers: The Nile River. Water 2023, 15, 4312. https://doi.org/10.3390/w15244312
Gari Y, Block P, Steenhuis TS, Mekonnen M, Assefa G, Ephrem AK, Bayissa Y, Tilahun SA. Developing an Approach for Equitable and Reasonable Utilization of International Rivers: The Nile River. Water. 2023; 15(24):4312. https://doi.org/10.3390/w15244312
Chicago/Turabian StyleGari, Yared, Paul Block, Tammo S. Steenhuis, Muluneh Mekonnen, Getachew Assefa, Abebe Kidus Ephrem, Yared Bayissa, and Seifu A. Tilahun. 2023. "Developing an Approach for Equitable and Reasonable Utilization of International Rivers: The Nile River" Water 15, no. 24: 4312. https://doi.org/10.3390/w15244312