
Transport of Oxygen-Doped Graphitic Carbon Nitride in Saturated Sand: Effects of Concentration, Grain Size, and Ionic Strength

Abstract
: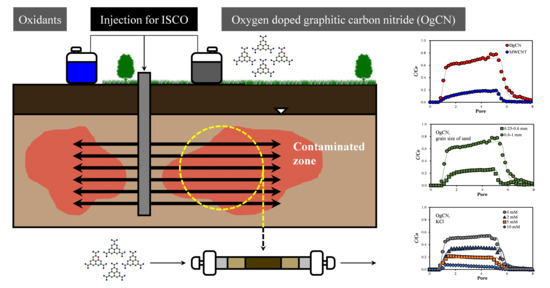
1. Introduction
2. Materials and Methods
2.1. Materials
2.2. Characterization
2.3. Column Experiments
2.4. Modeling
3. Results and Discussion
3.1. Comparisons of OgCN and MWCNT
3.1.1. Transport
3.1.2. Characteristics
3.2. Transport of OgCN under Various Conditions
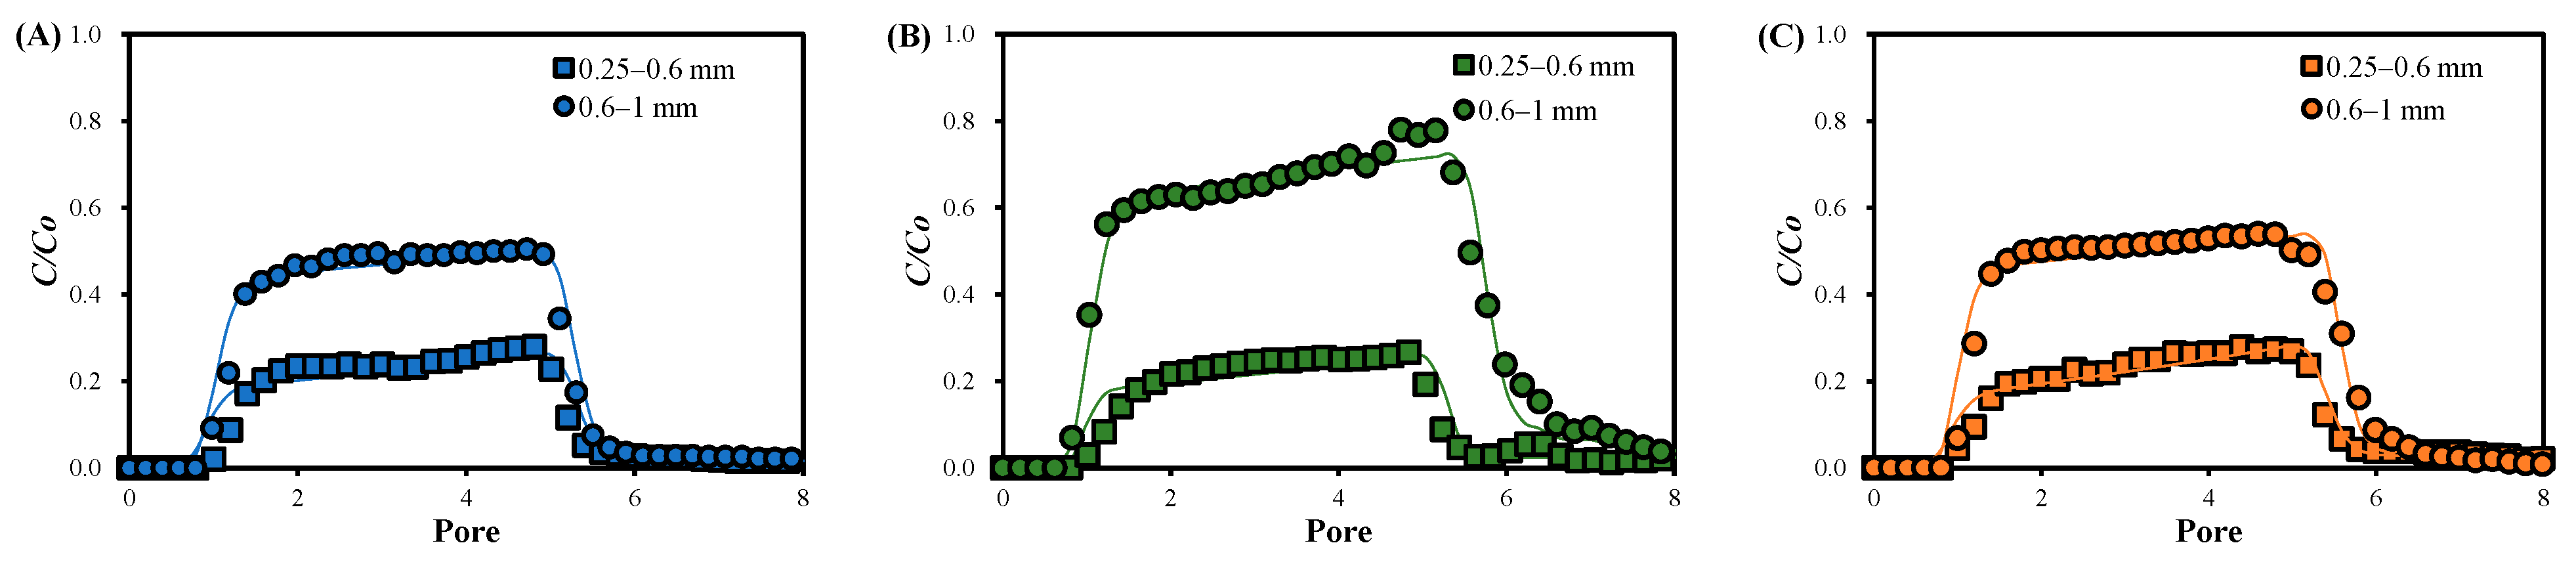
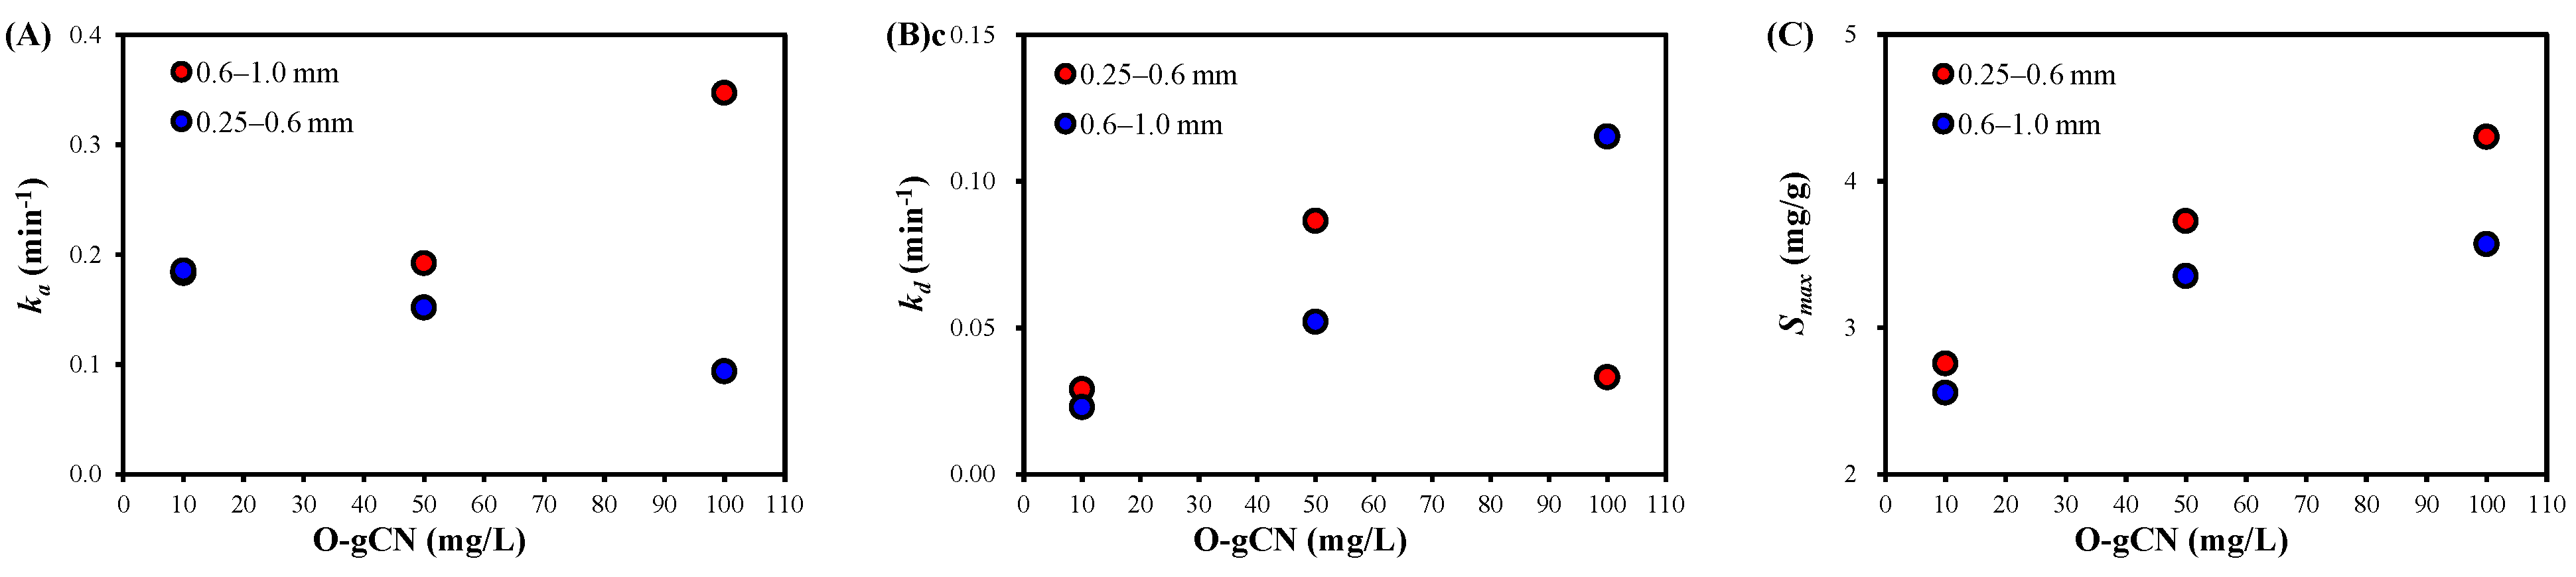
3.2.1. Effects of OgCN Concentration and the Grain Size of the Medium
3.2.2. Effect of Ionic Strength
4. Conclusions
Author Contributions
Funding
Data Availability Statement
Conflicts of Interest
References
- Yan, H.; Lai, C.; Wang, D.; Liu, S.; Li, X.; Zhou, X.; Yi, H.; Li, B.; Zhang, M.; Li, L. In Situ Chemical Oxidation: Peroxide or Persulfate Coupled with Membrane Technology for Wastewater Treatment. J. Mater. Chem. A Mater. 2021, 9, 11944–11960. [Google Scholar] [CrossRef]
- Calenciuc, C.; Fdez-Sanromán, A.; Lama, G.; Annamalai, S.; Sanromán, A.; Pazos, M. Recent Developments in Advanced Oxidation Processes for Organics-Polluted Soil Reclamation. Catalysts 2022, 12, 64. [Google Scholar] [CrossRef]
- Devi, P.; Das, U.; Dalai, A.K. In-Situ Chemical Oxidation: Principle and Applications of Peroxide and Persulfate Treatments in Wastewater Systems. Sci. Total Environ. 2016, 571, 643–657. [Google Scholar] [CrossRef] [PubMed]
- Matthaiou, V.; Oulego, P.; Frontistis, Z.; Collado, S.; Hela, D.; Konstantinou, I.K.; Diaz, M.; Mantzavinos, D. Valorization of Steel Slag towards a Fenton-like Catalyst for the Degradation of Paraben by Activated Persulfate. Chem. Eng. J. 2019, 360, 728–739. [Google Scholar] [CrossRef]
- Arellano, M.; Sanroman, M.A.; Pazos, M. Electro-Assisted Activation of Peroxymonosulfate by Iron-Based Minerals for the Degradation of 1-Butyl-1-Methylpyrrolidinium Chloride. Sep. Purif. Technol. 2019, 208, 34–41. [Google Scholar] [CrossRef]
- Xiao, S.; Cheng, M.; Zhong, H.; Liu, Z.; Liu, Y.; Yang, X.; Liang, Q. Iron-Mediated Activation of Persulfate and Peroxymonosulfate in Both Homogeneous and Heterogeneous Ways: A Review. Chem. Eng. J. 2020, 384, 123265. [Google Scholar] [CrossRef]
- Wang, J.; Wang, S. Activation of Persulfate (PS) and Peroxymonosulfate (PMS) and Application for the Degradation of Emerging Contaminants. Chem. Eng. J. 2018, 334, 1502–1517. [Google Scholar] [CrossRef]
- Li, L.; Huang, J.; Hu, X.; Zhang, S.; Dai, Q.; Chai, H.; Gu, L. Activation of Sodium Percarbonate by Vanadium for the Degradation of Aniline in Water: Mechanism and Identification of Reactive Species. Chemosphere 2019, 215, 647–656. [Google Scholar] [CrossRef]
- Ribeiro, A.R.; Nunes, O.C.; Pereira, M.F.R.; Silva, A.M.T. An Overview on the Advanced Oxidation Processes Applied for the Treatment of Water Pollutants Defined in the Recently Launched Directive 2013/39/EU. Environ. Int. 2015, 75, 33–51. [Google Scholar] [CrossRef]
- Thomas, N.; Dionysiou, D.D.; Pillai, S.C. Heterogeneous Fenton Catalysts: A Review of Recent Advances. J. Hazard. Mater. 2021, 404, 124082. [Google Scholar] [CrossRef]
- Chatterjee, R.; Bhanja, P.; Bhaumik, A. The Design and Synthesis of Heterogeneous Catalysts for Environmental Applications. Dalton Trans. 2021, 50, 4765–4771. [Google Scholar] [CrossRef] [PubMed]
- Zhao, Q.; Mao, Q.; Zhou, Y.; Wei, J.; Liu, X.; Yang, J.; Luo, L.; Zhang, J.; Chen, H.; Chen, H. Metal-Free Carbon Materials-Catalyzed Sulfate Radical-Based Advanced Oxidation Processes: A Review on Heterogeneous Catalysts and Applications. Chemosphere 2017, 189, 224–238. [Google Scholar] [CrossRef] [PubMed]
- Oyekunle, D.T.; Zhou, X.; Shahzad, A.; Chen, Z. Review on Carbonaceous Materials as Persulfate Activators: Structure–Performance Relationship, Mechanism and Future Perspectives on Water Treatment. J. Mater. Chem. A Mater. 2021, 9, 8012–8050. [Google Scholar] [CrossRef]
- Zhu, K.; Shen, Y.; Hou, J.; Gao, J.; He, D.; Huang, J.; He, H.; Lei, L.; Chen, W. One-Step Synthesis of Nitrogen and Sulfur Co-Doped Mesoporous Graphite-like Carbon Nanosheets as a Bifunctional Material for Tetracycline Removal via Adsorption and Catalytic Degradation Processes: Performance and Mechanism. Chem. Eng. J. 2021, 412, 128521. [Google Scholar] [CrossRef]
- Zhang, P.; Tan, X.; Liu, S.; Liu, Y.; Zeng, G.; Ye, S.; Yin, Z.; Hu, X.; Liu, N. Catalytic Degradation of Estrogen by Persulfate Activated with Iron-Doped Graphitic Biochar: Process Variables Effects and Matrix Effects. Chem. Eng. J. 2019, 378, 122141. [Google Scholar] [CrossRef]
- Lin, K.-Y.A.; Zhang, Z.-Y.; Wi-Afedzi, T. Sulfur-Doped Carbon Nitride as a Non-Metal Heterogeneous Catalyst for Sulfate Radical-Based Advanced Oxidation Processes in the Absence of Light Irradiation. J. Water Proc. Eng. 2018, 24, 83–89. [Google Scholar] [CrossRef]
- Kohantorabi, M.; Moussavi, G.; Giannakis, S. A Review of the Innovations in Metal-and Carbon-Based Catalysts Explored for Heterogeneous Peroxymonosulfate (PMS) Activation, with Focus on Radical vs. Non-Radical Degradation Pathways of Organic Contaminants. Chem. Eng. J. 2021, 411, 127957. [Google Scholar] [CrossRef]
- Gao, Y.; Zhu, Y.; Lyu, L.; Zeng, Q.; Xing, X.; Hu, C. Electronic Structure Modulation of Graphitic Carbon Nitride by Oxygen Doping for Enhanced Catalytic Degradation of Organic Pollutants through Peroxymonosulfate Activation. Environ. Sci. Technol. 2018, 52, 14371–14380. [Google Scholar] [CrossRef]
- Nguyen, T.T.; Kim, D.G.; Ko, S.O. Changes in the Catalytic Activity of Oxygen-Doped Graphitic Carbon Nitride for the Repeated Degradation of Oxytetracycline. Chemosphere 2022, 307, 135870. [Google Scholar] [CrossRef]
- Tang, R.; Ding, R.; Xie, X. Preparation of Oxygen-Doped Graphitic Carbon Nitride and Its Visible-Light Photocatalytic Performance on Bisphenol A Degradation. Water Sci. Technol. 2018, 78, 1023–1033. [Google Scholar] [CrossRef]
- Qiu, P.; Xu, C.; Chen, H.; Jiang, F.; Wang, X.; Lu, R.; Zhang, X. One Step Synthesis of Oxygen Doped Porous Graphitic Carbon Nitride with Remarkable Improvement of Photo-Oxidation Activity: Role of Oxygen on Visible Light Photocatalytic Activity. Appl. Catal. B 2017, 206, 319–327. [Google Scholar] [CrossRef]
- O’Carroll, D.M.; Liu, X.; Mattison, N.T.; Petersen, E.J. Impact of Diameter on Carbon Nanotube Transport in Sand. J. Colloid Interf. Sci. 2013, 390, 96–104. [Google Scholar] [CrossRef] [PubMed]
- Wang, J.; Zhang, L.; Long, F.; Wang, W.; Gu, Y.; Mo, S.; Zou, Z.; Fu, Z. Solvent-Free Catalytic Synthesis and Optical Properties of Super-Hard Phase Ultrafine Carbon Nitride Nanowires with Abundant Surface Active Sites. RSC Adv. 2016, 6, 23272–23278. [Google Scholar] [CrossRef]
- Šimůnek, J.; Van Genuchten, M.T.; Šejna, M. The HYDRUS Software Package for Simulating Two-and Three-Dimensional Movement of Water, Heat, and Multiple Solutes in Variably-Saturated Media. Tech. Man. Version 2006, 1, 241. [Google Scholar]
- Fan, W.; Jiang, X.; Lu, Y.; Huo, M.; Lin, S.; Geng, Z. Effects of Surfactants on Graphene Oxide Nanoparticles Transport in Saturated Porous Media. J. Environ. Sci. 2015, 35, 12–19. [Google Scholar] [CrossRef]
- Zhou, X.-L.; Liu, Z.-M.; Kiss, J.; Sloan, D.W.; White, J.M. Surface Chemistry of Chloroiodomethane, Coadsorbed with H and O, on Pt(111). J. Am. Chem. Soc. 1995, 117, 3565–3592. [Google Scholar] [CrossRef]
- Smith, M.; Scudiero, L.; Espinal, J.; McEwen, J.-S.; Garcia-Perez, M. Improving the deconvolution and interpretation of XPS spectra from chars by ab initio calculations. Carbon 2016, 110, 155–171. [Google Scholar] [CrossRef]
- Meng, Y.; Li, Z.; Tan, J.; Li, J.; Wu, J.; Zhang, T.; Wang, X. Oxygen-Doped Porous Graphitic Carbon Nitride in Photocatalytic Peroxymonosulfate Activation for Enhanced Carbamazepine Removal: Performance, Influence Factors and Mechanisms. Chem. Eng. J. 2022, 429, 130860. [Google Scholar] [CrossRef]
- Song, X.; Li, X.; Zhang, X.; Wu, Y.; Ma, C.; Huo, P.; Yan, Y. Fabricating C and O Co-Doped Carbon Nitride with Intramolecular Donor-Acceptor Systems for Efficient Photoreduction of CO2 to CO. Appl. Catal. B 2020, 268, 118736. [Google Scholar] [CrossRef]
- Majdoub, M.; Anfar, Z.; Amedlous, A. Emerging Chemical Functionalization of G-C3N4: Covalent/Noncovalent Modifications and Applications. ACS Nano 2020, 14, 12390–12469. [Google Scholar] [CrossRef]
- Çelik, A.; Özer, H.Ö.; Tüzemen, Ş.M.; Yıldız, M.; Kovacı, H. Synthesis, characterization and tribological properties of solid lubricant graphite films produced by PECVD. Mater. Today Comm. 2023, 36, 106506. [Google Scholar] [CrossRef]
- Jaworski, S.; Wierzbicki, M.; Sawosz, E.; Jung, A.; Gielerak, G.; Biernat, J.; Jaremek, H.; Łojkowski, W.; Woźniak, B.; Wojnarowicz, J. Graphene Oxide-Based Nanocomposites Decorated with Silver Nanoparticles as an Antibacterial Agent. Nanoscale Res. Lett. 2018, 13, 116. [Google Scholar] [CrossRef] [PubMed]
- Sadezky, A.; Muckenhuber, H.; Grothe, H.; Niessner, R.; Pöschl, U. Raman Microspectroscopy of Soot and Related Carbonaceous Materials: Spectral Analysis and Structural Information. Carbon NY 2005, 43, 1731–1742. [Google Scholar] [CrossRef]
- Kim, Y.; Choi, K.; Jung, J.; Park, S.; Kim, P.-G.; Park, J. Aquatic toxicity of acetaminophen, carbamazepine, cimetidine, diltiazem and six major sulfonamides, and their potential ecological risks in Korea. Environ. Int. 2007, 33, 370–375. [Google Scholar] [CrossRef] [PubMed]
- Kasel, D.; Bradford, S.A.; Šimůnek, J.; Heggen, M.; Vereecken, H.; Klumpp, E. Transport and Retention of Multi-Walled Carbon Nanotubes in Saturated Porous Media: Effects of Input Concentration and Grain Size. Water Res. 2013, 47, 933–944. [Google Scholar] [CrossRef] [PubMed]
- Tian, Y.; Gao, B.; Morales, V.L.; Wang, Y.; Wu, L. Effect of Surface Modification on Single-Walled Carbon Nanotube Retention and Transport in Saturated and Unsaturated Porous Media. J. Hazard. Mater. 2012, 239, 333–339. [Google Scholar] [CrossRef] [PubMed]
- Hashemi, A.; Nguyen, C.; Loi, G.; Khazali, N.; Yang, Y.; Dang-Le, B.; Russell, T.; Bedrikovetsky, P. Colloidal Detachment in Porous Media: Stochastic Model and Upscaling. Chem. Eng. J. 2023, 474, 145436. [Google Scholar] [CrossRef]
- Bradford, S.A.; Simunek, J.; Bettahar, M.; Van Genuchten, M.T.; Yates, S.R. Modeling Colloid Attachment, Straining, and Exclusion in Saturated Porous Media. Environ. Sci. Technol. 2003, 37, 2242–2250. [Google Scholar] [CrossRef]
- Park, C.M.; Chu, K.H.; Heo, J.; Her, N.; Jang, M.; Son, A.; Yoon, Y. Environmental Behavior of Engineered Nanomaterials in Porous Media: A Review. J. Hazard. Mater. 2016, 309, 133–150. [Google Scholar] [CrossRef]
- Sumanasekera, G.U.; Chen, G.; Takai, K.; Joly, J.; Kobayashi, N.; Enoki, T.; Eklund, P.C. Charge Transfer and Weak Chemisorption of Oxygen Molecules in Nanoporous Carbon Consisting of a Disordered Network of Nanographene Sheets. J. Phys. Condens. Matter 2010, 22, 334208. [Google Scholar] [CrossRef]
- Zhang, M.; Bradford, S.A.; Klumpp, E.; Šimůnek, J.; Wang, S.; Wan, Q.; Jin, C.; Qiu, R. Significance of Non-DLVO Interactions on the Co-Transport of Functionalized Multiwalled Carbon Nanotubes and Soil Nanoparticles in Porous Media. Environ. Sci. Technol. 2022, 56, 10668–10680. [Google Scholar] [CrossRef] [PubMed]
- Jiang, Y.; Guan, D.; Liu, Y.; Yin, X.; Zhou, S.; Zhang, G.; Wang, N.; Sun, H. The Transport of Graphitic Carbon Nitride in Saturated Porous Media: Effect of Hydrodynamic and Solution Chemistry. Chemosphere 2020, 248, 125973. [Google Scholar] [CrossRef] [PubMed]


| C1s | O1s | N1s | ||||||||||||
|---|---|---|---|---|---|---|---|---|---|---|---|---|---|---|
| C–C/ C=C | C–C, sp2 | C–C sp3 | C–O | C=O | N–C–N | Π–Π* Shake-up Satellite | C=O | C–O | O–C=O | C–N=C | C3–N | C2–N–H | ||
| OgCN | Position (eV) | 284.2 | 285.9 | 287.2 | 287.8 | 531.4 | 533.0 | 397.8 | 399.4 | 400.5 | ||||
| Fraction (%) | 9.2 | 11.2 | 17.9 | 8.8 | 3.2 | 0.6 | 32.7 | 13.3 | 3.1 | |||||
| FWHM (eV) | 1.7 | 1.9 | 1.3 | 1.9 | 2.3 | 1.5 | 1.5 | 1.6 | 1.2 | |||||
| MWCNT | Position (eV) | 284.6 | 285.2 | 287.3 | 290.5 | 531.5 | 531.8 | 533.2 | - | - | - | |||
| Fraction (%) | 53.3 | 25.3 | 3.3 | 17.0 | 0.1 | 0.3 | 0.5 | |||||||
| FWHM (eV) | 0.8 | 2.2 | 1.5 | 5.1 | 2.5 | 1.0 | 1.9 | - | - | - |
| D4 | D | D4 | G | D + D″ | 2D | D + G | ID/IG | I2D/IG | ||
|---|---|---|---|---|---|---|---|---|---|---|
| OgCN | Center (cm−1) | 1232 | 1384 | 1519 | 1595 | 2724 | 2938 | 1.83 | 0.15 | |
| Area (%) | 6.8 | 32.8 | 4.1 | 17.9 | 2.8 | 35.6 | ||||
| FWHM (cm−1) | 127.2 | 182.9 | 65.8 | 141.4 | 113.1 | 304.1 | ||||
| MWCNT | Center (cm−1) | 1348 | 1531 | 1590 | 2458 | 2695 | 2932 | 1.31 | 1.89 | |
| Area (%) | 26.0 | 5.3 | 19.8 | 1.2 | 37.5 | 10.2 | ||||
| FWHM (cm−1) | 48.9 | 175.7 | 64.9 | 94.4 | 91.6 | 106.8 |
| Concentration (mg L−1) | Grain Size (mm) | IS (mM KCl) | ka (min−1) | kd (min−1) | Smax (mg g−1) | r2 | |
|---|---|---|---|---|---|---|---|
| OgCN | 10 | 0.25–0.6 | 0 | 0.1831 | 0.0029 | 2.76 | 0.950 |
| 50 | 0.25–0.6 | 0 | 0.1920 | 0.0086 | 3.73 | 0.954 | |
| 100 | 0.25–0.6 | 0 | 0.3468 | 0.0033 | 4.30 | 0.916 | |
| 10 | 0.6–1.0 | 0 | 0.1850 | 0.0023 | 2.56 | 0.948 | |
| 50 | 0.6–1.0 | 0 | 0.1514 | 0.0052 | 3.35 | 0.973 | |
| 100 | 0.6–1.0 | 0 | 0.0936 | 0.0115 | 3.57 | 0.981 | |
| 50 | 0.6–1.0 | 2 | 0.2458 | 0.0001 | 3.81 | 0.933 | |
| 50 | 0.6–1.0 | 5 | 0.4160 | 0.0017 | 4.56 | 0.927 | |
| 50 | 0.6–1.0 | 10 | 0.6190 | 0.0005 | 5.74 | 0.885 | |
| MWCNT | 50 | 0.6–1.0 | 0 | 0.4876 | 0.0023 | 2.69 | 0.975 |
| 50 | 0.6–1.0 | 10 | 0.4886 | 0.0011 | 3.43 | 0.963 |
Disclaimer/Publisher’s Note: The statements, opinions and data contained in all publications are solely those of the individual author(s) and contributor(s) and not of MDPI and/or the editor(s). MDPI and/or the editor(s) disclaim responsibility for any injury to people or property resulting from any ideas, methods, instructions or products referred to in the content. |
© 2023 by the authors. Licensee MDPI, Basel, Switzerland. This article is an open access article distributed under the terms and conditions of the Creative Commons Attribution (CC BY) license (https://creativecommons.org/licenses/by/4.0/).
Share and Cite
Nguyen, T.-T.; Kim, D.-G.; Ko, S.-O. Transport of Oxygen-Doped Graphitic Carbon Nitride in Saturated Sand: Effects of Concentration, Grain Size, and Ionic Strength. Water 2024, 16, 6. https://doi.org/10.3390/w16010006
Nguyen T-T, Kim D-G, Ko S-O. Transport of Oxygen-Doped Graphitic Carbon Nitride in Saturated Sand: Effects of Concentration, Grain Size, and Ionic Strength. Water. 2024; 16(1):6. https://doi.org/10.3390/w16010006
Chicago/Turabian StyleNguyen, Thanh-Tuan, Do-Gun Kim, and Seok-Oh Ko. 2024. "Transport of Oxygen-Doped Graphitic Carbon Nitride in Saturated Sand: Effects of Concentration, Grain Size, and Ionic Strength" Water 16, no. 1: 6. https://doi.org/10.3390/w16010006