Article

A Regional Water Resource Allocation Model Based on the Human–Water Harmony Theory in the Yellow River Basin

1
Key Laboratory for Technology in Rural Water Management of Zhejiang Province, Zhejiang University of Water Resources and Electric Power, Hangzhou 310018, China
2
School of Water Conservancy & Environment Engineering, Zhejiang University of Water Resources and Electric Power, Hangzhou 310018, China
3
College of Water Conservancy & Hydropower Engineering, Hohai University, Nanjing 210098, China
4
School of Water Conservancy Engineering, Zhengzhou University, Zhengzhou 450001, China
5
Centre of Excellence in Water Resources Engineering, University of Engineering and Technology, Lahore 54890, Pakistan
6
School of Geomatics & Municipal Engineering, Zhejiang University of Water Resources and Electric Power, Hangzhou 310018, China
*
Author to whom correspondence should be addressed.
Water 2023, 15(7), 1388; https://doi.org/10.3390/w15071388
Submission received: 20 March 2023 / Revised: 30 March 2023 / Accepted: 1 April 2023 / Published: 3 April 2023

Abstract

:
Considering the issues of water scarcity, water environment deterioration, and unreasonable allocation of water resources in the urban area of the Yellow River Basin, this paper introduces the human–water harmony theory to the allocation of regional water resources. Based on an analysis of the structural characteristics of the regional water resource system, the harmonious water resource allocation (HWRA) model—which includes three sub-systems (i.e., the water service system, ecological environmental system, and economic and social system)—is established. In addition, considering the uncertain factors in the HWRA model, the inexact fuzzy multi-objective programming (IFMOP) method is used to solve the model, aiming at achieving the minimum amount of regional water scarcity, the minimum amount of sewage discharge, and the maximum total economic benefit. A case study of water resource allocation of Binzhou, a city located in the Yellow River Basin, is conducted to validate the model. The model solution results show that the water resource system in Binzhou in 2025 and 2035 could be optimized after harmonious allocation, especially in terms of the water service and ecological environmental systems. Compared with the optimal water resource allocation (OWRA) model, the HWRA model has a more scientific water supply structure, and a smaller amount of sewage discharge. The HWRA model solves the variables using an interval number, so it can flexibly and scientifically reflect the decision-making process.

1. Introduction

The Yellow River is the second-longest river in China, which is also known as the birthplace of Chinese civilization and China’s mother river [1]. Currently, the Yellow River supports approximately 9% of the national population on 2% of runoff in China, having a significant position in China’s economic and social development [2,3]. In 2019, the Chinese government proposed an ecological protection and high-quality development plan for the Yellow River Basin and elevated it to a major national strategy [4]. This plan puts forward high requirements for the comprehensive utilization of water resources and aims to effectively solve the water scarcity and environmental degradation problems currently faced in the Yellow River Basin [5]. Research on the Yellow River has a long history. Due to its specific topographic and climatic characteristics, the distribution of water resources in the Yellow River Basin is unbalanced [6]. The rainfall is plentiful in sparsely populated mountainous areas, but infrequent in densely populated plains, which leads to a shortage of urban water resources in the Yellow River Basin [7]. Over the past few decades, the Chinese government has attempted to alleviate the water scarcity in the Yellow River Basin by constructing inter-basin water transfer projects such as the South–North Water Diversion Project [8]. However, this fragile balance is easily disturbed. In recent years, with the rapid development of the economy and society, the urban population has increased dramatically, and the demand for water resources may increase continuously in the future [9]. In addition, the water pollution problem has become increasingly severe in the Yellow River Basin. According to Chen et al. [10], 90% of the groundwater flowing through the cities has been polluted. The water pollution threatens the balance between the water supply and water demand and hence worsens the situation of water scarcity in the basin [11]. Therefore, many researchers are of the opinion that the issues related to urban water resources in the Yellow River Basin would become more and more acute in the future unless more scientific water resource allocation models are adopted [12,13].
Considering the water scarcity and water pollution situation within the cities of the Yellow River Basin [14,15,16], it is necessary to take advantage of the regional water resources to solve the water problems [17]. Most of the current water resource allocation models involve a complex system of social–economic–natural dimensions, which is a typical multi-level, multi-objective, group decision problem [18,19]. These models usually maximize the benefits by solving multiple objectives to meet the needs of each stakeholder [19]. Therefore, constructing a water resource allocation model is an effective method to alleviate water scarcity and recharge ecological water to reduce water pollution [20]. At present, the mainstream water resource allocation theories include the optimal and the rational allocation of water resources [21]. The optimization theory was applied in the field of water resource allocation in very early studies. This theory usually uses mathematical models to solve the water resource allocation model from an economic perspective [22]. The optimal water resource allocation (OWRA) model estimates the most optimal results based on scientific calculations [23,24,25]. Although the results are ideal, in many cases this optimization cannot be achieved due to the complexity of the real situation [26,27,28,29]. At the beginning of the 21st century, inspired by the idea of sustainable development, the rational water resource allocation (RWRA) model was proposed by Wang et al. [30] and its principal idea is to achieve fairness for each stakeholder based on maximizing benefits. Compared with the OWRA model, the results of the RWRA model are more in line with realistic needs and are more acceptable to the stakeholders [31]. However, the fairness emphasized by rational allocation is mainly the regulation between stakeholders, which highlights the demands of human beings and yet ignores the needs of ecosystems [26,32]. Thus, this approach often has a negligible contribution to the reduction of water pollution.
Since the 2010s, with a growing focus on reducing water pollution, Li et al. [18] have constructed a water resource allocation model based on ecological priority and applied it in an arid region. Compared with the RWRA model, this allocation model based on ecological priority increased the ecological water and created shortages in domestic and industrial water. The regional water resource system in the Yellow River Basin is a large and complex system consisting of numerous sub-systems [2]. The sub-systems are interconnected through the water cycle and influence each other [19]. Therefore, the results of the regional water resource allocation scheme should meet the demands of each sub-system and be practical [33]. It is clear that both the ideal optimal allocation and anthropocentric rational allocation are inappropriate. Consequently, the theory of water resource allocation needs to be further developed from a new perspective to fit the structure of the regional water resource system, so that the water resource allocation model can better guide the management of water resources in the Yellow River Basin.
Human–water harmony is a novel theory that emerged in China at the early 21st century [34,35]. The concept of “harmony” is derived from the “harmonious society” proposed by the Chinese government [35]. Whereafter, the Chinese Ministry of Water Resources proposed the concept of human–water harmony, which embodies China’s beautiful wish for a harmonious coexistence between humans and nature [35]. In ancient China, according to Lao-Tzu (571–471 BC) and Confucius (551–479 BC), harmony is an orderly, coordinated, and natural development trajectory [36]. Zuo et al. [37,38] first elaborated on the main concept of human–water harmony theory from the perspective of system dynamics, and proposed the human–water harmony evaluation model to evaluate the relationship between humans and water. In Zuo et al.’s research [38], human–water harmony refers to the human system and the water system being in a virtuous cycle of mutual coordination. On this basis, Ding et al. [36,39] developed a human–water harmony index evaluation system which has been utilized in several cities in China. Zhang et al. [40] proposed the river–human harmony (RHH) theory, which refers to a coordinated and sustainable cycle between rivers and human systems. Ahamd et al. [41] developed a harmonious level index (HLI) for evaluating the degree of human–water harmony in several cities in different countries. The theory of human–water harmony attempts to establish a harmonious relationship between human systems and water systems, providing a new perspective that differs from the optimization and rational allocation perspectives [42,43,44]. However, although the theory of human–water harmony has been widely applied in the assessment of the human–water relationship, research on water resource allocation based on human–water harmony has not been undertaken deeply. Few systematic studies have been conducted on water resource allocation guided by the human–water harmony theory.
In this paper, we propose a regional water resource allocation model based on the human–water harmony theory and establish a harmonious water resource allocation (HWRA) model. The allocation model is established based on the analysis of the structure of the regional water resource system and the theory of human–water harmony with the objectives of minimizing regional water scarcity, minimizing sewage discharge, and maximizing departmental water use efficiency. In addition, given uncertain factors such as the ambiguity of the water demand and the interval characteristics of the benefit coefficients, we use the inexact fuzzy multi-objective programming (IFMOP) method to solve the equations of the model in the form of an interval number. We then apply our regional water resource allocation model to the city of Binzhou in the eastern part of the Yellow River Basin. Binzhou is an important industrial base in Shandong Province. However, due to intense human activities, Binzhou is facing increasing water pollution and water scarcity problems. Studying, understanding, and application of the HWRA model can support the solution of the regional water resources problems and achieve human–water harmony in the cities in the Yellow River Basin. The specific objectives of this study are to (1) propose a human–water harmony theory-based water resource allocation model to allocate and manage the regional water resources in the Yellow River Basin, (2) introduce the IFMOP method to solve the regional water resource allocation model with three sub-objectives taken into consideration, which is more scientific and flexible in terms of the presentation of the results, and (3) analyze the results of the allocation model for Binzhou based on the human–water harmony theory and identify its strengths compared to the OWRA model.

2. Study Area

Binzhou, which is located in the eastern part of the Yellow River Basin (117°15′–118°37′ E, 36°41′–38°16′ N) (Figure 1), has a land area of 9660 km2 [45]. The topography of Binzhou is plain in general. The hypsography is high in the south and low-lying in the north. The main rivers flowing through the territory are the Yellow River, Hai River, and Xiaoqing River [45]. Binzhou has a typical warm temperate monsoon climate, with an annual average temperature of 12.5 °C. The average annual precipitation in Binzhou is 568.6 mm [45]. Due to the influence of the monsoon, the seasonal distribution of precipitation in Binzhou is uneven. The precipitation is mainly concentrated in July and August, which often leads to flooding in the summer season. As an important industrial and grain production base in Shandong Province, the economic growth of Binzhou has been stable. For the past few years, with the rapid development of the economy and society, Binzhou’s population growth rate has been higher than the average rate in China. The city’s total population was 3.93 million at the end of 2020, with a population density of 406.7 people/km2 [45].
The per capita water resource in Binzhou is 265 m3/person, which is far below the international standard of 2000 m3/person [45]. Therefore, like most cities located in the Yellow River Basin, Binzhou is suffering from a desperate shortage of water. In addition, due to the proximity to the Bohai Sea, more than 55% of the groundwater in Binzhou has a mineralization of more than 2 g/L, which makes it unsuitable for use [46,47]. In recent years, the South–North Water Transfer East Project, also known as the Jiaodong Yellow River Transfer Project, has been put into operation, which greatly relieves the regional water scarcity in Binzhou. This project is diverting more than 1 Gm3/yr of water to Binzhou to achieve a balance between the water supply and demand. Although the current water demand can be met, with the increasing of economic development and population problems, more frequent water scarcity events are predicted in the future. The water resource allocation network structure of Binzhou in 2020 is presented in Table 1.
The water pollution problems in Binzhou are serious. In the city, the water pollution mainly comes from industrial wastewater and domestic sewage. Many rivers in Binzhou are heavily polluted, and most of them lack a self-purification ability. In the countryside, agricultural non-point source pollution caused by the excessive use of pesticides and fertilizers has resulted in serious water pollution hazards [48,49]. The low treatment rate of poultry and livestock manure and the surface flow of breeding wastewater have caused heavy pollution of groundwater intended for potable use in rural areas [50]. In addition, due to the outdated water-saving technologies and the aging water conservancy facilities, the water use efficiency in Binzhou is low. The irrigation water use efficiency of Binzhou is only 0.42, while it is greater than 0.80 in western countries, indicating a large potential for improvement [51]. In summary, the water use in Binzhou is becoming tighter and needs to be regulated based on a scientific and reasonable water resource allocation model in the future.

3. Methodology and Data

3.1. Theoretical Framework for Water Resource Allocation Based on the Human–Water Harmony Theory

The regional water resource system is a complex system that is sensitive to internal changes and exchanges energy and correlates with the external environment [52]. This complex system consists of three sub-systems: economic and social system, ecological environment system, and water service system. Each sub-system is interconnected and interacts with each other through the water cycle and human activities [53]. The composition and structure of this complex system are shown in Figure 2.
Figure 2 illustrates the interrelationship between the three sub-systems. The water service system is at the core position in the complex system, and it consists of the water supply system as well as the wastewater generation and treatment system. The water supply system provides water resources to the economic and social system to support the development of human society, while the economic and social system supplies the engineering foundation for the water supply system by constructing water conservancy projects. Wastewater is purified by the wastewater generation and treatment system and is provided to the ecological environment system in the form of ecological water. In addition, the ecological environment system provides hydrological support to the water service system. Human activities pollute the ecological environment system and provide compensation to the ecological environment system through environmental protection measures in the meanwhile. Moreover, the restored ecological environment system provides various natural resources and a favorable environment for the economic and social system.
Water resource allocation refers to the artificial measures taken to control the inconsistency between the spatial and temporal distributions of water supply and demand. The purpose of water resource allocation is to achieve the sustainable use of water resources. The human–water harmony theory is a new research idea that has emerged in the field of water resource management in the past decade, whose theoretical roots came from the ancient Chinese philosophical concept of harmony. The principle of the human–water harmony theory emphasizes the unity of diversity, a state of contradictory equilibrium in which different elements work together [35,38]. In this paper, we describe a water resource allocation model based on the human–water harmony theory under the frame of the regional water resource system, so as to guide the water resource allocation. In this model, the harmonious and sustainable use of water resources is the general objective and each sub-system has different sub-objectives. Therefore, we analyzed the characteristics of each sub-system and determined their sub-objectives.
  • Water service system
It can be seen from Figure 2 that the water service system is at the core position of the regional water resource complex system, which is related to the other sub-systems through the water cycle. Whether the water service system can continuously provide support for other sub-systems or not is particularly significant. Water service security refers to the ability of the water resources needed to support the development of the economic and social system and to promote a virtuous cycle of the ecological environment system. Therefore, the goal of water service security is to guarantee the quantity as well as the quality of water.
  • Economic and social system
The economic and social system provides scientific and technical support for the complex regional water resource system. Currently, development is the main theme of human society. The development of the economic and social system is normally a double-edged sword. Notably, development means overall increases in water consumption, population, and pollutants, which lead to various water disasters and environmental crises. Nonetheless, when human society evolves to a higher stage, the protection of water resources and the ecological environment commonly receive increasing attention. As a result, various types of safeguards and optimization measures could continuously emerge. Consequently, the pursuit of sustainable development of the economic and social system is one of the main sub-objectives of the water resource allocation model.
  • Ecological environment system
In the past, in terms of the allocation of water resources, the ecological environment has often been ignored by decision makers. Over time, damage resulting from this short-sighted behavior has gradually emerged. Water disasters and water pollution have occurred frequently, which have seriously restricted the development of human society and the virtuous circle of water resources. Predictably, the continuous optimization of the ecological environment system could also promote the sustainable development of the economic and social system and the water service system. Therefore, in the complex regional water resource system, one of the main sub-objectives is the optimization of the ecological environment system.
In summary, water service security, economic and social development, and optimization of the ecological environment are taken as the three sub-objectives.

3.2. Uncertain Factors in the Harmonious Water Resource Allocation Model

The existence of uncertain factors is an important feature of the water resource allocation model. Some of these factors are caused by the lack of objective data, and some are caused by the incomplete subjective cognizance of human beings [54]. Most of the allocation models presented in the literature are deterministic models. The deterministic models that ignore the uncertain factors usually result in information loss during the model calculation [55]. The water resource allocation model is associated with many uncertain factors, such as the ambiguity of the water demand, the sequence of the water supply, and the interval characteristics of social and economic benefit coefficients. Assuming that the water resource allocation model is deterministic makes it more convenient to solve the model, but the results of the calculations could be distorted [56]. Therefore, we introduce the uncertainty optimization method into the construction and solution of the multi-objective regional water resource allocation model, to optimize the uncertain factors and hence reduce the uncertainty of the allocation model.

3.3. Inexact Fuzzy Multi-Objective Programming Model

Contini et al. first proposed the uncertain multi-objective programming method [57], and it has been widely used in resource planning. Three types of methods are used to deal with uncertain problems, i.e., fuzzy multi-objective programming (FMOP), stochastic multi-objective programming (SMOP), and inexact multi-objective programming (IMOP) [58]. Huang et al. [59] summarized the main advantages of the existing multi-objective programming models and proposed the inexact fuzzy multi-objective programming (IFMOP) model. This model is essentially an optimization method formed by the coupling of the IMOP model and the inexact fuzzy line programming (IFLP) model, with the model effectivity being improved.
1.
Description of the IFMOP model
According to Huang et al. [59], the expression of the IFMOP model is as follows:
{ min f k ± = C k ± X ± , k = 1 , 2 , , u max f l ± = C l ± X ± , l = u + 1 , u + 2 , , q A i ± X ± b i ± , i = 1 , 2 , , m A j ± X ± b j ± , j = m + 1 , m + 2 , , n X ± 0
where f k ± and f l ± are the minimum and maximum objective functions, respectively; u and q are the minimization objectives and the total coefficient dimensions, respectively; C k ± and C l ± are the lower and upper limits of the benefit coefficients, respectively; A i ± and A j ± are the lower and upper limits of the cost coefficients, respectively; m, n are the maximum objective and the total constraint dimensions, respectively; X ± is the decision variable and the interval uncertainty, i.e., X ± = [ X , X + ] = { X t X + } . C k ± , C l ± , A i ± , A j ± , X ± R ± , and R ± are the set of uncertainties.
2.
Solution steps of the IFMOP model
According to Huang et al. [59], the solution steps of the IFMOP model generally include determining the fuzzy target, performing fuzzy line programming (FLP) conversion, fuzzy target construction and decomposition, performing inexact line programming (ILP) conversion, and IFMOP sub-model construction and solution. The IFMOP solution is interactively analyzed, which means the opinions of the decision makers are fed back into the model to revise the model and obtain a satisfactory final solution. The detailed solution steps are illustrated in Figure 3.

3.4. Construction of the IFMOP Model for Harmonious Water Resource Allocation

3.4.1. Data Sources

1.
Situation of water use in the current year
According to Binzhou City Water Resource Planning (2020–2035) [60], 2020 (taken as the current year) was a normal flow year (P = 50%, where P is the guarantee ratio). The total water supply of Binzhou was 18.26 × 10⁸ m3. The surface water supply accounted for 4.76 × 10⁸ m3, the Yellow River pilot water project accounted for 11.70 × 10⁸ m3, the groundwater supply accounted for 1.71 × 10⁸ m3, and reclaimed water accounted for 0.09 × 10⁸ m3. In terms of water consumption [60], the agricultural water consumption was 12.16 × 10⁸ m3, the industrial water consumption was 3.19 × 10⁸ m3, the domestic water consumption was 2.33 × 10⁸ m3, the ecological water consumption was 0.59 × 10⁸ m3, and the total amount of water consumption was 18.26 × 10⁸ m3. In general, Binzhou was in a balanced state of water supply and demand.
2.
Water supply and demand forecasting for the planning year
Binzhou City Water Resource Planning (2020–2035) [60] predicts that with the development of the economy and society, the future water demand of domestic and industrial purposes could continue increasing. In addition, the ecological water demand could also remain in a growth state as people’s attention has been drawn to environmental protection. Agricultural water accounted for approximately 70% of the total water consumption in 2020. In the future, Binzhou plans to improve its water use efficiency and reduce the average irrigation water use per acre to decrease the demand for agricultural water. However, the future water demand could still be higher compared with 2020. In terms of the water supply, the surface water could remain stable, while the groundwater supply could continue decreasing because of government policies. Therefore, in the future, Binzhou intends to increase the amount of water diverted from the Yellow River and reclaimed water to maintain the balance between the water supply and water demand. According to the forecast provided by Binzhou City Water Resource Planning (2020–2035) [60], the future water supply and demand (2025 and 2035) of Binzhou are presented in Table 2.
As can be seen from Table 2, water scarcity could exist in Binzhou in the future. Over time, the amount of the water deficit could continuously increase. Although Binzhou could implement a series of measures such as increasing the amounts of Yellow River pilot water and reclaimed water and reducing the agricultural water demand, the ongoing increase in domestic and ecological water demand could still result in water scarcity in Binzhou. Therefore, Binzhou urgently needs to adopt a new water resource allocation model in order to effectively alleviate the water scarcity situation that it may face in the future.

3.4.2. Mathematical Model for Harmonious Water Resource Allocation

The harmonious allocation of water resources aims to achieve a harmonious human–water relationship. According to the structure of the model proposed in Section 3.1, the model should include a water service security objective, economic and social development objective, and ecological environment optimization objective.
f ( X ) = o p t i o n { f 1 ± ( X ) , f 2 ± ( X ) , f 3 ± ( X ) }
Objective 1 (water service security objective): The level of regional water scarcity affects the security level of the water service system regarding the economic and social system and the ecological environment system [18]. Therefore, we use the minimum amount of regional water scarcity as an indirect measure of the water service security dimension, and the objective function of the water service security is shown in Equation (3):
f 1 ± ( X ) = min F Q = j = 1 n ( X S j ± i = 1 m G S i j ± )
where FQ is the level of regional water scarcity; j is the user of the water source in the region, n is the total; i is the independent water source in the region, m is the total; X S j ± is the quantity of water demanded by user j of the water source (108 m3); and G S i j ± is the quantity of water supplied from independent water source i to user j of the water source (108 m3).
Objective 2 (economic and social development objective): The economic and social development objective is expressed by the maximum total economic benefit provided by the regional water supply, which refers to the maximum total economic benefit of the user of the water source in the region while meeting the minimum water demand of each user [12]. The expression is shown in Equation (4):
f 2 ± ( X ) = max F J = j = 1 n i = 1 m ( N D i j ± N C i j ± ) × G S i j ±
where FJ is the total economic benefit from the regional water supply (CNY 108, CNY (yuan) is the official currency of the People’s Republic of China); N D i j ± is the benefit coefficient of the unit water supply from independent water source i to user j (yuan/m3); and N C i j ± is the cost coefficient of the unit water supply from independent water source i to the user j (yuan/m3).
Objective 3 (eco-environmental optimization objective): Ecological environmental optimization is a relatively abstract index. According to the previous analysis of the structure of the complex regional water resource system, the threat posed by the economic and social system to the water service system and the ecological environment system mainly comes from the pollution discharge [18]. Consequently, we take the minimum amount of sewage discharge as the objective of ecological environmental optimization. The objective function is Equation (5):
f 3 ± ( X ) = min F W = 10000 j = 1 n { ( i = 1 m G S i j ± ) α j ± [ ( 1 β j ) + β j ( 1 γ ) ] }
where FW is the amount of regional wastewater discharge; α j ± is the wastewater discharge coefficient of the user of the water source in the region; β j is the wastewater collection coefficient of the user of the water source in the region; and γ is the wastewater treatment rate.

3.4.3. Constraints for Harmonious Water Resource Allocation

1.
The constraint of the available water supply of the water source
For independent water source i, the available water supply should be greater than the sum of the water supply to all users j:
j = 1 m G S i j ± G S P i
where G S P i is the upper limit of the water availability from the independent water source i (108 m3).
2.
Constraints of the water demand
The amount of water obtained from independent water source i by user j should be between the upper and lower limits of the water demand of user j:
τ j X S j i = 1 n G S i j ± τ j + X S j
where τ j denotes the upper and lower limits of the water demand coefficient for user j in the region [59]. It is important to note that the water demand of user j is dynamic. Therefore, we use the water demand coefficient τ , which reflects the ratio of the real water demand to the forecasted water demand (see Section 3.4.4 for the details of water demand coefficients).
3.
Constraints of the water-carrying capacity of the water source
The water demand of user j in the region should be less than the maximum delivery capacity of independent water source i:
X S j i = 1 n Q i ±
where Q i ± is the maximum capacity of independent water source i (108 m3).
4.
Constraints of water quality
The constraints of the water quality are reflected by the discharges of the pollutant chemical oxygen demand (COD) [58]. The amount of regional discharge should be lower than the standard allowable values:
j = 1 m 0.01 d j α j ± i = 1 n G S i j ± w 0
where d j is the COD concentration of the wastewater produced by user j (mg/L); w 0 is the minimum amount of COD discharge allowed by the standard values; and α j ± is the wastewater discharge coefficient of user j.
5.
Non-negative constraints
User j should receive non-negative values from each independent water source i:
G S i j ± 0 , i = 1 , 2 , , 4 , j = 1 , 2 , , 4
where i is the independent water source (1: surface water, 2: Yellow River pilot water, 3: groundwater, 4: reclaimed water); and j is the user of the water source (1: domestic water, 2: ecological water, 3: industrial water, 4: agricultural water).

3.4.4. Model Parameter Calibration for Harmonious Water Resource Allocation

The regional harmonious water resource allocation model contains decision variables, water supply benefit coefficients, cost coefficients, water demand coefficients, water supply order coefficients, user fairness coefficient, and environmental coefficients [59]. The validity of the solution results of the water resource allocation model is closely related to the accuracy of the model parameters. Hence, it is critical to determine the ranges of the parameters. In this paper, the model parameters are determined from two aspects: the uncertainty theory and the definitions of the parameters themselves. The determination of the model parameters is achieved by collecting basic information data and defining relevant parameters. Since many model parameters are dynamic, it is inaccurate to determine model parameters in the form of crisp numbers [59]. Consequently, it is more scientific to describe the uncertainty of the model parameters using the interval number.
1.
Description of decision variables
The model takes G S i j ± , the quantity of the water supply from independent water source i to user j of the water source in the region, as the decision variable [59]. Since the regional water resource system is a highly complex and uncertain composite system, it is scientific to express the uncertainties in the form of a range of numbers instead of considering the parameter affiliation and probability distribution information separately in terms of the data acquisition and result interpretation.
2.
Water supply benefit coefficients N D i j ±
We use the inverse of the water consumption with a CNY 10,000 output value as the water supply benefit coefficient of user j (yuan/m3) [60]. Notably, the domestic and ecological water supply benefit coefficients are complicated and often difficult to quantify. The ecological water supply benefit coefficient can be calculated as the value of the ecological services generated by a 1 m3 water source, which is equal to the ecological service value per unit area divided by the water consumption per unit area. For domestic water, to meet the residents’ water demand, the benefit coefficient of the domestic water supply is set as the maximum of all of the water supply benefit coefficients. Therefore, the value of the domestic water supply benefit coefficient is determined based on the benefit coefficients of all of the relevant industries mentioned above [58,60]. The water supply benefit coefficients are presented in Table 3.
3.
Determination of the cost coefficients N C i j ±
The cost coefficient varies with the user j and the water source i, and it is usually determined by the standard of the water charge in the region.
The cost coefficients of the surface water and groundwater are determined from the information collected from the water charges in Binzhou in the present year (2020) [60]. The cost coefficient of reclaimed water is mainly based on the investment, operation, and expenses of the wastewater reclamation and treatment facilities. However, due to the leveraging role of reclaimed water, the cost coefficient should be lower than those of groundwater and surface water, with values approximately ranging from 20−50% [58,60]. The cost coefficient of the Yellow River pilot water is similar to that of the reclaimed water, which is determined based on the expenses of the water diversion project. Table 4 presents the values of the cost coefficients of the different water sources in Binzhou for each user.
4.
Water demand coefficients τ j
The determination of the water demand for the planning year is generally based on a comprehensive analysis that considers economic development, population growth, and future climate changes [61]. The uncertain factors can be reflected in the form of interval numbers. Hence, for the water demand constraint of the IFMOP model, first, it is necessary to calculate the user’s maximum and minimum water demands. In this paper, τ j is used to define the water demand coefficient. The maximum water demand is equal to the upper limit of the water demand coefficient τ j + multiplied by the water demand forecast, while the maximum water demand is equal to the lower limit of the water demand coefficient τ j multiplied by the water demand forecast. According to the water demand characteristics of each user, combined with the goal of the future water supply being less than the water demand, the upper limit τ j + of the water demand coefficient for domestic and ecological water is set to 1, while the lower limits τ j of the water demand coefficients for the other types of water are set to 0.80.
5.
Water supply order coefficients
The water supply order coefficient reflects the priority of the water source for water supply. According to Han et al. [58], water sources should supply water to users according to the following principles: using small water conservancy projects first, then large projects; using near water first, then distant water; using local water first, then transboundary water; and using surface water first, then groundwater. Therefore, the order of the water supply for each water source in Binzhou is as follows: surface water > Yellow River pilot water > reclaimed water > groundwater. The water supply order coefficient of each water source is calculated by Equation (11):
σ i = 1 + x max x i i = 1 n ( 1 + x max x i )
where x i is the serial number of the water supply of water source i; and x max is the maximum value of the serial number of the water supply.
The water supply order coefficient is indicated by the interval number, which is within [0, 1], to embody the priority degree of the water sources. Based on the principle of joint water supply from multiple water sources, the water supply order coefficients for Binzhou were 0.50 for surface water, 0.30 for Yellow River pilot water, 0.12 for reclaimed water, and 0.08 for groundwater.
6.
User fairness coefficient
The user fairness coefficient reflects the degree of priority of the water supply for the user. Based on the theory of human–water harmony, the order of user fairness is designed [58] and set as follows: domestic water use > ecological water use > industrial water use > agricultural water use. The user fairness coefficient is calculated using Equation (12):
δ j = 1 + y max y j j = 1 m ( 1 + y max y j )
where y j is the serial number of the user’s water use; y max is the maximum value of the serial number of the water use of the user. The water use fairness coefficients for each user are 0.46 for domestic water, 0.29 for ecological water, 0.16 for industrial water, and 0.09 for agricultural water, among which the reclaimed water cannot be used as domestic and industrial water.
7.
Environmental coefficient
The environmental coefficients are mainly determined by the regional COD emissions and sewage discharge coefficients [58,62]. Based on Binzhou City Water Resource Planning (2020–2035) [60], the COD emission of industrial wastewater in Binzhou is 330 mg/L, with a sewage discharge coefficient of 0.23, and the COD emission of domestic wastewater is 300 mg/L, with a sewage discharge coefficient of 0.65.

4. Results and Discussion

4.1. IFMOP Model Solution for Binzhou

We use the interactive two-step algorithm proposed by Huang et al. [59] to solve the IFMOP model. The solution steps are as follows.
Step 1: Substitute the determined parameters into the IFMOP model for Binzhou and convert the model to FLP to decompose the model into single-objective sub-models.
Step 2: Solve the decomposed single-objective sub-models and obtain the worst feasible solution and individual optimal solution of each sub-model.
Step 3: Combine the two solutions of the sub-models based on the specific situation of Binzhou to determine the desired level and allowable lower limit of the fuzzy objective.
Step 4: Construct the auxiliary model and decompose the objective function of the fuzzy objective based on ILP to obtain the sub-IFMOP model for Binzhou.
Step 5: Solve the constructed sub-IFMOP model for Binzhou, combine it with the current situation of Binzhou, and determine the final water resource allocation scheme.
We use the Linprog function in the Optimization Toolbox in MATLAB software [58] to solve the IFMOP model. The Linprog function can solve not only multi-objective non-linear models but also non-linear and linear equations. We utilize MATLAB to convert the multi-objective planning function into single-objective planning functions based on the interactive algorithm. Then, the constructed IFMOP model is applied to find the harmonious water resource allocation result with 50% assurance in Binzhou in 2025 and 2035. The allocation results are presented in Table 5 and Table 6.

4.2. Analysis of Harmonious Water Resource Allocation in Binzhou

4.2.1. Analysis of the HWRA Model Results

1.
Analysis of the allocation results for 2025
As can be seen from Table 5, for a guaranteed ratio of 50%, the total water demand of Binzhou in 2025 would be 19.09 × 10⁸ m3, the total available water supply would be [18.41, 18.99] × 108 m3, the water deficit would be [0.09, 0.68] × 108 m3, and the water deficit ratio would be 0.51–3.54%.
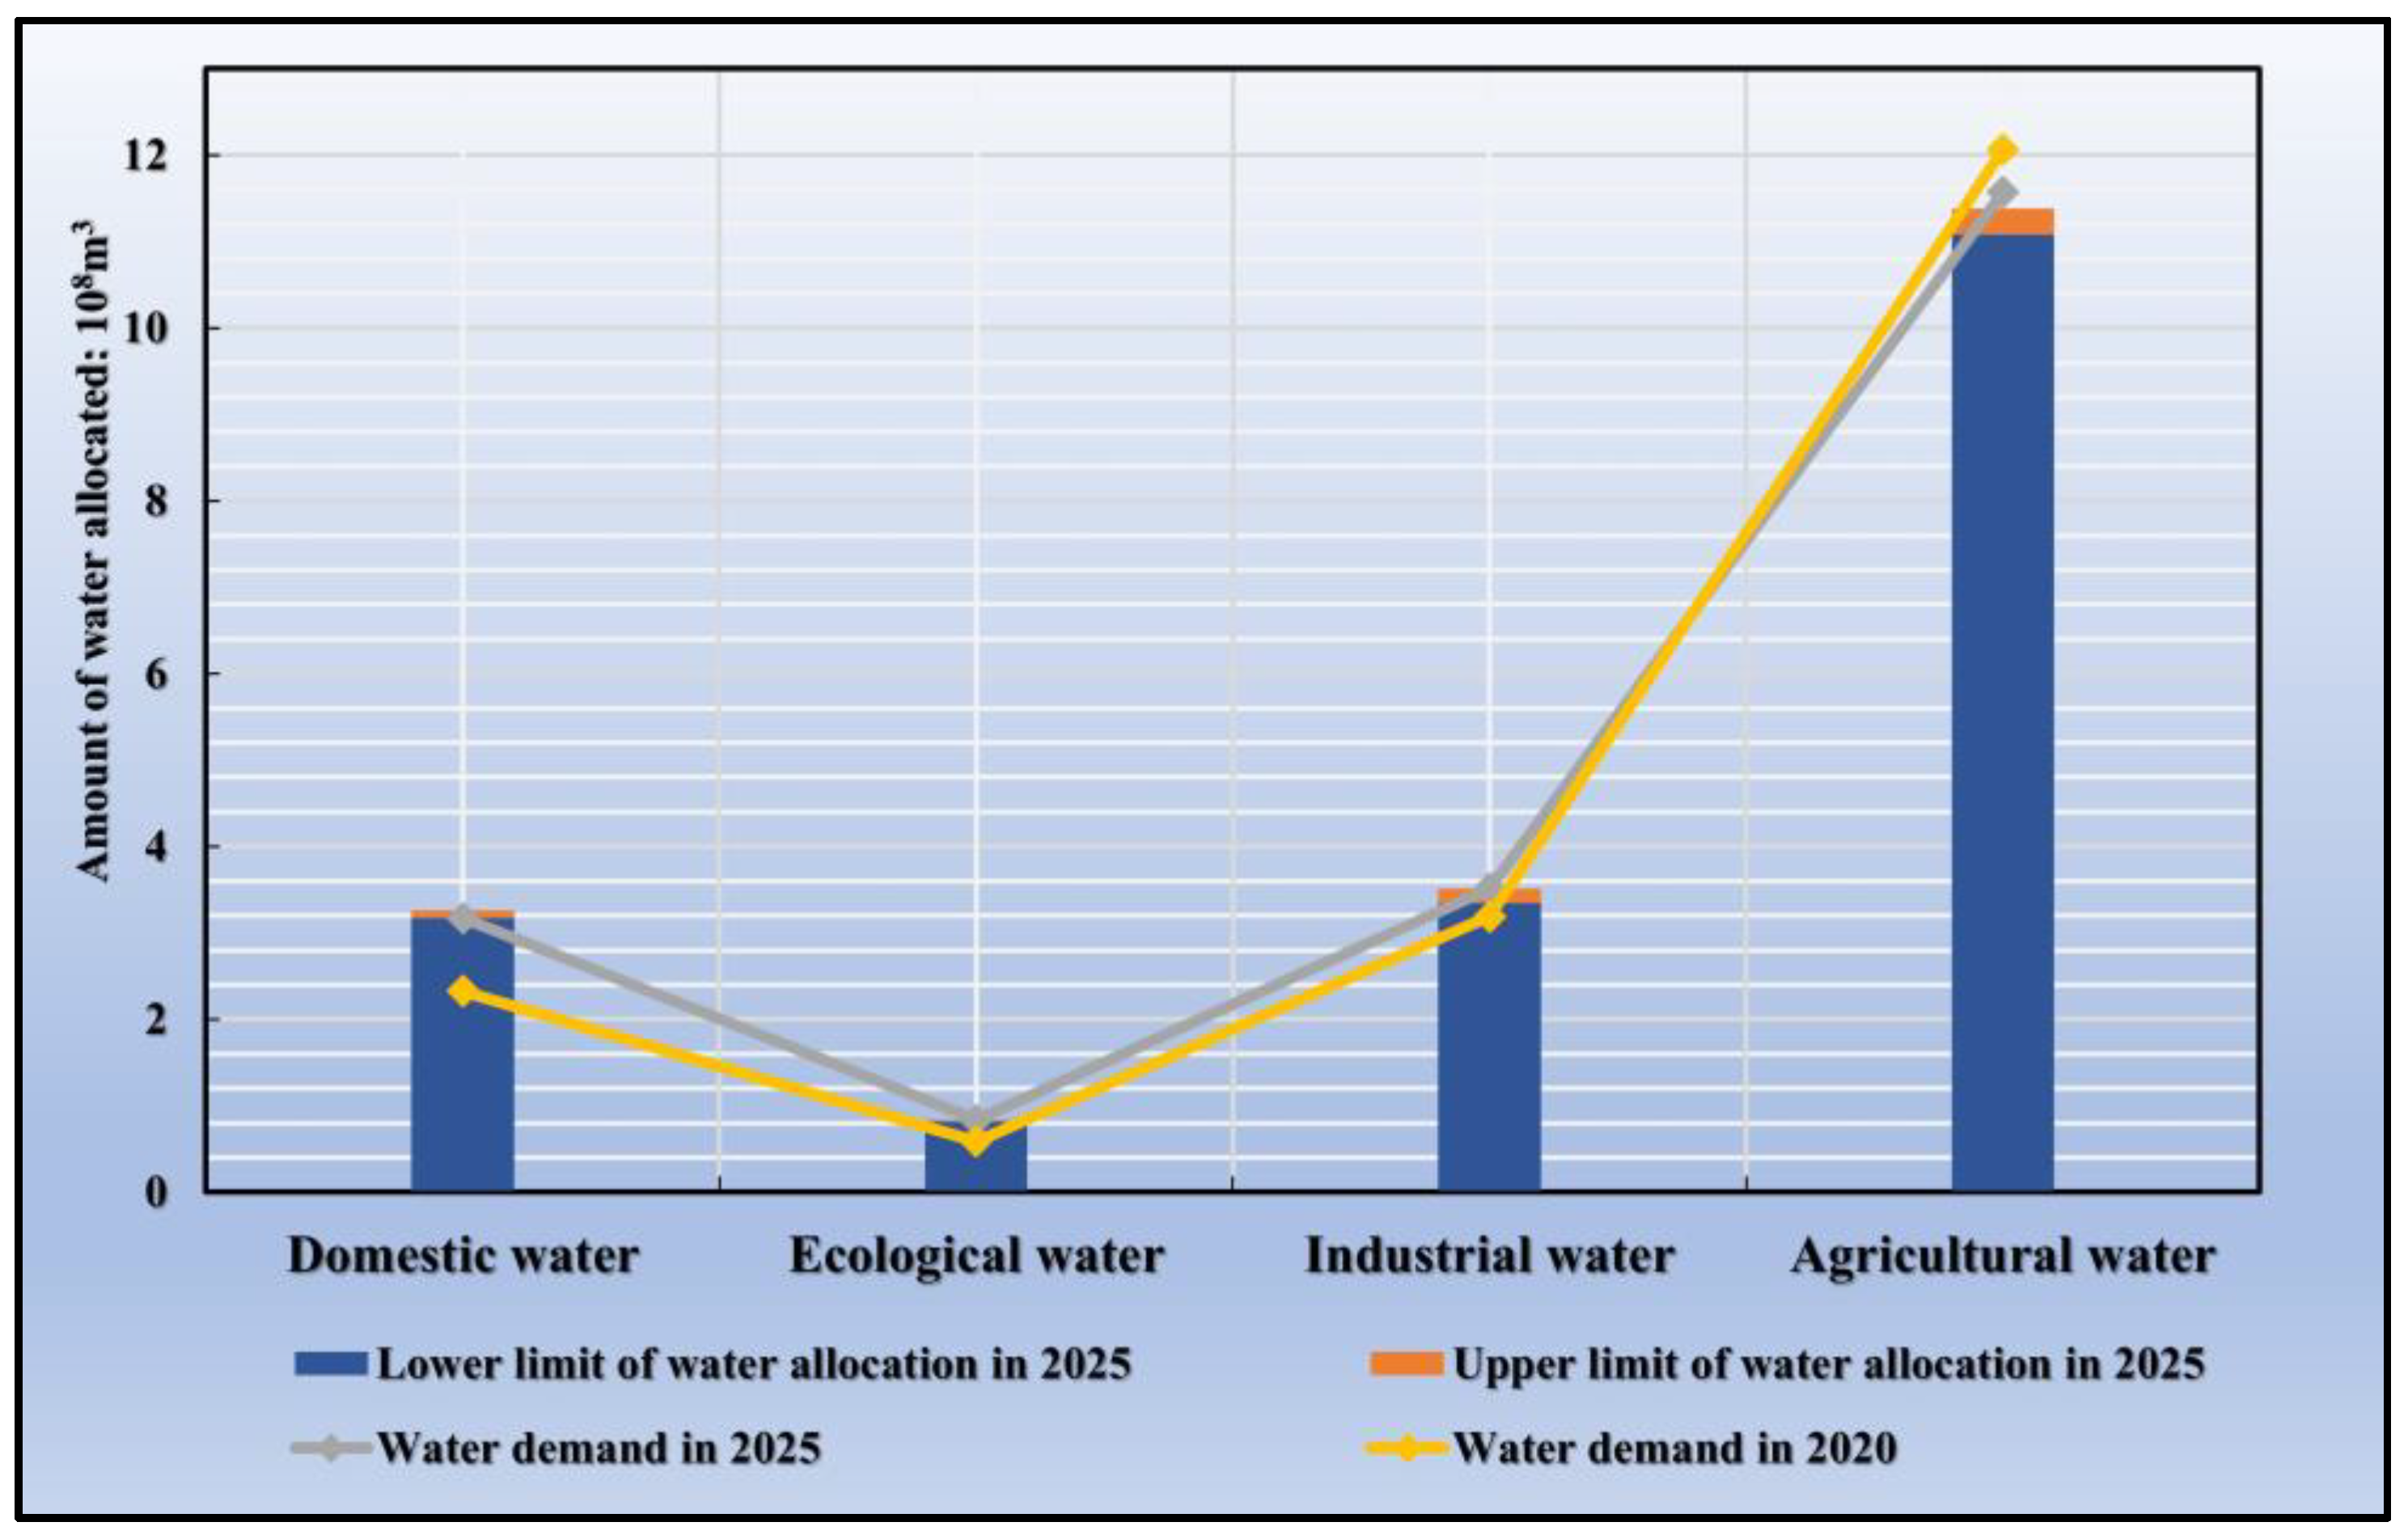
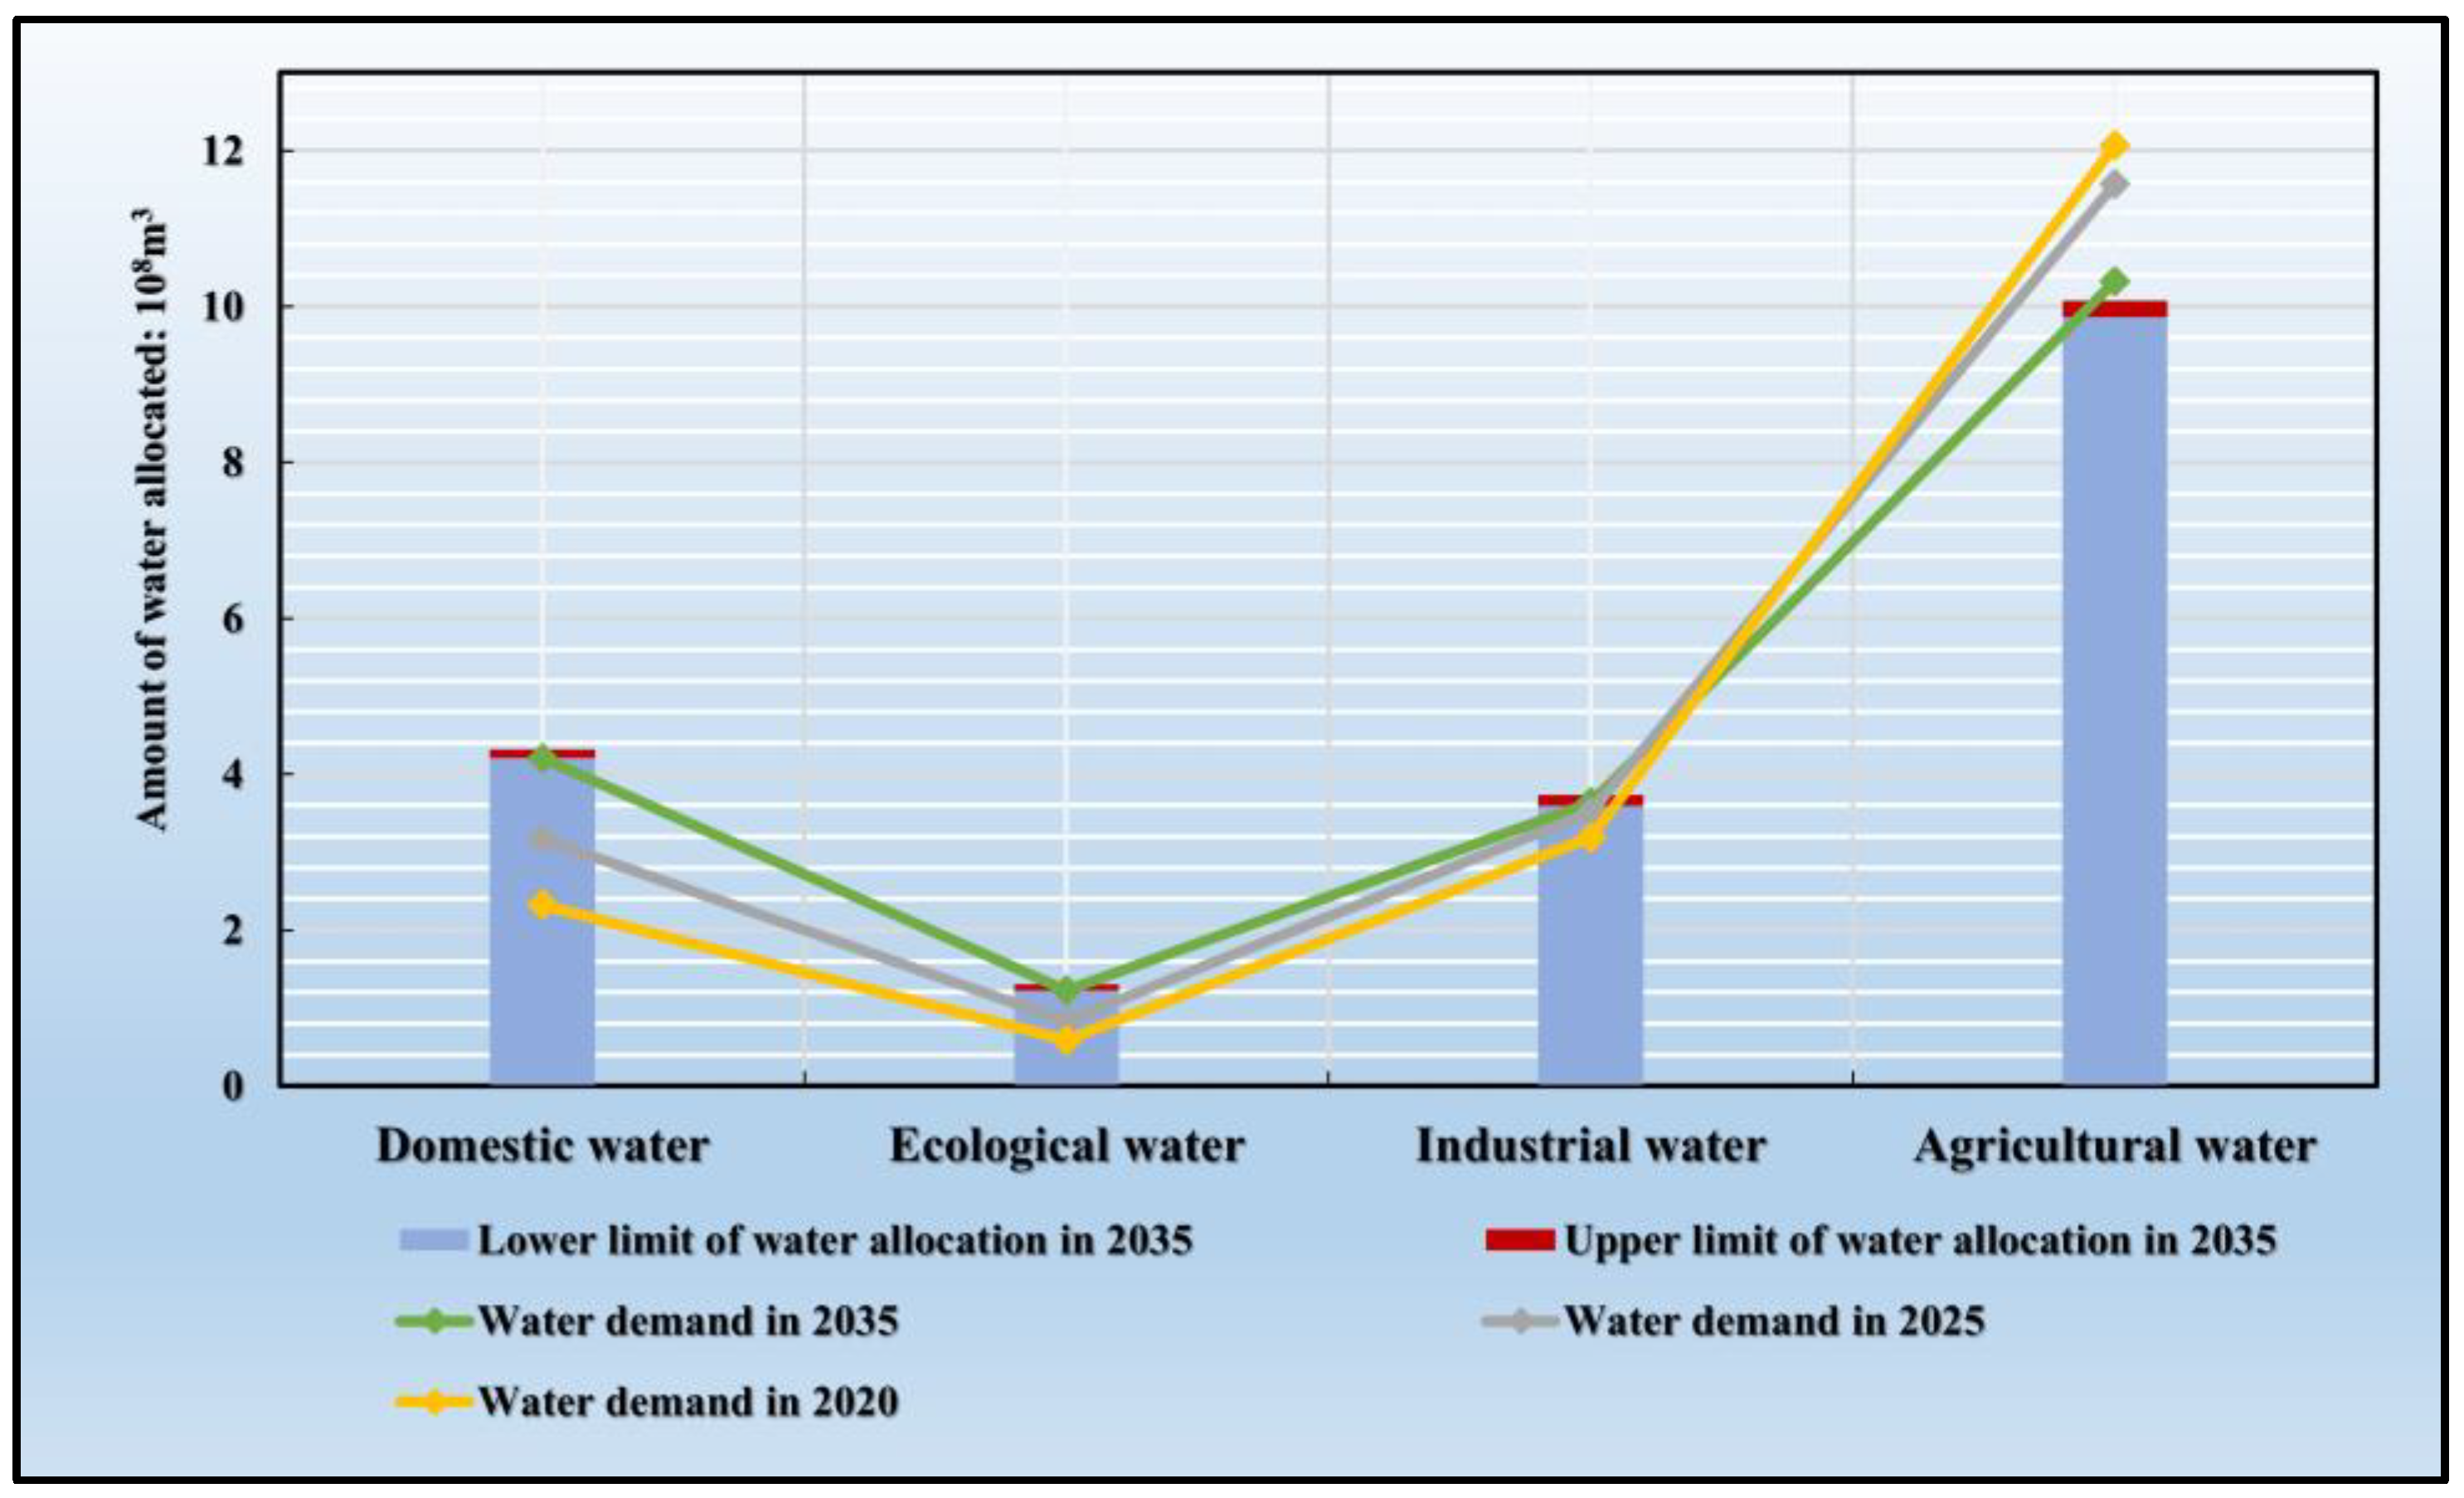
In terms of water demand, comparing to 2020, the water demand for domestic, ecological, and industrial uses in Binzhou would significantly increase, while the water demand for agriculture use would decrease. The ecological water demand would increase by approximately 42.15%. Its growth rate would be the highest due to the growing awareness of environmental protection and the low base level. The domestic water demand would increase by approximately 36.26%, due to the rapid population growth brought about by urbanization. Considering the adoption of new water-saving technologies and the governmental limits on industrial water use standards, the increase in industrial water demand would be 10.31%, which would be the smallest compared with the domestic and ecological water demands. The agricultural water demand would decrease by 4.79%, but it is still expected to account for 60.60% of the overall water demand and would represent the majority of water demand. Similar to industrial water demand, agricultural water demand would be under control, owing to the application of new water-saving technologies, which would increase the effective utilization coefficient of agricultural irrigation water and reduce the average amount of irrigation water consumption. The water demand changes are shown in Figure 4.
In terms of water supply, the types of water supply sources would be the same as in 2020, including surface water, Yellow River pilot water, reclaimed water, and groundwater. According to Binzhou City Water Resource Planning (2020–2035) [60], the surface water supply in Binzhou would remain basically unchanged, while the amount of groundwater extraction would gradually decrease, and the amount of the Yellow River pilot water and reclaimed water would increase. As can be seen from Table 5, the surface water supply in 2025 would be [4.67, 4.76] × 108 m3, which is comparable to the amount in 2020. The groundwater supply would be 1.21 × 10⁸ m3, which is approximately 0.50 × 10⁸ m3 less than that in 2020, and it would no longer be used to supply industrial water. The amount of Yellow River pilot water would increase by 0.20 × 10⁸ m3 per year. The increase in the amount of Yellow River pilot water would effectively relieve the imbalance between the water supply and water demand, although it would still be slightly inadequate due to the engineering scale and technical limits. The reclaimed water would increase by 0.23 × 10⁸ m3, primarily being used for industrial water. However, reclaimed water is difficult to utilize on a large scale due to the economic cost of treating wastewater. The structure of the water supply in Binzhou is optimized after the HWRA model is applied. The domestic water demand would be completely guaranteed and a margin of [0, 0.09] × 108 m3 would exist, so the possible shortage of domestic water brought about by the uncertain situation of population growth can be considered. In addition, this margin can also be used to fulfill the other types of water demanded. The ecological water is basically in balance, with an extremely small shortage of [0, 0.02] × 108 m3 in exceptional cases (e.g., shortfalls in other water demands need to be fulfilled by ecological water). The industrial water demand can be guaranteed at the upper limit of the water supply, but there is still an existing shortage of [0, 0.17] × 108 m3 in most cases, which is the main direction for further optimization. The level of agricultural water shortage is currently the highest of all types of water. As can be seen from Table 5, even at the upper limit of the water supply, there is still a shortage of agricultural water, with a maximum water deficit rate of 4.23%. This situation is caused by the lower priority of agricultural water in the HWRA model compared with the other types of water. Furthermore, the total amount of agricultural water supply is enormous, and it is generally applied to reconcile other water scarcities.
In summary, with the support of the harmonious allocation of water resources, in 2025, although there would still be a certain amount of water scarcity in Binzhou, the water supply structure would be optimized and most of the water demands would be guaranteed. Moreover, the flexibility of the water supply would be greatly enhanced using interval numbers, and the uncertainty in the water supply would be greatly reduced.
2.
Analysis of the allocation results for 2035
As can be seen from Table 6, for a guaranteed rate of 50%, the total water demand of Binzhou in 2035 would be 19.40 × 10⁸ m3, the available water supply would be [18.63, 19.28] × 108 m3, the water deficit would be [0.11, 0.74] × 108 m3, and the water deficit rate would be 0.58–3.95%.
The water demand in 2035 would increase 0.31 ×10⁸ m3 compared to that in 2025, which is not obvious considering that the total amount is 19.40 × 10⁸ m3. It can be seen from Figure 5 that the domestic water demand would continue growing from 2025 to 2035, mainly because the urban population and residential water quotas would increase steadily. The ecological water demand would increase by approximately 47.53%, which is the highest of all types of water demand compared to 2025. However, the amount is not significant considering its low proportion in the total water demand. The industrial water demand would increase by approximately 3.50% compared to that in 2025. Considering that the economy of Binzhou would maintain an average annual growth rate of about 8%, the increase in the industrial water demand would be insignificant, which benefits from the improvement of the water conservation rate and the industrial water use coefficient. With the optimization of the irrigation water utilization efficiency and the reduction of growing areas, the agricultural water demand would decrease further. Compared to 2025, the agricultural water demand would decrease by 1.25 × 10⁸ m3.
In terms of the water supply, compared to 2020 and 2025, the types of water supply sources would remain unchanged and would still consist of surface water, Yellow River pilot water, groundwater, and reclaimed water. The surface water supply ceiling would remain at 4.76 × 10⁸ m3, i.e., the same as in 2020 and 2025. The Yellow River pilot water would continue increasing. According to Binzhou City Water Resource Planning (2020–2035) [60], the Yellow River pilot water would increase to approximately 13.70 × 10⁸ m3, accounting for 71.05% of the total water supplies in 2035. Groundwater extraction would be further reduced. By 2035, the amount of groundwater supply in Binzhou would be 0.21 × 10⁸ m3, which is approximately 1.50 × 10⁸ m3 less than that in 2020. In addition, groundwater would be reserved for agricultural use and would no longer be used for other purposes. The amount of reclaimed water would nearly double compared to that in 2025, with an upper limit of 0.62 × 10⁸ m3. Moreover, owing to the improvement of technology, reclaimed water would be used as ecological and agricultural water. In terms of the water supply structure, the domestic and ecological water demands would be completely guaranteed after a new round of harmonious water resource allocation plan implementation. The upper limit of the water supply would exceed the expected water demand, and the excess can be used to fulfill other water demands and to ensure that water scarcity does not arise when the water demand increases. The industrial water supply would only have a deficit of 0.15 × 10⁸ m3 at the lower limit of the supply. In most cases, the industrial water supply would be higher than the water demand, and the excess can be applied to fulfill other water demands. There would still be a deficit of [0.39, 0.59] × 108 m3 for agricultural water, and the deficit would increase slightly compared to that in 2025.
In summary, by 2035, although water scarcity may still exist in certain cases, the water supply structure is expected to be further optimized compared with that in 2025 after implementation of harmonious water resource allocation. The supply and demand of water for domestic and ecological uses would be in balance, and a portion of the water supply would be reserved to cope with possible increases in the water demand or to fulfill other water demands. The industrial water supply would be guaranteed in most cases. The agricultural water would continue to be optimized in future water resource allocation.

4.2.2. Comparison of the Results of the OWRA and HWRA Models

To validate the proposed harmonious water resource allocation (HWRA) model, we compared its results with those of the optimal water resource allocation (OWRA) model. The OWRA model maximizes the total economic benefit provided by the regional water supply, which refers to the maximum total economic benefit to the user of the water source in the region. The expression is as follows:
f o p ( X ) = max F J = j = 1 n i = 1 m ( N D i j ± N C i j ± ) × G S i j ±
where FJ is the total economic benefit from the regional water supply (CNY 108). N D i j ± , N C i j ± , and G S i j ± have been defined in Section 3.4.2. The constraints of the optimal water resource allocation model mainly consider the constraints of the available water supply from the water sources, the water demand, the water-carrying capacity of the water sources, and the requirement of non-negative values. The constraints have been described in Section 3.4.3. The assumptions of the allocation scenario for the OWRA model in the planning years (2025 and 2035) are as follows.
(1) The amounts of the agricultural, industrial, domestic, and ecological water demands are the same as those in the HWRA model in each planning year.
(2) The total amount of available water supply is the same as that in the HWRA model in each planning year. The amounts of available water for each user are different for these two models.
(3) Most of the model parameters are the same as in the HWRA model, except the user fairness coefficient. Since the objective of the optimal water resource allocation model is expressed by the maximum total economic benefit provided by the regional water supply, the order of user fairness is as follows: domestic water use > industrial water use > agricultural water use > ecological water use. As calculated by Equation (12), the user fairness coefficients are calculated to be 0.42 for domestic water, 0.31 for industrial water, 0.23 for agricultural water, and 0.04 for ecological water.
According to the above scenario for calculating the OWRA model, the results of these two models with a guaranteed rate of 50% are presented in Table 7. It should be noted that for comparison purposes, the results of the harmonious allocation are taken as the upper limits of the interval numbers.
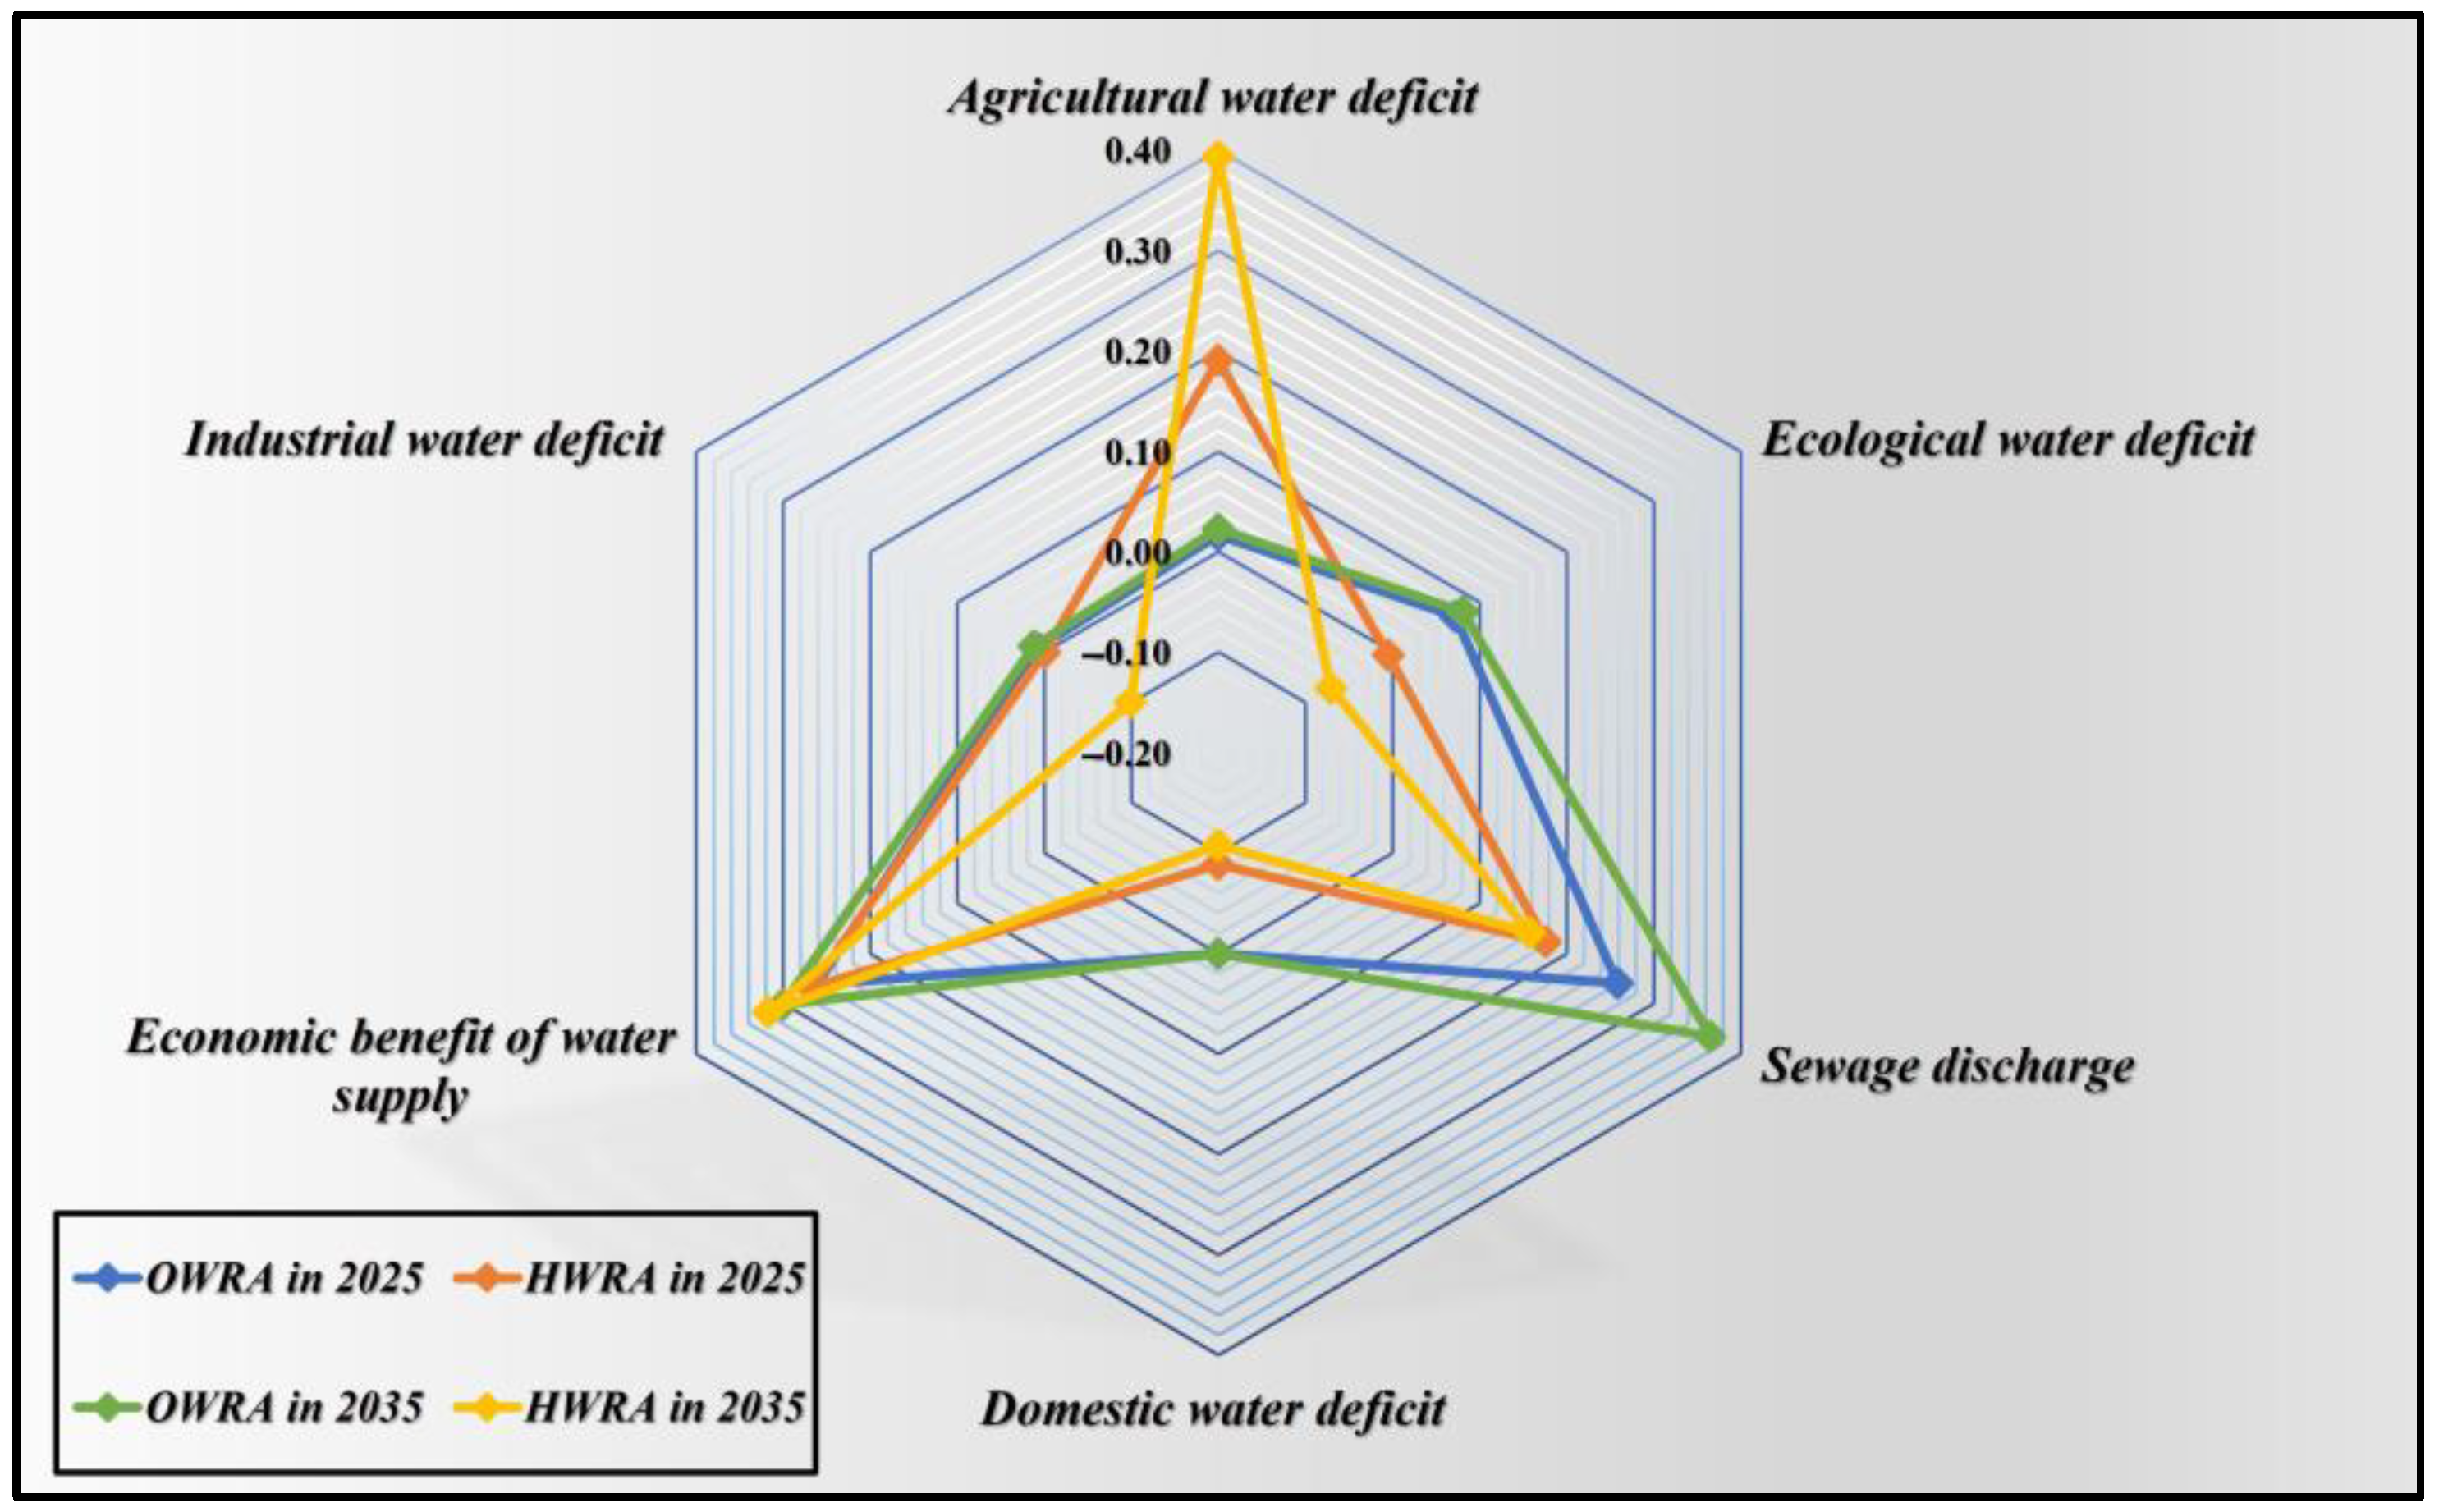
We compare the two allocation models from three aspects based on the three objectives of the HWRA model, i.e., the amount of the water deficit, the total economic benefit of water supply, and the amount of sewage discharge. As the total amounts of the water deficit of the OWRA and HWRA models are the same, we compare the difference between the sub-water users’ water deficits. To visualize the difference between the two models, the calculation results are presented using a radar chart (Figure 6).
It can be seen from Table 7 that the economic benefit of the water supply is a positive indicator and all the other five indicators are negative indicators, which means that smaller values are better. As the economic benefit of the water supply is used as an objective function by both the two models, the economic benefits of these models are almost the same, with that of the HWRA model being slightly higher than that of the OWRA model. In terms of the amounts of the water deficit and the sewage discharge, the differences are pronounced. The OWRA model has an edge in terms of agricultural water. The amount of agricultural water deficit of the OWRA model is 0.17 × 10⁸ m3 less than that of the HWRA model in 2025, and it increases to 0.37 × 10⁸ m3 in 2035. The HWRA model has an outstanding performance in the aspects of domestic water, ecological water, and industrial water. In these three areas of water use, the HWRA model ensures a surplus, which can be applied to possible increments in the future. For the OWRA model, except for the balanced domestic water, there is a scarcity of ecological and industrial water, and the scarcity increases from 2025 to 2035. In terms of the amount of sewage discharge, the HWRA model reduces it by 0.02 × 10⁸ m3, while the OWRA model increases it by 0.11 × 10⁸ m3. Therefore, based on the allocation results of the two models, the HWRA model is more scientific and reasonable than the OWRA model.

5. Conclusions

This paper introduced the structure of the regional water resource system and used the human–water harmony theory to guide regional water resource allocation and to establish a multi-objective model for the harmonious allocation of regional water resources in Binzhou. The harmonious water resource allocation (HWRA) model included three sub-objectives: water service security, ecological environmental optimization, and economic and social development. In addition, the IFMOP model was introduced to consider the uncertain factors such as the fuzzy water demand, the random water availability, and the interval of the socio-economic parameters in the HWRA model. The uncertainty information was presented during the construction of the HWRA model and solved in the interval numbers for each variable, which had significant advantages over other deterministic models. The following findings were revealed:
1.
By analyzing the results of the HWRA model for Binzhou, it was found that the overall water supply and demand situation would improve in the future with the support of harmonious allocation, especially in terms of water service security and ecological environment optimization.
2.
The IFMOP model could be decomposed into relatively simple single-objective linear programming sub-models, and then easily solved using MATLAB. In terms of the presentation of the results, the model could present the parameters and allocation results in the form of interval numbers, which effectively improved the flexibility and accuracy of the allocation scheme by reducing the data interpretation limitations.
3.
The allocation results of the HWRA model and the OWRA model were compared. The water supply structure of the HWRA model was more scientific, and the amount of sewage discharge was less than that in the OWRA model. Consequently, the application of the HWRA model would be meaningful for the water resource allocation of the Yellow River Basin.

Author Contributions

Conceptualization, J.Z. and D.T.; methodology, J.Z.; software, J.Z. and M.W.; validation, Z.M.; formal analysis, J.Z.; investigation, J.Z.; resources, J.Z.; data curation, J.Z.; writing—original draft preparation, J.Z.; writing—review and editing, I.A.; visualization, D.L.; supervision, S.P.; project administration, J.Z.; funding acquisition, J.Z., J.H. and D.T. All authors have read and agreed to the published version of the manuscript.

Funding

This research was funded by the National Key R&D Program of China (No. 2017YFC0405805-04), the Open Funding of the Key Laboratory for Technology in Rural Water Management of Zhejiang Province (No. ZJWEU-RWM-20200203B), the General Projects of Zhejiang Provincial Education Department (No. Y202250299), and the Joint Funds of Zhejiang Provincial Natural Science Foundation of China (No. LZJWY22E090003).

Data Availability Statement

Not applicable.

Acknowledgments

The authors are particularly grateful to the Binzhou Water Resources Bureau for providing the data sources.

Conflicts of Interest

The authors declare no conflict of interest.

References

  1. Chen, Y.Z.; Syvitski, J.P.M.; Gao, S.; Overeem, I.; Kettner, A.J. Socio-economic Impacts on Flooding: A 4000-Year History of the Yellow River, China. Ambio 2012, 41, 682–698. [Google Scholar] [CrossRef] [PubMed] [Green Version]
  2. Wang, S.; Fu, B.; Piao, S.; Lu, Y.; Ciais, P.; Feng, X.; Wang, Y. Reduced sediment transport in the Yellow River due to anthropogenic changes. Nat. Geosci. 2016, 9, 38–41. [Google Scholar] [CrossRef]
  3. Li, P.Y.; Wang, D.; Li, W.Q.; Liu, L.N. Sustainable water resources development and management in large river basins: An introduction. Environ. Earth Sci. 2022, 81, 11. [Google Scholar] [CrossRef] [PubMed]
  4. Zhang, Z.W.; Liu, Y.F. Spatial Expansion and Correlation of Urban Agglomeration in the Yellow River Basin Based on Multi-Source Nighttime Light Data. Sustainability 2022, 14, 9359. [Google Scholar] [CrossRef]
  5. Xin, Y.; Liu, X.Y. Coupling driving factors of eco-environmental protection and high-quality development in the yellow river basin. Front. Environ. Sci. 2022, 10, 16. [Google Scholar] [CrossRef]
  6. Zhou, L.-J.; Ying, G.-G.; Zhao, J.-L.; Yang, J.-F.; Wang, L.; Yang, B.; Liu, S. Trends in the occurrence of human and veterinary antibiotics in the sediments of the Yellow River, Hai River and Liao River in northern China. Environ. Pollut. 2011, 159, 1877–1885. [Google Scholar] [CrossRef]
  7. Immerzeel, W.W.; van Beek, L.P.H.; Bierkens, M.F.P. Climate Change Will Affect the Asian Water Towers. Science 2010, 328, 1382–1385. [Google Scholar] [CrossRef]
  8. Chen, S.-J.; Huang, W.-B.; Li, J.-D.; Liu, Y.; Ma, G.-W. Discussion of “Impact of the Sanmenxia and Xiaolangdi Reservoirs Operation on the Hydrologic Regime of the Lower Yellow River” by Yunyun Li, Jianxia Chang, Huan Tu, and Xuebin Wang. J. Hydrol. Eng. 2017, 22, 1520. [Google Scholar] [CrossRef]
  9. Zhou, Z.; Sun, X.; Zhang, X.; Wang, Y. Inter-regional ecological compensation in the Yellow River Basin based on the value of ecosystem services. J. Environ. Manag. 2022, 322, 116073. [Google Scholar] [CrossRef]
  10. Chen, J.; Gao, Y.; Qian, H.; Ren, W.; Qu, W. Hydrogeochemical evidence for fluoride behavior in groundwater and the associated risk to human health for a large irrigation plain in the Yellow River Basin. Sci. Total Environ. 2021, 800, 149428. [Google Scholar] [CrossRef]
  11. Olsson, G. Water, energy and food interactions-Challenges and opportunities. Front. Environ. Sci. Eng. 2013, 7, 787–793. [Google Scholar] [CrossRef]
  12. Shao, W.; Yang, D.; Hu, H.; Sanbongi, K. Water Resources Allocation Considering the Water Use Flexible Limit to Water Shortage-A Case Study in the Yellow River Basin of China. Water Resour. Manag. 2009, 23, 869–880. [Google Scholar] [CrossRef]
  13. Wang, A.; Gao, C. Study on the Relationship of Spatio-Temporal Matching between Water Resources and Economic Development Factors in the Yellow River Basin. Fresenius Environ. Bull. 2018, 27, 6591–6597. [Google Scholar]
  14. Li, A.; Yuan, Q.; Strokal, M.; Kroeze, C.; Ma, L.; Liu, Y. Equality in river pollution control in China. Sci. Total Environ. 2021, 777, 146105. [Google Scholar] [CrossRef]
  15. Li, H.; Zhao, F.; Li, C.; Yi, Y.; Bu, J.; Wang, X.; Liu, Q.; Shu, A. An Improved Ecological Footprint Method for Water Resources Utilization Assessment in the Cities. Water 2020, 12, 503. [Google Scholar] [CrossRef] [Green Version]
  16. Liu, L.; Ma, J.; Luo, Y.; He, C.; Liu, T. Hydrologic Simulation of a Winter Wheat-Summer Maize Cropping System in an Irrigation District of the Lower Yellow River Basin, China. Water 2017, 9, 7. [Google Scholar] [CrossRef] [Green Version]
  17. Grafton, R.Q.; Pittock, J.; Davis, R.; Williams, J.; Fu, G.; Warburton, M.; Udall, B.; McKenzie, R.; Yu, X.; Che, N.; et al. Global insights into water resources, climate change and governance. Nat. Clim. Chang. 2013, 3, 315–321. [Google Scholar] [CrossRef]
  18. Li, J.-Y.; Cui, L.-B.; Dou, M.; Ali, A. Water resources allocation model based on ecological priority in the arid region. Environ. Res. 2021, 199, 111201. [Google Scholar] [CrossRef]
  19. Shen, D.; Speed, R. Water Resources Allocation in the People’s Republic of China. Int. J. Water Resour. Dev. 2009, 25, 209–225. [Google Scholar] [CrossRef]
  20. Kang, A.; Li, J.; Lei, X.; Ye, M. Optimal Allocation of Water Resources Considering Water Quality and the Absorbing Pollution Capacity of Water. Water Res. 2020, 47, 336–347. [Google Scholar] [CrossRef]
  21. Hou, J.; Wang, N.; Luo, J.; Zhang, X.; Wang, Z.; Xie, J. A multi-method integrated simulation system for water resources allocation. Water Supply 2022, 22, 2518–2532. [Google Scholar] [CrossRef]
  22. Li, C.; Zhou, J.; Ouyang, S.; Wang, C.; Liu, Y. Water Resources Optimal Allocation Based on Large-scale Reservoirs in the Upper Reaches of Yangtze River. Water Resour. Manag. 2015, 29, 2171–2187. [Google Scholar] [CrossRef]
  23. Guo, X.; Wu, Z.; Wang, X.; Lv, C.; Gu, C.; Li, Y.; Gao, M. The Joint Optimal Allocation Study of Regional Total Water Consumption and Pollutant Carrying Capacity of Water Function Areas Based on Emergy Theory. Water 2020, 12, 1101. [Google Scholar] [CrossRef] [Green Version]
  24. Ni, J.; Liu, M.; Ren, L.; Yang, S.X. A Multiagent Q-Learning-Based Optimal Allocation Approach for Urban Water Resource Management System. IEEE Trans. Autom. Sci. Eng. 2014, 11, 204–214. [Google Scholar] [CrossRef]
  25. Zhou, Y.; Guo, S.; Xu, C.-Y.; Liu, D.; Chen, L.; Ye, Y. Integrated optimal allocation model for complex adaptive system of water resources management (I): Methodologies. J. Hydrol. 2015, 531, 964–976. [Google Scholar] [CrossRef]
  26. Fu, J.; Zhong, P.-A.; Xu, B.; Zhu, F.; Chen, J.; Li, J. Comparison of Transboundary Water Resources Allocation Models Based on Game Theory and Multi-Objective Optimization. Water 2021, 13, 1421. [Google Scholar] [CrossRef]
  27. He, H.; Chen, A.; Yin, M.; Ma, Z.; You, J.; Xie, X.; Wang, Z.; An, Q. Optimal Allocation Model of Water Resources Based on the Prospect Theory. Water 2019, 11, 1289. [Google Scholar] [CrossRef] [Green Version]
  28. Tian, J.; Guo, S.; Liu, D.; Pan, Z.; Hong, X. A Fair Approach for Multi-Objective Water Resources Allocation. Water Resour. Manag. 2019, 33, 3633–3653. [Google Scholar] [CrossRef]
  29. Wang, Z.; Yang, J.; Deng, X.; Lan, X. Optimal Water Resources Allocation under the Constraint of Land Use in the Heihe River Basin of China. Sustainability 2015, 7, 1558–1575. [Google Scholar] [CrossRef] [Green Version]
  30. Wang, H.; Yang, G.; Jia, Y.; Qin, D.; Gan, H.; Wang, J.; Han, C. Necessity and feasibility for an ET-based modern water resources management strategy: A case study of soil water resources in the Yellow River Basin. Sci. China Technol. Sci. 2009, 52, 3004–3016. [Google Scholar] [CrossRef]
  31. Liu, D.; Guo, S.; Liu, P.; Zou, H.; Hong, X. Rational Function Method for Allocating Water Resources in the Coupled Natural-Human Systems. Water Resour. Manag. 2019, 33, 57–73. [Google Scholar] [CrossRef]
  32. Lin, L.; Meng, W.; Jiao, B. Research on the Mechanism of Rational Allocation of Water Resources of International Rivers. Disaster Adv. 2013, 6, 480–489. [Google Scholar]
  33. Qi, S.; Wan, L.; Fu, B. Multisource and multiuser water resources allocation based on genetic algorithm. J. Supercomput. 2020, 76, 3222–3230. [Google Scholar] [CrossRef]
  34. Zuo, Q.; Li, W.; Zhao, H.; Ma, J.; Han, C.; Luo, Z. A Harmony-Based Approach for Assessing and Regulating Human-Water Relationships: A Case Study of Henan Province in China. Water 2021, 13, 32. [Google Scholar] [CrossRef]
  35. Zuo, Q.; Liu, H.; Ma, J.; Jin, R. China calls for human-water harmony. Water Policy 2016, 18, 255–261. [Google Scholar] [CrossRef]
  36. Ding, Y.; Tang, D.; Dai, H.; Wei, Y. Human-Water Harmony Index: A New Approach to Assess the Human Water Relationship. Water Resour. Manag. 2014, 28, 1061–1077. [Google Scholar] [CrossRef]
  37. Zuo, Q.; Zhao, H.; Mao, C.; Ma, J.; Cui, G. Quantitative Analysis of Human-Water Relationships and Harmony-Based Regulation in the Tarim River Basin. J. Hydrol. Eng. 2015, 20, 1118. [Google Scholar] [CrossRef]
  38. Zuo, Q.; Jin, R.; Ma, J.; Cui, G. Description and Application of a Mathematical Method for the Analysis of Harmony. Sci. World J. 2015, 2015, 831396. [Google Scholar] [CrossRef] [Green Version]
  39. Ding, Y.; Tang, D.; Wei, Y.; Yin, S. Urban-Water Harmony model to evaluate the urban water management. Water Sci. Technol. 2014, 70, 1774–1781. [Google Scholar] [CrossRef]
  40. Zhang, J.; Tang, D.; Ahmad, I.; Wang, M. River-human harmony model to evaluate the relationship between humans and water in river basin. Curr. Sci. 2015, 109, 1130–1139. [Google Scholar] [CrossRef]
  41. Ahmad, I.; Waseem, M.; Lei, H.; Yang, H.; Yang, D. Harmonious level indexing for ascertaining human-water relationships. Environ. Earth Sci. 2018, 77, 125. [Google Scholar] [CrossRef]
  42. Li, J.; Ma, J.; Yu, L.; Zuo, Q. Analysis and Regulation of the Harmonious Relationship among Water, Energy, and Food in Nine Provinces along the Yellow River. Water 2022, 14, 1042. [Google Scholar] [CrossRef]
  43. Li, X.; Li, H.; Liu, D.; Fu, Q.; Li, M.; Faiz, M.A.; Ali, S.; Li, T.; Khan, M.I. Connotation analysis and evaluation index system construction of regional agricultural soil and water resource composite system harmony. J. Clean. Prod. 2020, 263, 121438. [Google Scholar] [CrossRef]
  44. Ren, J.; Tang, D.; Wang, M.; Ding, Y.; Zhang, J. An Optimization Model for Water Resources Allocation Based on the Concept of Human Water Harmony Index. Fresenius Environ. Bull. 2017, 26, 3257–3267. [Google Scholar]
  45. Water Resources Department of Shandong Province. Water Resources Bulletin of Shandong Province 2021; China Water & Power Press: Beijing, China, 2021. (In Chinese) [Google Scholar]
  46. Golovina, E.; Pasternak, S.; Tsiglianu, P.; Tselischev, N. Sustainable Management of Transboundary Groundwater Resources: Past and Future. Sustainability 2021, 13, 12102. [Google Scholar] [CrossRef]
  47. Ilyushin, Y.V.; Asadulagi, M.A.M. Development of a Distributed Control System for the Hydrodynamic Processes of Aquifers, Taking into Account Stochastic Disturbing Factors. Water 2023, 15, 770. [Google Scholar] [CrossRef]
  48. Martirosyan, A.V.; Ilyushin, Y.V. Modeling of the Natural Objects’ Temperature Field Distribution Using a Supercomputer. Informatics 2022, 9, 62. [Google Scholar] [CrossRef]
  49. Asadulagi, M.M.; Vasilkov, O.S. The Use of Distributed and Lumped Type Controllers for the Hydro-lithospheric Process Control System of the Kislovodskoye Field. In Proceedings of the 2019 III International Conference on Control in Technical Systems (CTS), St. Petersburg, Russia, 30 October–1 November 2019; pp. 7–10. [Google Scholar] [CrossRef]
  50. Chen, H.; Xu, L.; Cao, Q.; Huang, M.; Song, M.; Quad, Q.; Liu, J. Coupling and metabolic analysis of urbanization and environment between two resource-based cities in North China. Peerj 2019, 7, e6869. [Google Scholar] [CrossRef]
  51. Golovina, E.; Shchelkonogova, O. Possibilities of Using the Unitization Model in the Development of Transboundary Groundwater Deposits. Water 2023, 15, 298. [Google Scholar] [CrossRef]
  52. Wang, W.; Tang, D.; Pilgrim, M.; Liu, J. Water Resources Compound Systems: A Macro Approach to Analysing Water Resource Issues under Changing Situations. Water 2016, 8, 2. [Google Scholar] [CrossRef] [Green Version]
  53. Chen, H.; Chen, M. Analysis of the Coupling Mechanism Between Economic System and Water Resource System in Jiangsu Coastal Area. J. Coast. Res. 2020, 109, 223–227. [Google Scholar] [CrossRef]
  54. Zhou, Y.; Huang, G.H.; Yang, B. Water resources management under multi-parameter interactions: A factorial multi-stage stochastic programming approach. Omega Int. J. Manag. Sci. 2013, 41, 559–573. [Google Scholar] [CrossRef]
  55. Zhang, L.; Li, C.Y. An Inexact Two-Stage Water Resources Allocation Model for Sustainable Development and Management Under Uncertainty. Water Resour. Manag. 2014, 28, 3161–3178. [Google Scholar] [CrossRef]
  56. Liu, X.M.; Huang, G.H.; Wang, S.; Fan, Y.R. Water resources management under uncertainty: Factorial multi-stage stochastic program with chance constraints. Stoch. Environ. Res. Risk Assess. 2016, 30, 945–957. [Google Scholar] [CrossRef]
  57. Contini, B.; Olivetti, I.; Milano, C. Techniques and Applications: A decision model under uncertainty with multiple payoffs. In Proceedings of the Symposium on Operations Research, Braunschweig, Germany, 3–6 September 1966; pp. 50–63. [Google Scholar]
  58. Han, Y.; Huang, Y.-F.; Wang, G.-Q.; Maqsood, I. A Multi-objective Linear Programming Model with Interval Parameters for Water Resources Allocation in Dalian City. Water Resour. Manag. 2011, 25, 449–463. [Google Scholar] [CrossRef]
  59. Huang, G.; Baetz, B.; Patry, G. Grey fuzzy integer programming: An application to regional waste management planning under uncertainty. Socioecon. Plann. Sci. 1995, 29, 17–38. [Google Scholar] [CrossRef]
  60. Binzhou Water Resources Bureau. Binzhou City Water Resource Planning (2020–2035); Shandong Science Technology Press: Jinan, China, 2021. (In Chinese) [Google Scholar]
  61. Zhou, M.; Chen, Q.; Cai, Y.L. Optimizing the industrial structure of a watershed in association with economic-environmental consideration: An inexact fuzzy multi-objective programming model. J. Clean. Prod. 2013, 42, 116–131. [Google Scholar] [CrossRef]
  62. Wang, W.; Zeng, W. Optimizing the Regional Industrial Structure Based on the Environmental Carrying Capacity: An Inexact Fuzzy Multi-Objective Programming Model. Sustainability 2013, 5, 5391–5415. [Google Scholar] [CrossRef] [Green Version]
Figure 1. Map showing the location of Binzhou.
Water 15 01388 g001
Figure 2. Structure of the regional water resource system.
Water 15 01388 g002
Figure 3. Flowchart of the IFMOP model solution steps.
Water 15 01388 g003
Figure 4. Water demand and water resource allocation in Binzhou in 2025.
Water 15 01388 g004
Figure 5. Water demand and water resource allocation in Binzhou in 2035.
Water 15 01388 g005
Figure 6. Radar chart comparison of the results of the HWRA and OWRA models.
Water 15 01388 g006
Table 1. Water resource allocation network structure of Binzhou in 2020.
Surface WaterYellow River Pilot WaterGroundwaterReclaimed Water
DomesticDomesticDomesticIndustry
EcologyEcologyIndustry
IndustryIndustryAgriculture
AgricultureAgriculture
Table 2. The water supply and water demand balance analysis of Binzhou for 2025 and 2035 (×108 m3).
2025Water supply capacitySurface waterYellow River pilot waterGroundwaterReclaimed waterTotalWater deficit
4.7612.70 1.21 0.32 18.99 0.10
Water demand capacityDomesticEcologyIndustryAgricultureTotal
3.17 0.83 3.51 11.57 19.09
2035Water supply capacitySurface waterYellow River pilot waterGroundwaterReclaimed waterTotalWater deficit
4.76 13.70 0.21 0.62 19.29 0.12
Water demand capacityDomesticEcologyIndustryAgricultureTotal
4.21 1.23 3.64 10.33 19.41
Table 3. Determination of the water use benefit coefficient (yuan/m3).
2025 Surface waterYellow River pilot waterGroundwaterReclaimed water
Domestic water[2000, 2500][2000, 2500][2000, 2500]0
Ecological water[550, 1000][550, 1000]00
Industrial water[550, 650][550, 650]0[550, 650]
Agricultural water[45, 50][45, 50][45, 50]0
2035 Surface waterYellow River pilot waterGroundwaterReclaimed water
Domestic water[2500, 3000][2500, 3000]00
Ecological water[850, 1300][850, 1300]0[850, 1300]
Industrial water[750, 950][750, 950]0[750, 950]
Agricultural water[55, 60][55, 60][55, 60][55, 60]
Table 4. Determination of the cost coefficient (yuan/m3).
2025 Surface waterYellow River pilot waterGroundwaterReclaimed water
Domestic water[2.5, 3.0][3.0, 3.5][2.5, 3.0]0
Eco-environmental water[2.5, 3.0][3.0, 3.5]00
Industrial water[3.5, 4.0][4.5, 5.0]0[1.5, 2.0]
Agricultural water[0.6, 0.9][0.7, 1.0][0.6, 0.9]0
2035 Surface waterYellow River pilot waterGroundwaterReclaimed water
Domestic water[3.5, 4.0][4.5, 5.0]00
Eco-environmental water[3.5, 4.0][4.5, 5.0]0[1.5, 2.0]
Industrial water[4.5, 5.0][5.5, 6.5]0[2.0, 2.5]
Agricultural water[0.8, 1.0][1.0, 1.2][0.8, 1.0][0.4, 0.5]
Table 5. Harmonious water resource allocation result for 2025 (×108 m3).
Domestic WaterEcological WaterIndustrial WaterAgricultural WaterTotal
Surface water[0.87, 0.89][0.11, 0.12][0.84, 0.88][2.85, 2.87][4.67, 4.76]
Yellow River pilot water[1.95, 1.99][0.70, 0.72][2.18, 2.31][7.40, 7.68][12.23, 12.70]
Groundwater[0.34, 0.37]00[0.83, 0.84][1.17, 1.21]
Reclaimed water000.3200.32
Water supply[3.17, 3.26][0.82, 0.84][3.34, 3.51][11.08, 11.38][18.41, 18.99]
Water demand3.170.833.5111.5719.08
Water deficit[−0.09, 0][−0.01, 0.02][0, 0.17][0.19, 0.49][0.09, 0.68]
Water deficit ratio (%)0[0, 2.16][0, 4.75][1.65, 4.23][0.51, 3.54]
Table 6. Harmonious water resource allocation results for 2035 (×108 m3).
Domestic WaterEcological WaterIndustrial WaterAgricultural WaterTotal
Surface water[0.88, 0.92][0.12, 0.14][0.83, 0.86][2.83, 2.84][4.66, 4.76]
Yellow River pilot water[3.33, 3.39][0.93, 0.98][2.30, 2.52][6.64, 6.81][13.20, 13.70]
Groundwater0000.210.21
Reclaimed water0[0.18, 0.19][0.33, 0.36][0.05, 0.07][0.56, 0.62]
Water supply[4.21, 4.32][1.23, 1.30][3.46, 3.73][9.73, 9.93][18.63, 19.28]
Water demand4.211.233.6410.3319.40
Water deficit[−0.11, 0][−0.07, 0][−0.10, 0.15][0.39, 0.59][0.11, 0.744]
Water deficit ratio (%)00[0, 4.26][3.82, 5.75][0.58, 3.95]
Table 7. Comparison of the results of the OWRA and HWRA models for 2025 and 2035.
YearDomestic Water Deficit (108 m3)Ecological Water Deficit (108 m3)Industrial Water Deficit (108 m3)Agricultural Water Deficit (108 m3)Economic Benefit of Water Supply (CNY 1011)Sewage Discharge (108 m3)
OWRAHWRAOWRAHWRAOWRAHWRAOWRAHWRAOWRAHWRAOWRAHWRA
20250.00 −0.09 0.07 −0.01 0.01 0.00 0.02 0.19 0.26 0.27 0.26 0.18
20350.00 −0.11 0.08 −0.07 0.01 −0.10 0.02 0.39 0.30 0.32 0.37 0.16
Disclaimer/Publisher’s Note: The statements, opinions and data contained in all publications are solely those of the individual author(s) and contributor(s) and not of MDPI and/or the editor(s). MDPI and/or the editor(s) disclaim responsibility for any injury to people or property resulting from any ideas, methods, instructions or products referred to in the content.

