Article

Compilation of Water Resource Balance Sheets under Unified Accounting of Water Quantity and Quality, a Case Study of Hubei Province

1
School of Economics and Management, China Three Gorges University, Yichang 443002, China
2
School of Business, Hohai University, Nanjing 211100, China
3
Department of Architecture Science, Toronto Metropolitan University, Toronto, ON M5B 2K3, Canada
4
School of Law and Public Administration, China Three Gorges University, Yichang 443002, China
*
Author to whom correspondence should be addressed.
Water 2023, 15(7), 1383; https://doi.org/10.3390/w15071383
Submission received: 11 February 2023 / Revised: 20 March 2023 / Accepted: 29 March 2023 / Published: 3 April 2023
(This article belongs to the Section Water Resources Management, Policy and Governance)

Abstract

:
This article discusses the issues caused by traditional water resource development and utilization, as well as policy issues in China that have led to a water crisis. The article proposes a theoretical approach along with a quantitative accounting of water resources, in order to solve these problems. To improve the value accounting method for water resources, the study focuses on a unified accounting perspective of water quantity and quality, allowing for an evaluation of water use efficiency and quality. The study uses prefecture-level cities in Hubei Province as a case study and finds that the water use efficiency of these cities has constantly improved, while water quality has shown an annual improvement. Water resource assets, liabilities, and net assets have increased, but with fluctuations. The study shows differences in water resource assets, liabilities, and net assets in the eastern, central, and western regions of Hubei Province. The unified accounting perspective of water quantity and quality provides a new idea and method for the preparation of water resource balance sheets and will effectively improve the management level and efficiency of water resources.

1. Introduction

Water, as one of the most widely distributed substances on earth, exists almost everywhere and plays a vital role for both the environment and humanity [1]. However, rapid population growth, and increasingly rapid urbanization, continued economic development, unprecedented technological innovations, drastic land cover alterations, and climate change have led to a global water supply crisis [2]. Presently, the sustainability of water resource utilization has become a global issue that, if not controlled, will eventually pose a serious threat to human health and survival [3]. Therefore, the evaluation of the development and sustainability of regional water resources has become an issue that scientists worldwide have relentlessly explored [4]. China’s water resources are currently under pressure as a water-scarce country in terms of water resources per capita [5]. Subsequently, various Chinese regions have started to compile water resource balance sheets on a pilot program basis [6]. This process helps to facilitate local governments in counting the changes in the quantity and stock of water resource assets while evaluating the level of regional water resource asset management [7,8]. However, because of the lack of a basis for identifying and accounting for the elements of the water resource balance sheet, the establishment of a systematic and standardized method for preparing the water resource balance sheet is a practical problem that needs to be solved [9]. As a result, scholars have studied water resource balance sheets in terms of both theoretical research and practical application [10].
In terms of theoretical research, the fuzzy comprehensive evaluation method that considers water quantity and quality has become the main method for scholars to measure the value of water resources. Jia [11] used a fuzzy mathematical model to dynamically evaluate the value of water resources from three aspects: (1) water resources, (2) water quality, and (3) socioeconomic conditions in Nanjing from 2011 to 2015. Regarding natural, economic, and social factors as a breakthrough, Li [12] applied the fuzzy comprehensive evaluation model to appreciate the water resource value of the Hani Terrace. Adopting water quality, water resources, population density, and national income as evaluation factors, Cai [13] determined the value of water resources in Chengdu by using a fuzzy comprehensive evaluation method. From the perspective of natural, social, economic, and ecological environmental factors that affect the value of water resources from the perspective of high-quality development, Li [14] determined the value of water resources in Hubei Province using fuzzy mathematics. Zhao and Chen [15] utilized the fuzzy pricing model of urban water resources to capture the value of water resources in Jinan City, China. Since uncertainty exists in the fuzzy integrated evaluation method, and the energy analysis theory [16] addresses this issue successfully because of its definition of uniform criteria, an increasing number of scholars are adopting the emergy analysis method to value water resources. Taking the Yellow River Basin as the research object, Wang [17] calculated the value of water resources in the agricultural system by applying the emergy theory and method, followed by the study of spatial distribution characteristics and influencing factors of water resource value in the agricultural system, using the spatial autocorrelation analysis method and spatial regression model. Based on the water resource system, Wang and He [18] systematically explored the quantity evaluation of groundwater resources using the emergy analysis method for ecological economics, constructing a framework for the emergy evaluation of groundwater resources. According to the principle of mutually beneficial equilibrium, Zhang [19] estimated the value of water resources in Ordos on the south bank of the Inner Mongolia Autonomous Region based on the emergy theory, and then proposed a pricing model for transfers of water rights from agriculture to industry in water-deficient areas of China. In terms of agricultural, industrial, domestic, and recreational sectors, Guan [20] estimated the value of water resources in the Xiaohong River Basin by the emergy analysis theory.
In terms of practical applications, derived from the accounting of water resource assets and liabilities, scholars have made a series of research results in the compilation of water resource balance sheets based on the system of environmental–economic accounting and the system of water environmental–economic accounting. Based on accounting and statistics, Qin et al. [21] proposed a balance sheet structure for water resources, which accounted for water resource assets and liabilities. Utilizing accounting and statistical accounting principles, Jia et al. [22] proposed water resource balance sheet accounting. Zhou et al. [23] constructed a physical water accounting system for vouchers, books, and statements. Tian et al. [24] designed a physical quantity accounting table and value-type balance sheet for water resources. Jian et al. [25] established an accounting framework for multi-attribute water resource assets and liabilities. Jiao et al. [26] maintained that the preparation of a water resource balance sheet should consider the accounting object and measurement method. Using the environmental replacement cost method, Liu [27] explored accounting for the value of water resource liabilities and compiled a water resource balance sheet. Taking the Yangtze River Basin as the research object, Tang et al. [28] used a case analysis method to analyze the preparation method and procedure for the water resource balance sheet, which fully demonstrated the preparation process of the water resource balance sheet. Focusing on the protection of the water environment in public project governance, Liu and Miao [29] linked project governance with the water resources balance sheet and conducted research based on this aspect. Predicated on the water resource accounting theory and Australian water accounting standards, Hong [30] developed an accounting framework for China’s water resource accounting entity. Li and Song [31] conducted statistics on the quantity and value of water resource assets and liabilities in the Tibet Autonomous Region, forming a system of base table-auxiliary, table-main, and table-total tables. The preparation of a water resource balance sheet further strengthened the accounting and management of water resources, provided a basis for water resource protection, which was conducive to transforming economic development, and guided economic development towards green and sustainable development.
The above research explores the theory and application of water resource asset accounting. In theory, based on the concept and connotation of water resource assets and liabilities, the accounting method is proposed. In terms of application, specific preparation work was conducted using the water balance sheet framework. However, the current research needs to be further developed in the following aspects: (1) The current accounting methods often focus on the value of water resources, and the majority do not consider water use efficiency. The integrated water use efficiency reflects the different results of water resource utilization caused by the differences between industrial and water use structures, and how that affects water resource assets and liabilities. (2) Few studies have investigated the impact of water quality accounting. When water quantity and water use efficiency are constant, water quality levels are higher and the corresponding assets are higher. Studying only water quantity and water use efficiency, while neglecting the economic benefits of water quality, results in an inaccurate calculation of water resource assets and liabilities. This leads to a lack of rigor and integrity in the study of water resource balance sheets. Consequently, comprehensive water use efficiency has become a key factor in measuring water resource assets and liabilities, and it is also necessary to consider water quality when calculating the value of water resource assets and liabilities. In summary, this study proposes the improved four-stage DEA model to calculate the comprehensive water use efficiency coefficient, determines the comprehensive water quality coefficient according to the water quality grade, and then utilizes the comprehensive water use efficiency, comprehensive water quality coefficient, and their respective weights to determine the comprehensive coefficient of assets and liabilities. Simultaneously, it measures the size of water resource assets based on the correlation between water use and efficiency, and finally compiles the water resource balance sheet. Moreover, from the perspective of unified accounting of water quantity and quality, the concepts, connotations, and methods of calculating the comprehensive water use efficiency coefficient, the comprehensive water quality coefficient, and comprehensive coefficient are proposed and explained. Furthermore, calculation methods for water resource assets, liabilities, and net assets are addressed. Finally, a calculation system for water resource assets and liabilities for the unified accounting of water quality and quantity is constructed, which improves the accounting method for water resources, lays the foundation for the institutionalization and proceduralization of the water resource balance sheet, and highlights the direction of efforts for innovative water resource management methods.

2. Methods

2.1. Influencing Factors of Water Resource Assets and Liabilities

Water resources play an essential role in the agricultural, industrial, and service sectors. As an influential factor in the measurement of water resource assets and liabilities, water use efficiency can better reflect the social and ecological value of water resources. In terms of water resource attributes, water quantity and quality are two key elements in evaluating water resources, which will inevitably have an impact on water resource assets and liabilities. In summary, the factors influencing water resource assets and liabilities are discussed in the following sections.

2.1.1. Industrial Structure and Water Use Structure

The quantity and quality of water resources play a positive role in promoting agriculture and industry, including social and economic development [32]. Under the condition that the amount of water cannot be enhanced, adjusting the industrial structure or improving the efficiency of water use to solve the contradiction between water resources and economic development is imperative for achieving sustainable economic development and continuous improvement of efficiency [33]. In effect, there is a close relationship between industrial and water resource consumption structures. Given that the changes in industrial structure led to corresponding changes in the consumption of water resources, under the condition of equal amounts of water, economic benefits can be achieved by increasing the proportion of industrial structures that consume less water [34]. In addition, industrial water use efficiency is also an important factor affecting economic benefits. Under the condition of equal water volume, the higher the industrial water use efficiency, the higher the number of industrial benefits, and cities with a high level of socioeconomic development tend to have high water use efficiency. [35].

2.1.2. Comprehensive Water Use Efficiency

Owing to the multiple functions of water resources, they perform diverse roles in economic development, thus forming a close relationship with economic development. In practice, the role of water resources in the economy is principally manifested in various water activities in the production activities with agriculture and industry, and the outcome is demonstrated by the creation of a certain output in the area. For a certain region, in terms of agriculture, the grain produced by agriculture is indispensable to the role of water, and the consumption of water is tremendous, whereas the unilateral water used in agriculture can only achieve lower economic benefits [36,37,38]. Due to the direct or indirect use of water resources in all aspects of industrial production, such as the use of water resources in the industry, considering the different water consumption levels of light and heavy industries, the economic benefits of unilateral water resources also differ [39,40,41,42]. In summary, for the same region, the output value of unilateral water resources may vary; for different regions, the same output value of unilateral water resources may also vary, and the difference in output value results can be attributed to the difference in water use efficiency. Incorporating water resources into various industries permits the water use efficiency of each industry to be acquired, and the comprehensive water use efficiency can be obtained by combining that of all industries. Comprehensive water use efficiency can objectively, truly, and accurately reflect the different results of water resource utilization, which are caused by the difference between industrial and water use structures [43]. Therefore, comprehensive water use efficiency has become a critical element affecting the level of water resource assets and liabilities.

2.1.3. Water Quality and Quantity

The total amount of water resources in China is relatively high, however, due to the large population, there are significantly lower per capita water resources, and the geographical distribution of water resources is higher in the south and lower in the north. Surprisingly, the distribution of precipitation is abundant in the south and deficient in the north, and the overall distribution is highly uneven. In this context, water quantity has become the most direct indicator of water resource assets and liabilities [44]. However, the acceleration of industrialization, agricultural modernity, and urbanization places a heavier burden on the water supply environment. Furthermore, water quality has deteriorated over time, pollution is a common phenomenon, and water resource security is under threat. According to existing national standards, water for production and living water must adhere to water quality requirements. It is well known that low-quality water is not useful for human consumption. Since the use of water is connected to the economy, the higher the water quality grade, the higher the number of economic benefits that can be generated [45]. Consequently, water quality ratings affect water resource assets and liabilities.

2.2. Construction of Water Use Efficiency Assessment Model

The Data Envelopment Analysis (DEA) has the following characteristics: outcomes are not easily affected by subjective factors, the operation is relatively simple, the improvement scheme of the decision-making unit can be proposed according to the results, and scholars tend to adopt this approach when evaluating the utilization efficiency of water resources. However, the traditional DEA efficiency measurement model ignores the interference of environmental and random error factors on the efficiency measurement to a certain extent, and the improved four-stage DEA model compensates for the defects in this regard. Consequently, this study used a four-stage DEA model based on the BCC model to calculate comprehensive water use efficiency.
(1)
The first stage uses the DEA-BCC model to measure the initial efficiency
The BCC model measures the efficiency value of the decision-making unit under the condition of variable returns to scale (VRS), which is the VRS hypothesis. The principle of the input-oriented BCC model is as follows.
First, assume that there are n decision units, and each decision unit ( D M U j ) has m different types of inputs and s different types of outputs. The input variables are measured by X j , and the output variables are measured by Y j . X i j > 0 represents the input value of type i of decision unit j , and Y r j > 0 represents the output value of type r of decision unit j . For each decision unit, the input-oriented DEA-CCR model is as follows:
min [ θ ε ( j = 1 m s + j = 1 s s + ) ] { j = 1 n λ j x j + s = θ x j j = 1 n λ j x j + s + = y j i = 1 n λ j = 1 , λ j > 0 , s j , s r + > 0 , j = 1 , 2 , , n
where θ represents the effective value of the decision unit; s + and s are slack variables; and ε is the stochastic perturbation term. Convexity constraint j = 1 n λ i = 1 allows the BCC model to have variable returns to scale. The DEA-BCC model can be used to measure the comprehensive efficiency of each decision unit. If θ = 0 , s + and s are 0, the decision-making unit is DEA-effective, and the water use efficiency of the decision unit meets both technical and scale efficiency. If θ = 0 and s + 0 or s 0 , then the decision unit is weakly DEA-efficient, the water use efficiency of the decision-making unit cannot meet the best scale and technical efficiency. Simultaneously, if θ < 1 , the decision unit is DEA-invalid, and the water use efficiency of the decision unit is neither the best technical efficiency nor the best scale. Using this method, the water use efficiency value of each region can reflect the change in the efficiency of each sample after achieving efficiency. However, the slack variables obtained in the first stage are truncated, and the use of the SFA model leads to inconsistent parameter estimations. Therefore, it is necessary to conduct a second-stage Tobit analysis to reduce the impact of environmental factors on efficiency measurement.
(2)
The second stage uses the Tobit model to avoid the estimated parameters of zero error.
The slack variables obtained in the first stage have a truncated situation, and the use of the SFA model induces inconsistent parameter estimation. Accordingly, it is necessary to adopt the Tobit model in the second stage to adjust the original input factors in the first stage to perform more scientific efficiency measurements. In the first stage, the total slack of each decision unit, which includes ray slack and non-ray slack, is obtained while obtaining the efficiency value of each decision unit, which is the difference between the actual input factor value of each decision unit and the minimum input value on the production frontier. Meanwhile, when the relaxation of the input is positive, this indicates that the input slack is s + 0 ; thus, the input relaxation value belongs to the truncated data. The Tobit model could effectively break through the calculation range limitation of the traditional ordinary least squares regression model [46]. Therefore, the Tobit model is applied to environmental factors that interfere with the efficiency of decision units. The water efficiency variables in this paper have a range between 0 and 1 after processing, and the limitation of the calculation range of the traditional least squares model will lead to a deviation in the results from the true values. Therefore, it is more appropriate to implement the Tobit model, in which the explanatory variables are the slack amounts of each input factor of the decision unit; thus, a total of N Tobit models are established, J environmental factor variables are selected as explanatory variables, and then Tobit regression analysis is performed on the total input slack of each decision unit, which is called the input redundancy value. The model is:
Y i = f ( X i j , β i j ) + μ i j
where i = 1 , n ;   j = 1 , m ;   Y i represents the water use efficiency value of city i , X i j is the j-th environmental variable affecting the water use efficiency value of city i , and μ i j is the random error term.
(3)
The third stage involves building a similar stochastic frontier analysis (SFA) model.
The model used in the first stage of calculation does not consider the influence of random error and environmental variables on the water use efficiency value. Consequently, the calculated efficiency value is different from the actual circumstance, and the random error term and environmental variables that affect the efficiency value are not removed in the calculation process in the first stage. Thus, in the calculation process with the second stage, the SFA model was used to measure the redundancy, environmental variables, and random error terms in the calculation process of the first stage, and then the input variables were adjusted again.
In the third stage, the slack variable [ x X λ ] can capture the initial inefficiency, which comprises environmental factors, management inefficiency, and statistical noise. Moreover, the main goal in the third stage is to decompose the slack variables of the first stage into the above three effects, which can only be achieved with the help of SFA regression, where the slack variables of the first stage are regressed on the environmental variables and mixed error terms. Hence, the SFA-like regression function with the input orientation is as follows [47]:
S n i = f ( Z i ; β n ) + ν n i + μ n i ; i = 1 , 2 , , I ; n = 1 , 2 , , N
where S n i is the relaxation value of the n-th input of the i-th decision unit; Z i is the environmental variable; β n is the coefficient of the environmental variable; ν n i + μ n i is the mixed error term; ν n i represents random interference; and μ n i represents management inefficiency. v N ( 0 , σ v 2 ) is the random error term, and represents the impact of random disturbance factors on input slack variables, and μ is management inefficiency and represents the influence of management factors on the input slack variable, assuming that it obeys the normal distribution truncated at the zero point, namely μ N + ( 0 , σ μ 2 ) .
The purpose of the SFA regression is to exclude the effect of environmental and stochastic factors on the efficiency measure to adjust all decision units in the same external environment. The adjustment formula is as follows:
X n i A = X n i + [ max ( f ( Z i ; β n ) ) f ( Z i ; β n ) ] + [ max ( ν n i ) ν n i ]   i = 1 , 2 , , I ; n = 1 , 2 , , N
where X n i A is the adjusted input, X n i is the input before the adjustment, max ( f ( Z i ; β n ) ) f ( Z i ; β n ) is to adjust the external environmental factors, max ( ν n i ) ν n i is to put all decision-making units to the same luck level.
The calculation of the random error terms ( ν ) is complex, and the steps are as follows:
The first step is to separate management inefficiency, μ .
Based on Jondrow et al. [48], this study deduced a separation formula as follows:
E ( μ | ε ) = σ [ ϕ ( λ ε σ ) Φ ( λ ε σ ) + λ ε σ ]
where σ * = σ μ σ ν σ , σ = σ μ 2 + σ ν 2 , and λ = σ μ / σ ν .
In the second step, the random error term is calculated as follows:
E [ v n i | v n i + m n i ] = s n i f ( z i ; b n ) E [ u n i | v n i + m n i ]
(4)
The fourth stage involves the DEA model after the input-value adjustment.
In this study, the adjusted input data and output data applied in the first stage were incorporated into the model again for calculation, thus yielding the water use efficiency values for each city after excluding the environmental and random factors.
This paper selects the total annual fixed asset investment (in billions of yuan), the employed population (ten thousand people) and the total water consumption (in billion m3) of the cities in Hubei Province as the input indicators, and the GDP (in billions of yuan) as the output indicators. Furthermore, there are many factors affecting the efficiency of water resource utilization, among which, the factors that are beyond the subjective control of the decision-making unit in a short period of time are external factors, also known as environmental factors. This study selected the environmental variables affecting regional water use efficiency which primarily include industrial structure, the natural environment, and the economic development level as environmental variables [49,50]

2.3. Construction of Comprehensive Water Quality Coefficient Measurement Model

The degree of water quality can be reflected by the water quality coefficient, and the water quality affects the scope of water use. In consideration of the actual use of water resources, water of level 3 quality will have reached the standard, in line with the economic level requirements, thereby meeting the needs of production and life [51]. Consequently, according to existing Chinese standards, the water quality grade and water quality coefficient can be one-to-one corresponding to the following linear piece-wise function: when the water quality level is 1, the water quality coefficient value is 1; when the water quality level is 3, the water quality coefficient value is 0.9; when the water quality level is less than 5, the water quality coefficient value is 0. The other water quality grades were assigned using the linear interpolation method. The results are shown in Figure 1.
The comprehensive water quality coefficient represents the overall water quality of the region and affects the level of the water resource assets. Under equal water quantity, the higher the proportion of high-grade water quality, the higher the comprehensive water quality coefficient, and the higher the value of water resources assets; the greater the proportion of low-grade water quality, the lower the comprehensive water quality coefficient, and the lower the value of water resources assets. Water resources are largely stored in rivers, lakes, and reservoirs where they are divided into water functional areas, and these areas are used as the basis for regional water quality evaluation. Simultaneously, considering the number and quantity of water functional areas, the sum of the product of the proportion of water functional areas with different water quality grades and their corresponding annual average water quantity and water quality coefficient is taken as the comprehensive water quality coefficient of the area, which is expressed by C F s , as shown in Equation (7).
C F s = k = 1 6 F k F × W k ¯ × C k W ¯
where C F s represents the comprehensive water quality coefficient of the regional water function area and F k represents the number of water functional areas corresponding to the k-th type of water. When k = 1, …, 6, it represents classes I, II, III, IV, V, and inferior V water, respectively. F represents the total number of water function zones; W k ¯ represents the annual average water volume of the water function area corresponding to Class I water; W ¯ represents the water quality coefficient corresponding to the k-type water; and C k represents the total amount of water in the water function area for the year.

2.4. Construction of Water Resource Assets and Liabilities Measurement Model

The comprehensive water use efficiency coefficient was applied to appraise the level of water use efficiency, and the comprehensive water quality coefficient was used to judge the quality of water. The comprehensive coefficient integrates the comprehensive water use efficiency and comprehensive water quality coefficients to reflect the dual role of the two, which is divided into the asset comprehensive coefficient and liability comprehensive coefficient. Subsequently, considering the economic benefits that can be generated by the investment of water resources in the industry, the size of water resource assets and liabilities is measured based on the correlation between water use and benefits. Therefore, in order to obtain the value of water resource assets and liabilities, a certain unilateral water output value standard is stipulated, and this is used as a single-party water resource asset and liability which is apportioned by the coefficient.

2.4.1. Asset Composite Coefficient

The asset comprehensive coefficient refers to the water efficiency and water quality under the combined effect of positive results, and can be utilized to indicate the level of government management, including water use and water quality management. The higher the asset comprehensive coefficient, the higher the level of water use, and the better the management level of water quality, whereas the lower the asset comprehensive coefficient, the lower the level of water use, and the less efficient the management level of water quality. For this reason, this study obtained the comprehensive coefficient of assets through the weighted average of the comprehensive water use efficiency and comprehensive water quality coefficients, which is designed to demonstrate the dual effect of the comprehensive water use efficiency and the comprehensive water quality condition, as shown in Equation (8). The weight assignment above was judged based on the significance of the water use efficiency and water quality conditions. Theoretically, water use efficiency and water quality are equally important.
C A = A a × q a + C F s × q F s
where C A represents the comprehensive coefficient of assets; A a represents the comprehensive water use efficiency coefficient; q a represents the weight of the comprehensive water use efficiency coefficient; C F s represents the comprehensive water quality coefficient; and q F s represents the weight of the comprehensive water quality coefficient.

2.4.2. Comprehensive Coefficient of Liabilities

Based on the comprehensive coefficient of assets, the comprehensive coefficient of liabilities refers to the negative effect of the combined effect of water efficiency and water quality, which reflects the actual comprehensive water use efficiency and comprehensive water quality. Since the asset comprehensive coefficient is 1 when comprehensive water use efficiency is the most advanced and water quality is the best, the debt comprehensive coefficient is equal to the difference between 1 and the asset comprehensive coefficient. The calculation is given by Equation (9).
C A = 1 C D
where C A represents the comprehensive coefficient of liabilities and C D represents the comprehensive coefficient of assets.

2.4.3. Water Resource Asset Calculation Method

Based on a comprehensive reference to various calculation methods, this study considers the economic benefits that can be generated by water resource input industries and measures the size of water resource assets based on the correlation between water use and benefits. Therefore, a unilateral water output value standard is stipulated, which is used as a single-party water resources asset, and the coefficient is allocated to obtain the value of water resources assets. The calculation content is mainly divided into two parts: the calculation of unilateral water resource assets and the calculation of the comprehensive coefficient. The process of calculating single-party water resources assets is as follows: regardless of the region, GDP and water consumption data are combined to obtain the total output value and total water consumption to calculate the unilateral water output value; that is, unilateral water resource assets are calculated as water resource assets and liabilities, and the comprehensive coefficient is calculated as follows. The comprehensive coefficient of assets comprises two parts: the comprehensive water use efficiency coefficient and comprehensive water quality coefficient. The comprehensive water use efficiency coefficient reflects the level of the comprehensive utilization efficiency of water resources, the comprehensive water quality coefficient reflects the quality of water resources, and the water quality of the water function area represents the water quality of the entire area. Finally, the total assets of water resources are equal to the product of unilateral water resource assets and total water resources, the asset comprehensive coefficient, and the water allocation coefficient, as shown in Equation (10).
A t o t = V s a d v × W t o t × C A × C w
where A t o t represents the total assets of water resources; V s a d v represents unilateral water resource assets; W t o t represents total water resources; C A represents the comprehensive coefficient of assets; and C w represents the allocation coefficient of water, which is taken as 0.05 [44].

2.4.4. Method of Calculating Water Resource Liabilities

Water resource liabilities can be categorized into two parts: (1) the actual water quality and the ideal water quality differences arising from the liabilities, called water quality liabilities; (2) the debt caused to a certain degree from the waste of water resources due to low water use efficiency, called water debt. According to the actual situation of existing water resources, the water quality levels of different water function areas in the region are quite different, and none have reached the ideal water quality level. Hence, the liabilities generated by the former are certain to exist, while the latter is closely related to the comprehensive water use efficiency coefficient, and the liabilities arising from the latter will only occur for water resources that have not reached the water use level. Consequently, water resources that reach the water level will only generate water quality liabilities, whereas water resources that do not reach the water level will generate both water quality and water use liabilities. Finally, the total liability of water resources is equal to the product of the unilateral liability of water resources and the total amount of water resources, the comprehensive coefficient of liabilities, and the apportionment coefficient of water, in which the comprehensive coefficient of liabilities is the difference between 1 and the comprehensive coefficient of assets, as detailed in Equation (11).
L t o t = V s a l v × W t o t × C D × C w
where L t o t represents the total liabilities of water resources; V s a l v represents unilateral water resource liabilities; W t o t represents total water resources; C D represents the comprehensive coefficient of liabilities; and C w represents the allocation coefficient of water, which is taken as 0.05 [44].

2.4.5. Method of Calculating Net Assets of Water Resources

The net assets of water resources are the difference between the total assets of water resources and their total liabilities. If net assets N t o t > 0 , the total assets of water resources are greater than the total liabilities, which means that water resources play a positive role in fostering economic development. If net assets N t o t 0 , it means that the total assets of water resources are less than or equal to the total liabilities. The net assets of water resources are calculated by Equation (12).
N t o t = A t o t L t o t
where, N t o t represents the net assets of water resources.

3. Case Study

3.1. Research Area

Hubei Province, located in the south-central region of China, and in a territory of rivers and lakes, is very rich in water resources. The Yangtze River, from west to east, flows in total through 26 counties and cities in the province, west of Badong County, the Bianyu River estuary entry, east to Huangmei Binjiang exit, and proceeds 1031 km across the southern province. The main tributaries of the Yangtze River in the Hubei Province are the Hanjiang, Jushui, Zhangshui, Dongjing, Lushui, and Qingjiang rivers. There are 41 rivers of a length of more than 100 km, and 4228 rivers of a length of more than 5 km in the province. Simultaneously, Hubei Province is known as the “province of thousands of lakes”, and many lakes are concentrated between the Yangtze River and Han River. There are 6,275 reservoirs in Hubei Province, including 69 large and 280 medium-sized reservoirs, and the total reservoir capacity ranks first in the country. In addition, the total amount of water resources in Hubei Province is large. These reasons lead to the obvious impact of economic development, water quality, and water quantity on water resource assets in Hubei Province. Therefore, it is crucial to construct a water resource assets and liabilities calculation system for the unified accounting of water quality and quantity as well as improve the water resource accounting method. Taking Hubei Province as the research object, this study constructs a calculation model of water resource assets and liabilities based on the unified accounting of water quality and quantity, and on studies the regional differences in water resource assets and liabilities in Hubei Province from 2011 to 2020. The map of Hubei Province is shown in Figure 2.

3.2. Data Sources

The original data in the calculation process of this study came from the statistical yearbook of each prefecture-level city in Hubei Province from 2011 to 2020, the statistical bulletin of the Chinese economic and social development of each prefecture-level city, the water resources bulletin of Hubei Province from 2011 to 2020, and the ecological environment bulletin [51].

3.3. Results

3.3.1. Assessment of Comprehensive Water Use Efficiency in Hubei Province

Using the four-stage DEA model by Equations (1)–(6), the comprehensive water use efficiency coefficients of prefecture-level cities in Hubei Province from 2011 to 2020 are shown in Table 1.
According to Table 1, from a temporal perspective, the gap between the efficiency values of various prefecture-level cities from 2011 to 2020 has gradually widened, indicating that, under the pressure from China’s rapid economic development, the efficiency of water resources utilization in various regions in China has shown different development trends, and the efficiency of water resource utilization. The gap between regions and lower regions is growing. The number of prefecture-level cities that achieve DEA efficiency dropped from 7 in 2000 to 3 in 2011. Xiantao, Qianjiang, Yichang, and Xiangyang have been eliminated from the list of DEA-effective prefecture-level cities, indicating that in the past 10 years of development, there has been a certain degree of deviation from the optimal allocation of water resources, which is out of the ranks of relatively optimal water resource utilization efficiency. The water use efficiency of Huangshi, Shiyan, Yichang, Ezhou, Jingmen, Xianning, Qianjiang, and Tianmen decreased significantly, indicating that the water use efficiency decreased significantly compared with other prefecture-level cities in the development process. The possible reason is that there are problems in the allocation of capital, labor, and water resources in the development process in recent years, which deviates from the direction of optimal allocation. At the same time, the water use efficiency of Suizhou and Shenlongjia has increased, which shows that in the process of development, the allocation of resources has been continuously optimized, the utilization of water resources has become more reasonable, and the water use efficiency has been continuously improved compared with other prefecture-level cities.
From the perspective of prefecture-level cities, from 2000 to 2011, only Wuhan, one of the 17 prefecture-level cities in Hubei Province, has had an efficiency value of 1 over the years, which is at the efficiency frontier. It shows that Wuhan has the highest level of water resource utilization efficiency in Hubei Province, and that Wuhan is the most economically developed area in Hubei Province. The infrastructure’s construction is relatively perfect, and the technical levels and management concepts are more advanced, which may be the reason for its efficient use of water resources. The other 16 prefecture-level cities have room for improvement in comprehensive water use efficiency. In comparison, the comprehensive water use efficiency coefficient values of Wuhan, Yichang, Xiangyang, and Jingzhou are much higher than those of other cities. These four cities are representative cities with rapid economic development and play a leading role in the long-term rapid economic development of Hubei Province; on the contrary, for the Shenlongjia forest area, the particularity of its geographical location, the low level of economic development, the relatively single industrial structure, and the small amount of water resources may be the reasons for the lack of water resource efficiency. However, its water resource utilization efficiency has room for improvement, and it should become a key control area for the optimal allocation of water resources in the future.
From a regional perspective, the comprehensive water use efficiency of eastern, central, and western Hubei Province shows obvious differences, but the overall trend is downward. The changing trend of the three regions was the same during the study period, and was also consistent with the changing trends of the whole province. The regional difference model of comprehensive water use efficiency is roughly the same as the economic level difference model. The economy of the eastern region is relatively developed, the market mechanism is relatively perfect, market competition is relatively fierce, and the resource input has changed to intensive, while the economic development level of the western region is relatively low, the utilization efficiency of water resources is low, and there is a large amount of redundant water resource inputs. The western and central regions need to give full play to their advantages, accelerate infrastructure construction, optimize industrial structure, improve the production level, govern the ecological environment, and gradually narrow the gap with the eastern region.

3.3.2. Calculation of Comprehensive Water Quality Coefficients of Hubei Province

The water functional areas of the 17 prefecture-level cities in Hubei Province were integrated, and their comprehensive water quality coefficients from 2011 to 2020 were calculated using Equation (7). According to the available measured data, this study only considered the comprehensive water quality of the surface water resources. The results are presented in Table 2.
According to Table 2, from a temporal perspective, the water quality coefficient of each prefecture-level city did not fluctuate significantly from 2011 to 2020. After the country put forward the development concept that lucid waters and lush mountains are invaluable assets, various regions of Hubei Province began to pay attention to environmental protection while developing the economy, thereby improving the comprehensive water quality coefficient of various prefecture-level cities in Hubei Province over time.
From the perspective of each prefecture-level city, from 2000 to 2011, among the 17 prefecture-level cities in Hubei Province, the comprehensive water quality coefficient of Xianning, Yichang, Shiyan, Enshi Autonomous Prefecture, and Shenlongjia forest area is the highest, in a range between 0.75 and 0.85, while the comprehensive water quality coefficient of Xiantao, Tianmen, and Qianjiang is the lowest, in a range between 0.5 and 0.6. This is due to Wuhan, Yichang, Shiyan, Enshi Autonomous Prefecture, and the Shenlongjia forest area over the past ten years paying attention to environmental protection, and maintaining the ecological environment, and because of their low levels of economic development, Xiantao, Tianmen, and Qianjiang are developing their economies at the expense of environmental protection.
From a regional perspective, the comprehensive water quality coefficients of eastern, central, and western Hubei Province show significant differences. Due to the influence of its geographical environment, the western region has a good ecological environment. The comprehensive water quality coefficient is significantly higher than that of the central and eastern regions, and even the national average is higher than that of the central and eastern regions.

3.3.3. Calculation of Water Resource Assets and Liabilities in Hubei Province

Combining the relevant literature, this study believes that the comprehensive water use efficiency and comprehensive water quality coefficients are equally important, and their weights are 0.5 and 0.5, respectively. Equation (8) is used to calculate the asset comprehensive coefficient of the 11 prefecture-level cities in Hubei Province from 2011 to 2020. The results are presented in Table 3.
The comprehensive coefficient of liabilities of the 17 cities in Hubei Province from 2011 to 2020 was calculated using Equation (9), and the results are shown in Table 4.
According to Table 3 and Table 4, the main reason for the low comprehensive coefficient of assets and the high comprehensive coefficient of liabilities in the Shenlongjia forest area is the low comprehensive water use efficiency coefficient.
The calculation results of the total water resources assets are presented in Table 5.
The total water resources assets in Hubei Province from 2011 to 2020 are shown in Figure 3.
The total water resource liabilities are presented in Table 6.
The total water resources liabilities in Hubei Province from 2011 to 2020 are shown in Figure 4.
According to the total assets and liabilities of water resources obtained by the equal weighting method, the net assets of water resources of 17 cities in Hubei Province are calculated using Equation (12). The results are presented in Table 7.
The net assets of water resources in Hubei Province from 2011 to 2020 are shown in Figure 5.

4. Discussion

In contrast to the ‘Australian Water Resources Accounting Standards,’ which uses the quantity of water resources to represent water resource assets, this study compiled a water resource balance sheet from the perspective of unified accounting of water quantity and quality, breaking through the value accounting method that only focuses on water quantity, ignoring water quality and other factors. Simultaneously, it combined the attributes of water resources with socioeconomic attributes. Next, bringing water resources into full integration with the agriculture, industry, construction, and service industries by linking industrial structure with the water consumption structure, then the economic, environmental, and ecological values of water resources was comprehensively considered. Subsequently, the concept, connotation, and method of calculating comprehensive water use efficiency, comprehensive water quality, and comprehensive coefficients were proposed and explained. Finally, a method of calculating resource assets, liabilities, and net assets was discussed, and a system for calculating water resource assets and liabilities based on unified accounting of water quantity and quality was constructed. Meanwhile, it provided diversified quantitative information on water resources, water quality, and water quantity in Hubei Province from 2011 to 2020, reflected the fluctuation of water resource assets, liabilities, and net assets in Hubei Province from 2011 to 2020, and provided useful information for the planning, development, management, and protection of water resources. This method is straightforward, adaptable, intuitive, clear, and has a good reference value.
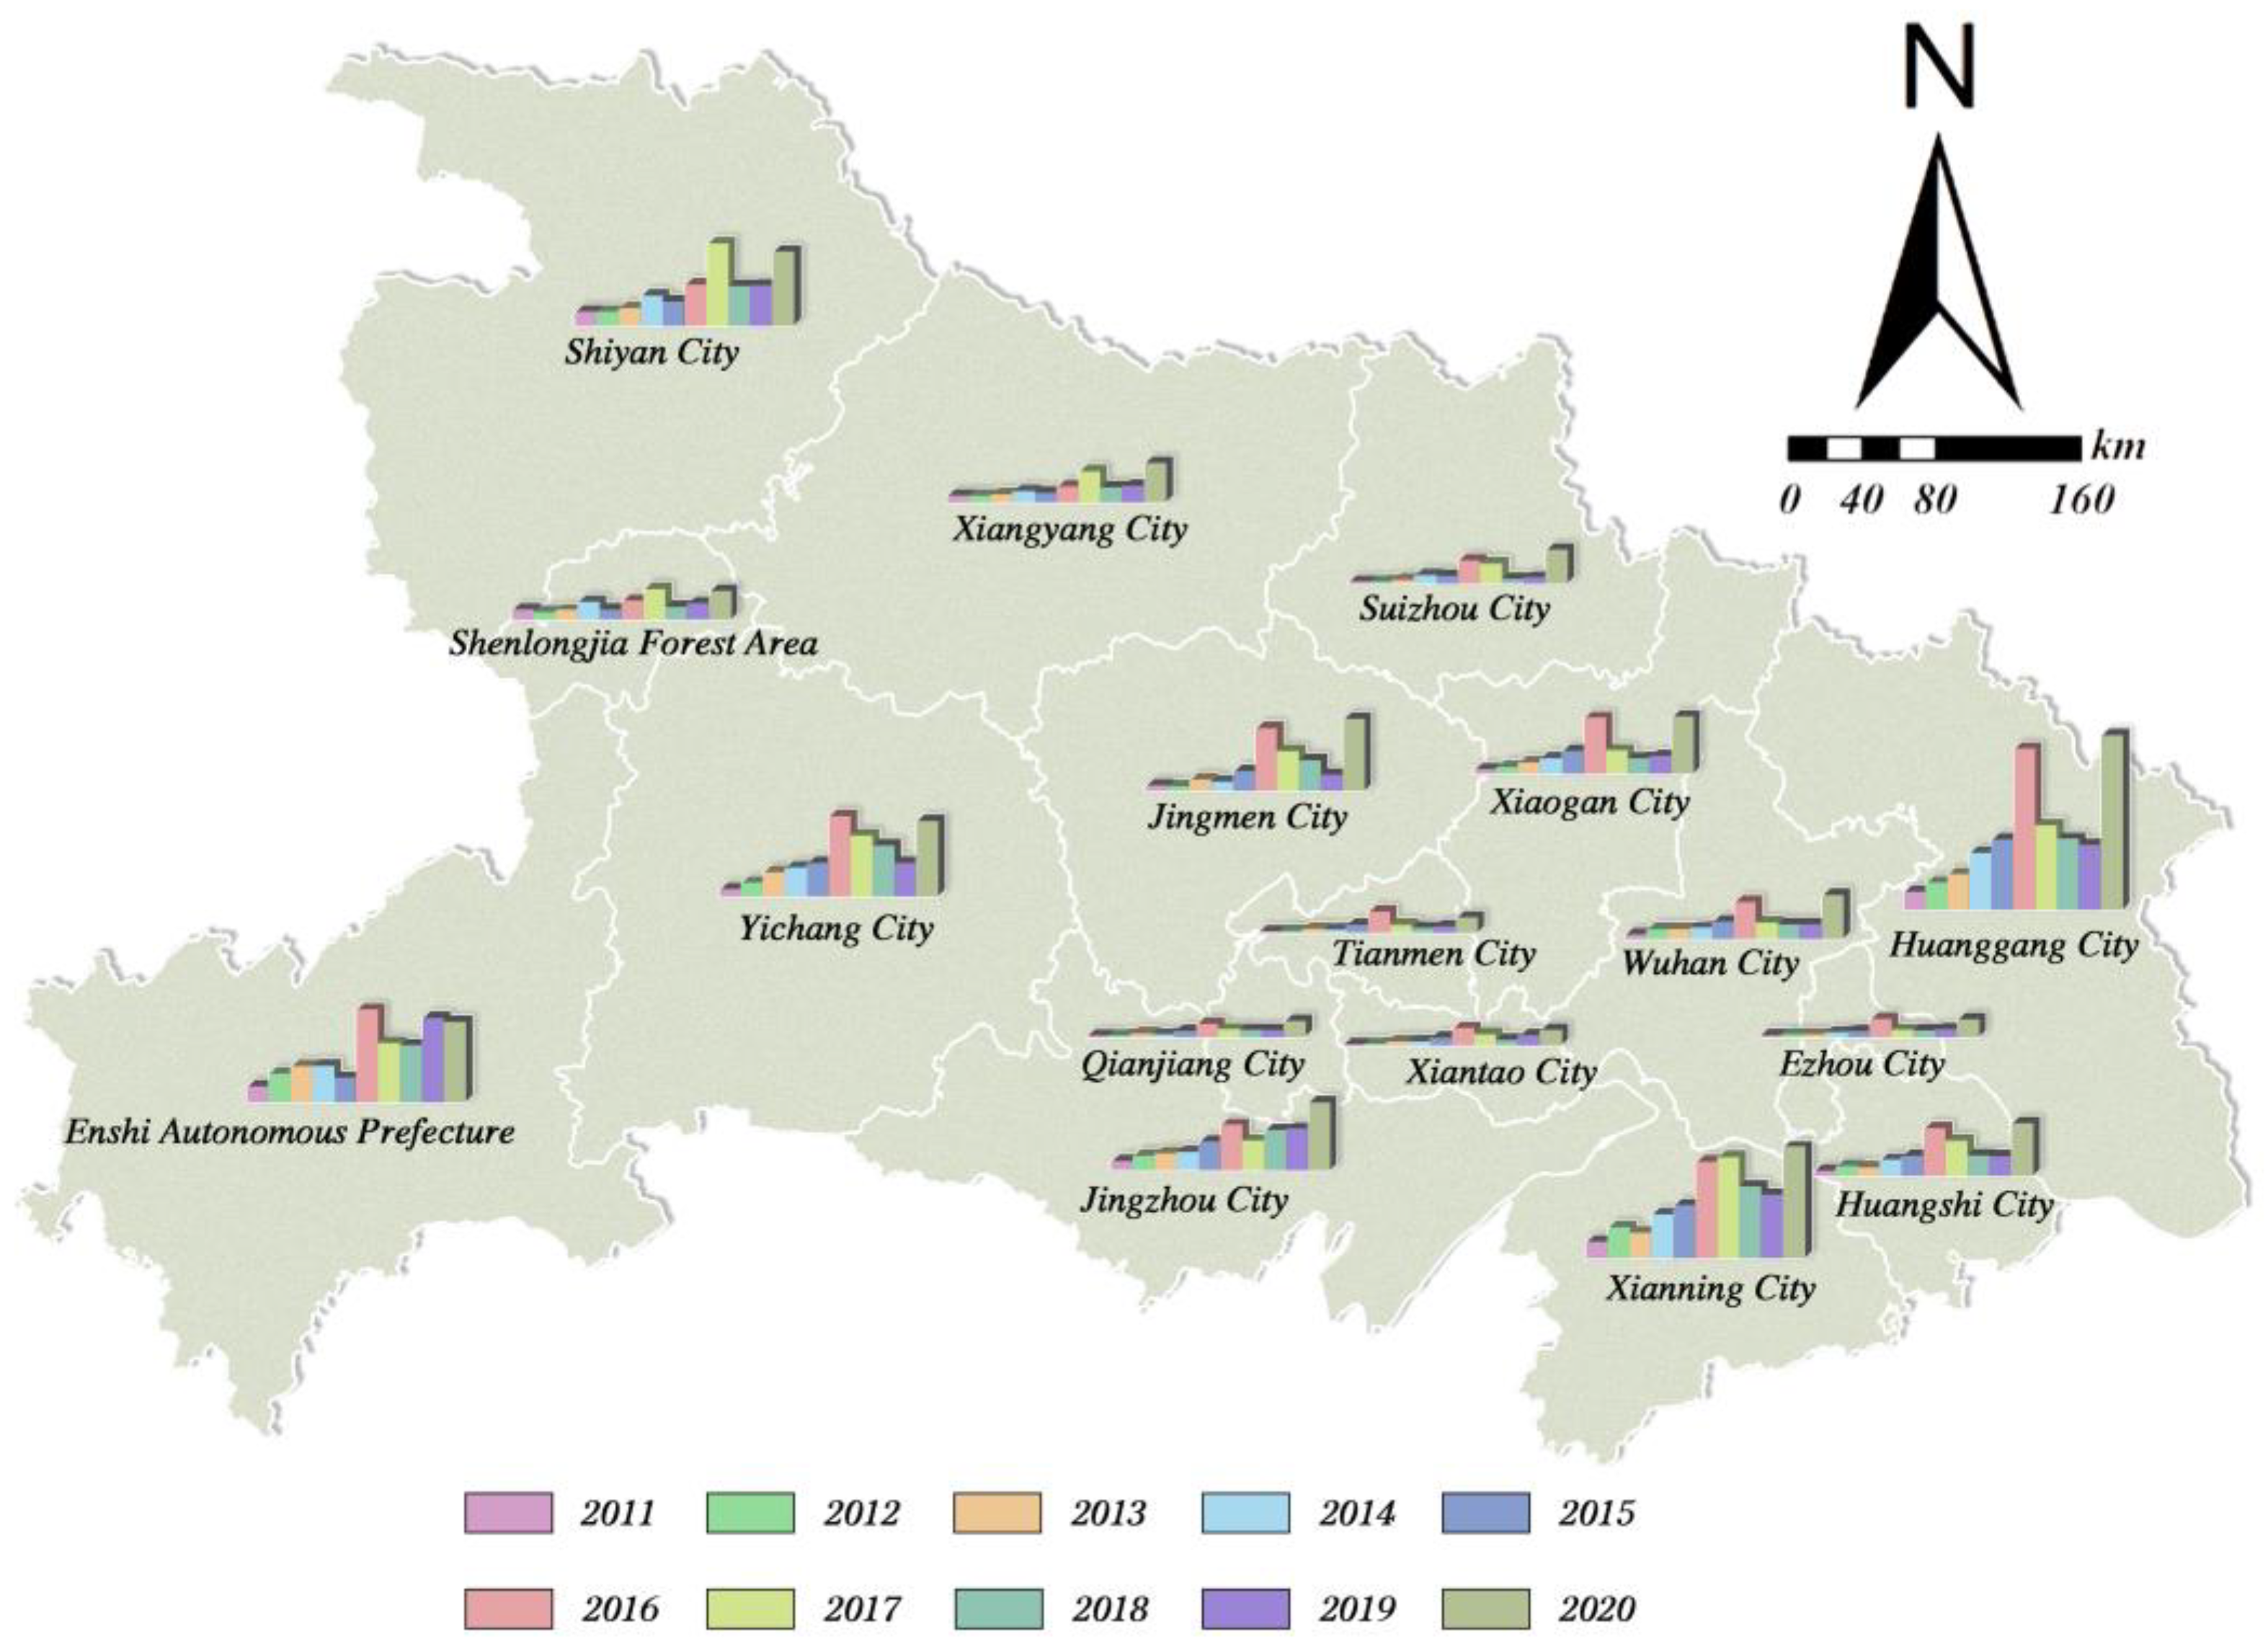
From a temporal perspective, the water resources assets, liabilities, and net assets of water resources in each prefecture-level city showed an ‘N’ trend from 2011 to 2020; specifically, water assets, liabilities, and net water assets showed an upward trend in 2011–2016, followed by a slow decline in 2016–2019, but a larger increase in 2020. The continuous drought in 2016 caused a slow decline in the total amount of water resources. Hence, water resource assets, liabilities, and net assets showed a slow downward trend from 2016 to 2019. Although Hubei Province is rich in water resources, water use efficiency is low due to climate reasons, and there is an uneven spatial and temporal distribution of precipitation. Accordingly, it is necessary to improve the carrying capacity effects of economic development on water resources, enhance the utilization efficiency of water resources, and consider green development as a significant aspect of economic development. In 2020, the total amount of water resources increased to a large extent because of the wet season; thus, the water resources assets, liabilities, and net assets of water resources increased.
From the perspective of prefecture-level cities, based on the accounting theory and model calculation methods, the water resource assets, liabilities, and net assets show the same trend. The top four water resource assets belong to Enshi Autonomous Prefecture, Yichang City, Huanggang City, and Jingzhou City. This is due to abundant rainfall, the fact that water resources that have not been overexploited, and the good water quality; therefore, the comprehensive strength of water quality and quantity compared to that of other cities has obvious advantages, while the level of economic development is relatively high. In contrast, the Shenlongjia forest area, Ezhou City, Xiantao City, Tianmen City, and Qianjiang City ranked lower. This is attributed to the fact that they are prefecture-level cities with small volumes of water, low rainfall, and relatively poor water quality. Among them, although the water quality of the Shenlongjia forest area is quite remarkable, its comprehensive strength is lower than that of other cities due to the small volume of the forest area, very low rainfall, primitive natural environment, presence of few industries, and lower economic development level. The top two water resource liabilities belong to Huanggang City and Xianning City, and the water resource assets and liabilities of Huanggang City and Xianning City are relatively high due to their comprehensive level of economic development and medium-level water quality. However, the high precipitation influences the higher value of water resource assets, and the water resource liabilities are relatively high. The top four net assets of water resources belong to Enshi Autonomous Prefecture, Yichang City, Jingzhou City, and Huanggang City, and the primary reason is that the value of water resource assets is high, and that of water resource liabilities is low. Furthermore, Huanggang City has high water resource liabilities; however, its water resource assets are ranked high. Therefore, its ranking is moved back one place, and the overall water resource net assets ranking is also relatively high. In contrast, the Shenlongjia forest area, Ezhou City, Qianjiang City, Tianmen City, and Xiantao City, which are at the bottom of the list, have a relatively low value of water resource assets and a relatively high value of water resource liabilities; therefore, the net value of water resource assets obtained by subtracting the two is also relatively low. Among these, the net assets of water resources in the Shenlongjia forest area were negative in some years because of the small differences between its water resources assets and liabilities.
From a regional point of view, the assets, liabilities, and net assets of water resources in the eastern, central, and western parts of Hubei Provinces showed significant differences, but an overall upward trend. The changing trend of the three regions was the same during the study period, and was also consistent with the changing trend of the entire province. Meanwhile, the regional difference model of water resource assets, liabilities, and net assets is roughly the same as that of the economic level. The economy of the eastern region is relatively developed, the market mechanism is relatively perfect, market competition is relatively fierce, the resource input has changed to the intensive type, and comprehensive water use efficiency is high. Simultaneously, although the water quality is relatively poor, the water quantity is relatively rich; therefore, the value of water resource assets and net assets is relatively high, and that of water resource liabilities are low. In the west, despite the good water quality, and the fact that the economic development level is relatively low, the water resource utilization efficiency is low, and the water quantity is relatively low. Due to these reasons, the values of water resource assets and net assets are relatively low, and that of water resource liabilities are high. Based on the above analysis, this paper systematically puts forward the following countermeasures to increase the value of water resource assets and reduce that of water resource liabilities.
First, this study recommends promoting green transformation and the upgrading of agriculture to improve water resources assets. Agricultural water consumption accounts for the largest proportion of the actual water consumption in Hubei Province. From the “Hubei Province 2020 Water Resources Bulletin”, it can be seen that the effective utilization coefficient of farmland irrigation water in Hubei Province is only 0.528, and it is necessary to improve the utilization efficiency of agricultural irrigation water to improve water resources assets in Hubei Province. Based on this, the Hubei provincial government should save water to improve water quantity, optimize the water use structure, improve water use efficiency, reduce water consumption, and improve water resources assets. At the same time, Hubei Province needs to promote green transformation and the upgrading of agricultural technology, improve agricultural irrigation technology, and change sprinkler irrigation and flood irrigation into drip irrigation when necessary to reduce water waste. The transformation and upgrading of traditional agriculture is an effective means to improving the utilization efficiency of water resources. According to local characteristics, the development of regionally advantageous agriculture and the optimization of the layout of the agricultural industry is also important. According to the endowment of local water resources of each municipal area in Hubei Province, as well as the water demand and irrigation water demand of various crops, the rational layout is adopted to improve the effective utilization rate of water resources and improve the water resources assets.
Second, this study recommends strengthening the cross-regional joint prevention and co-governance mechanism to improve water resources assets. Hubei Province should establish a two-level water resource joint prevention and co-governance mechanism inside and outside the province to achieve effective supervision and management of water resources asset inflow, outflow and internal circulation, so as to improve water resource assets. The special geographical location of Hubei Province is very unique. Therefore, it is very important to establish a water resources joint prevention and co-governance mechanism with other provinces and cities in the upper, middle and lower reaches in order to understand the flow of water resource assets and the outside world. In addition, the municipal units in Hubei Province should also formulate a unified water resources joint prevention and co-governance system, and clarify the tasks to the municipal individuals below Hubei Province. According to the actual situation of individual water resources at the municipal level, the province should standardize the individual water resource protection standards, understand the internal circulation direction of water resource assets, and improve water resource assets.
Third, this study recommends identifying the individuals responsible for water pollution to reduce water resource liabilities. A sewage responsibilities list for the municipal unit should be set up to uniformly manage water pollution in the jurisdictional area. Next, it is necessary to strictly monitor the water quantity and water quality of the provincial and municipal demarcation points, avoid the influence of negative externalities, and strictly prohibit the phenomenon of shirking responsibility. If there is serious water pollution, it should be clear who is responsible for the problem and appropriate action needs to be taken. Finally, it is necessary to clarify reward and punishment measures. After a completed judicial process, if any punishment is required, it must be severe enough for the offenders in order for future potential offenders to respect the laws, so as to improve water resources and reduce water resources liabilities. At the same time, the ecological compensation mechanism should also be integrated into water resources management, and a horizontal water resources ecological compensation mechanism in the Yangtze River Basin and a joint ecological compensation mechanism in Hubei Province should be established. “Who pollutes, who compensates,” lists the individuals causing the pollution who should pay compensation, and the individuals with better water resource management practices can obtain compensation. If the overall water resource management effect is poor, the government can step in and manage this part of the fund as the overall water resource protection investment reserve, so as to reduce the water resource liability.
Finally, this study recommends establishing a water resource management supervision team to reduce water resource liabilities. Hubei Province should establish a water resource management supervision team to implement the real-time supervision of water resource management and reduce water resources liabilities. On the one hand, there should be clear standards of reward and punishment measures for the effectiveness of water resource management, and their timely implementation should be ensured to reduce water resources liabilities. On the other hand, the reasonable allocation of human, capital, and other resources can be carried out through the supervision group, which also ensures the effectiveness of resource utilization and reduces the debt of water resources. At the same time, we should also establish an ecological compensation mechanism among provinces and cities in the Yangtze River Basin, and use water resource liabilities as an indicator to measure the performance of provinces, cities and the audit of cadres leaving office, in order to reduce water resources liabilities. The supervision group should also continue to promote the implementation of the ‘river and lake chief system’, and carry out water pollution control, water resource protection, and water environment management for rivers, lakes, and reservoirs in the administrative region of Hubei Province, so that water resource management can be implemented through timely supervision, resulting in effectiveness, thereby reducing water resources liabilities.

5. Conclusions

From the perspective of unified accounting of water quantity and quality, the system and method for the calculation of water resource assets and liabilities based on the unified accounting of water quality and quantity are proposed in this paper. The correlation coefficients in the calculation system are calculated by reasonable methods, and the water resource assets and liabilities of 17 cities in Hubei Province from 2011 to 2020 are calculated and comprehensively analyzed. Accordingly, the following conclusions are drawn.
(1) Taking Hubei Province as the research object, the water resource assets, liabilities, and net assets of prefecture-level cities from 2011 to 2020 were analyzed and calculated. The results show that from a temporal perspective, the water resource assets, liabilities, and net assets of each prefecture-level city from 2011 to 2020 are increasing overall, albeit with fluctuations. From the perspective of prefecture-level cities, the top four water resource assets belong to Enshi Autonomous Prefecture, Yichang City, Huanggang City, and Jingzhou City; the top two water resource liabilities belong to Huanggang City and Xianning City; and the top four net assets of water resources belong to Enshi Autonomous Prefecture, Yichang City, Jingzhou City, and Huanggang City. From a regional perspective, the water resource assets, liabilities, and net assets of water resources in the eastern, central, and western regions of Hubei Province show obvious differences, however, the overall trend is increasing, albeit with fluctuations. The trends of the three major regions were basically the same during the study period, which is consistent with the trend in the province. The regional difference model of water resource assets, liabilities, and net assets is roughly the same as the economic level difference model.
(2) Hubei Province is rich in water resources, however, due to climate reasons and the uneven spatial and temporal distribution of precipitation, water use efficiency is low. Thus, it is necessary to improve the carrying capacity of economic development for water resources, improve the utilization efficiency of water resources, and consider green development as an important aspect of economic development. The calculation results of this research can play a guiding role in the scientific management and allocation of water resources in Hubei Province. The unified accounting of water quantity and quality provides a basis for the quantitative evaluation of water resource management levels, which will effectively improve the governance capacity of the water resource ecological and economic system.
In the future, to provide practical support for decision-makers and regional managers, it is of great significance to conduct more detailed and accurate research. For example, groundwater can be used as an independent and significant factor in the model, with additional detailed research being performed, including the obtention of more agricultural information such as that on crop species, surface water weight, and groundwater consumption.

Author Contributions

Conceptualization and methodology: L.D. and X.W.; analysis and investigation: L.Y., L.D., X.W., W.H., Y.K., D.M.D. and T.S.R.; writing—original draft preparation: L.Y., L.D. and D.M.D.; writing—reviewing and editing: X.W. and T.S.R. All authors have read and agreed to the published version of the manuscript.

Funding

This study was supported by Major projects of the National Social Science Fund (2019ZDA089) and the National Natural Science Foundation (72104127, 71478101, 72004116).

Institutional Review Board Statement

Not applicable.

Informed Consent Statement

Not applicable.

Data Availability Statement

The original contributions presented in the study are included in the article, further inquiries can be directed to the corresponding author.

Conflicts of Interest

The authors declare that the research was conducted in the absence of any commercial or financial relationships that could be construed as a potential conflict of interest.

References

  1. Wang, Q.; Wang, S. The impact of environmental regulation on water resources utilization efficiency. Front. Environ. Sci. 2022, 10, 1869. [Google Scholar] [CrossRef]
  2. Luo, P.; Zheng, Y.; Wang, Y.; Zhang, S.; Yu, W.; Zhu, X.; Huo, A.; Wang, Z.; He, B.; Nover, D. Comparative Assessment of Sponge City Constructing in Public Awareness, Xi’an, China. Sustainability 2022, 14, 11653. [Google Scholar] [CrossRef]
  3. Luo, P.; Luo, M.; Li, F.; Qi, X.; Huo, A.; Wang, Z.; He, B.; Takara, K.; Nover, D.; Wang, Y. Urban flood numerical simulation: Research, methods and future perspectives. Environ. Model. Softw. 2022, 156, 105478. [Google Scholar] [CrossRef]
  4. Yuan, L.; He, W.; Degefu, D.M.; Liao, Z.; Wu, X.; An, M.; Zhang, Z.; Ramsey, T.S. Transboundary water sharing problem; a theoretical analysis using evolutionary game and system dynamics. J. Hydrol. 2020, 582, 124521. [Google Scholar] [CrossRef]
  5. Luo, P.; Liu, L.; Wang, S.; Ren, B.; He, B.; Nover, D. Influence assessment of new Inner Tube Porous Brick with absorbent concrete on urban floods control. Case Stud. Constr. Mater. 2022, 17, e01236. [Google Scholar] [CrossRef]
  6. Zhu, W.; Zha, X.; Luo, P.; Wang, S.; Cao, Z.; Lyu, J.; Zhou, M.; He, B.; Nover, D. A quantitative analysis of research trends in flood hazard assessment. Stoch. Environ. Res. Risk Assess. 2022, 37, 413–428. [Google Scholar] [CrossRef]
  7. Yuan, L.; He, W.; Degefu, D.M.; Wan, Z.; Ramsey, T.S.; Wu, X. A system dynamics simulation model for water conflicts in the Zhanghe River Basin, China. Int. J. Water Resour. Dev. 2021, 1873107. [Google Scholar] [CrossRef]
  8. Wang, S.; Luo, P.; Xu, C.; Zhu, W.; Cao, Z.; Ly, S. Reconstruction of Historical Land Use and Urban Flood Simulation in Xi’an, Shannxi, China. Remote. Sens. 2022, 14, 6067. [Google Scholar] [CrossRef]
  9. Luo, P.; Xu, C.; Kang, S.; Huo, A.; Lyu, J.; Zhou, M.; Nover, D. Heavy metals in water and surface sediments of the Fenghe River Basin, China: Assessment and source analysis. Water Sci. Technol. 2021, 84, 3072–3090. [Google Scholar] [CrossRef]
  10. Yuan, L.; Wu, X.; He, W.; Kong, Y.; Ramsey, T.S.; Degefu, D.M. A multi-weight fuzzy Methodological Framework for Allocating Coalition Payoffs of Joint Water Environment Governance in Transboundary River Basins. Water Resour. Manag. 2022, 36, 3367–3384. [Google Scholar] [CrossRef]
  11. Jia, Y.; Shen, J.; Wang, H. Calculation of Water Resource Value in Nanjing Based on a Fuzzy Mathematical Model. Water 2018, 10, 920. [Google Scholar] [CrossRef] [Green Version]
  12. Li, J.; Min, Q.; Li, W.; Bai, Y.; Yang, L.; Bijaya, G.C.D. Evaluation of water resources conserved by forests in the Hani rice terraces system of Honghe County, Yunnan, China: An application of the fuzzy comprehensive evaluation model. J. Mt. Sci. 2016, 13, 744–753. [Google Scholar] [CrossRef]
  13. Cai, C.; Huang, T.; Li, X.; Li, Y.Z. Application of Fuzzy Maths in Urban Water Resources Value: A Case Study of Water Resources Value in ChengDu Region. Adv. Mater. Res. 2012, 361, 1571–1575. [Google Scholar] [CrossRef]
  14. Li, J.-W.; Wu, Z.; Tian, G.-L. Research on water resources pricing model under the water resources–economic high-quality development coupling system: A case study of Hubei Province, China. Water Policy 2022, 24, 363–381. [Google Scholar] [CrossRef]
  15. Zhao, R.; Chen, S. Fuzzy pricing for urban water resources: Model construction and application. J. Environ. Manag. 2008, 88, 458–466. [Google Scholar] [CrossRef]
  16. Odum, H.T. Self-Organization, Transformity, and Information. Science 1988, 242, 1132–1139. [Google Scholar] [CrossRef] [PubMed] [Green Version]
  17. Wang, H.; Huang, S.; Di, D.; Wang, Y.; Zhang, F. Study on the spatial distribution of water resource value in the agricultural system of the Yellow River Basin. Water Policy 2021, 23, 1044–1058. [Google Scholar] [CrossRef]
  18. Wang, L.; He, Q. The Evaluation of Groundwater Resources Value of Beijing Based on Emergy Theory. Adv. Mater. Sci. Eng. 2015, 2015, 743136. [Google Scholar] [CrossRef] [Green Version]
  19. Zhang, W.; Tan, L.; Yin, H.; Guo, X. Study on the price of water rights trading between agriculture and industry based on emergy theory. Water Supply 2019, 19, 2044–2053. [Google Scholar] [CrossRef]
  20. Guan, X.; Hou, S.; Meng, Y.; Liu, W. Study on the quantification of ecological compensation in a river basin considering different industries based on water pollution loss value. Environ. Sci. Pollut. Res. 2019, 26, 30954–30966. [Google Scholar] [CrossRef]
  21. Qin, C.; Gan, H.; Wang, L.; Jia, L.; You, J.-J.; Zhou, P. Physical Water Resources Balance Sheet Structure Design. J. Nat. Resour. 2017, 32, 1819–1831. (In Chinese) [Google Scholar] [CrossRef]
  22. Jia, L.; Gan, H.; Wang, L.; Qin, C. On the accounting ideas of water resources balance sheet. J. Water Resour. 2017, 48, 1324–1333. (In Chinese) [Google Scholar] [CrossRef]
  23. Zhou, P.; Jia, L.; Gan, H. Research on the accounting framework of physical water resources of water rights entities. Account. Res. 2017, 5, 24–31+96. (In Chinese) [Google Scholar] [CrossRef]
  24. Tian, G.; Wei, D.; Sun, X. Water Resources Balance Sheet: Elements, Framework and Trial Study. People’s Yellow River 2018, 40, 65–68+73. (In Chinese) [Google Scholar] [CrossRef]
  25. Jian, F.H.; Song, X.Y.; Li, L.L.; Gao, W.Q. The evolution and enlightenment of water resources accounting from accounts to balance sheet. Sci. Cold Arid Reg. 2018, 8, 156–162. [Google Scholar]
  26. Jiao, R.; Geng, J.; Wu, X. Preliminary study on the method of compiling water resources balance table suitable for China. Water Supply Drain. 2015, 51 (Suppl. S1), 214–220. (In Chinese) [Google Scholar] [CrossRef]
  27. Liu, Y. Exploration on the Preparation of Water Resources Balance Sheet Under the Environmental Replacement Cost Method. Master’s Thesis, Lanzhou University of Finance and Economics, Lanzhou, China, 2017. [Google Scholar]
  28. Tang, Y.; Wang, Y.; Yang, Q.; Hwang, E.; He, Q. Theory and Practice of Water Resources Balance Sheet Compilation in the Yangtze River Basin. J. Coast. Res. 2020, 105 (Suppl. S1), 71–75. [Google Scholar] [CrossRef]
  29. Fang, L.; Wang, M. Application Research of Water Resources Balance Sheet in Public Project Governance. In Proceedings of the 6th International Conference on Informatics, Environment, Energy and Applications, Jeju, Repubic of Korea, 29–31 March 2017; pp. 102–106. [Google Scholar] [CrossRef]
  30. Hong, Z. Research on the Framework of Water Resources Accounting. IOP Conf. Ser. Earth Environ. Sci. 2018, 208, 012069. [Google Scholar] [CrossRef]
  31. Li, J.; Song, X. Exploration on the practical compilation of balance sheet of water resources in Tibet Autonomous Region. In Proceedings of the 2020 3rd International Conference on Humanities Education and Social Sciences (ICHESS 2020), Chengdu, China, 23–25 October 2020; Atlantis Press: Amsterdam, The Netherlands, 2020; pp. 899–904. [Google Scholar] [CrossRef]
  32. Tao, A. Study on the relationship between water resources utilization and economic development based on decoupling theory in Beijing. IOP Conf. Ser. Earth Environ. Sci. 2021, 687, 012207. [Google Scholar] [CrossRef]
  33. Li, R.; Guo, P.; Li, J. Regional Water Use Structure Optimization Under Multiple Uncertainties Based on Water Resources Vulnerability Analysis. Water Resour. Manag. 2018, 32, 1827–1847. [Google Scholar] [CrossRef]
  34. Pan, X.; Cai, K.; Wu, L. Using a Grey Niche Model to Predict the Water Consumption in 31 Regions of China. Water 2022, 14, 1883. [Google Scholar] [CrossRef]
  35. Jenson, M. Irrigation Research-Maximising Water Use Efficiency in the Cotton Industry. Irrig. Aust. Off. J. Irrig. Aust. 2010, 25, 16–18. [Google Scholar]
  36. Qu, W.; Tan, Y.; Li, Z.; Aarnoudse, E.; Tu, Q. Agricultural Water Use Efficiency—A Case Study of Inland-River Basins in Northwest China. Sustainability 2020, 12, 10192. [Google Scholar] [CrossRef]
  37. Xu, H.; Yang, R.; Song, J. Agricultural Water Use Efficiency and Rebound Effect: A Study for China. Int. J. Environ. Res. Public Health 2021, 18, 7151. [Google Scholar] [CrossRef]
  38. Lu, W.; Liu, W.; Hou, M.; Deng, Y.; Deng, Y.; Zhou, B.; Zhao, K. Spatial–Temporal Evolution Characteristics and Influencing Factors of Agricultural Water Use Efficiency in Northwest China—Based on a Super-DEA Model and a Spatial Panel Econometric Model. Water 2021, 13, 632. [Google Scholar] [CrossRef]
  39. Shi, C.; Zeng, X.; Yu, Q.; Shen, J.; Li, A. Dynamic evaluation and spatiotemporal evolution of China’s industrial water use efficiency considering undesirable output. Environ. Sci. Pollut. Res. 2021, 28, 20839–20853. [Google Scholar] [CrossRef]
  40. Zhao, J.; Wang, Y.; Zhang, X.; Liu, Q. Industrial and Agricultural Water Use Efficiency and Influencing Factors in the Process of Urbanization in the Middle and Lower Reaches of the Yellow River Basin, China. Land 2022, 11, 1248. [Google Scholar] [CrossRef]
  41. Kong, Y.; He, W.; Zhang, Z.; Shen, J.; Yuan, L.; Gao, X.; An, M.; Ramsey, T.S. Spatial-temporal variation and driving factors decomposition of agricultural grey water footprint in China. J. Environ. Manag. 2022, 318, 115601. [Google Scholar] [CrossRef]
  42. Yuan, L.; Li, R.; He, W.; Wu, X.; Kong, Y.; Degefu, D.M.; Ramsey, T.S. Coordination of the Industrial-Ecological Economy in the Yangtze River Economic Belt, China. Front. Environ. Sci. 2022, 10, 882221. [Google Scholar] [CrossRef]
  43. Su, L.; Gao, S.; Yao, S.; Su, F.; Chen, Y. Analysis on regional differences of water use efficiency rigid constraints and countermeasures in Zhejiang Province. IOP Conf. Ser. Earth Environ. Sci. 2021, 826, 012024. [Google Scholar] [CrossRef]
  44. Yang, Y.; Liu, Y.; Cao, S.; Cheng, Y. A Method of Evaluating Water Resource Assets and Liabilities: A Case Study of Jinan City, Shandong Province. Water 2017, 9, 575. [Google Scholar] [CrossRef] [Green Version]
  45. Piper, S. Impact of water quality on municipal water price and residential water demand and implications for water supply benefits. Water Resour. Res. 2003, 39, 1127. [Google Scholar] [CrossRef]
  46. Tobin, J. Estimation of relationships for limited dependent variables. Econ. J. Econ. Soc. 1958, 26, 24–36. [Google Scholar] [CrossRef] [Green Version]
  47. Fried, H.O.; Lovell, C.A.K.; Schmidt, S.S.; Yaisawarng, S. Accounting for Environmental Effects and Statistical Noise in Data Envelopment Analysis. J. Prod. Anal. 2002, 17, 157–174. [Google Scholar] [CrossRef]
  48. Jondrow, J.; Lovell, C.A.K.; Materov, I.S.; Schmidt, P. On the estimation of technical inefficiency in the stochastic frontier production function model. J. Econ. 1982, 19, 233–238. [Google Scholar] [CrossRef] [Green Version]
  49. Yuan, L.; Yang, D.; Wu, X.; He, W.; Kong, Y.; Ramsey, T.S.; Degefu, D.M. Development of multidimensional water poverty in the Yangtze River Economic Belt, China. J. Environ. Manag. 2023, 325, 116608. [Google Scholar] [CrossRef]
  50. Kong, Y.; He, W.; Yuan, L.; Zhang, Z.; Gao, X.; Zhao, Y.; Degefu, D.M. Decoupling economic growth from water consumption in the Yangtze River Economic Belt, China. Ecol. Indic. 2021, 123, 107344. [Google Scholar] [CrossRef]
  51. Yuan, L.; He, W.; Liao, Z.; Degefu, D.M.; An, M.; Zhang, Z.; Wu, X. Allocating Water in the Mekong River Basin during the Dry Season. Water 2019, 11, 400. [Google Scholar] [CrossRef] [Green Version]
Figure 1. Relationship between water quality grade and water quality coefficient.
Water 15 01383 g001
Figure 2. Map of Hubei Province. Note: the map was generated by ArcGIS 10.2.
Water 15 01383 g002
Figure 3. Total assets of water resources in Hubei Province from 2011 to 2020.
Water 15 01383 g003
Figure 4. Total liabilities of water resources in Hubei Province from 2011 to 2020.
Water 15 01383 g004
Figure 5. Net assets of water resources in Hubei Province from 2011 to 2020.
Water 15 01383 g005
Table 1. Comprehensive water use Efficiency coefficient of prefecture-level cities in Hubei Province from 2011 to 2020.
2011201220132014201520162017201820192020
Wuhan City1.0001.0001.0001.0001.0001.0001.0001.0001.0001.000
Huangshi City0.7820.7750.6810.6250.5680.4550.5000.5630.5500.544
Shiyan City0.8830.8190.7390.7260.7080.5760.5950.6480.6230.665
Yichang City1.0000.9190.8320.7930.7670.7120.7980.7800.7680.894
Xiangyang City1.0001.0001.0001.0000.9981.0001.0001.0000.6080.931
Ezhou City0.7870.7410.7100.6290.6530.4790.5230.4660.4580.517
Jingmen City0.8410.8660.7820.7100.6790.5390.5340.5360.5090.573
Xiaogan City0.7420.7640.7230.6740.6660.6490.6750.7720.5220.729
Jingzhou City1.0001.0001.0001.0001.0001.0001.0000.9490.6371.000
Huanggang City0.6870.7240.6920.6200.5910.5310.5540.5270.4910.657
Xianning City0.6270.6550.6080.5690.5530.4490.4500.4450.4300.495
Suizhou City0.7690.7540.7390.8110.8720.6970.7951.0000.4590.814
Enshi Autonomous Prefecture1.0000.8700.8610.9201.0000.8430.9550.9340.6231.000
Xiantao City1.0001.0000.8750.8090.8420.6560.6271.0000.6160.936
Qianjiang City1.0000.9410.7830.8190.8110.5620.5870.7210.5750.740
Tianmen City0.8830.9130.8460.6980.6950.4760.5581.0000.5960.793
Shennongjia Forest Area0.1310.0700.0480.0620.0580.0740.0540.1930.2030.189
Table 2. Comprehensive water quality coefficients of prefecture-level cities in Hubei Province from 2011 to 2020.
2011201220132014201520162017201820192020
Wuhan City0.6220.5760.5900.5860.6050.6030.6140.6040.6030.589
Huangshi City0.7620.6910.7110.6900.7080.6990.7070.7060.6870.676
Shiyan City0.7740.7610.7580.7550.7780.7760.7640.7670.7630.763
Yichang City0.8040.7840.7840.7850.7810.7810.7940.7890.7800.770
Xiangyang City0.6720.6630.6590.6590.6910.6850.6860.6850.6780.672
Ezhou City0.6410.6130.6190.6090.6270.6230.6340.6310.6280.615
Jingmen City0.6420.6280.6260.6330.6600.6650.6740.6690.6170.653
Xiaogan City0.5570.5310.5350.5390.6020.6040.6100.6030.5980.584
Jingzhou City0.6510.6030.6110.6110.6190.6160.6330.6200.6640.599
Huanggang City0.7090.6670.6760.6770.7010.6980.7060.6960.6900.676
Xianning City0.8330.7660.7920.7670.7630.7590.7710.7510.7540.738
Suizhou City0.6650.6450.6420.6440.6940.6910.7010.6980.6900.676
Enshi Autonomous Prefecture0.8140.8000.7950.7950.7950.7930.8040.7910.7850.774
Xiantao City0.6650.5560.5570.5630.5720.5730.5900.5770.5720.564
Qianjiang City0.5740.5340.5360.5500.5710.5740.5930.5730.5740.558
Tianmen City0.5600.5380.5450.5460.5660.5750.5830.5640.5670.560
Shennongjia Forest Area0.8370.8370.8230.8240.8160.8030.8130.8120.8060.811
Table 3. Comprehensive asset coefficient of prefecture-level cities in Hubei Province from 2011 to 2020.
2011201220132014201520162017201820192020
Wuhan City0.8110.7880.7950.7930.8030.8020.8070.8020.8020.795
Huangshi City0.7720.7330.6960.6580.6380.5770.6040.6350.6190.610
Shiyan City0.8290.7900.7490.7410.7430.6760.6800.7080.6930.714
Yichang City0.9020.8520.8080.7890.7740.7470.7960.7850.7740.832
Xiangyang City0.8360.8320.8300.8300.8450.8430.8430.8430.6430.802
Ezhou City0.7140.6770.6650.6190.6400.5510.5790.5490.5430.566
Jingmen City0.7420.7470.7040.6720.6700.6020.6040.6030.5630.613
Xiaogan City0.6500.6480.6290.6070.6340.6270.6430.6880.5600.657
Jingzhou City0.8260.8020.8060.8060.8100.8080.8170.7850.6510.800
Huanggang City0.6980.6960.6840.6490.6460.6150.6300.6120.5910.667
Xianning City0.7300.7110.7000.6680.6580.6040.6110.5980.5920.617
Suizhou City0.7170.7000.6910.7280.7830.6940.7480.8490.5750.745
Enshi Autonomous Prefecture0.9070.8350.8280.8580.8980.8180.8800.8630.7040.887
Xiantao City0.8330.7780.7160.6860.7070.6150.6090.7890.5940.750
Qianjiang City0.7870.7380.6600.6850.6910.5680.5900.6470.5750.649
Tianmen City0.7220.7260.6960.6220.6310.5260.5710.7820.5820.677
Shennongjia Forest Area0.4840.4540.4360.4430.4370.4390.4340.5030.5050.500
Table 4. Composite debt coefficient of prefecture-level cities in Hubei Province from 2011 to 2020.
2011201220132014201520162017201820192020
Wuhan City0.1890.2120.2050.2070.1970.1980.1930.1980.1980.205
Huangshi City0.2280.2670.3040.3420.3620.4230.3960.3650.3810.390
Shiyan City0.1710.2100.2510.2590.2570.3240.3200.2920.3070.286
Yichang City0.0980.1480.1920.2110.2260.2530.2040.2150.2260.168
Xiangyang City0.1640.1680.1700.1700.1550.1570.1570.1570.3570.198
Ezhou City0.2860.3230.3350.3810.3600.4490.4210.4510.4570.434
Jingmen City0.2580.2530.2960.3280.3300.3980.3960.3970.4370.387
Xiaogan City0.3500.3520.3710.3930.3660.3730.3570.3120.4400.343
Jingzhou City0.1740.1980.1940.1940.1900.1920.1830.2150.3490.200
Huanggang City0.3020.3040.3160.3510.3540.3850.3700.3880.4090.333
Xianning City0.2700.2890.3000.3320.3420.3960.3890.4020.4080.383
Suizhou City0.2830.3000.3090.2720.2170.3060.2520.1510.4250.255
Enshi Autonomous Prefecture0.0930.1650.1720.1420.1020.1820.1200.1370.2960.113
Xiantao City0.1670.2220.2840.3140.2930.3850.3910.2110.4060.250
Qianjiang City0.2130.2620.3400.3150.3090.4320.4100.3530.4250.351
Tianmen City0.2780.2740.3040.3780.3690.4740.4290.2180.4180.323
Shennongjia Forest Area0.5160.5460.5640.5570.5630.5610.5660.4970.4950.500
Table 5. Total assets of water resources in Hubei Province from 2011 to 2020 (in billions of USD).
2011201220132014201520162017201820192020
Wuhan City1.1041.9202.1052.3893.8157.8993.7093.1893.2278.965
Huangshi City1.0981.5031.0951.7031.8883.4242.8661.9101.7124.353
Shiyan City3.7252.9002.8354.5443.6964.5149.1585.0714.7759.685
Yichang City3.9124.3395.4705.7786.11212.43712.5059.8076.08819.583
Xiangyang City1.9331.8552.2263.0372.8414.5968.7774.3581.5748.376
Ezhou City0.3500.3980.4090.4960.6311.2250.5620.4680.5281.272
Jingmen City0.9530.8271.5171.0422.1565.0093.2112.4881.1245.988
Xiaogan City0.5070.7101.0601.2912.1424.9862.2791.8761.2145.790
Jingzhou City2.3963.2213.8264.1356.52110.1517.0387.7714.13214.293
Huanggang City2.2673.3554.1065.5566.76513.4487.5775.8964.94618.271
Xianning City2.3724.0573.1774.6415.3487.7348.3135.5934.8299.414
Suizhou City0.3680.3270.5281.2601.5522.8273.1741.4700.4785.257
Enshi Autonomous Prefecture8.2857.7649.24411.72211.47521.87022.94418.87810.48632.973
Xiantao City0.4280.4700.6190.5541.0711.5230.9971.2380.8052.546
Qianjiang City0.3120.3240.4220.3540.7490.9290.6420.7210.5051.585
Tianmen City0.2620.3260.5520.3430.7671.2700.5851.0900.5061.752
Shennongjia Forest Area0.5150.3550.4230.7540.4280.7951.2400.7030.8941.521
Table 6. Total liabilities of water resources in Hubei Province from 2011 to 2020 (billion USD).
2011201220132014201520162017201820192020
Wuhan City0.2570.5170.5430.6240.9361.9500.8870.7870.7972.312
Huangshi City0.3240.5470.4780.8851.0712.5101.8791.0981.0532.783
Shiyan City0.7680.7710.9501.5881.2782.1634.3102.0912.1153.880
Yichang City0.4250.7541.3001.5451.7854.2123.2052.6861.7783.954
Xiangyang City0.3790.3750.4560.6220.5210.8561.6350.8120.8742.068
Ezhou City0.1400.1900.2060.3050.3550.9980.4090.3850.4440.976
Jingmen City0.3310.2800.6380.5091.0623.3122.1051.6380.8723.780
Xiaogan City0.2730.3860.6250.8361.2362.9661.2650.8510.9543.022
Jingzhou City0.5050.7950.9210.9951.5302.4121.5772.1282.2153.573
Huanggang City0.9811.4651.8973.0053.7078.4194.4503.7383.4239.122
Xianning City0.8771.6491.3622.3072.7805.0715.2923.7603.3285.844
Suizhou City0.1450.1400.2360.4710.4301.2461.0690.2610.3531.799
Enshi Autonomous Prefecture0.8501.5341.9201.9401.3034.8663.1292.9974.4094.201
Xiantao City0.0860.1340.2460.2540.4440.9540.6400.3310.5500.849
Qianjiang City0.0840.1150.2170.1630.3350.7070.4460.3940.3740.857
Tianmen City0.1010.1230.2410.2080.4491.1450.4400.3040.3630.836
Shennongjia Forest Area0.5490.4270.5480.9480.5511.0161.6160.6950.8761.521
Table 7. Net assets of water resources in Hubei Province from 2011 to 2020 (in billions of USD).
2011201220132014201520162017201820192020
Wuhan City0.8471.4041.5621.7652.8795.9492.8222.4022.4316.654
Huangshi City0.7740.9560.6170.8180.8170.9140.9870.8120.6581.570
Shiyan City2.9572.1291.8852.9562.4172.3504.8482.9802.6605.806
Yichang City3.4873.5854.1704.2334.3278.2249.3007.1214.31015.629
Xiangyang City1.5531.4811.7702.4152.3203.7407.1433.5460.7006.308
Ezhou City0.2100.2080.2030.1910.2760.2270.1530.0840.0840.297
Jingmen City0.6220.5470.8790.5341.0941.6971.1060.8500.2522.207
Xiaogan City0.2340.3240.4350.4550.9052.0201.0141.0250.2602.767
Jingzhou City1.8912.4262.9053.1404.9927.7395.4625.6431.91710.719
Huanggang City1.2861.8892.2092.5513.0585.0293.1272.1581.5239.149
Xianning City1.4952.4081.8152.3342.5682.6633.0201.8331.5013.570
Suizhou City0.2230.1870.2920.7891.1221.5802.1051.2080.1253.457
Enshi Autonomous Prefecture7.4356.2307.3239.78210.17117.00419.81515.8816.07728.773
Xiantao City0.3420.3360.3740.3010.6270.5700.3570.9070.2551.697
Qianjiang City0.2280.2090.2050.1910.4140.2230.1960.3280.1320.728
Tianmen City0.1610.2030.3110.1340.3190.1260.1460.7860.1420.916
Shennongjia Forest Area−0.034−0.072−0.124−0.194−0.123−0.221−0.3770.0080.0180.000
Disclaimer/Publisher’s Note: The statements, opinions and data contained in all publications are solely those of the individual author(s) and contributor(s) and not of MDPI and/or the editor(s). MDPI and/or the editor(s) disclaim responsibility for any injury to people or property resulting from any ideas, methods, instructions or products referred to in the content.

