Article

Specifications and Accuracy of Rainfall Forecast Required for Pre-Release at Multi-Purpose Reservoirs in Japan

Department of Civil and Environmental Engineering, School of Environment and Society, Tokyo Institute of Technology, Tokyo 152-8550, Japan
*
Author to whom correspondence should be addressed.
Water 2023, 15(7), 1277; https://doi.org/10.3390/w15071277
Submission received: 11 February 2023 / Revised: 17 March 2023 / Accepted: 22 March 2023 / Published: 24 March 2023

Abstract

:
Pre-release is the discharge from a reservoir before a flood to enhance flood control capability. Its success depends on the performance of rainfall forecasting. However, there is little information regarding the causal relationship between its performance and the success of pre-release. Therefore, the rainfall forecast required for pre-release at 326 multi-purpose reservoirs in Japan is shown quantitatively in this paper. In our analysis, pre-release was simulated based on tentative rainfall forecasts made using observed rainfall data from a period of 17 years (2006 to 2022) with some processing. Then, outputs were evaluated in terms of two risks: not avoiding emergency spillway gate operation and no recovery of water use capacity. The results of five elements were reached: (1) the characteristics of situations requiring pre-release, the required (2) forecast length and (3) spatial resolution, the required accuracy of (4) the rainfall amount, and (5) the position of rainfall zone. For (1), pre-release is required nationwide in typhoons or stationary fronts at a frequency of four instances per year. For (2) and (3), assuming perfect accuracy, the current specifications of rainfall forecast in Japan: forecast length of 84 h or more and the combined use of 5 km and 20 km spatial resolution are generally effective in themselves. For (4) and (5), possible uncertainties in the rainfall amount and the position of rainfall zone needs to be decreased by one digit for avoiding emergency spillway gate operations, while excessive pre-release tends not to result in no recovery of water use capacity.

1. Introduction

The operations of multi-purpose reservoirs face numerous global challenges, including flood and drought. The sixth assessment report of the Intergovernmental Panel on Climate Change (IPCC) indicates possible future increases in the frequency and intensity of heavy rainfall and drought due to global warming [1]. In this situation, many researchers are aiming toward the more flexible and effective use of existing reservoirs by utilizing the evolving but imperfect forecast information from around the world [2,3].
In Japan, pre-release is carried out as an effective measure against intensifying floods at reservoirs nationwide. Pre-release is the discharge from a reservoir before projected flood arrival in order to temporarily enhance the flood control capability. This operation enables reservoirs to avoid or mitigate emergency spillway gate operations (emergency release risk), which can cause the rapid increase in discharge beyond what was planned and can result in severe damage downstream.
On the other hand, pre-release requires cautious and difficult decision-making based on rainfall forecast. Multi-purpose reservoirs in Japan not only have the capacity for flood control but are primarily allocated for water use, for purposes such as agricultural water, power generation, etc., which have a significant impact on society. Therefore, excessive discharge with no ability to recover water use after flooding (water use risk) must be avoided. In addition, quantitative rainfall forecasts still involve significant uncertainties, including the misprediction, which makes decision-making harder. From the above, it can be seen that rainfall forecasting holds the key to the success of pre-release.
In the context of these difficulties, the social implementation of pre-release policy has advanced rapidly in Japan since 2020. In that year, the Japanese Ministry of Land, Infrastructure, Transport and Tourism (MLIT) released relevant guidelines [4]. These guidelines recommend the decision-making regarding pre-release since a time point 3 days prior to flood based on rainfall forecasts provided by the Japan Meteorological Agency (JMA), including the meso-scale model (MSM) and the global spectral model (GSM) [5]. Before this policy transition, pre-release had only been applied to specific reservoirs and the methods mainly focused not on forecast but on historical rainfall. The number of reservoirs conducting pre-release is increasing due to recent flood events. For example, 38 reservoirs engaged in pre-release during the Kyushu floods in 2020, 76 reservoirs during the Typhoon Haishen in 2020, and 129 reservoirs (including 77 water use reservoirs) during the Typhoon Nanmadol in 2022, which was record-breaking [6,7].
Despite increasing experience, disaster assessments tend to not include causal relation between the performances of rainfall forecasts and the success of pre-release. In general, only the number of reservoirs conducting pre-release or the effects of pre-release on flood control are focused on. Even if some reports refer to the rainfall forecast, they focus on the assessment of the rainfall forecast itself or the abstract indications of the causal relationship. During the Kumagawa flood of 2020, articles indicating that the short-term predicting linear rain bands caused the non-implementation of pre-release at several reservoirs, although they did not include concrete values such as length of time [8]. Identifying a concrete cause and demand is the most important aspect for improvement.
This study attempts to show the specifications and accuracy of rainfall forecasts required for pre-release application by using observed rainfall data as tentative rainfall forecasts with a certain level of processing, including partial use, upscaling, multiplying, and shifting. To pursue generality, this study analyzed the situations at many multi-purpose reservoirs nationwide in Japan over long periods of historical rainfall.
First, it is necessary to extract and analyze cases where pre-release is needed. Frequencies for similar indices have already been analyzed based on the actual records of emergency spillway gate operations over the past 60 years as well as on many artificial rainfall scenarios from databases for policy decision-making for future climate change (d4PDF) [9,10]. However, these were discussed from the perspective of existing reservoirs’ ability, not rainfall forecasts. In addition, although the extraction and analysis of heavy rainfall in Japan over a period of 15 years has been conducted [11], it did not include the effect on reservoirs. Therefore, in this paper, cases requiring pre-release were extracted from past rainfall and evaluated from the perspective of rainfall forecast, including regionality and meteorological causes.
Second, the sufficiency of forecast length and spatial resolution, which are important components of the operational forecast model, should be examined. Various organizations are attempting to increase forecast length and spatial resolution for a variety of purposes, including pre-release [5,12,13]. On the other hand, the levels required for pre-release are not clear due to the many different conditions of each reservoir or flood. Maruya et al. investigated the effects of spatial resolution of rainfall, covering a specific river basin [14]. In this study, the effects of the differences on decision-making of pre-release at reservoirs nationwide was evaluated by using a specific range of observed rainfall or by upscaling observed rainfall as tentative rainfall forecasts.
Finally, the required quantitative and spatial accuracy of rainfall forecasts should be discussed. The JMA reports the operational forecasts for recent heavy rainfall events, and uncertainties in rainfall amount or the position of the rainfall zone are frequently pointed out [15]. The study which examined JMA forecast accuracy in terms of reservoir basin-average and cumulative amount demonstrated that its errors ranged from percentages in their tens to percentages in their hundreds both in over- and underestimation [16]. However, they were not direct indices for decision-making in terms of pre-release. Our previous study using JMA’s MSM and GSM for three flood events and the rainfall–runoff model for reservoirs nationwide evaluated the differences in the time required for pre-release as calculated from both the forecasted and observed rainfall data [17]. However, there remains complexity in the causal relationship and low generality. Therefore, the acceptable range of uncertainty was examined through pre-release simulations using tentative rainfall forecasts, which were made by introducing various degrees of uncertainty this study tried to examine to observed rainfall.

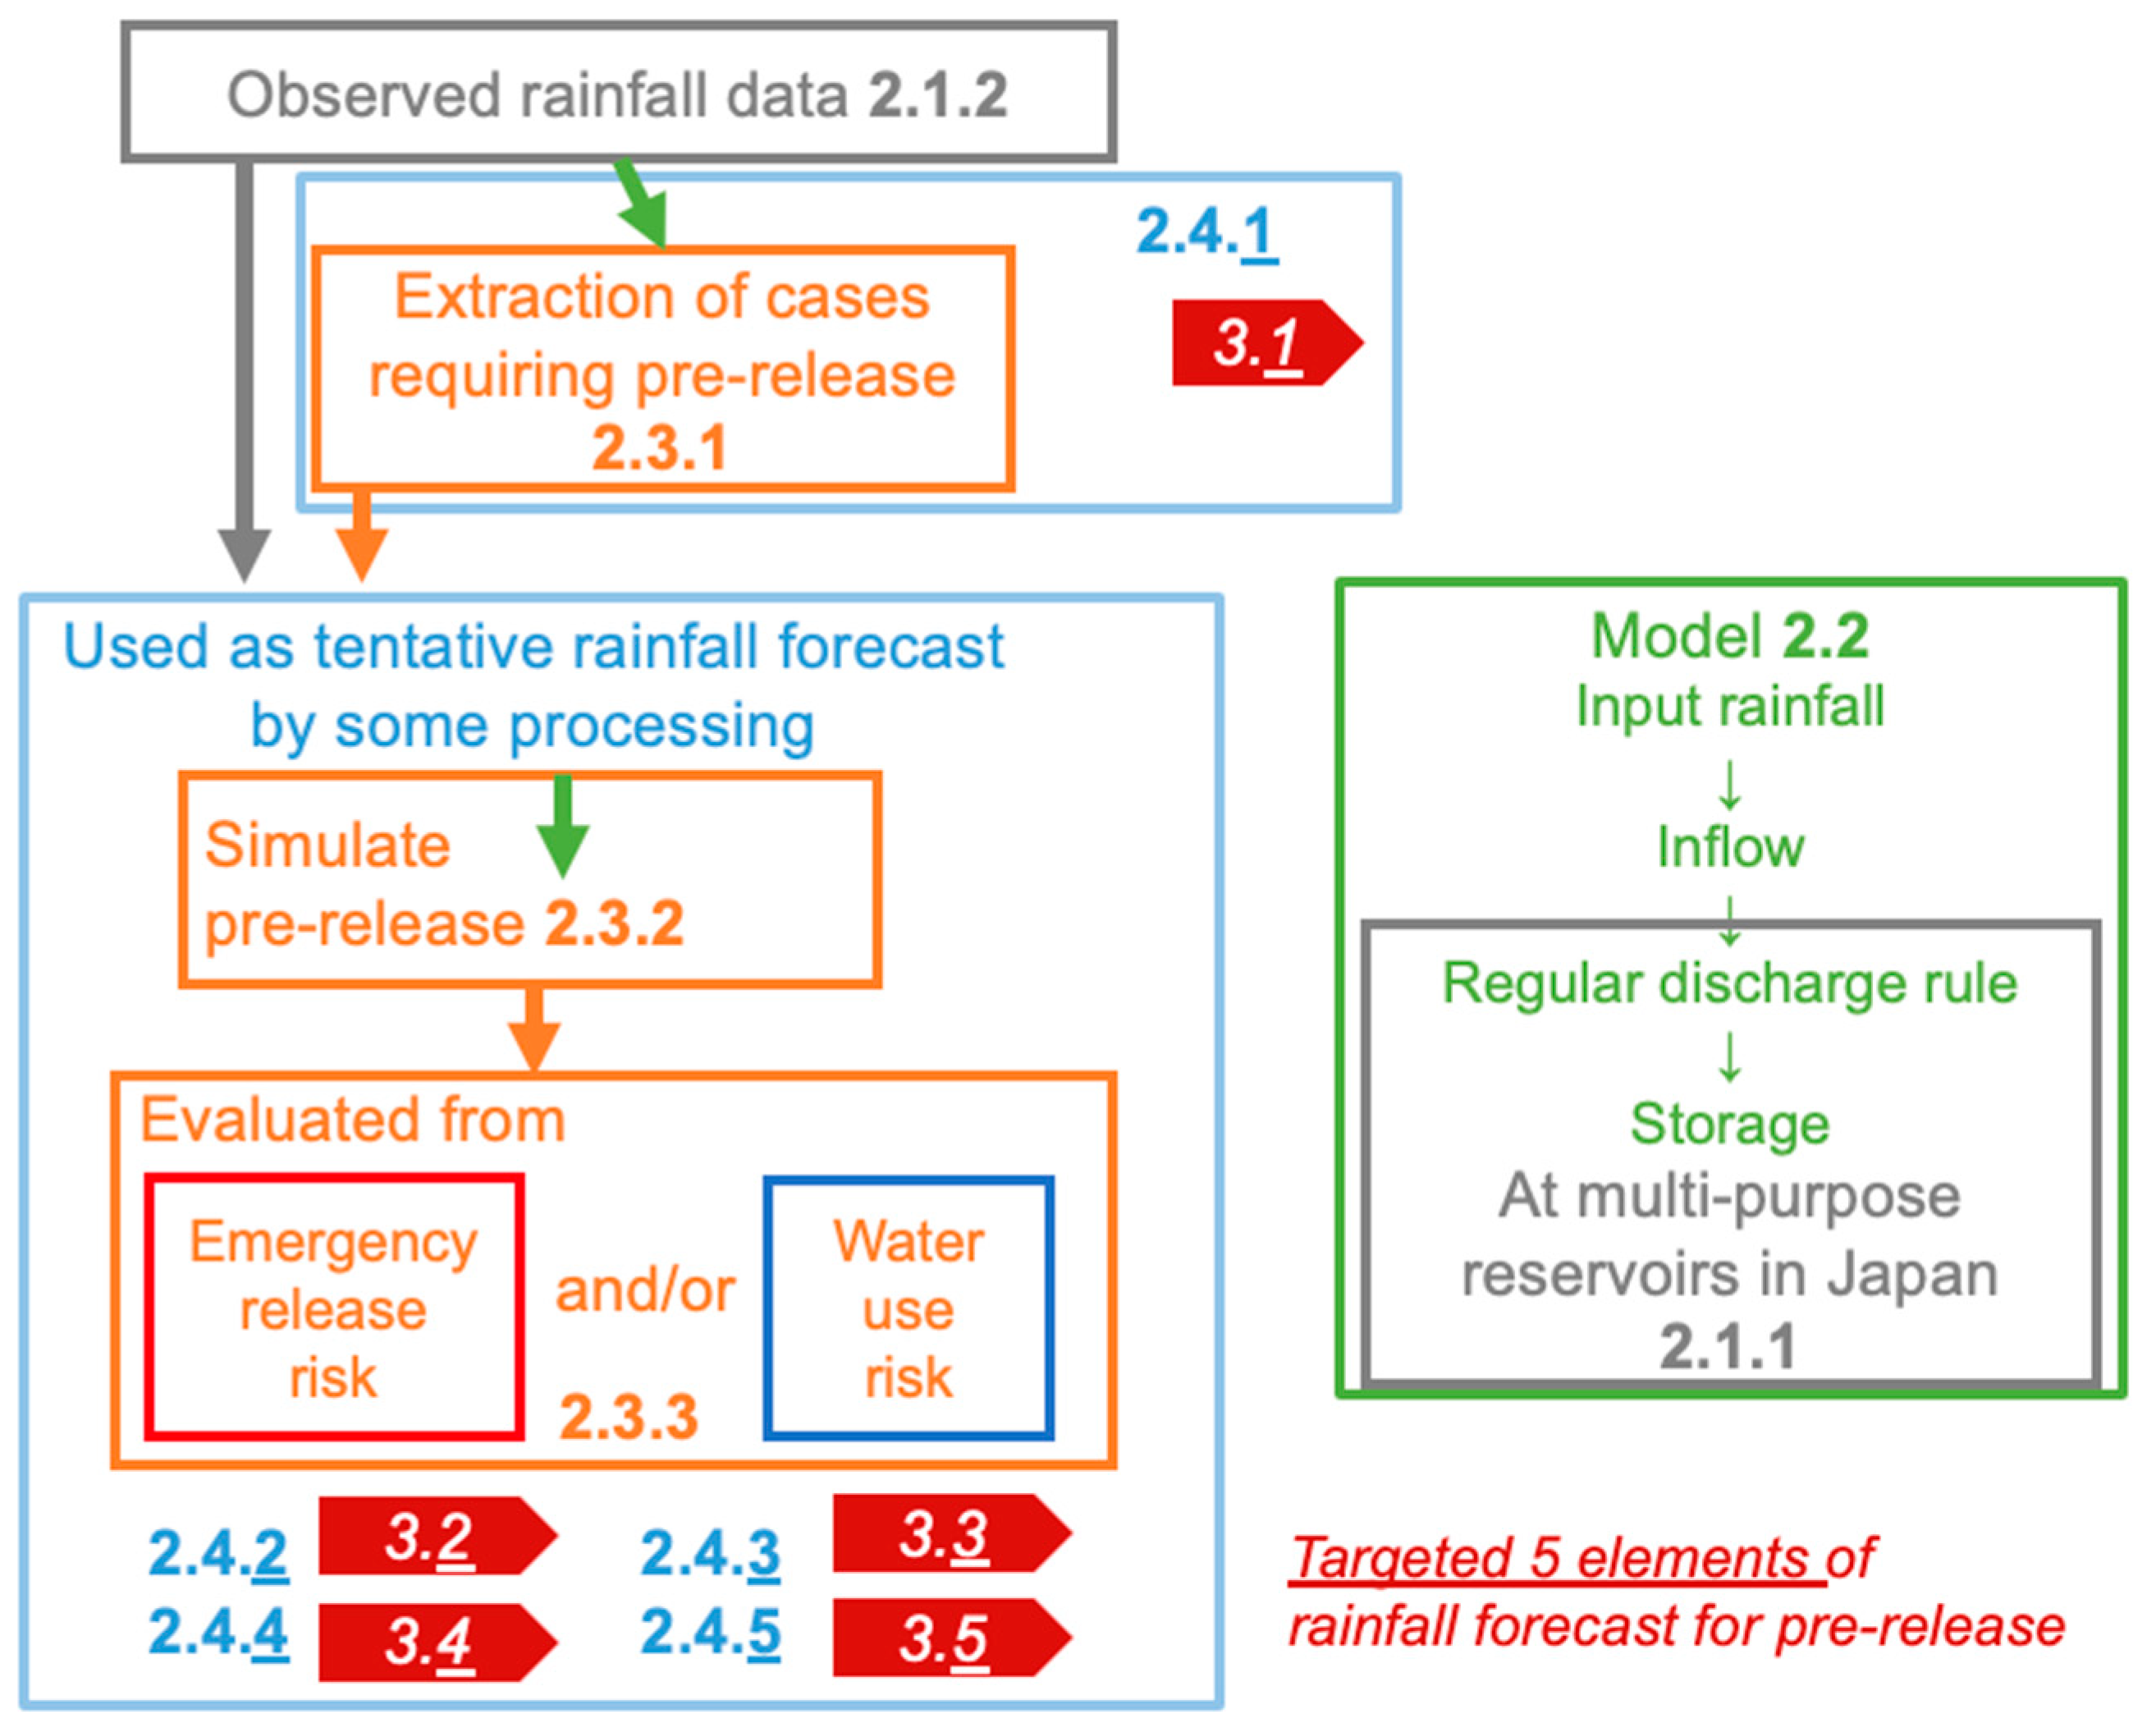
2. Materials and Methods

This section is divided into four parts. In Section 2.1, the information of the target reservoirs and input rainfall data are explained (gray in Figure 1). In Section 2.2, the outline for the calculation system is introduced (green in Figure 1). In Section 2.3, the demand for pre-release is defined (orange in Figure 1). In Section 2.4, the evaluation methods for the five targeted elements are explained, respectively (light blue in Figure 1). The connections between the subsections of this section are shown in the flowchart of Figure 1.

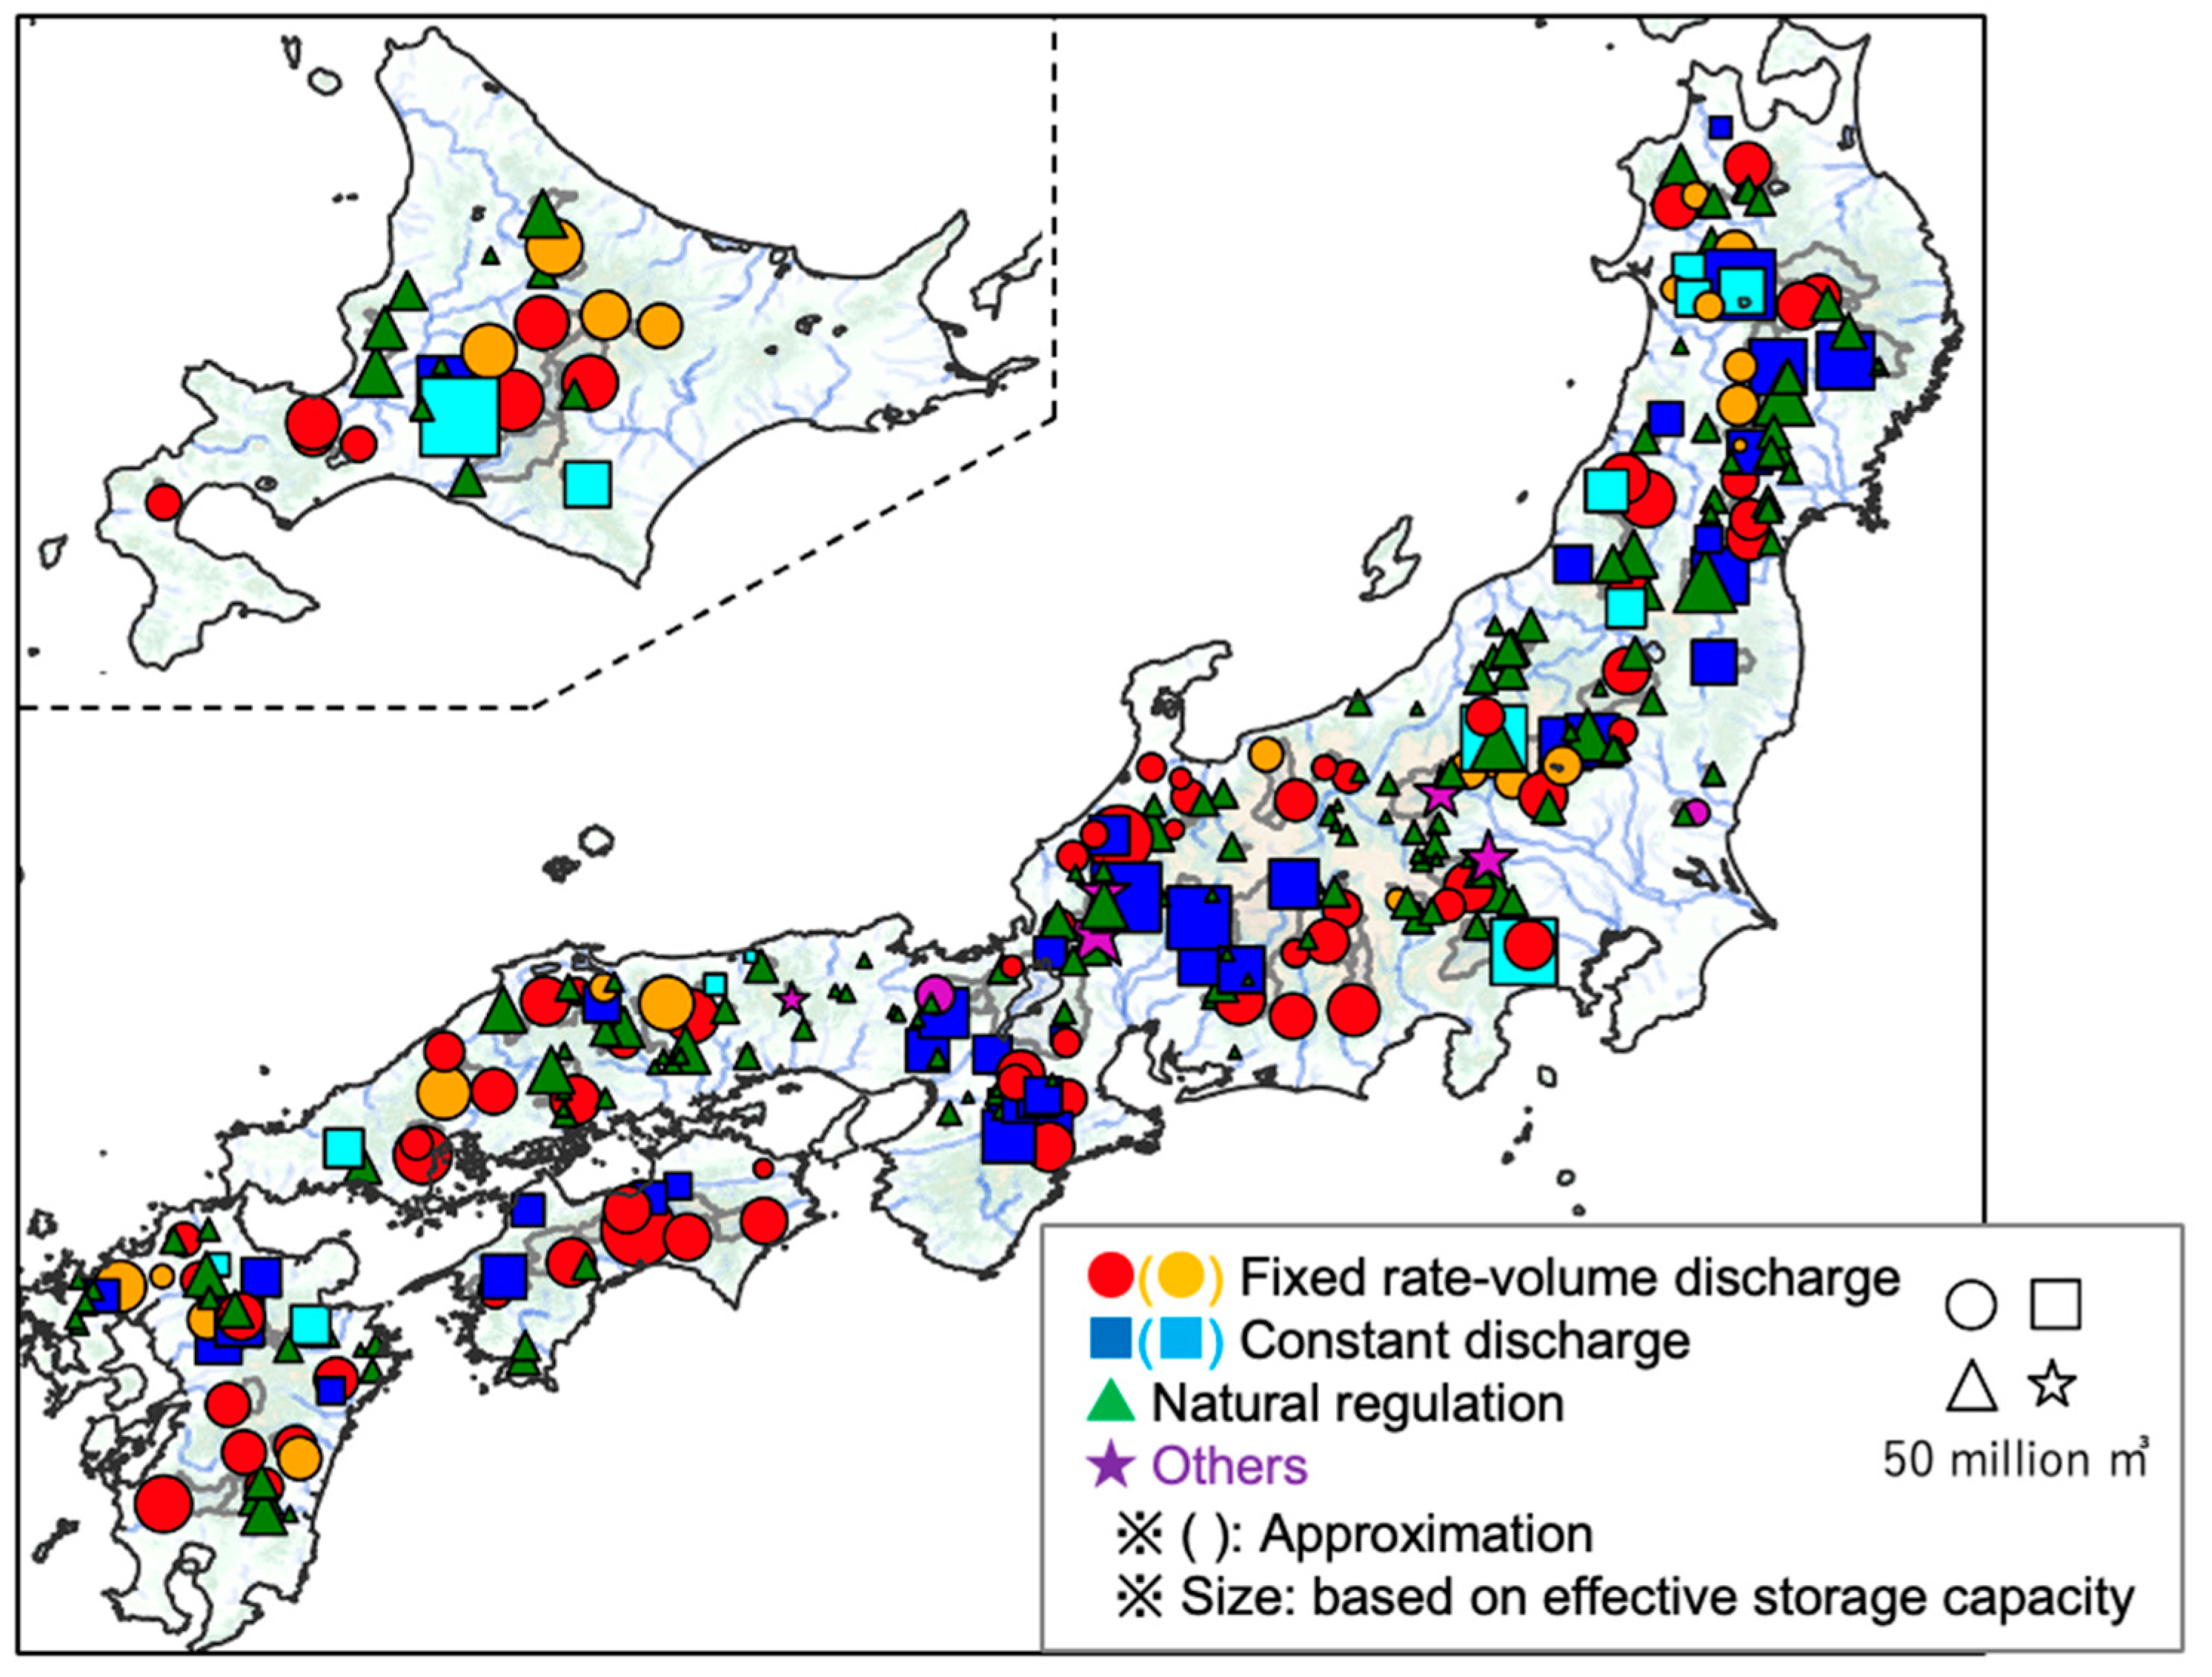
2.1. Case Study Area and Period

2.1.1. Multi-Purpose Reservoirs in Japan

This study targeted 326 multi-purpose reservoirs on class A rivers in Japan from the list published by Cabinet Secretariat [18]. These reservoirs account for ~50 % of the total effective storage capacity and ~85 % of the maximum flood control capacity in Japan and ~20 % of the number of all reservoirs and ~60 % of all multi-purpose reservoirs. Thus, it can be said that this study covers most of the reservoirs that have high priority regarding flood mitigation.
From a global perspective, the features of these reservoirs are small in both capacity and catchment area. Catchment areas range from a few to hundreds of km2, and reservoir capacities range from hundreds of thousands to hundreds of millions of m3. As a result, hourly forecasts for the next several days are needed to respond delicately to rapid inflow increases within only a few hours.
Regular rules for the operation and quantities of reservoirs in 2022 were reflected based on our survey of the list [18], the MLIT system [19], the homepages of each reservoir, official reports, etc. Types of the regular rules are fixed-rate volume discharge, constant discharge, natural regulation, and so on, the distributions of which are shown in Figure 2. Some assumptions and approximations were established due to unknowns or complexities.
Capacity allocation, which differs between seasons, e.g., flood season, was applied based on the starting point of each event. A few special capacities involving overlapping flood control and water use purposes were regarded as water use capacity. Flood control capacity for the non-flooding season was assumed to be midway between the usual levels of the season and those of the closest flood season in order to achieve a result close to the actual situation.

2.1.2. Observed Rainfall Data during Past 17 Years

The JMA’s radar and gauged composite product [20] of all flood seasons in the last 17 years (June–October from 2006 to 2022) was used as the input rainfall data. These data have been available on a 1 km grid since 2006. These data were used as the tentative rainfall forecast in conjunction with some elements of processing, including partial use, upscaling, multiplying, and shifting, as described in Section 2.4.

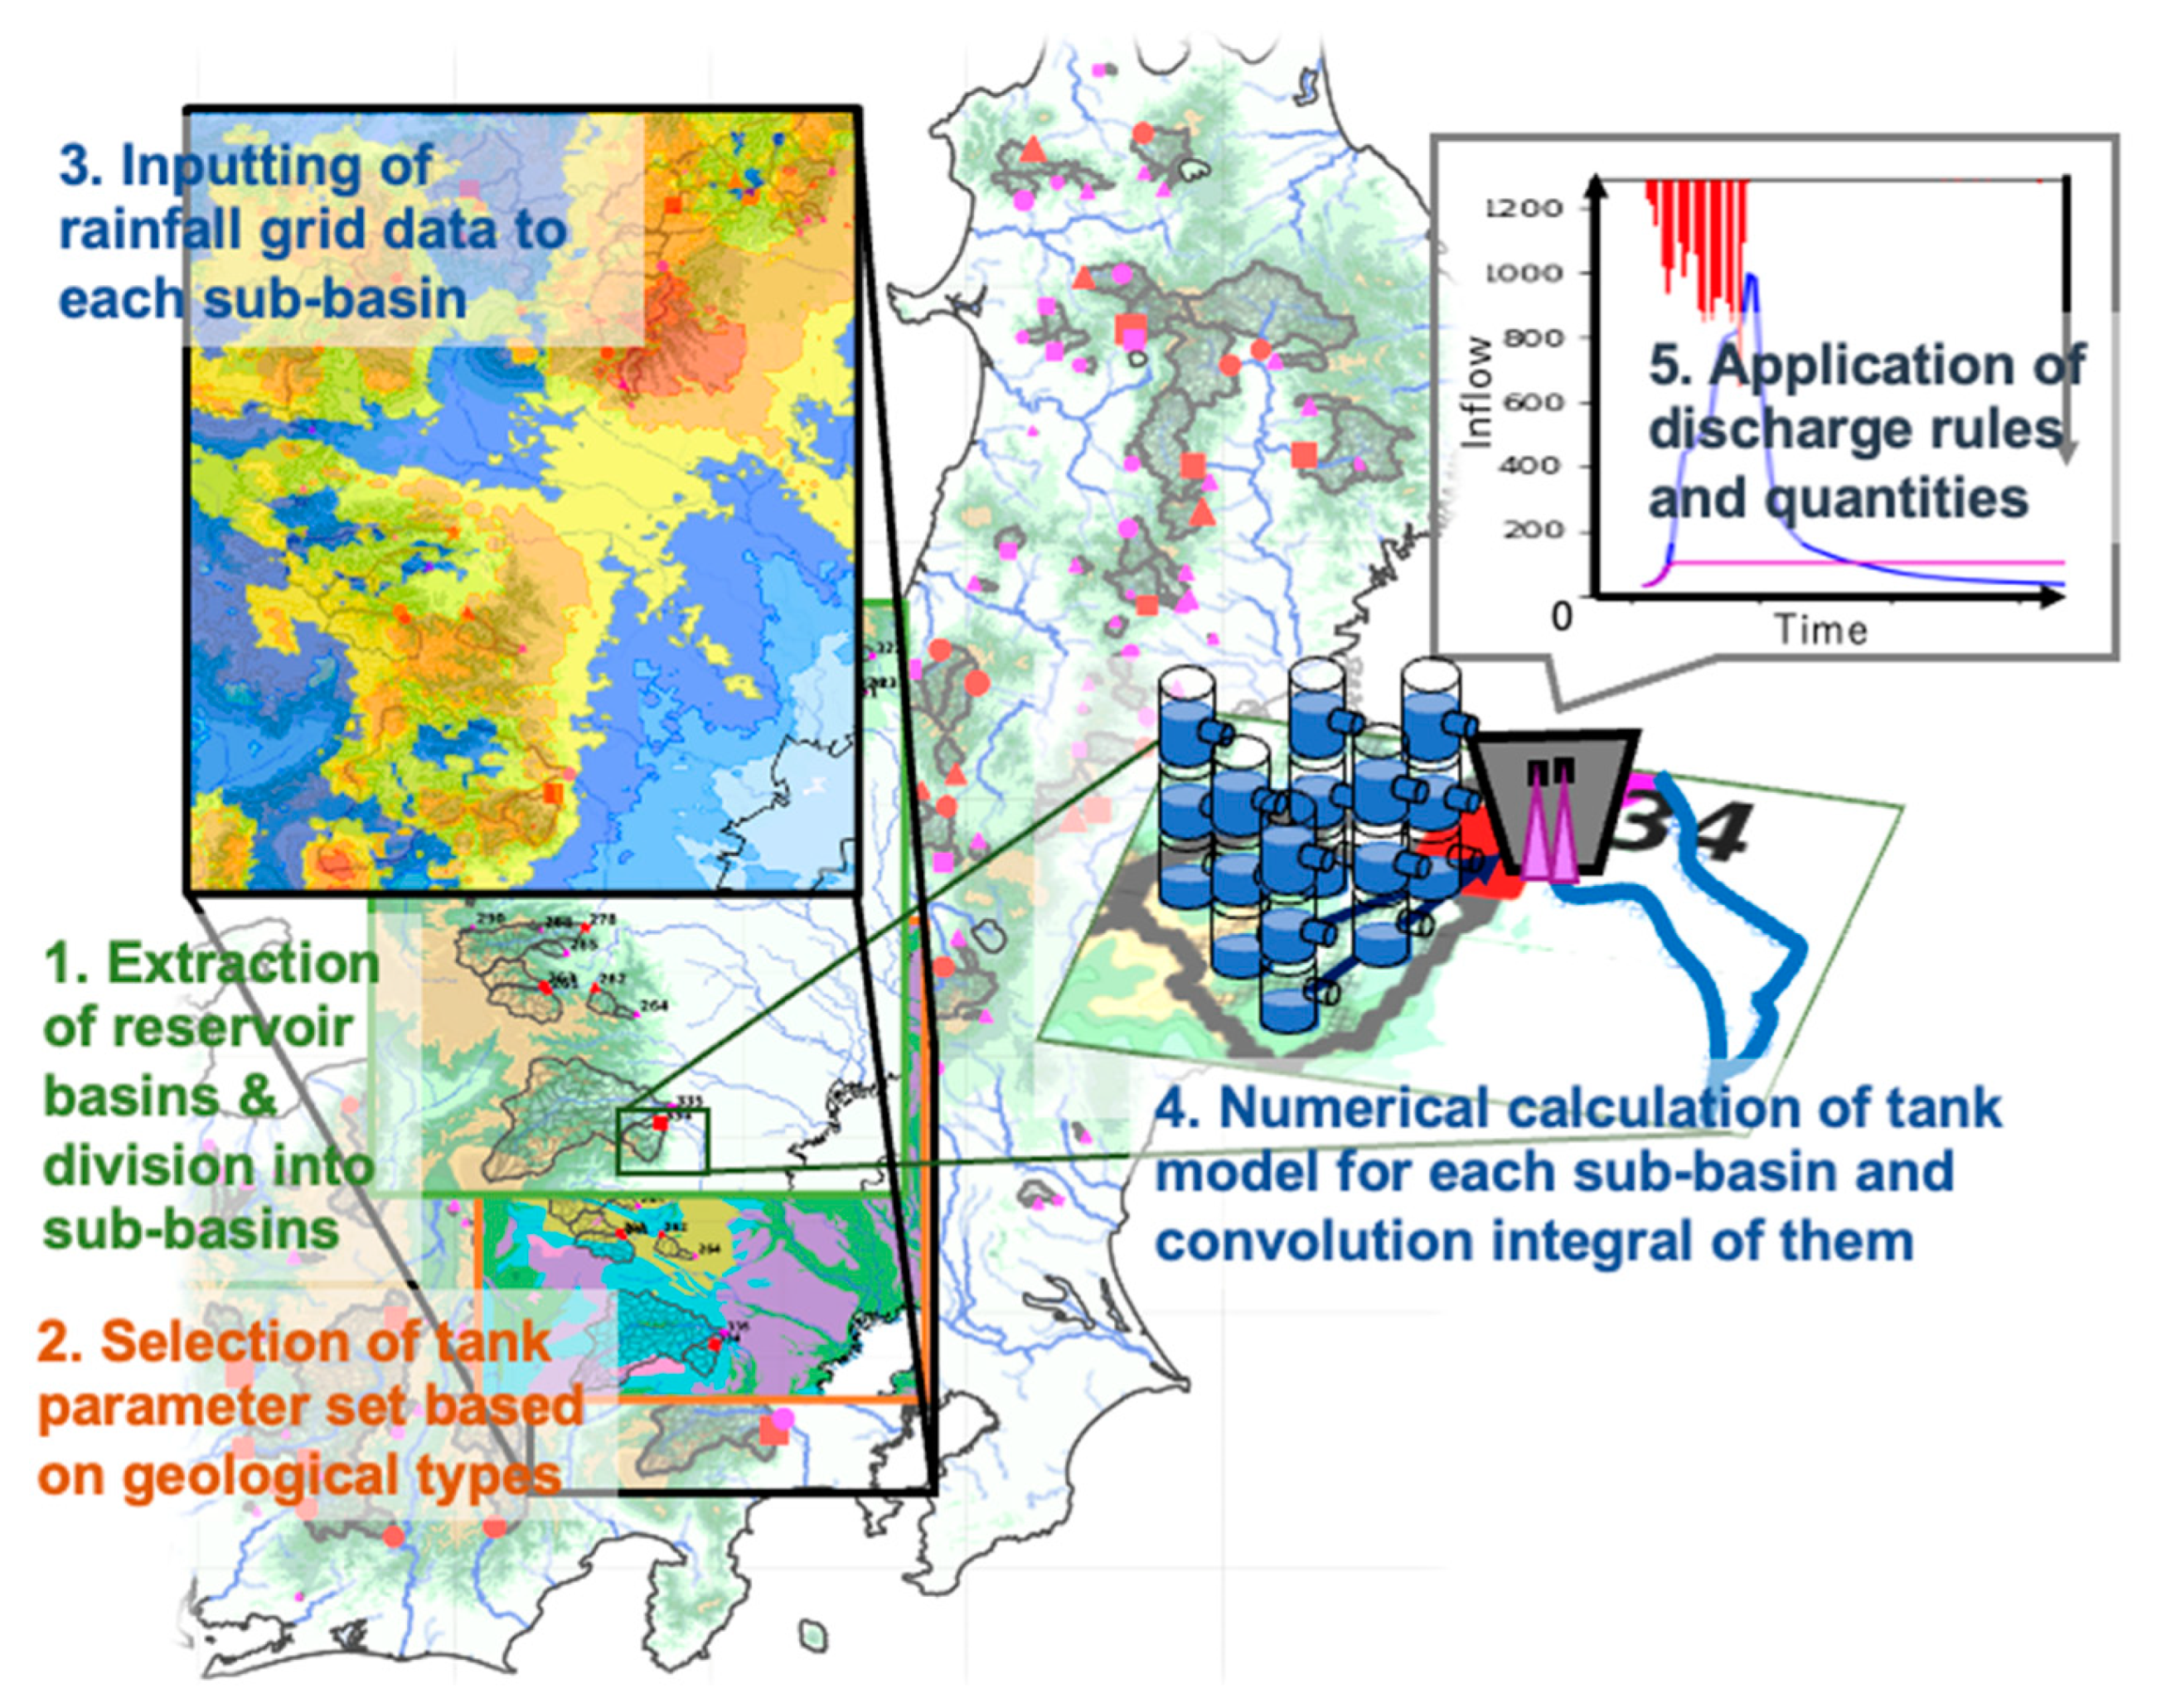
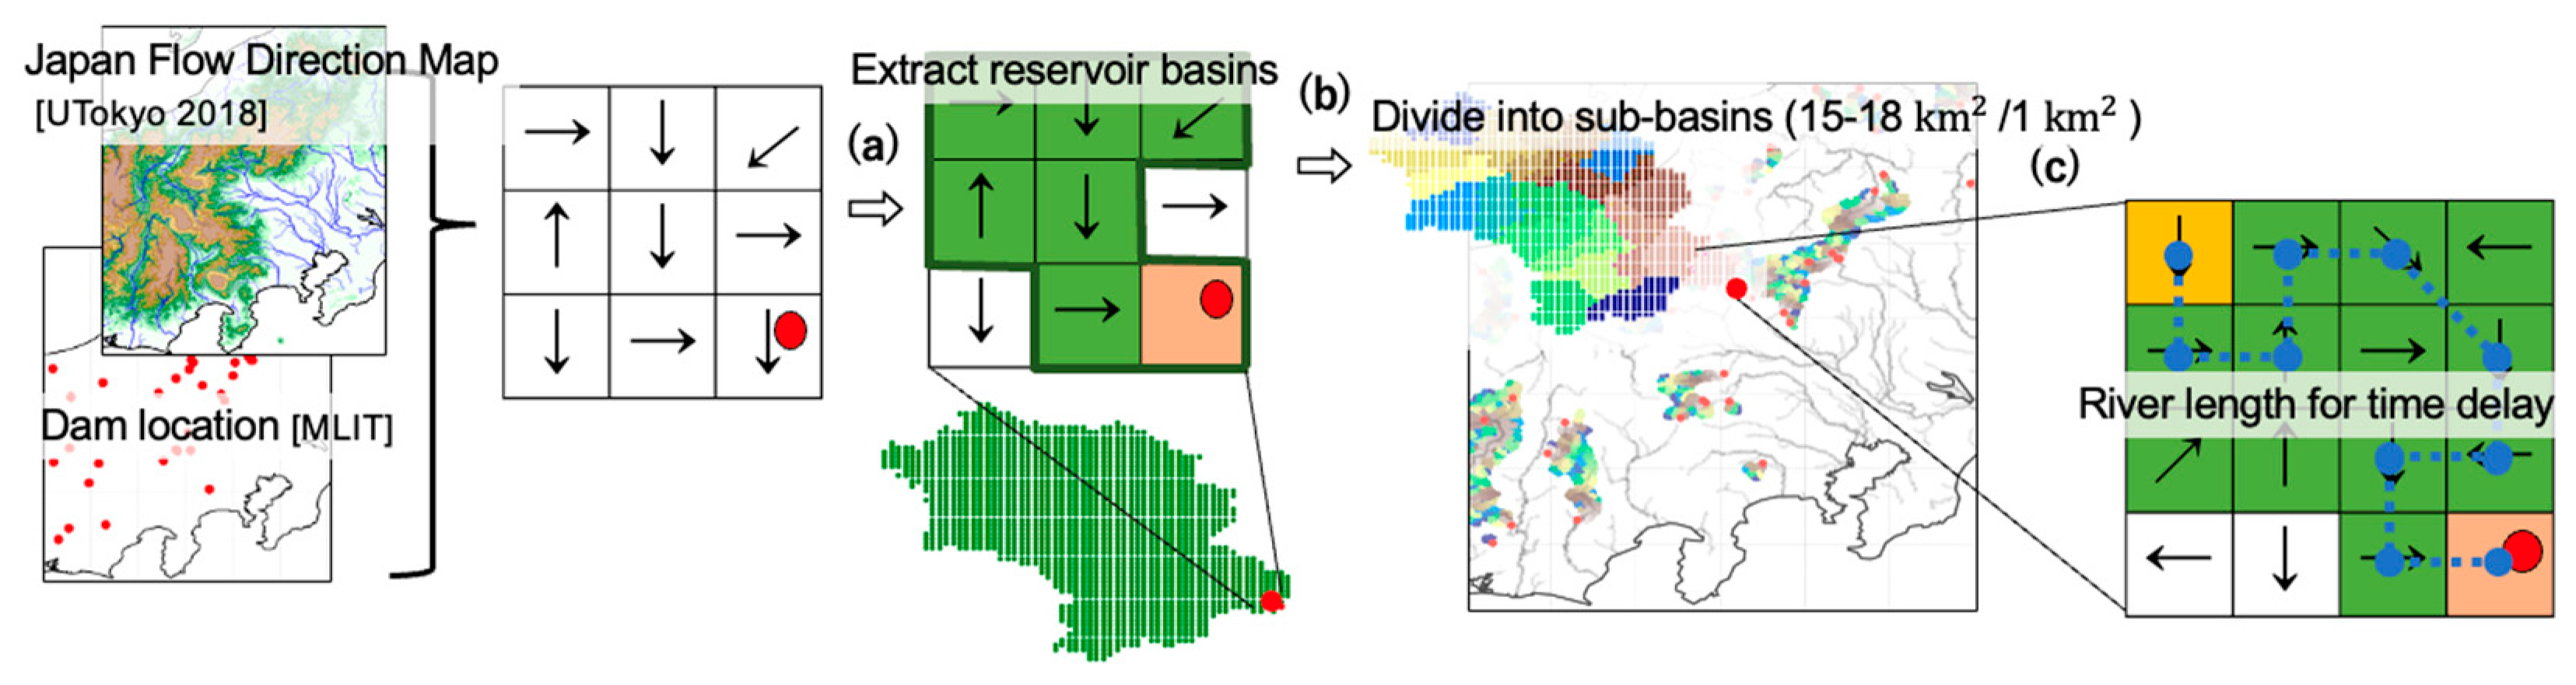
2.2. Nationwide Rainfall–Runoff Reservoir Model

The rainfall–runoff model was developed for computing the inflow from input rainfall, and the reservoir operation model was also developed for calculating storage from inflow under discharge rules. This system consists of five components, as shown in Figure 3, and they are described in this subsection.
First, reservoir basins’ information was obtained. Dam location data [21] and grid data containing flow direction and area for all of Japan with a spatial resolution of 15 arc seconds (~500 m) [22] were used. The schematic illustration of the method is shown in Figure 4. First, the grids where dams are located were identified. Then, the grids that flow into these reservoirs was regarded as reservoir basins (a). Furthermore, each reservoir basin was divided into sub-basins whose areas comprised about 15–18 km 2 or 1 km 2 depending on the reservoir catchment area (b). Finally, river lengths were calculated for the estimation of approximate propagation delay (c).
In order to obtain the hourly rainfall (mm/h) of each sub-basin, the association of rainfall grid data with the catchment grids and averages over each sub-basin was undertaken.
  • To convert rainfall to runoff in each sub-basin, the synthetic tank model of Ishihara, Kobatake, and the JMA operational runoff index was adopted [23,24,25]. The model conceptually expresses infiltration and storage in soil layers. Its five parameter sets are proposed based on geological features. Geological symbols (andesite, granite, etc.,) were assigned to the five parameter sets based on permeability. Then, one parameter set was selected for each sub-basin by calculating the component ratio based on land surveys [21].
  • Finally, inflows at dam site were obtained by summing the outputs of the sub-basins, roughly accounting for the propagation delay. Storage in the upstream reservoirs was also removed.
The accuracy assessment of inflow calculation showed that the basin and runoff characteristics were generally well represented, although there were uncertainties. In 47 cases, observed inflow was available [26] and used in this study, of which 55% had a Nash–Sutcliffe coefficient of over 0.7 and 55% and were within ±20% in volume error. In addition, the study that used rainfall–runoff–inundation (RRI) model for reservoirs nationwide produced almost the same accuracy [27], thereby confirming our assessment.
For computing storage at a reservoir, regular operation rules (Section 2.1.1) were applied to the inflows. Since only natural regulation is determined according to storage level rather than inflow, Equation (1) was introduced based on the assumption of rectangular flood control capacity and an outlet located on bottom of the capacity. Note that, in this study, discharge calculated by natural regulation was fixed, regardless of the initial change of storage due to the pre-release described later.
q [ m 3 / s ] = Maximum   discharge × Use   rate   of   flood   control   capacity

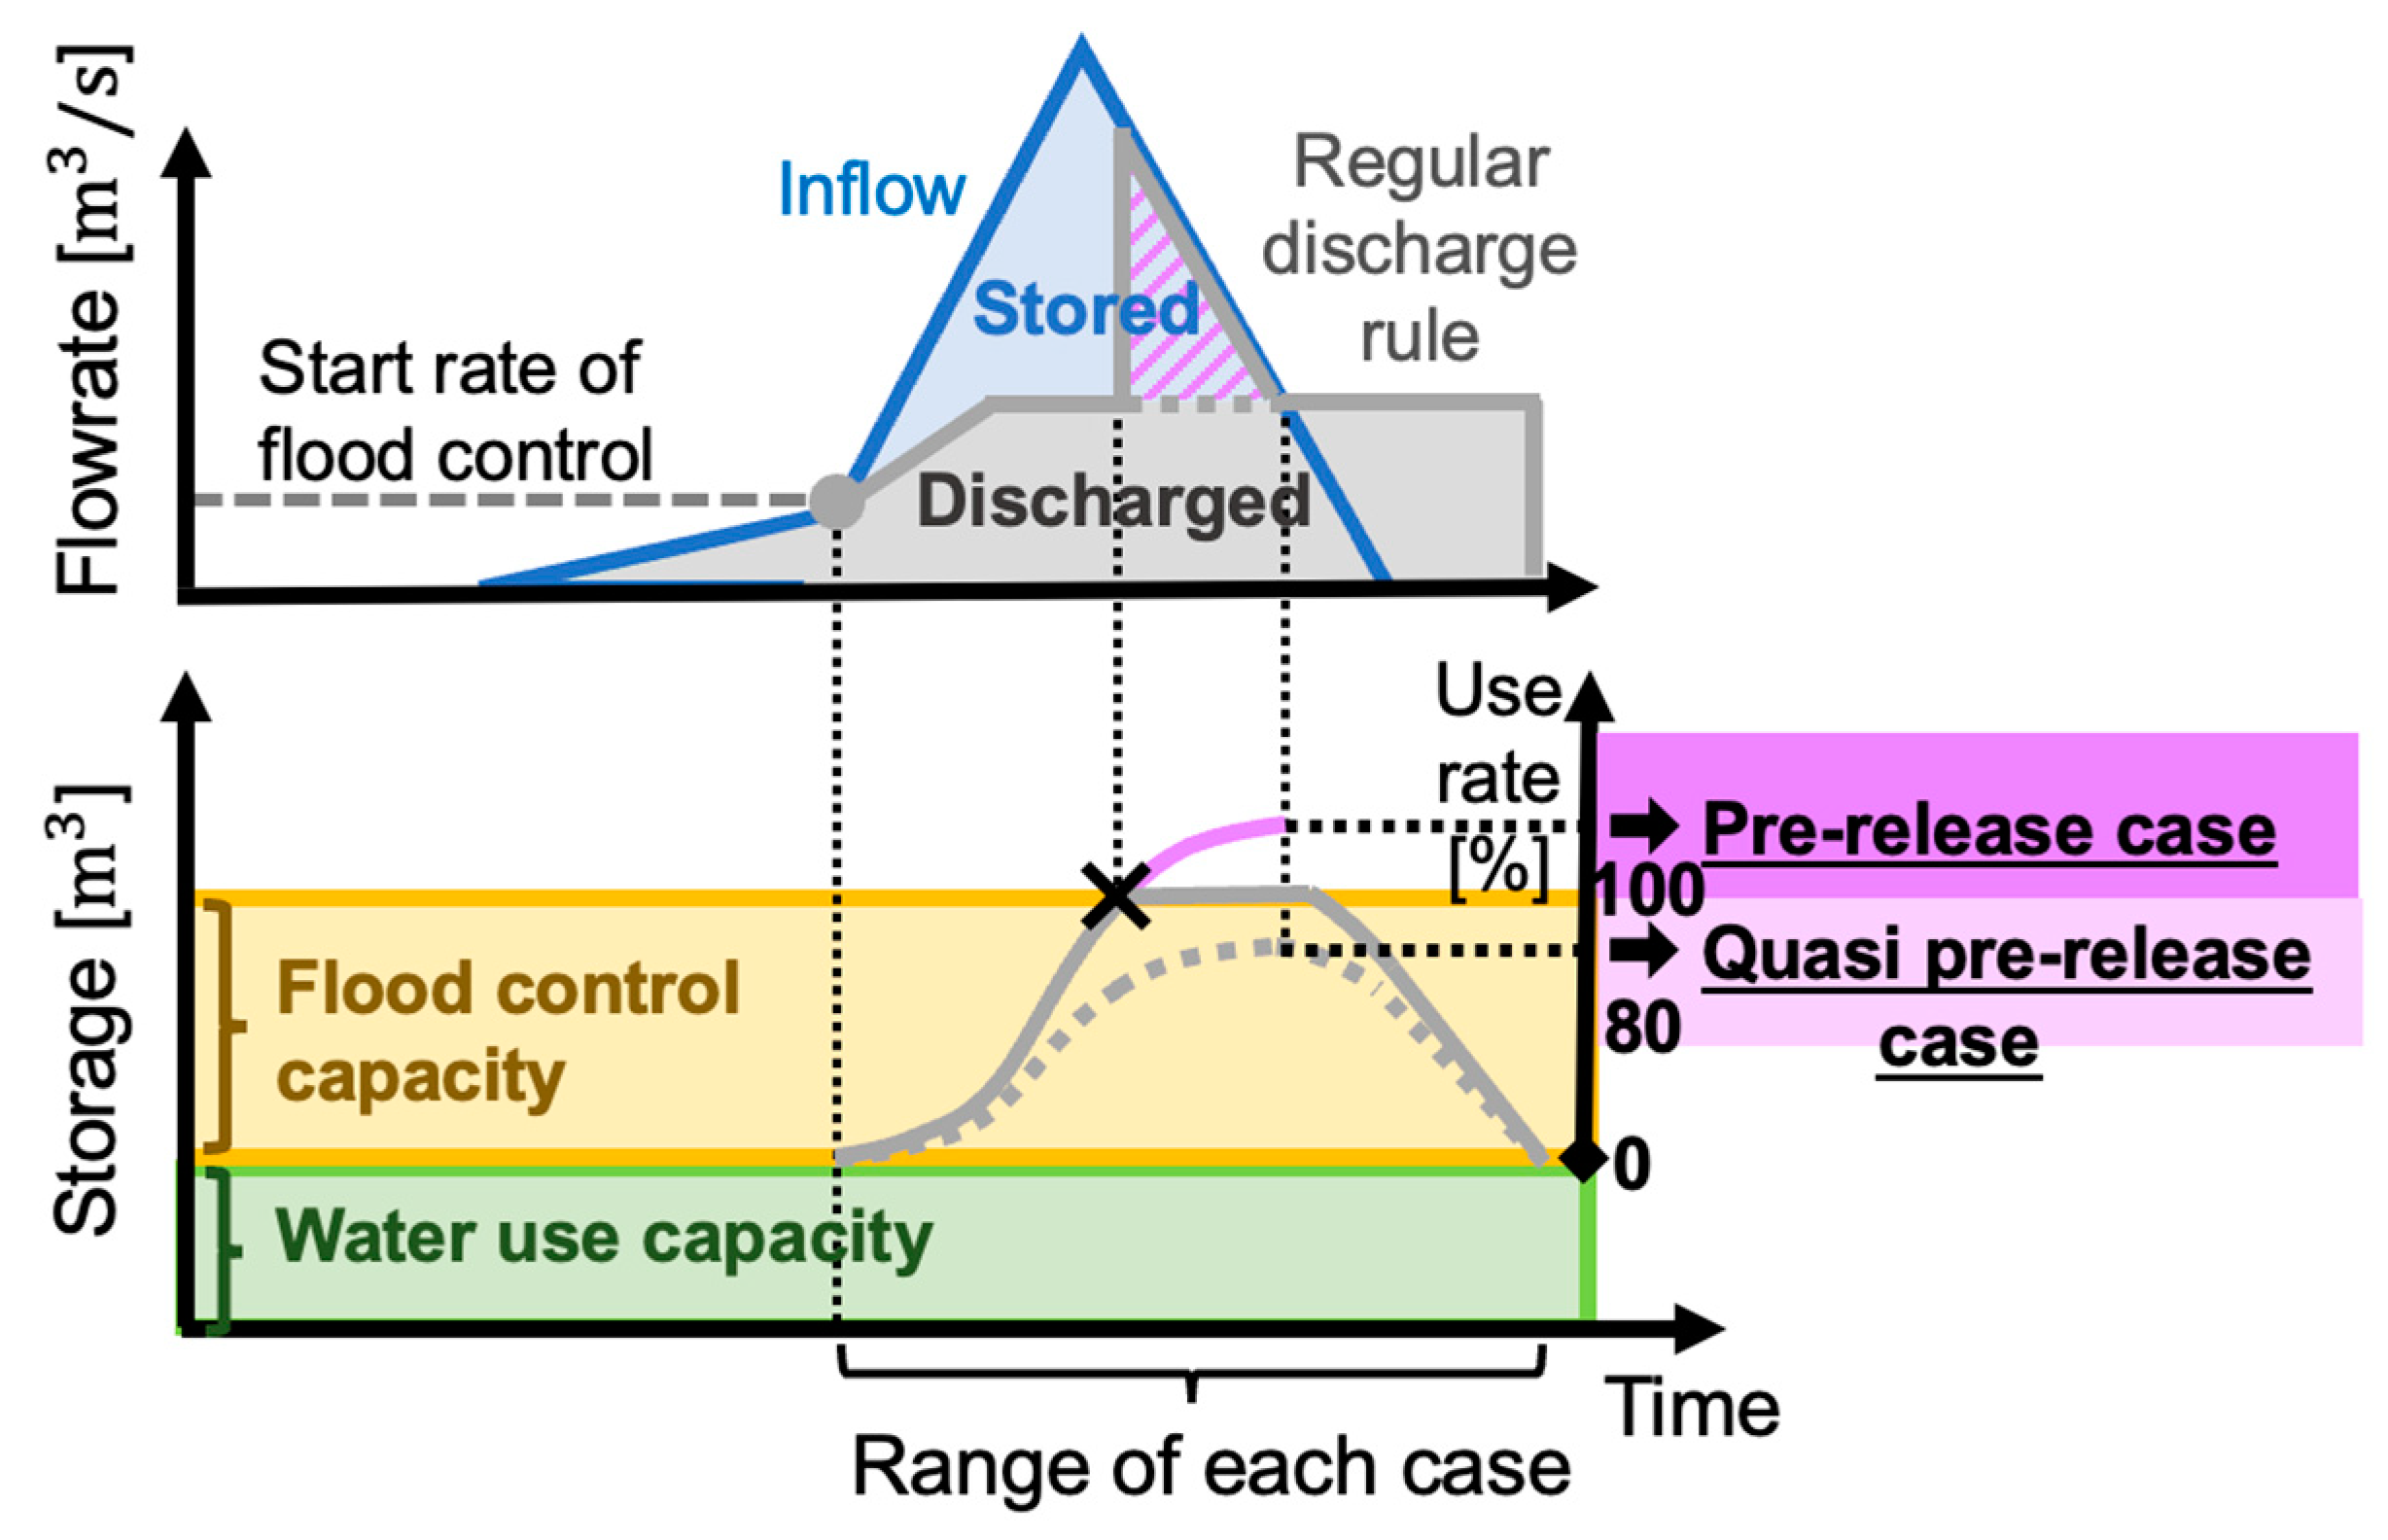
2.3. Definitions for Demand of Pre-Release

To represent the demand for pre-release, certain necessary definitions and assumptions were set. This subsection is divided into three parts. In Section 2.3.1, the classification of floods in terms of the necessity of pre-release is defined. In Section 2.3.2, the assumed method of pre-release is explained. In Section 2.3.3, two risks in evaluating the results are explained.

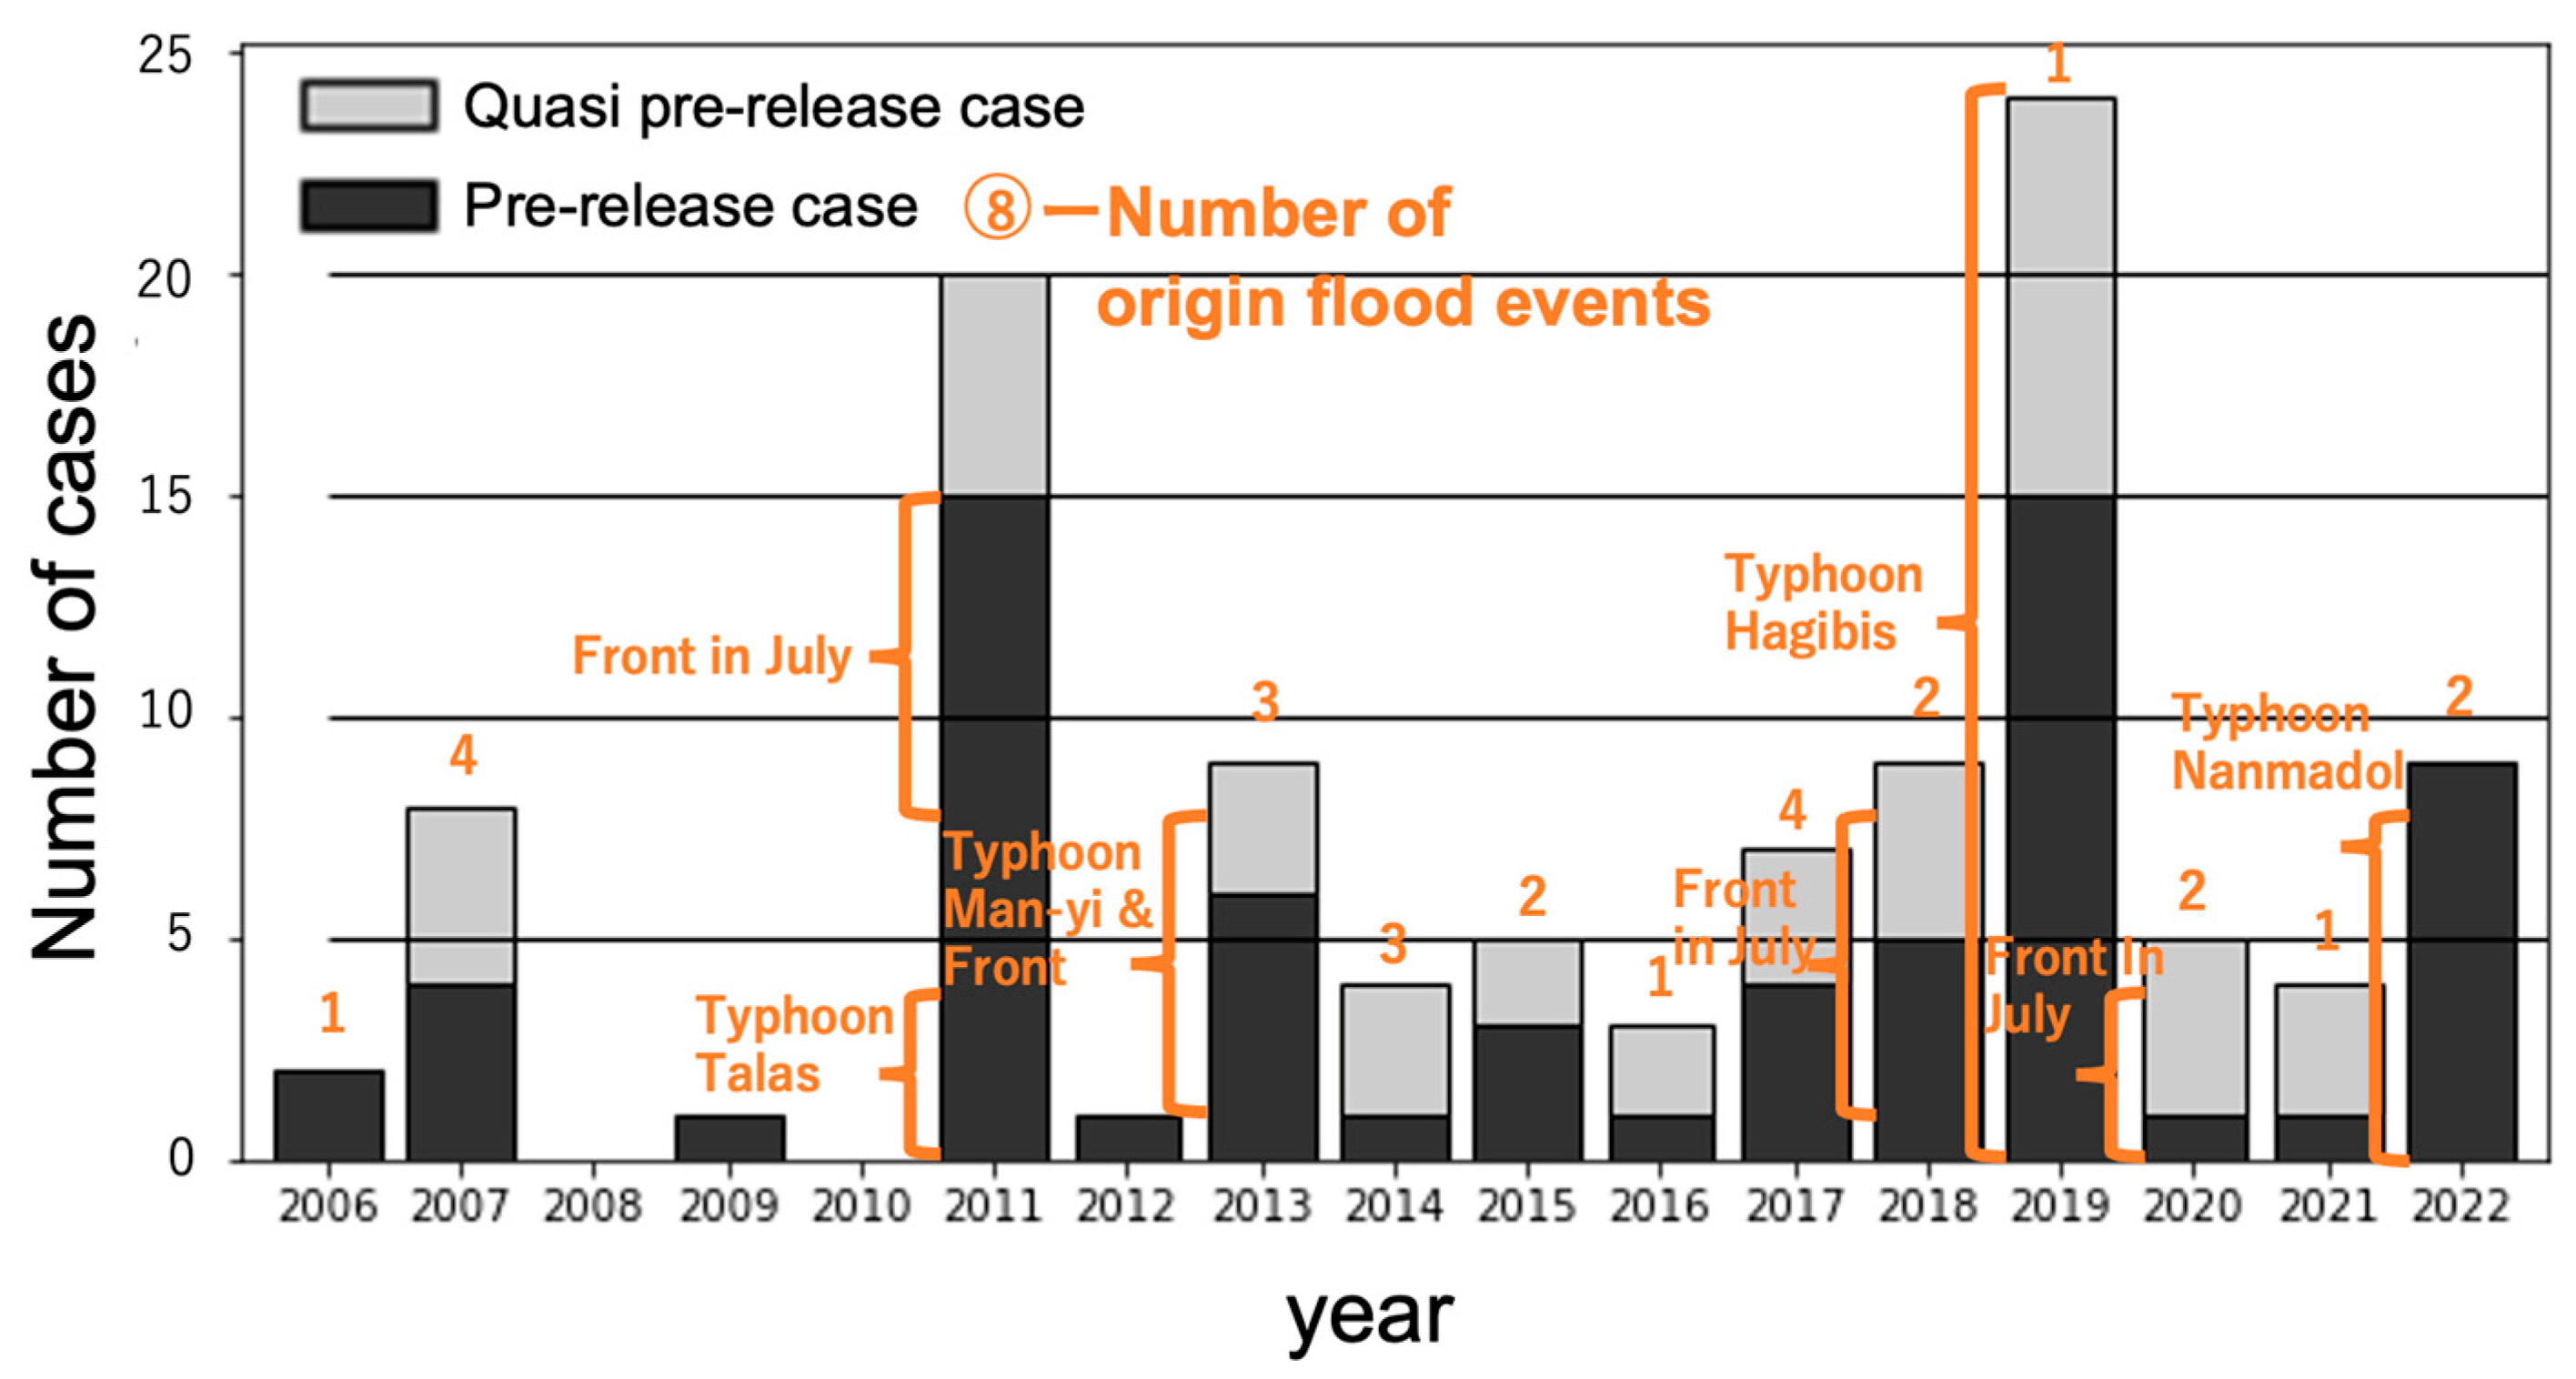
2.3.1. “Pre-Release Case” and “Quasi-Pre-Release Case”

Pre-release case and quasi-pre-release case were defined to treat floods in terms of the necessity of pre-release, per reservoir, and per range under same influence. The schematic diagram is shown in Figure 5.
The period of each case is defined as from the beginning of flood control until the storage level returns to its initial state. At the beginning, only the flood control capacity is set as empty. The operation for reducing storage after floods is assumed as being achieved by the maximum discharge during flood control.
The “pre-release case” requires pre-release, in which the capacity would be exceeded if storage continued as in the regular rules (shown in Section 2.1.1) without shifting to emergency operations (purple line in Figure 5). Cases not exceeding capacity but using more than 80% of flood control capacity are defined as “quasi-pre-release cases”.

2.3.2. Settings of Pre-Release Simulation

The simple and intuitive pre-release method is assumed based on MLIT guidelines [4]. Simulation examples are shown in Figure 6 and Figure 7 in Section 2.3.3 with explanations regarding its risk assessment.
The decision-making period starts 3 days before each case and is updated based on the tentative rainfall forecast described in Section 2.4 every 3 h, which is the main update interval of JMA forecasts. Moreover, a 1 h delay prior to discharge is applied from when the forecast is expected, considering the time required to receive and analyze forecasts, to inform downstream residents, etc.
Pre-release flow rate is set as the starting flow rate of flood control, which equals a harmless flow or flood volume at most reservoirs at its fullest extent. That is, the priority is given to the avoidance of emergency release risks (Section 2.3.3) rather than application methods that aim to suppress discharge due to water use risk (Section 2.3.3), power generation, etc. The pre-release target amount is the excess (purple oblique lines in Figure 5) deterministically estimated at every forecast update.

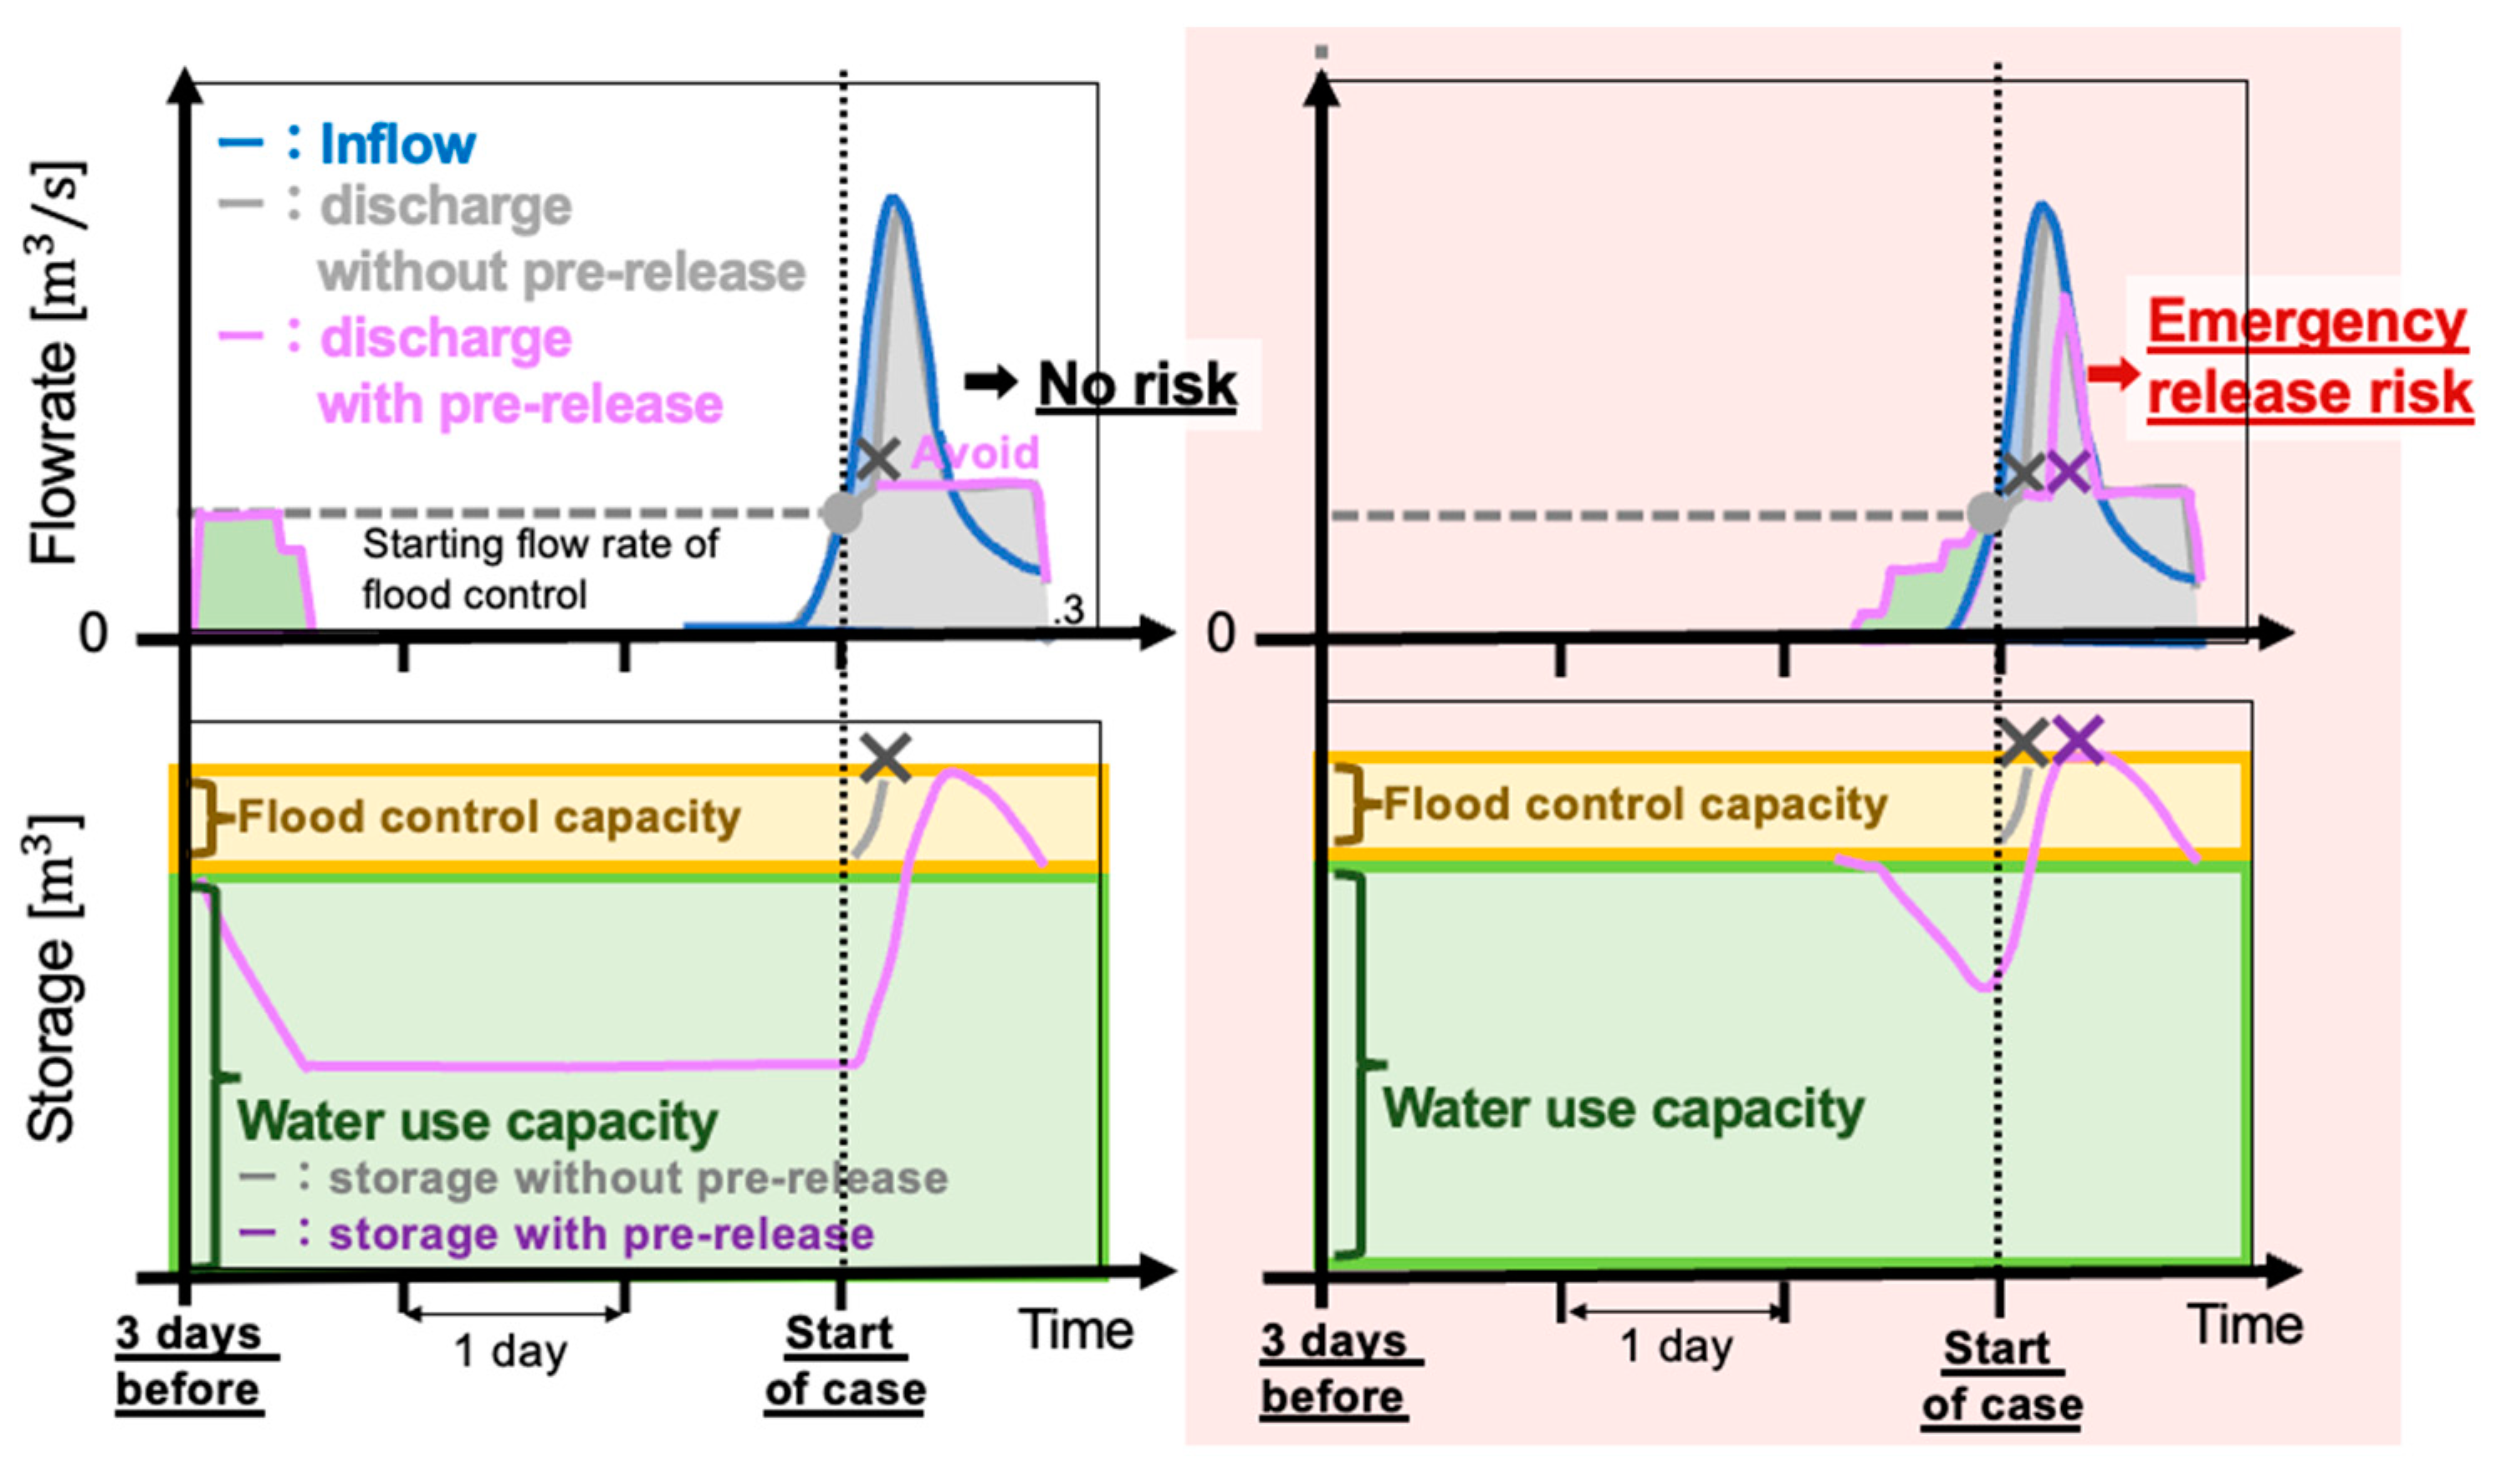
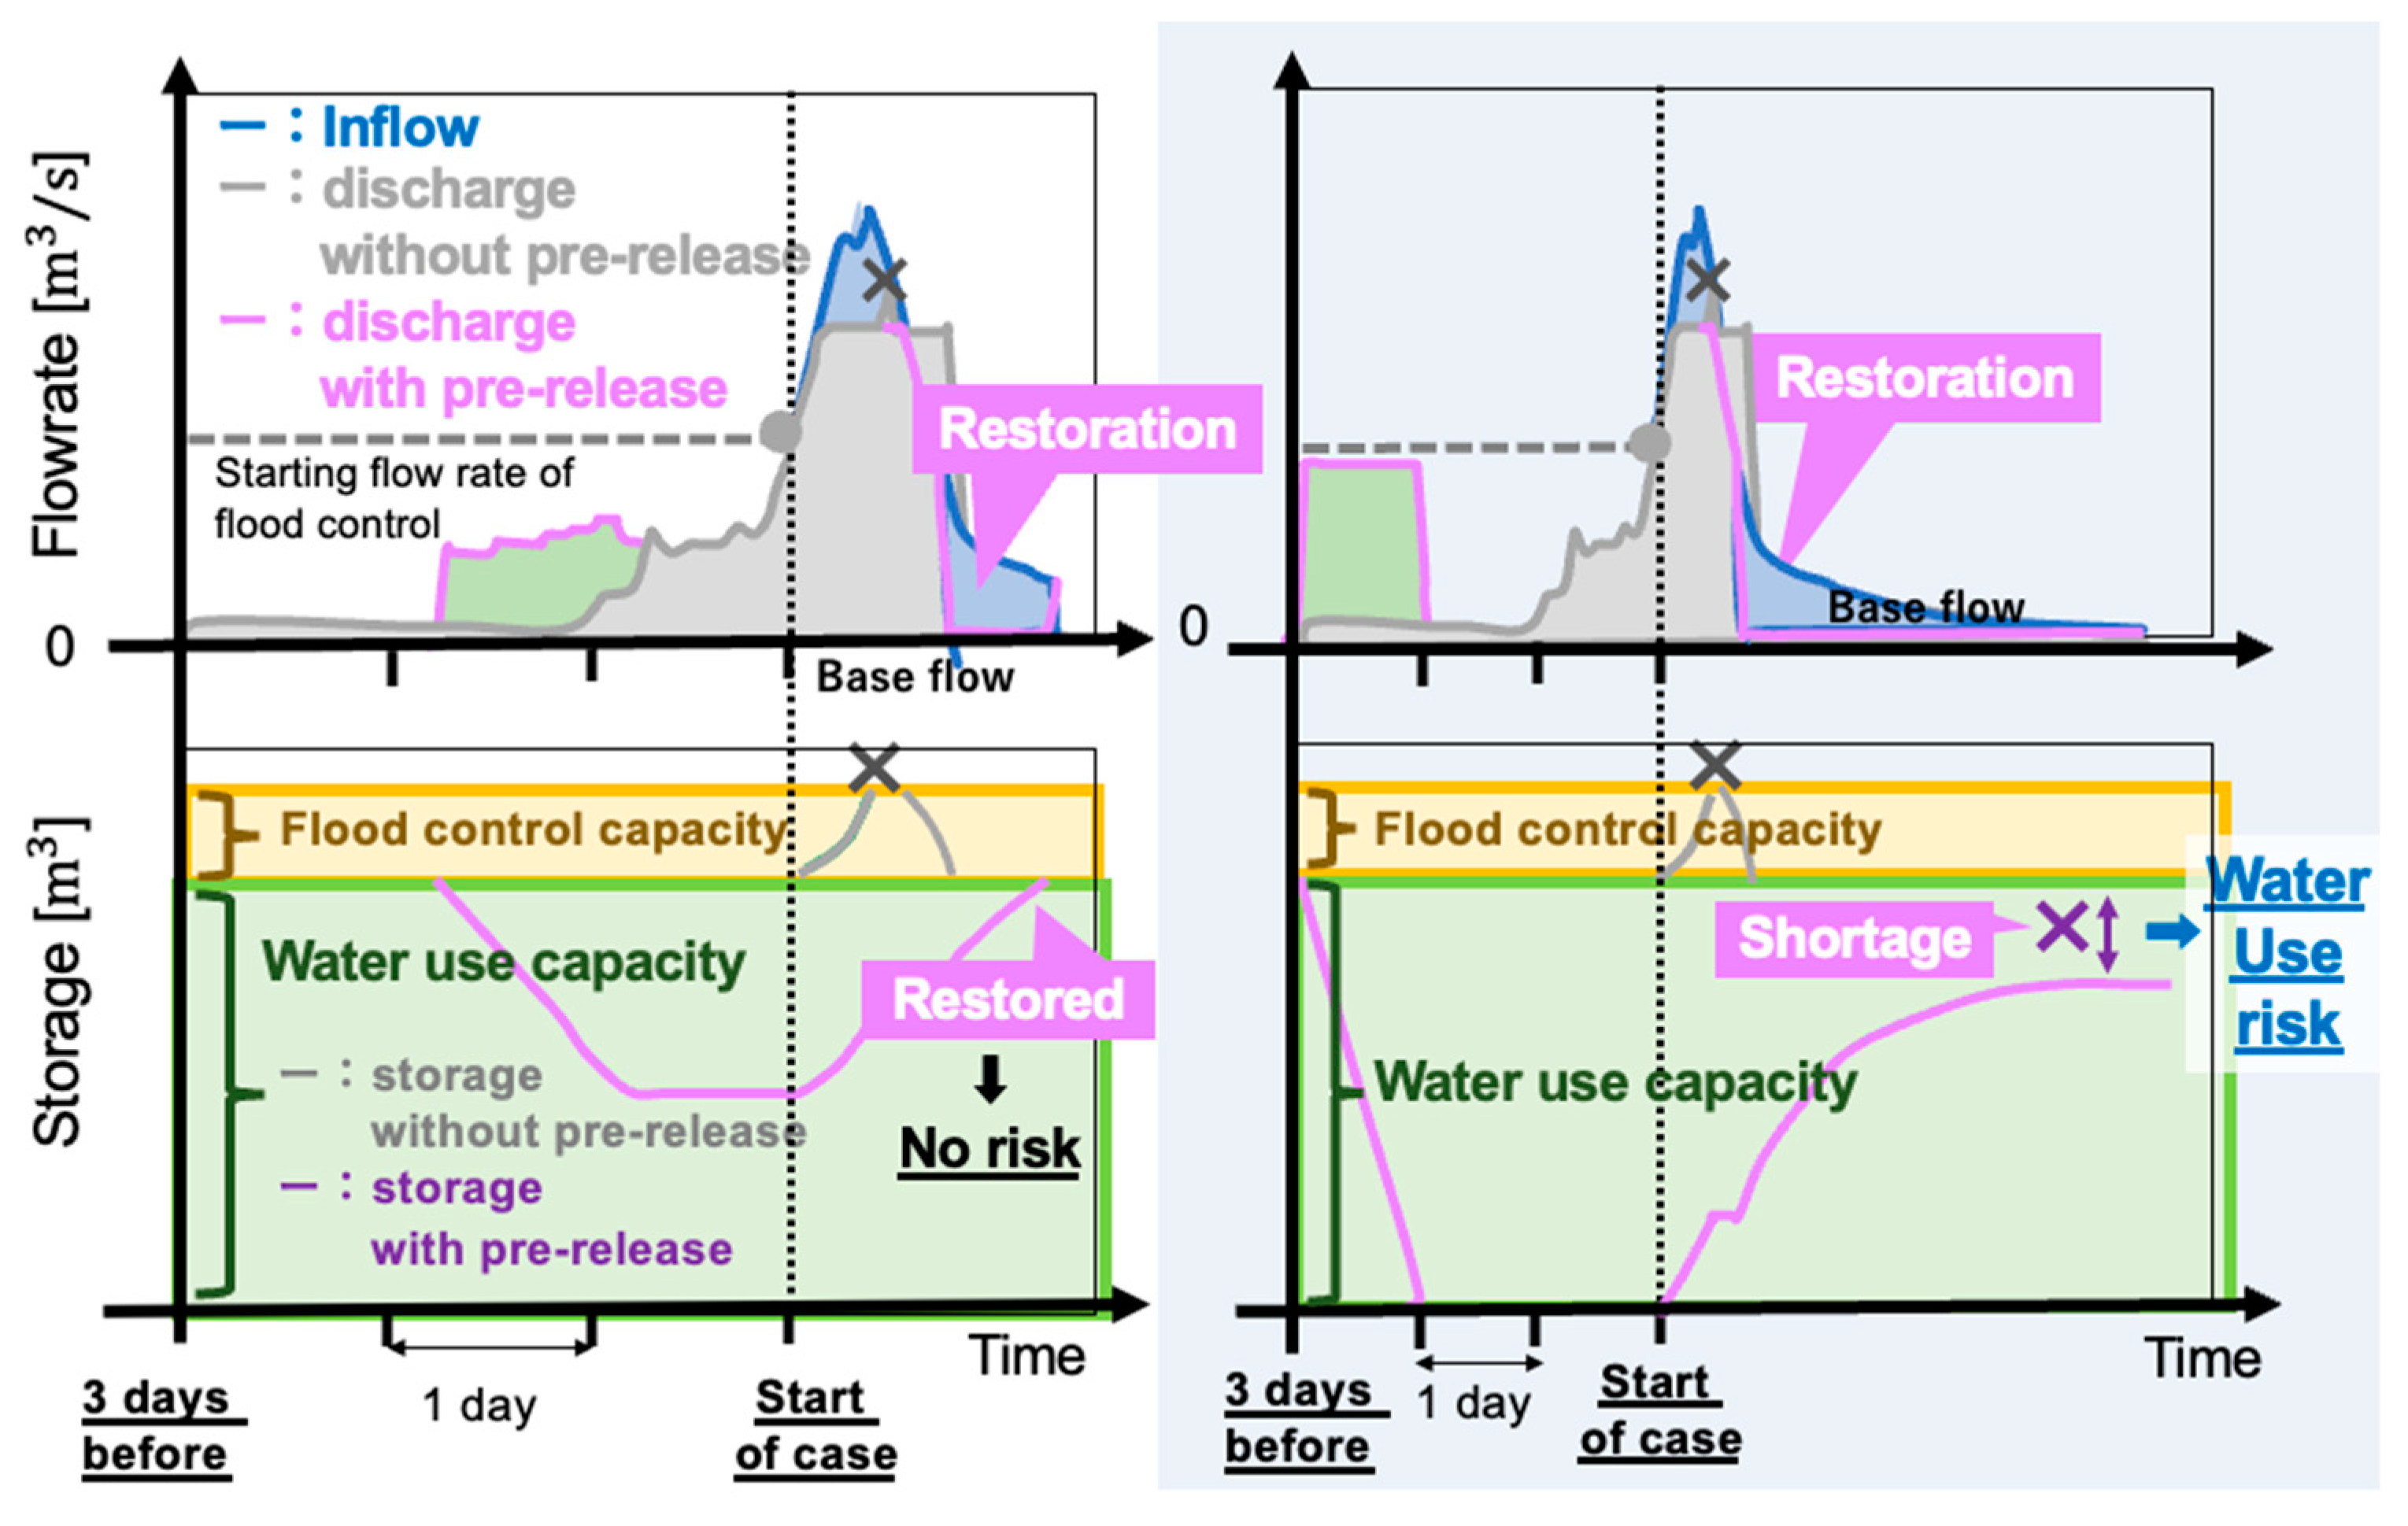
2.3.3. Two Risks: Emergency Release Risk and Water Use Risk

The outputs of pre-release simulations were evaluated in terms of two risks: emergency release risk and water use risk. Examples are shown in Figure 6 and Figure 7.
  • Emergency release risk
The failure to avoid emergency spillway gate operation is regarded as this risk. While the left simulation in Figure 6 is classified as no risk because emergency release can be avoided through sufficient pre-release at an early stage based on almost perfect forecasts, the right simulation is classified as an emergency release risk because it cannot be avoided, due to insufficient pre-release based on an underestimated forecast.
In addition, two exceptions were made. First, capacity exceedance below 5 % of the stored flood is set to be allowed so that final fine-tuning does not affect risk evaluation and because a minor emergency operation has little impact on the downstream. Second, a case where water use capacity is fully pre-discharged is classified as no risk because its limitations are not derived from the rainfall forecasting but from the existing reservoir capacity.
Figure 6. Pre-release simulation classified into no risk (left) and emergency release risk (right).
Water 15 01277 g006
  • Water use risk
The failure to restore water use capacity is regarded as this risk. While the left simulation in Figure 7 is classified as no risk because water use capacity can be restored by restoration operations, the right simulation is classified as a water use risk because it cannot be recovered, due to excessive pre-release based on even greater overestimation.
In this study, a shortage of below 5 % of water use capacity is set to be allowed, and the restoration operations can use the inflow more than base flow (averaged inflow over the flood season) after flood control. If the capacity is not recovered, the case continues until the inflow is lower than the base flow.
Figure 7. Pre-release simulation classified into no risk (left) and water use risk (right).
Water 15 01277 g007

2.4. Evaluation Methods for Five Elements of Rainfall Forecast Required for Pre-Release

In this subsection, the method for evaluating the five elements of rainfall forecast required for pre-release is described; these are as follows: the characteristics of the situation requiring pre-release (Section 2.4.1), forecast length (Section 2.4.2), spatial resolution (Section 2.4.3), rainfall amount accuracy (Section 2.4.4), and the position accuracy of the rainfall zone (Section 2.4.5).

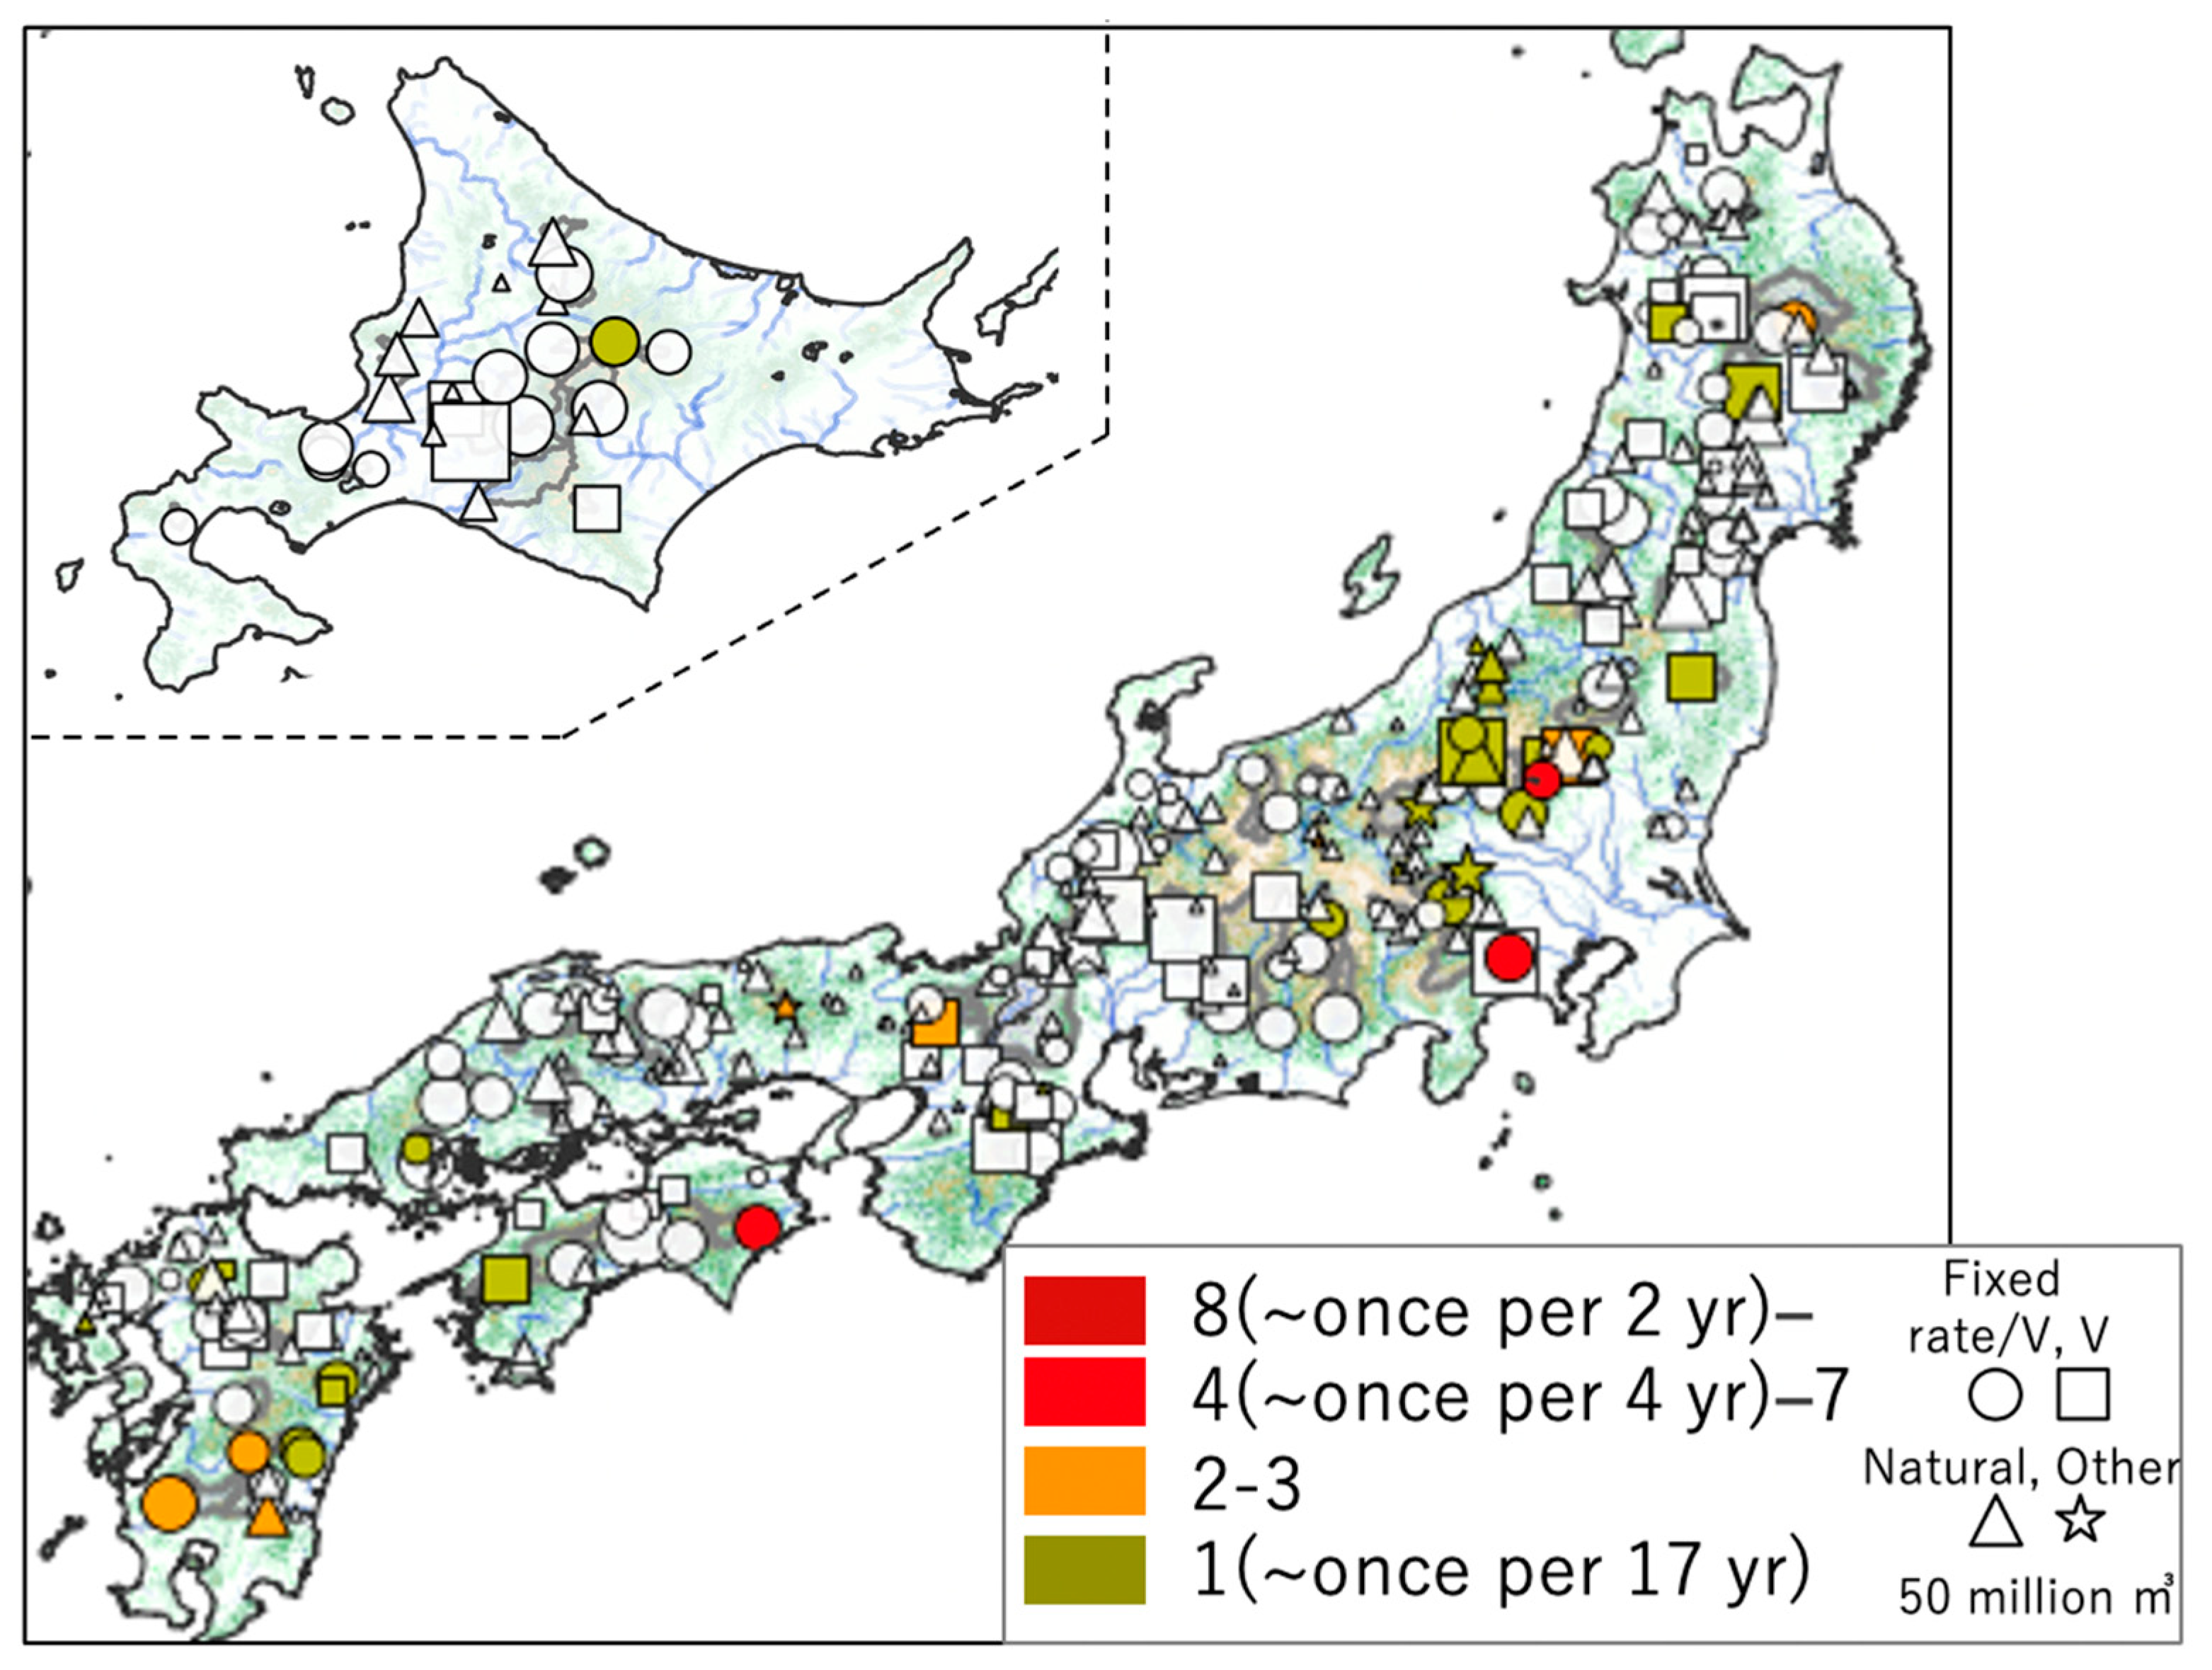
2.4.1. Characteristics of the Situation Requiring Pre-Release (Frequency, Regionality, and Meteorological Causes)
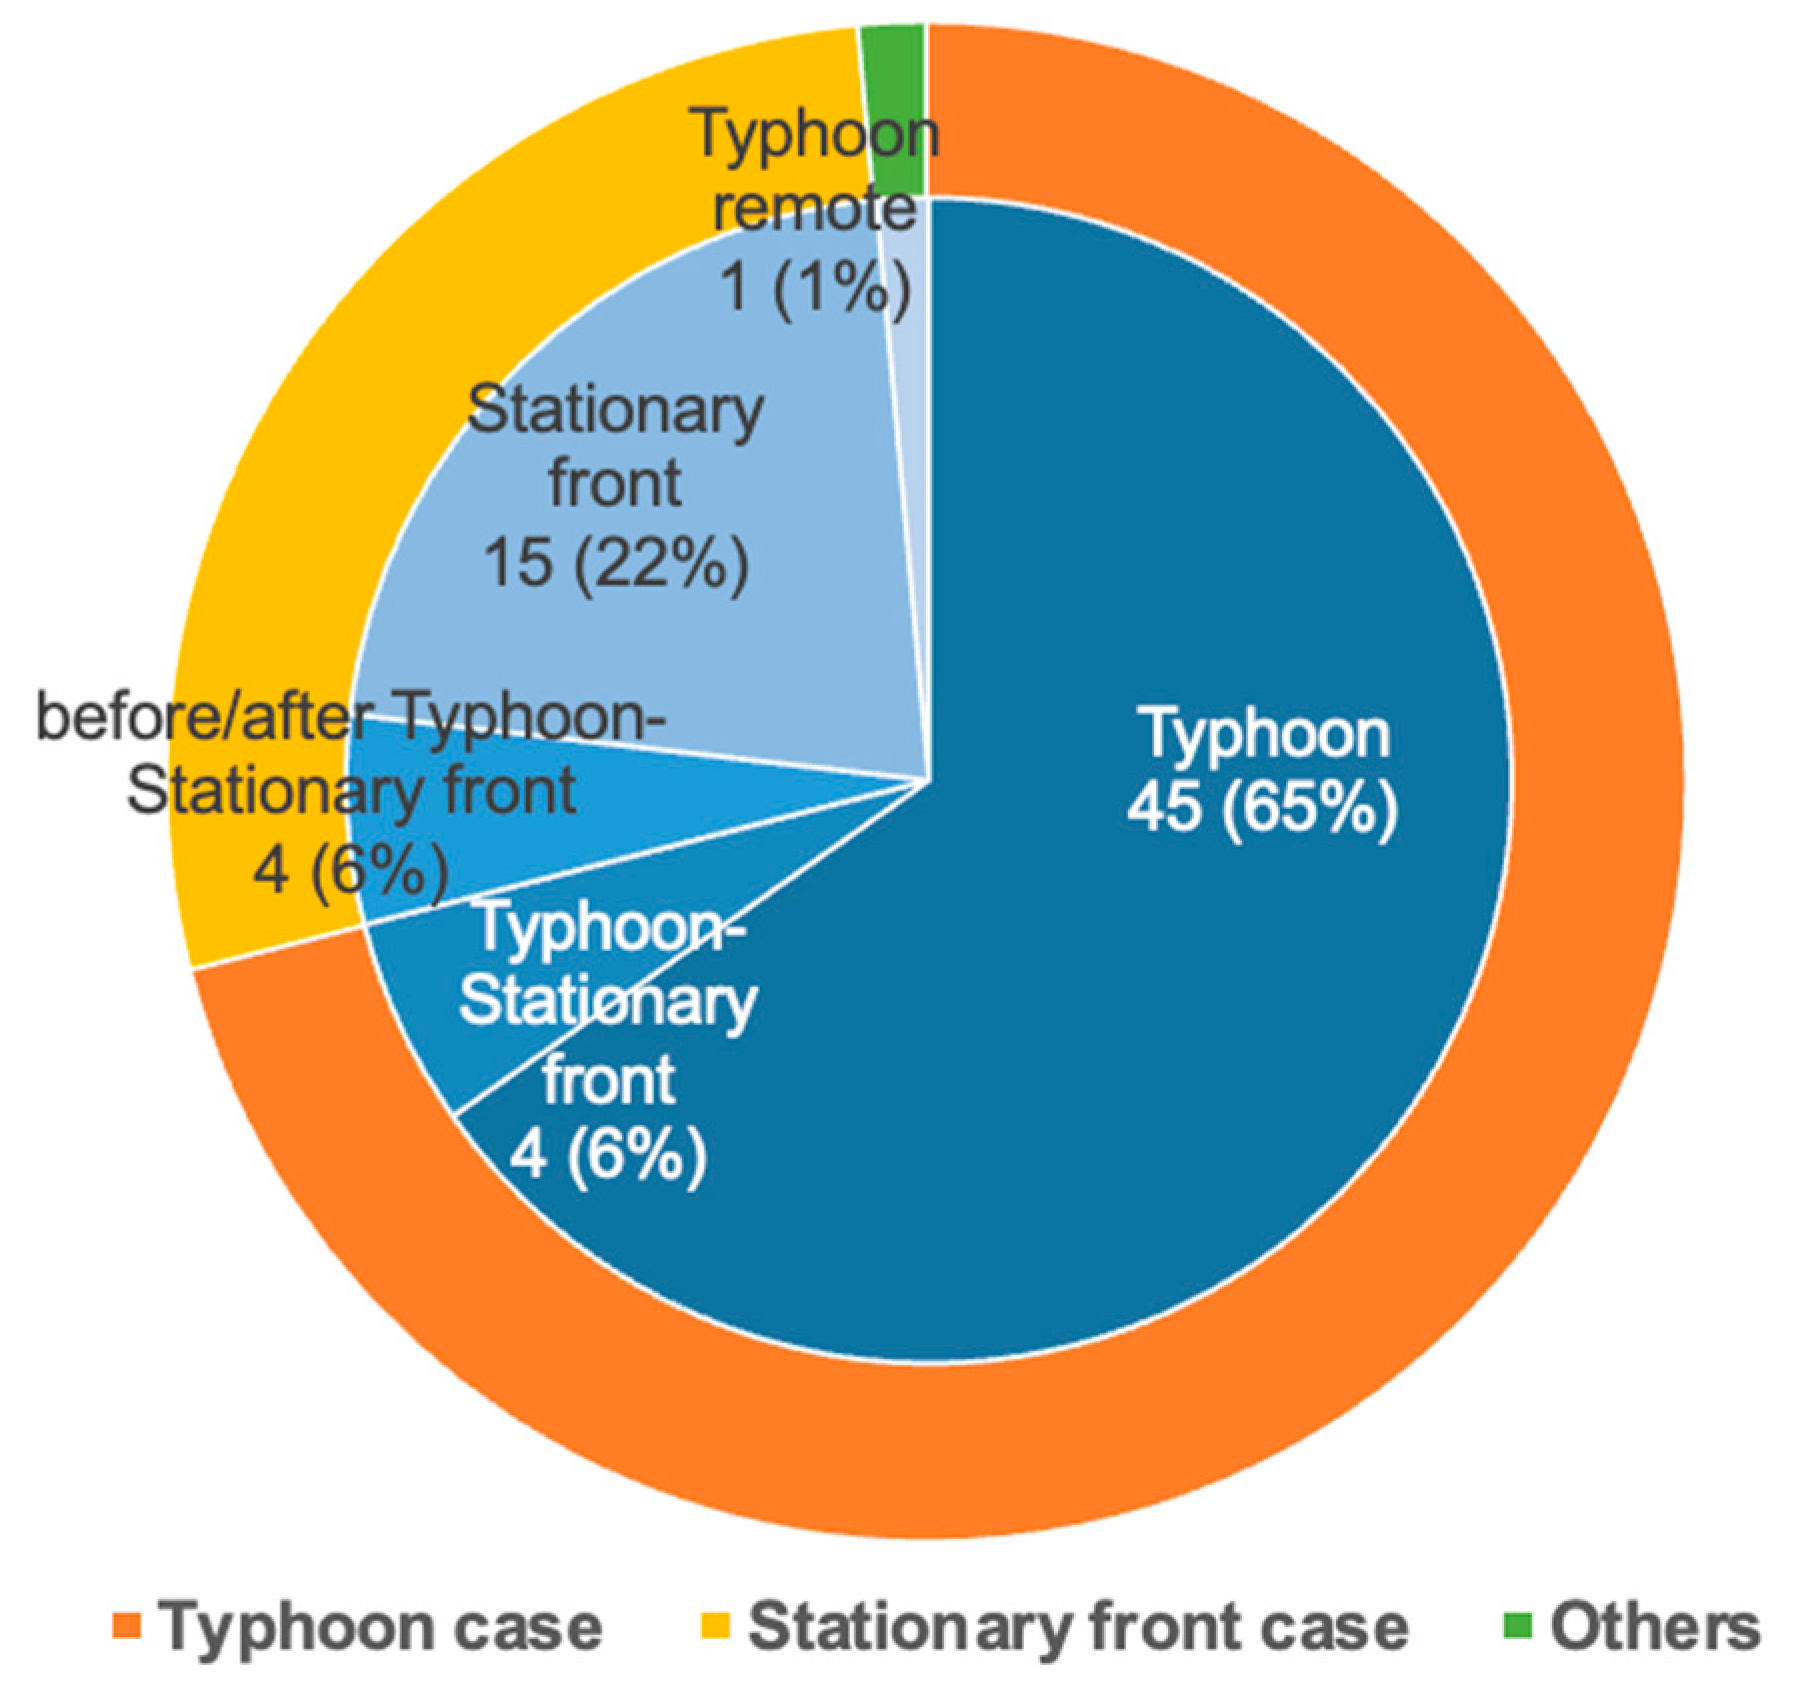
First, the pre-release and quasi-pre-release cases (Section 2.3.1) were extracted and confirmed by inputting observed rainfall data (Section 2.1.2) into the rainfall–runoff reservoir model (Section 2.2). Then, pre-release cases were classified based on causal synoptic scale disturbances defined as follows based on Tsuguti and Kato [11]:
  • Typhoon case:
within 500 km from typhoon center between 6 h prior to the start and the end of the case.
  • Stationary front case:
from correspondence with disaster reports by MLIT.
  • Other:
Low pressure, remote typhoon, etc.
In addition, the combination of typhoon and stationary front was also examined.

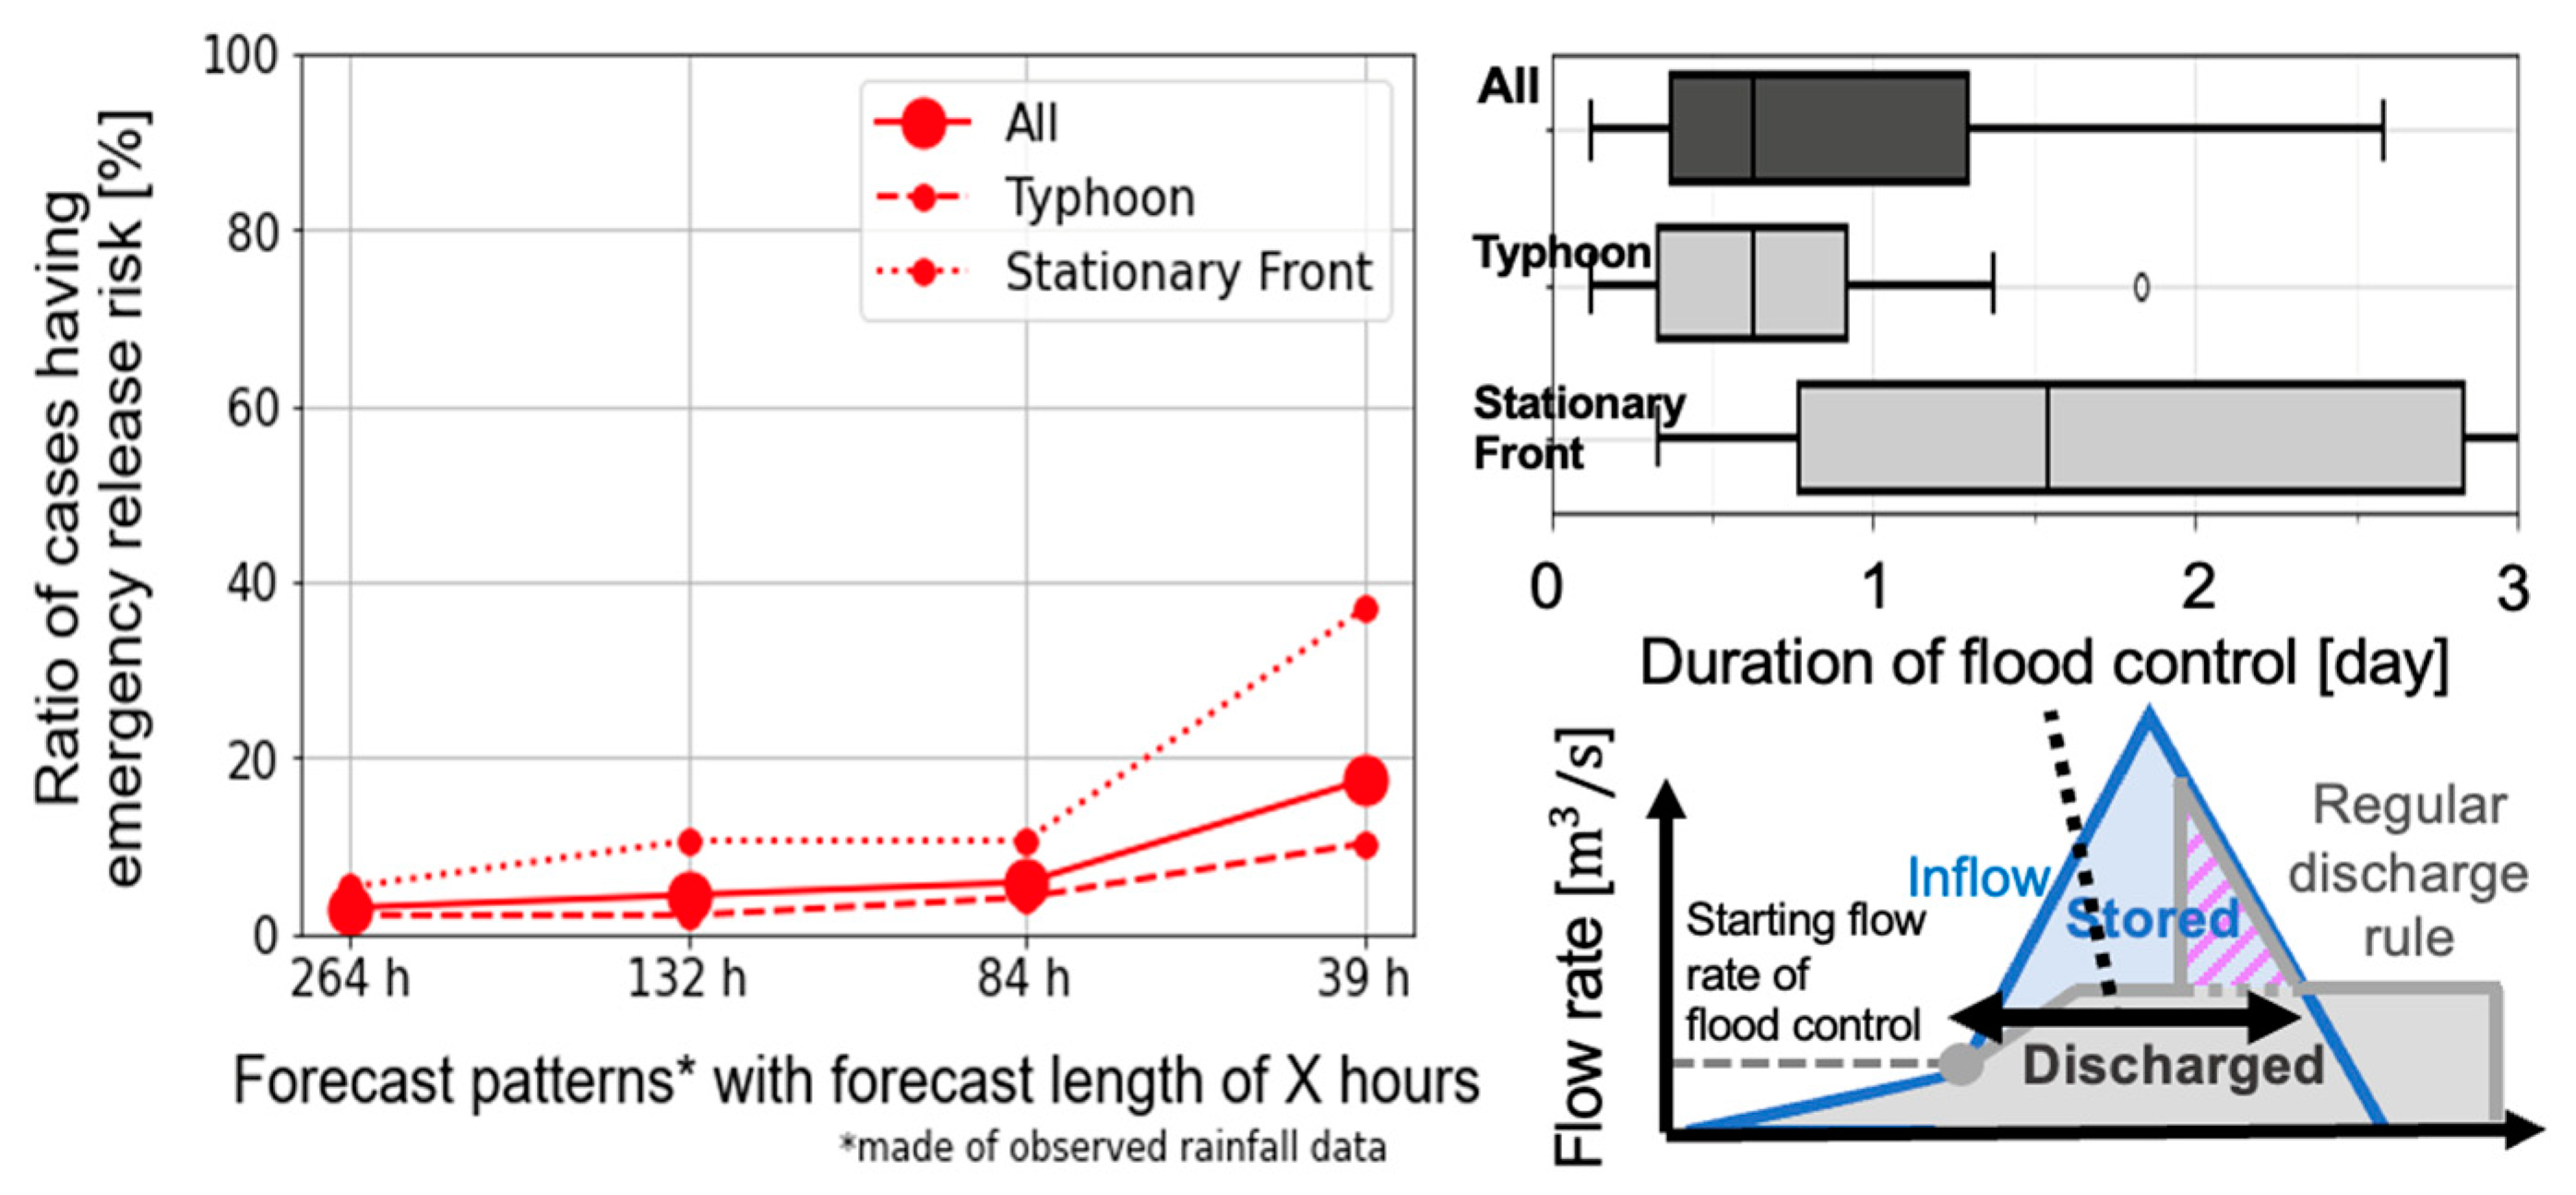
2.4.2. Required Forecast Length of Rainfall Forecast

The following four different forecast lengths of rainfall forecast were examined in terms of two risks (Section 2.3.3) in pre-release simulations (Section 2.3.2) for all pre-release cases (Section 2.3.1). Perfect rainfall forecasts of the following forecast lengths and no rainfall thereafter was assumed:
  • 39 h (~1.5 days);
  • 84 h (3.5 days);
  • 132 h (5.5 days);
  • 264 h (11 days).
These were determined by referring to the JMA’s MSM (hourly forecast with a 39 h forecast length every 3 h and with a 78 h forecast length every 12 h), the JMA’s GSM (hourly forecast with 84 h forecast length every 6 h and 3-hourly forecasts with a 132 (264) h forecast length every 6 (12) h), and a SIP project attempting a 15-day forecast length [5,13].

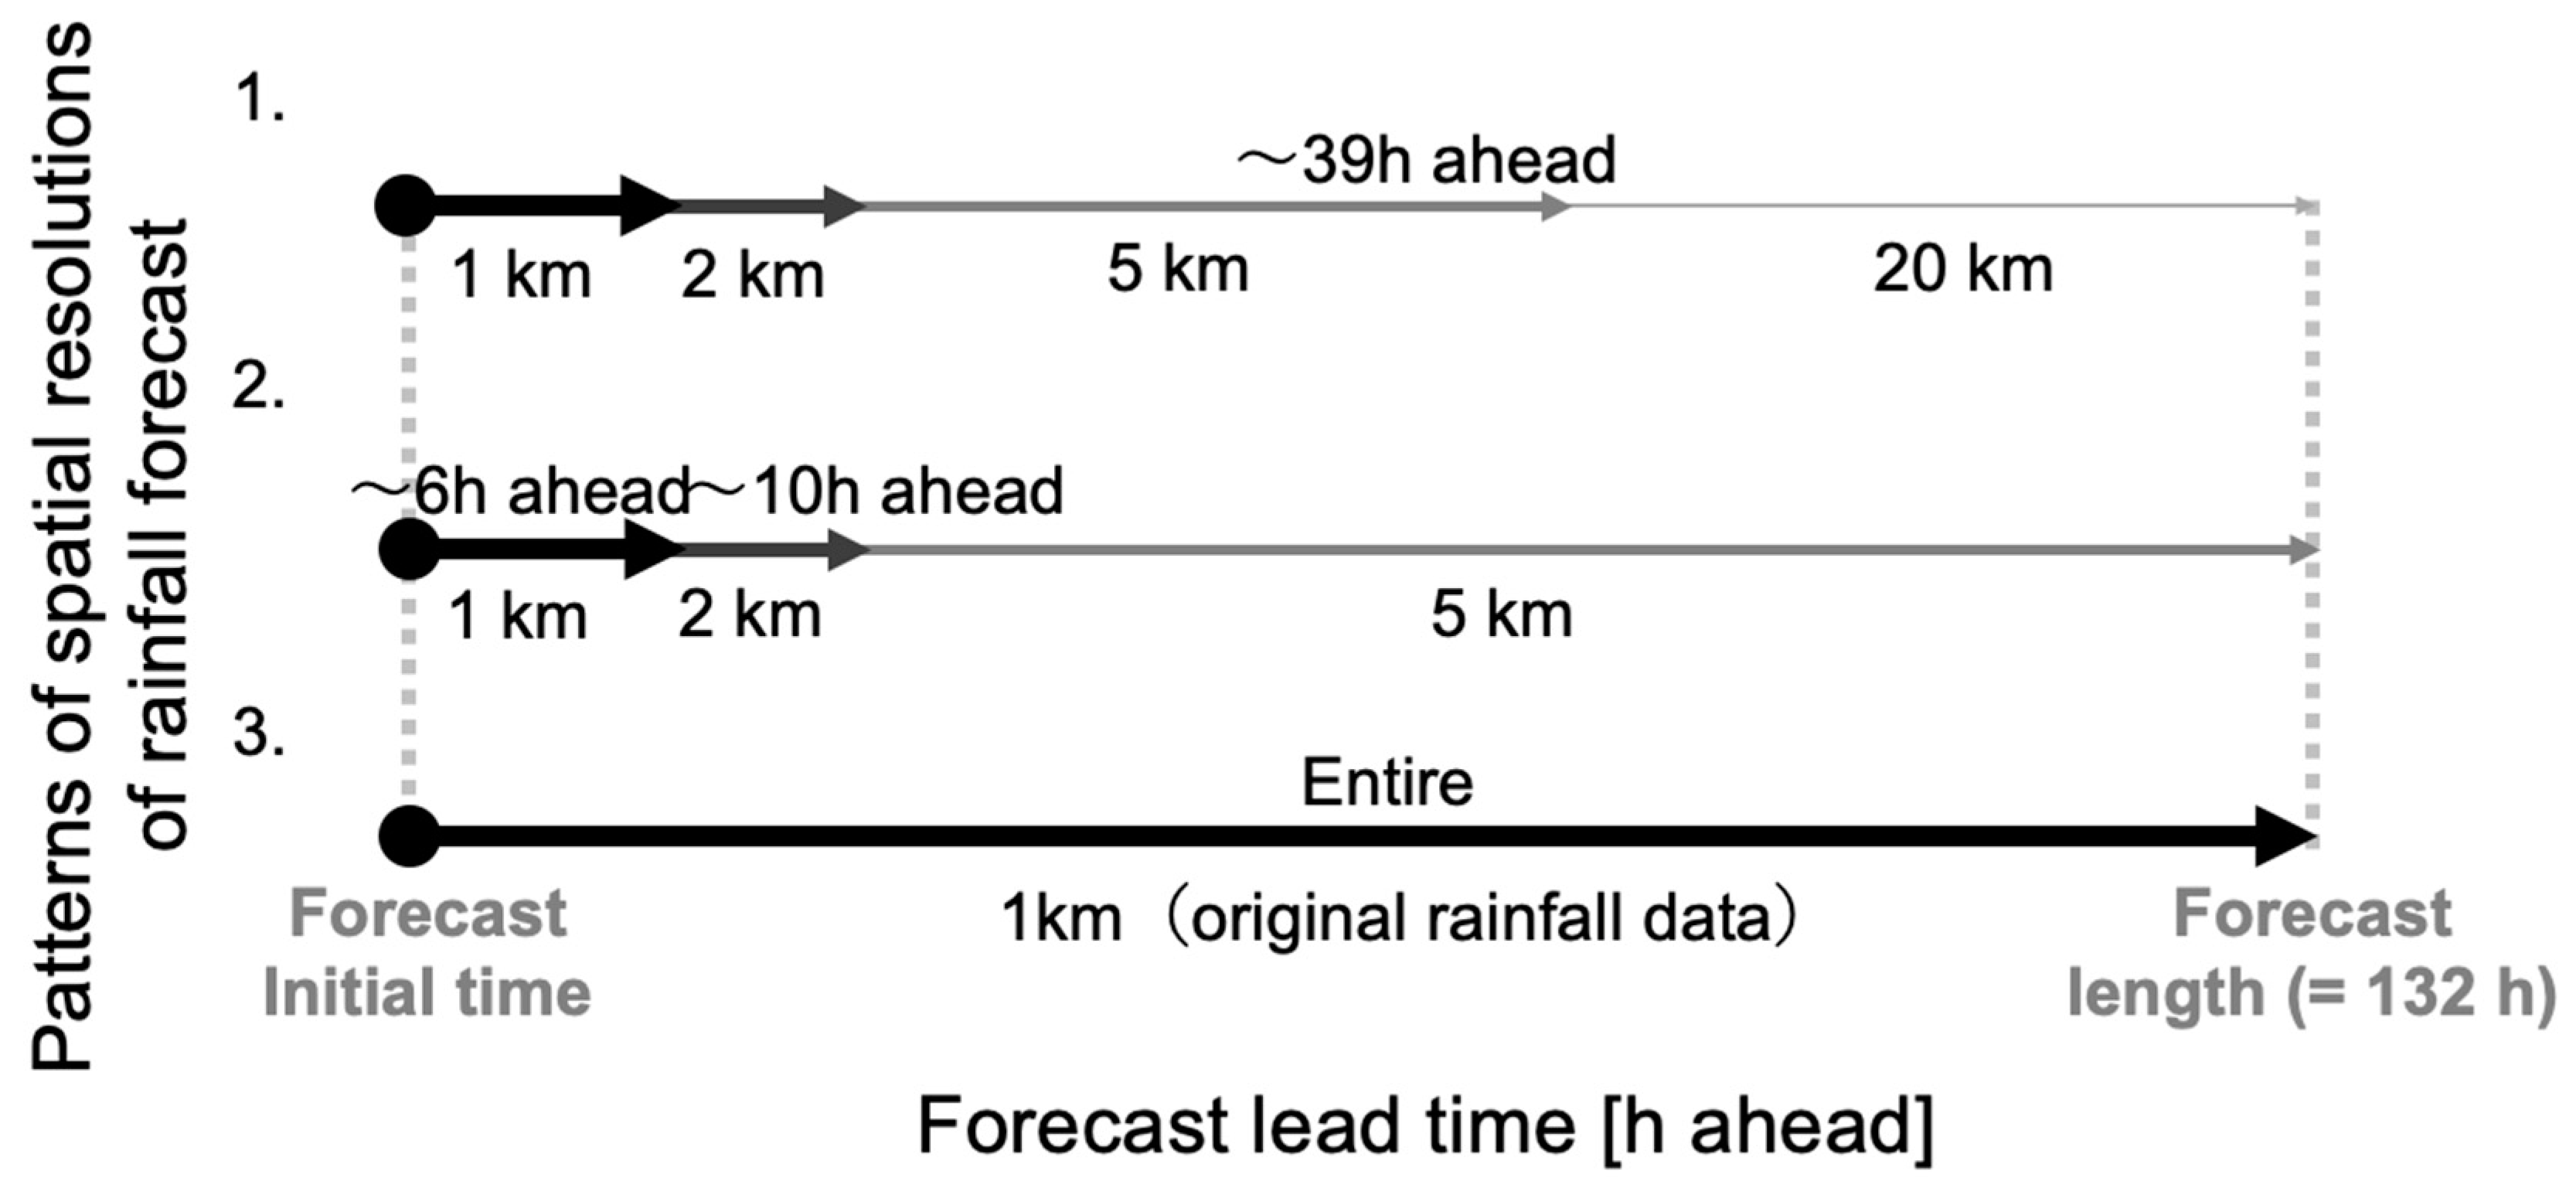
2.4.3. Required Spatial Resolution of Rainfall Forecast

The three patterns of spatial resolution of rainfall forecast shown in Figure 8 were examined in terms of two risks (Section 2.3.3) in pre-release simulations (Section 2.3.2) for all pre-release and quasi-pre-release cases. Perfect rainfall forecasts were upscaled to some degree according to the forecast-lead time. Forecast length and accuracy were set to 132 h and perfect, respectively.
These are determined by referring to current models and ongoing projects. The JMA provides rainfall forecasts of spatial resolutions of 1 km up to 6 h ahead, of 2 km up to 10 h ahead through LFM, of 5 km up to almost 39 h ahead through MSM, and 20 km up to 5.5–11 days ahead via GSM [5]. The Japan Weather Association provides 5 km grids up to 15 days ahead, and the SIP project aims to provide 1 km grids up to 15 days ahead by utilizing AI downscaling [13,28,29].

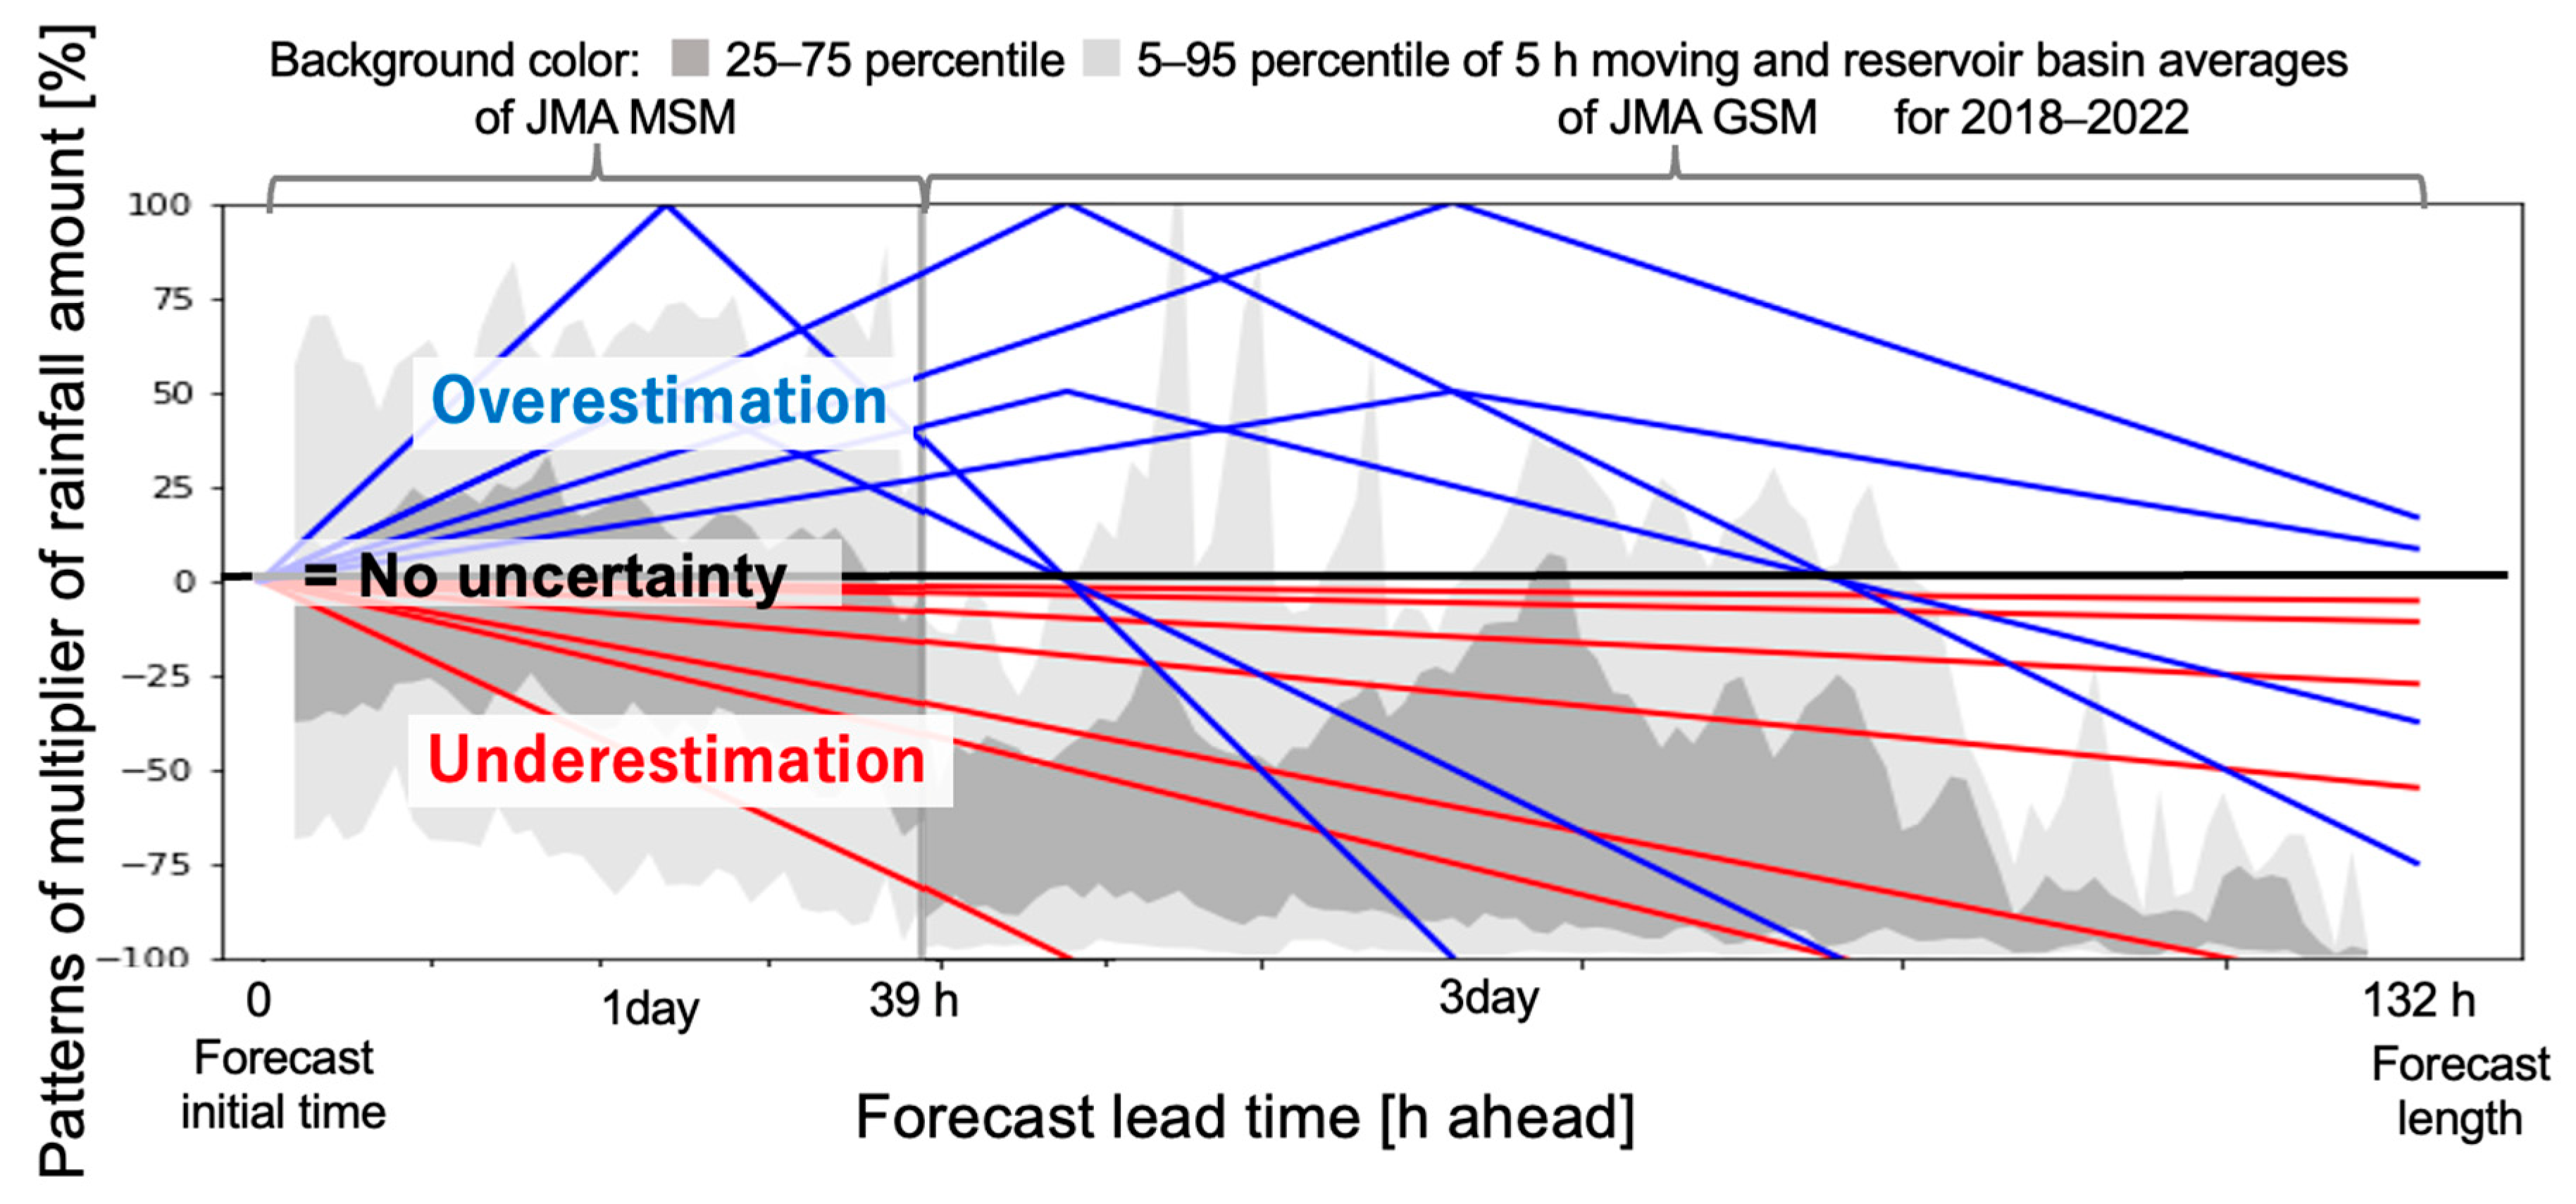
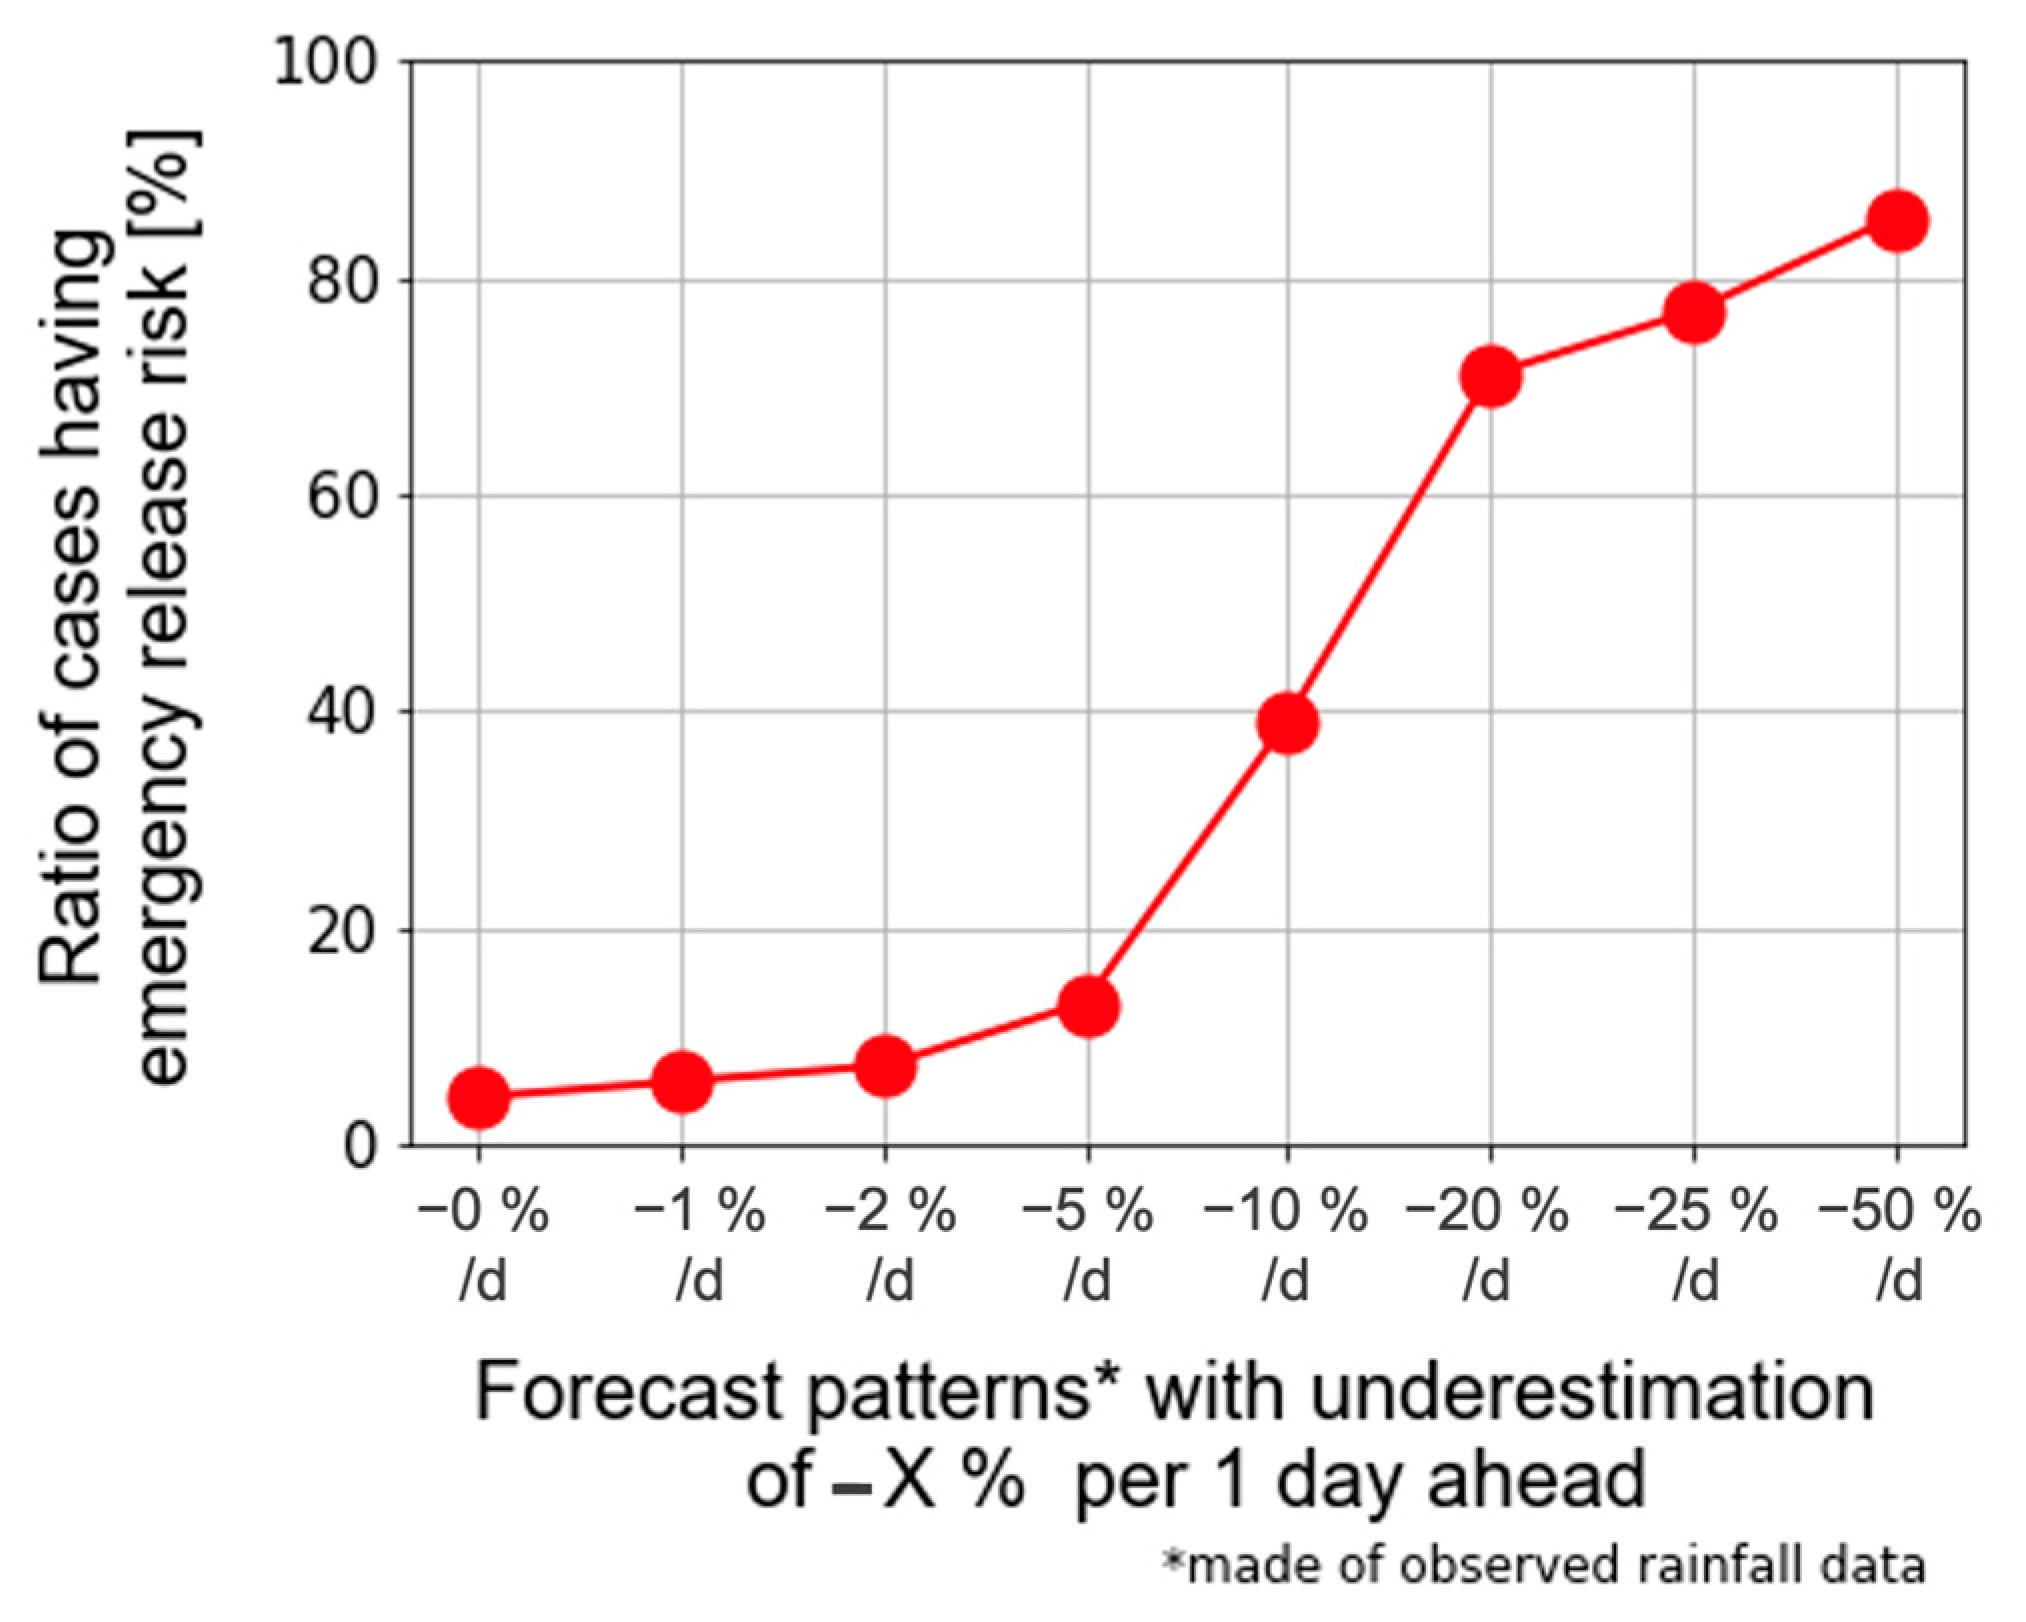
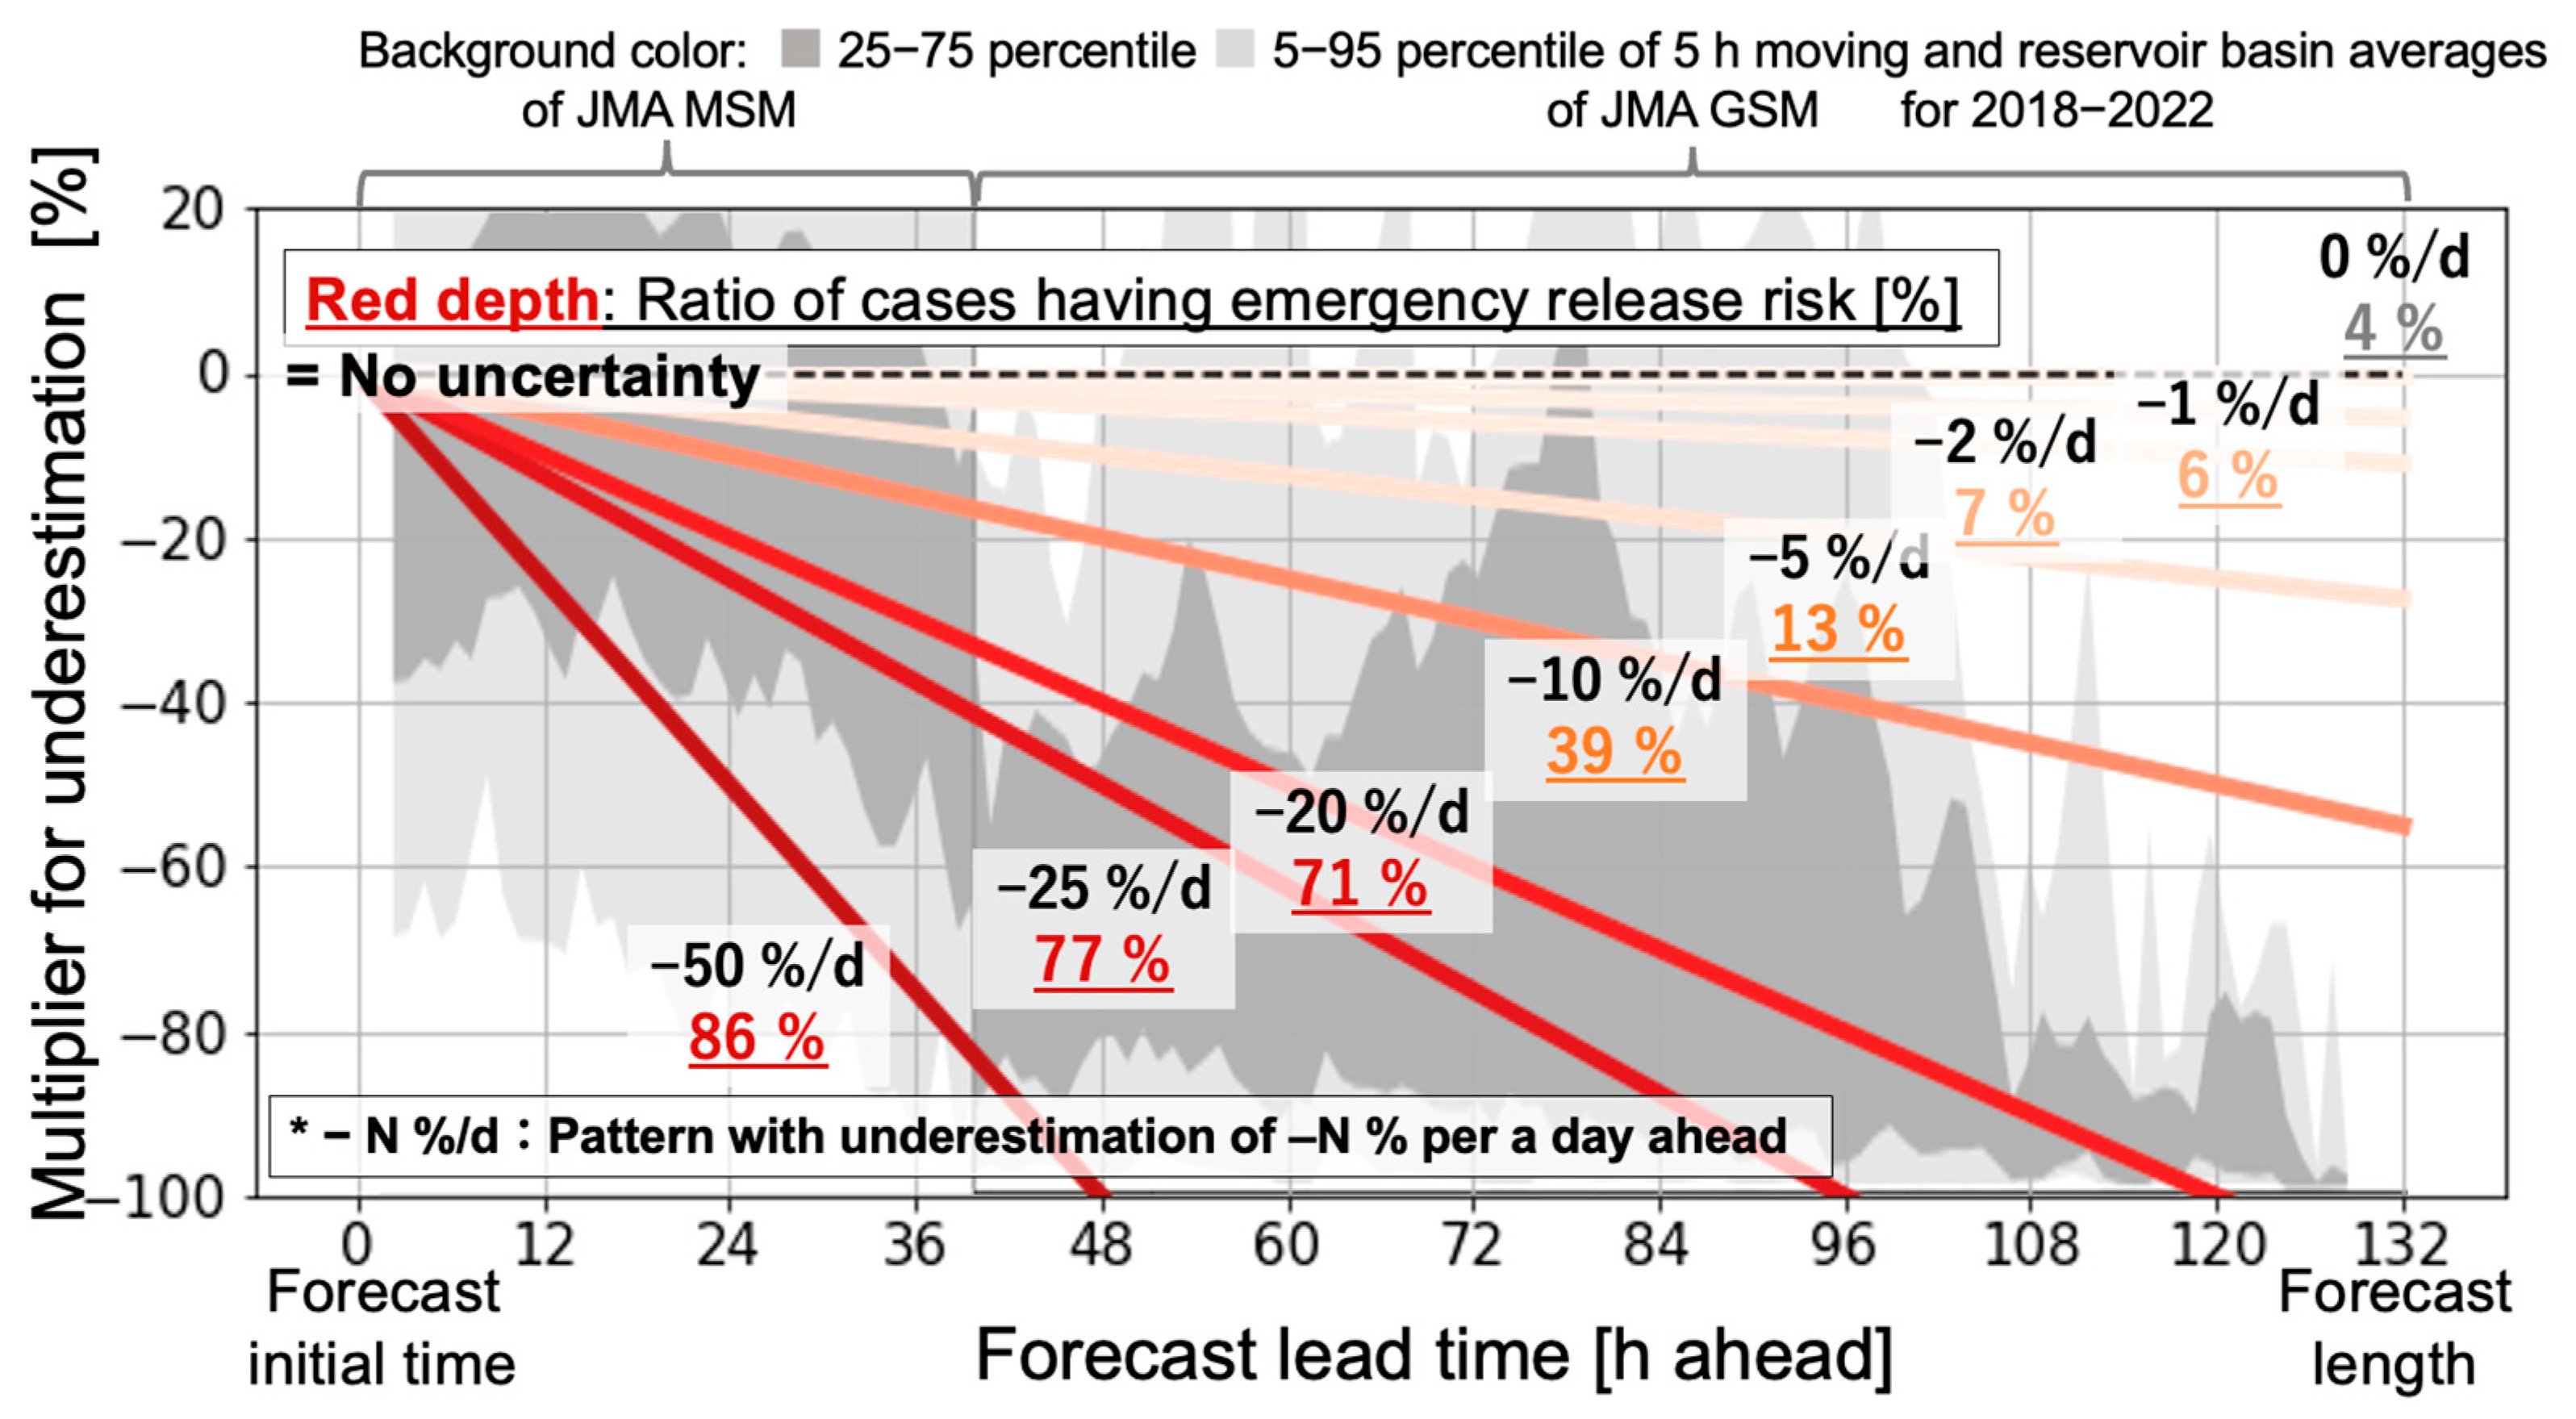
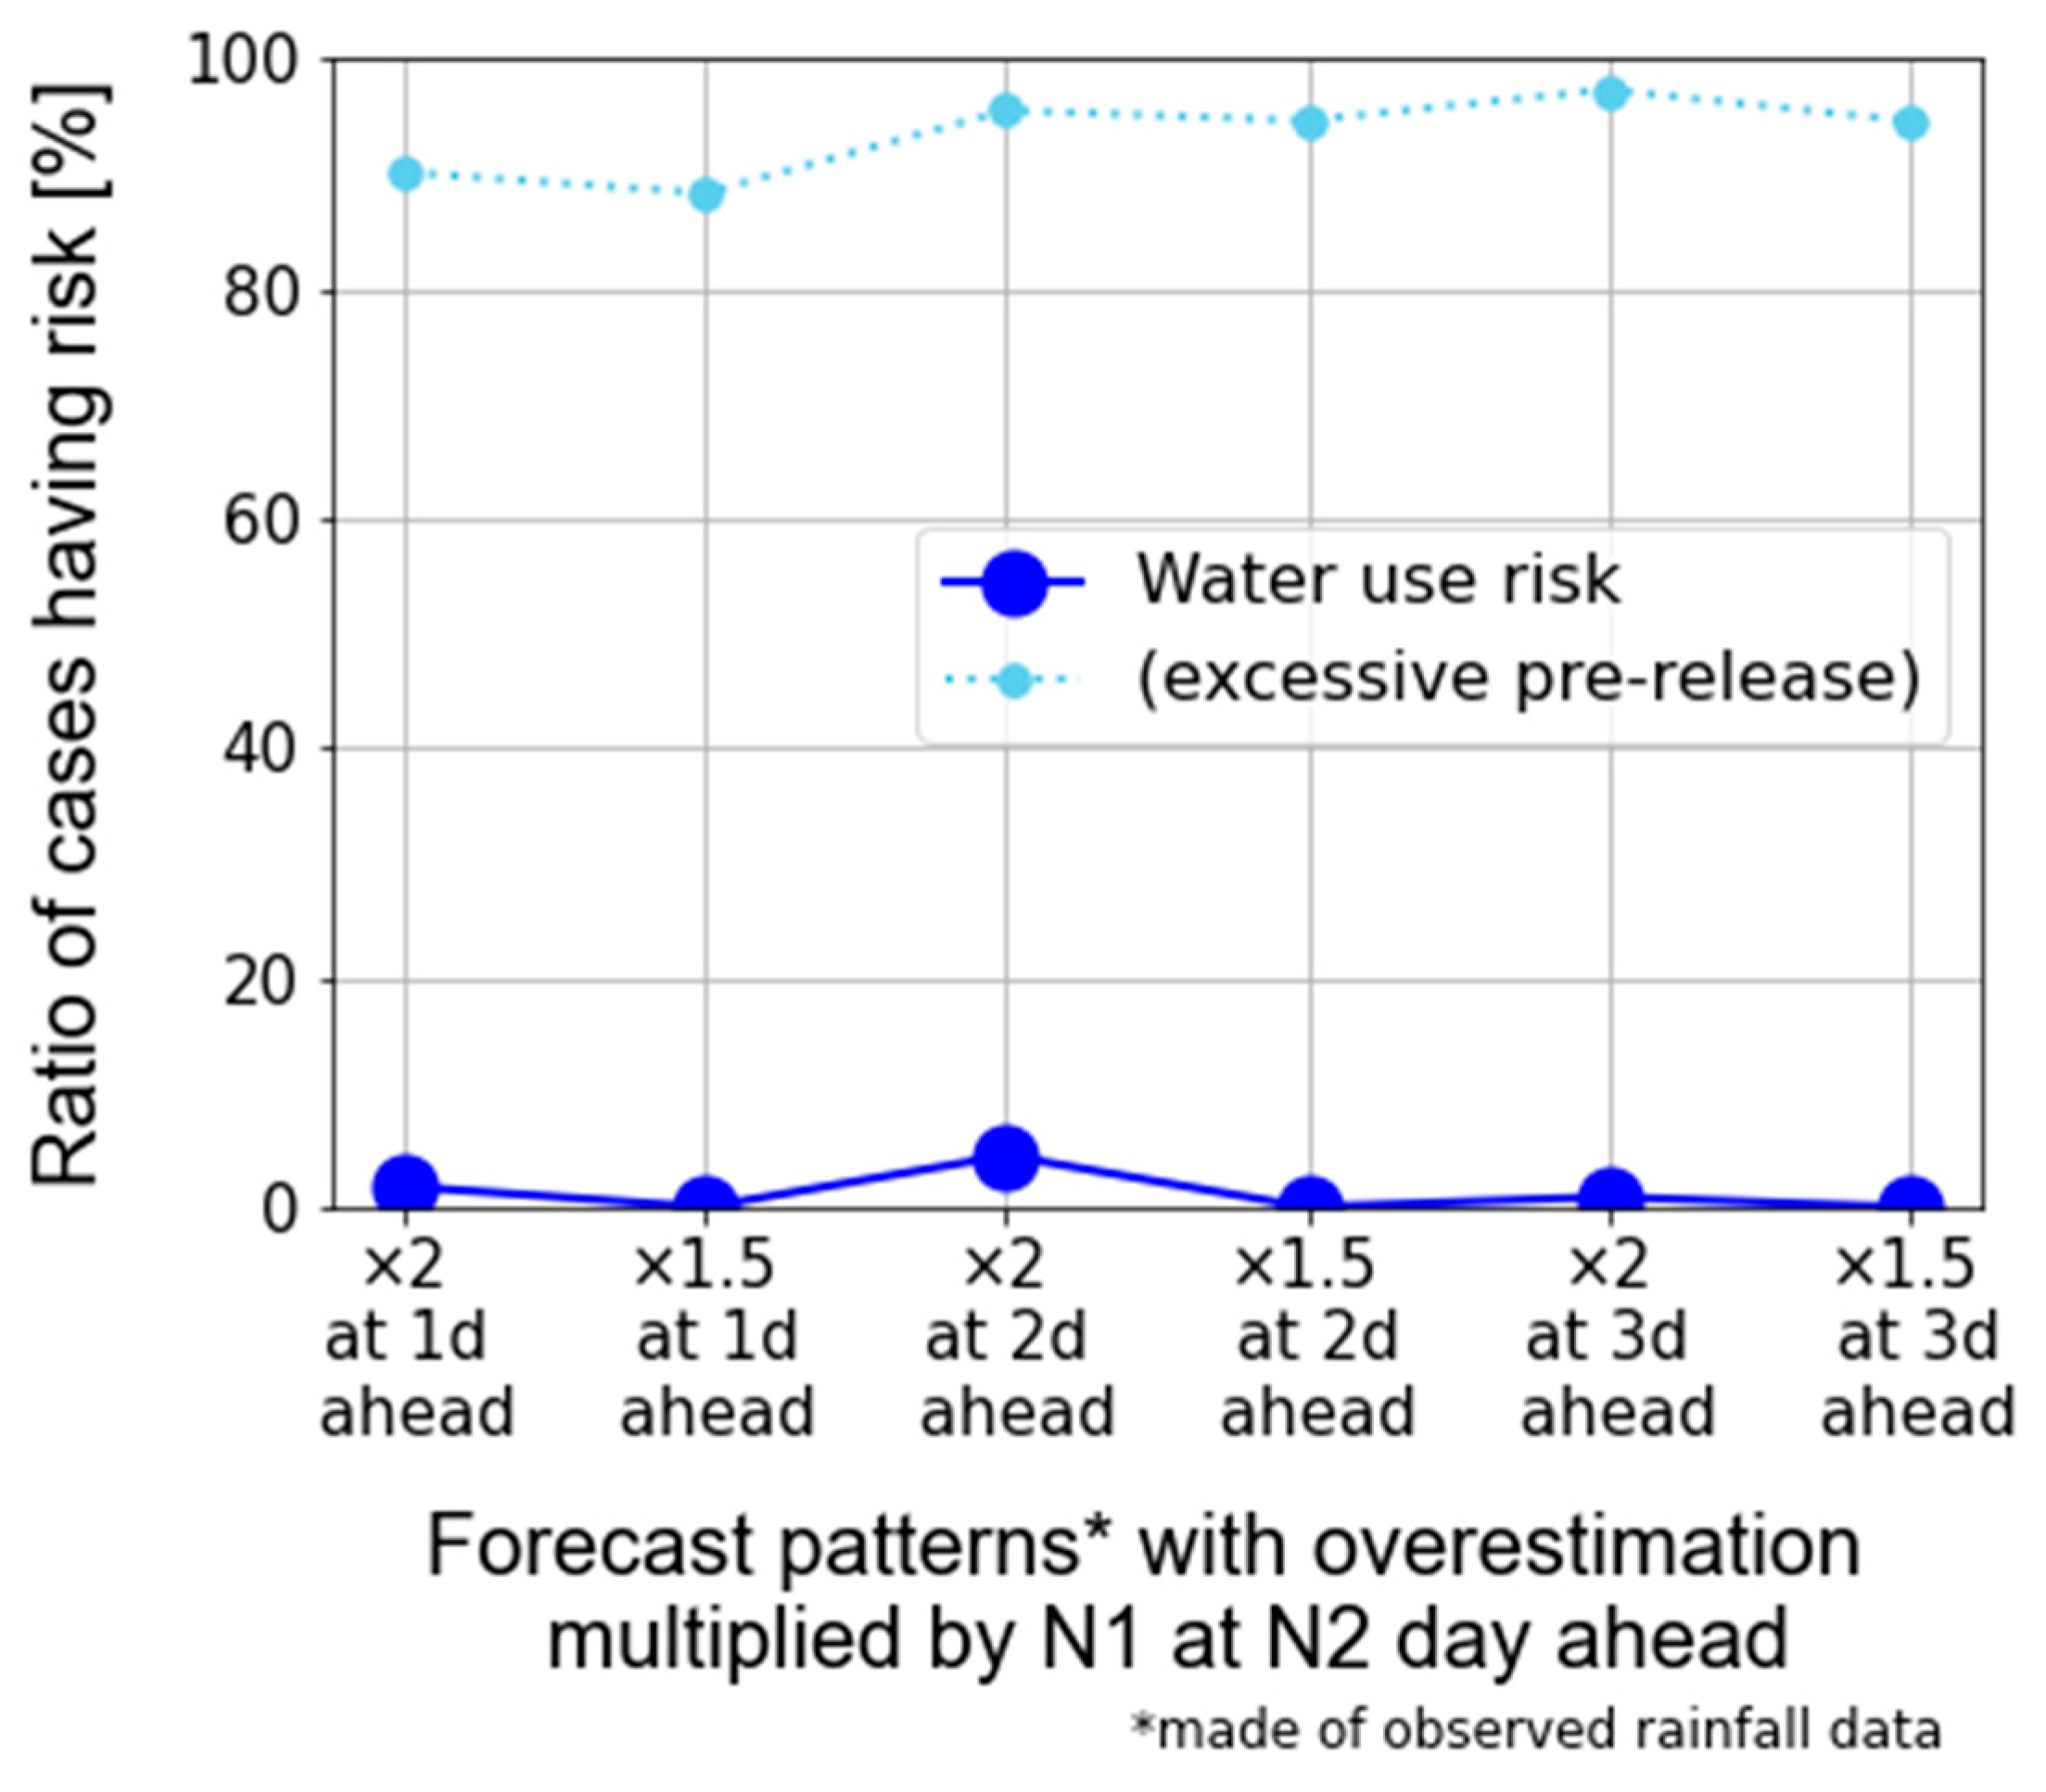
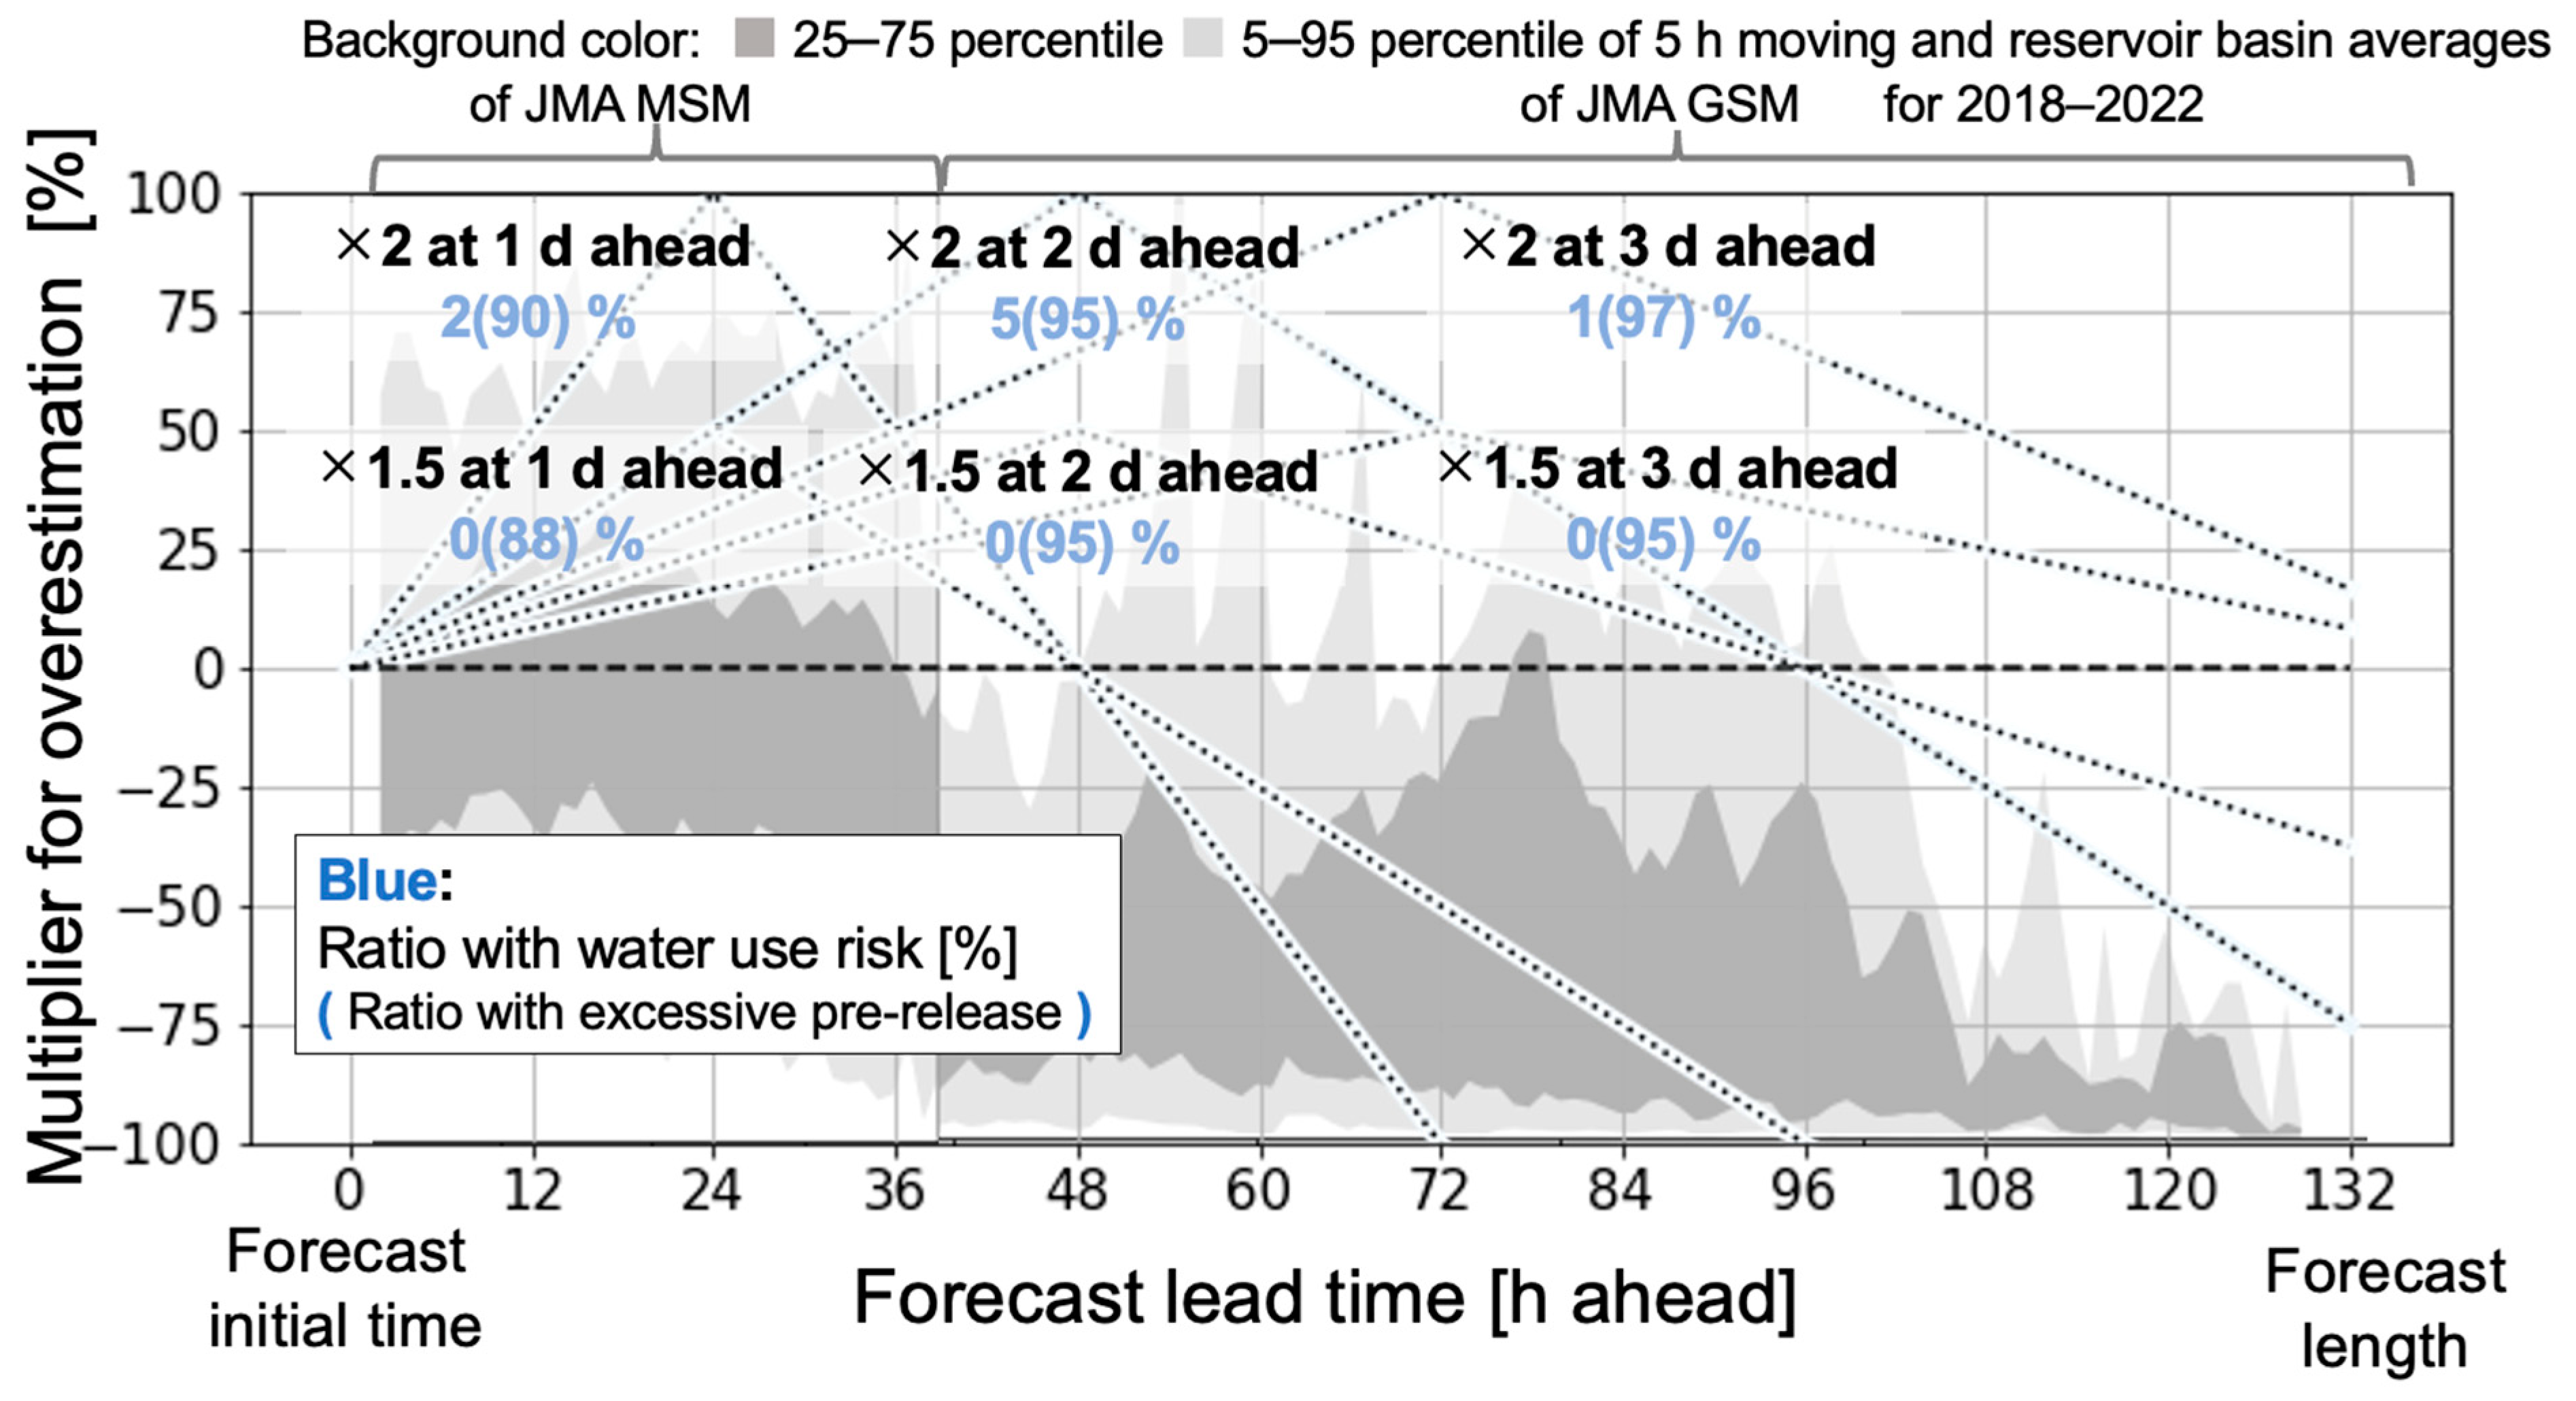
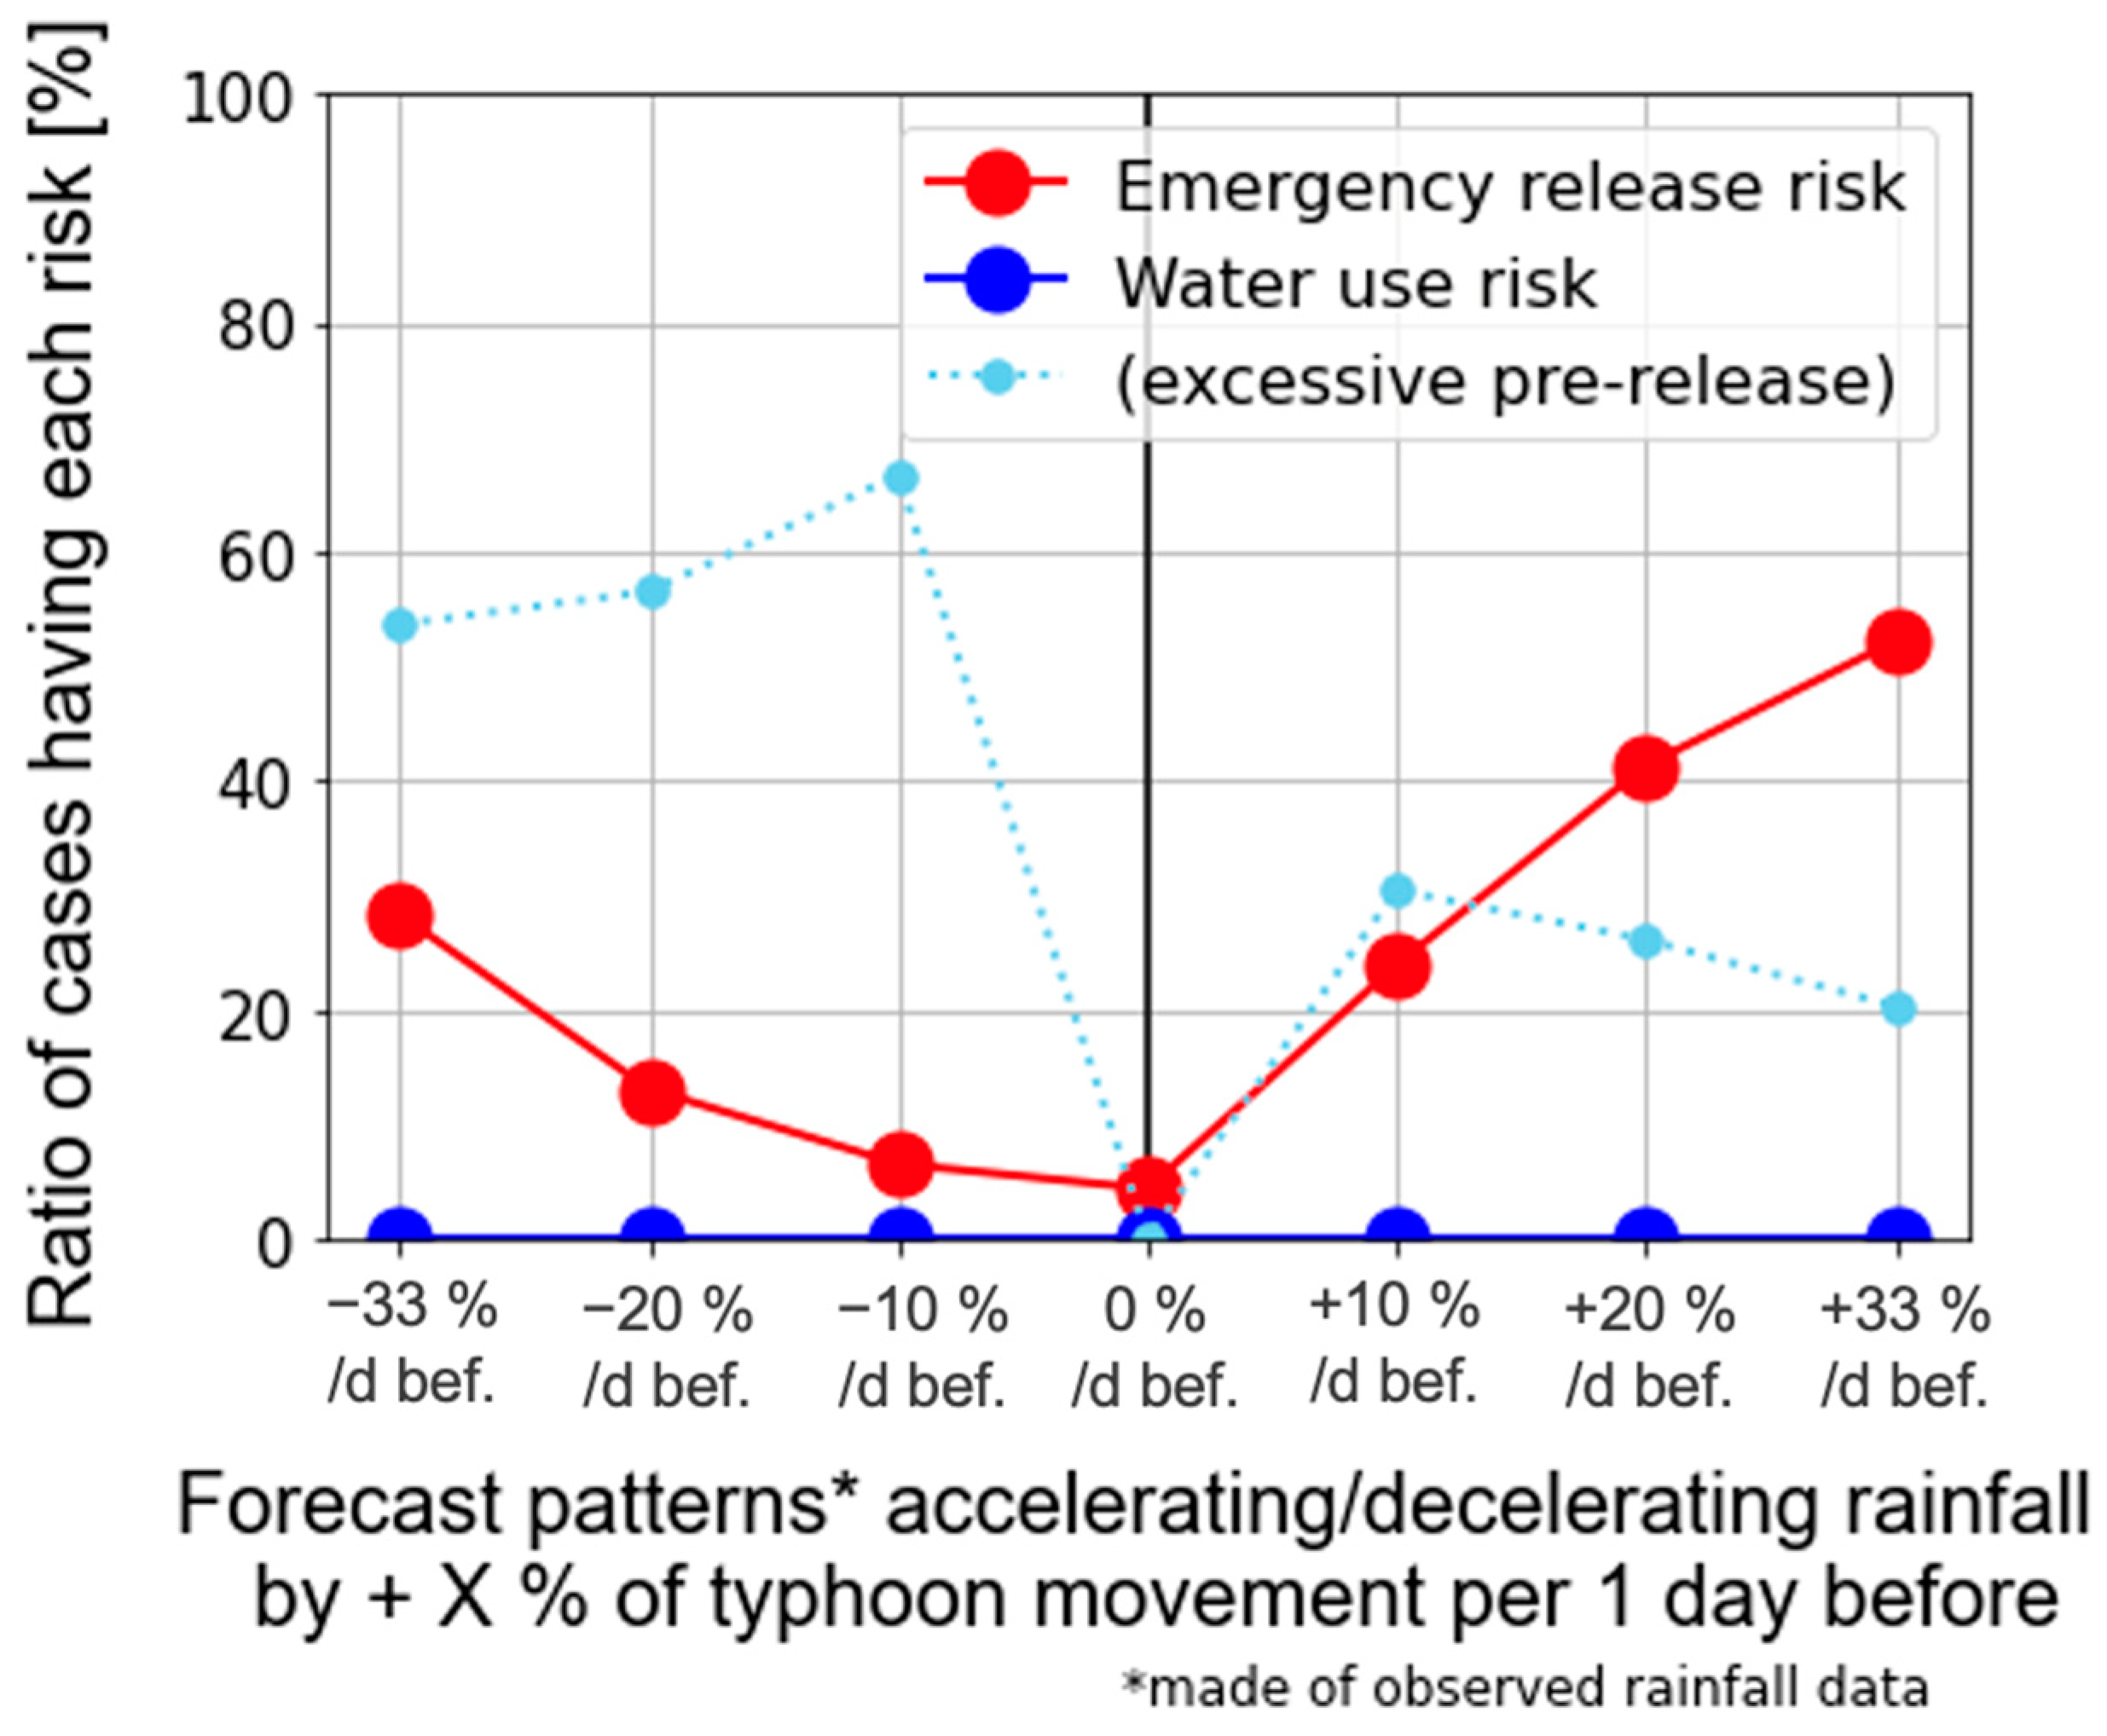
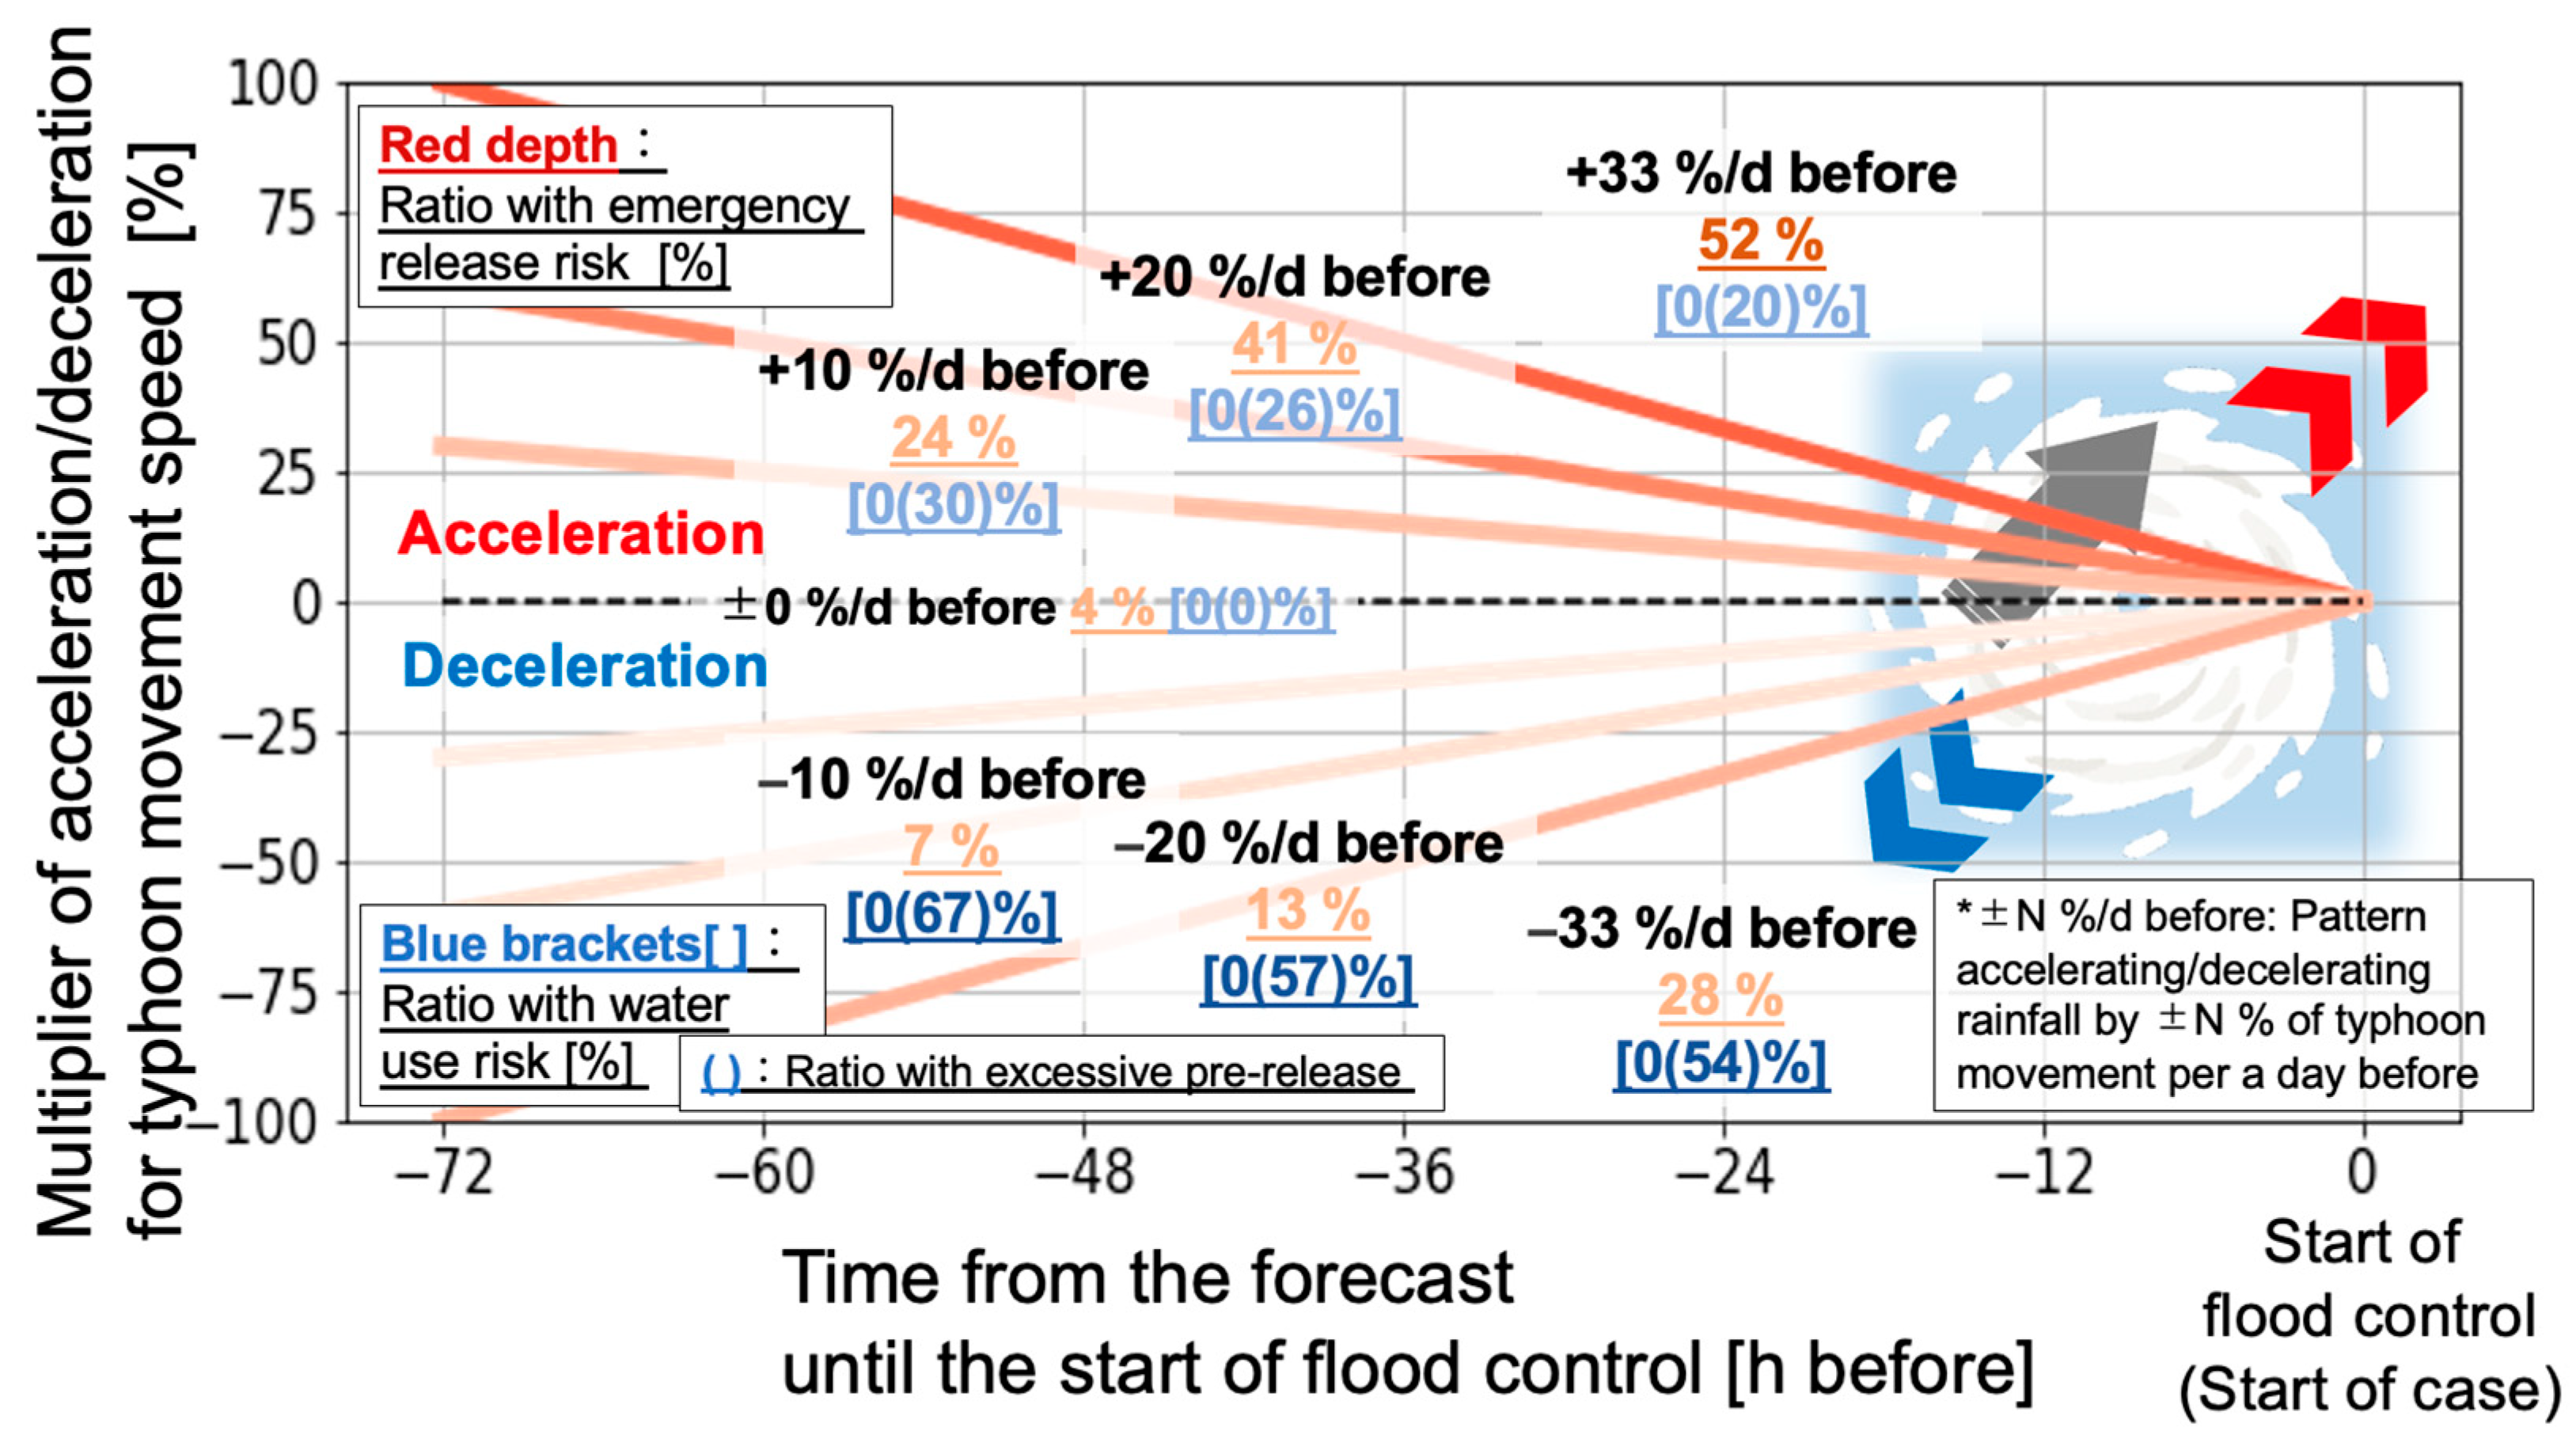
2.4.4. Amount Accuracy of Rainfall Forecast

Rainfall forecasts that introduced various amounts of uncertainty from both over- and underestimation were examined in terms of two risks (Section 2.3.3) in pre-release simulations (Section 2.3.2) for all pre-release and quasi-pre-release cases. Regarding the other elements, a 1 km spatial resolution with forecast length of 132 h and the perfect position accuracy of the rainfall zone were assumed. Uncertainty in the amounts was introduced by multiplications of the observed rainfall linearly determined according to forecast-lead time shown in Figure 9.
The patterns include underestimations that can cause an emergency release risk and overestimations that can cause a water use risk. The multiplication patterns of underestimation (red lines in Figure 9) are −50%, −25%, −20%, −10%, −5%, −2%, and −1% per day ahead. The multiplication patterns of overestimation (blue lines in Figure 9) have a peak of +100 % and +50 % at 1, 2, and 3 days ahead.
It is confirmed that these multiplication degrees occur in real forecasts through comparison with multiplications of 5 h moving and reservoir basin averages of the JMA’s rainfall forecast (MSM or GSM for 2018–2022) over 10 mm/h (background color in Figure 9). On the other hand, the linear change of multiplications according to forecast-lead time is designed for easy understanding because it is unrealistic in current forecasts.

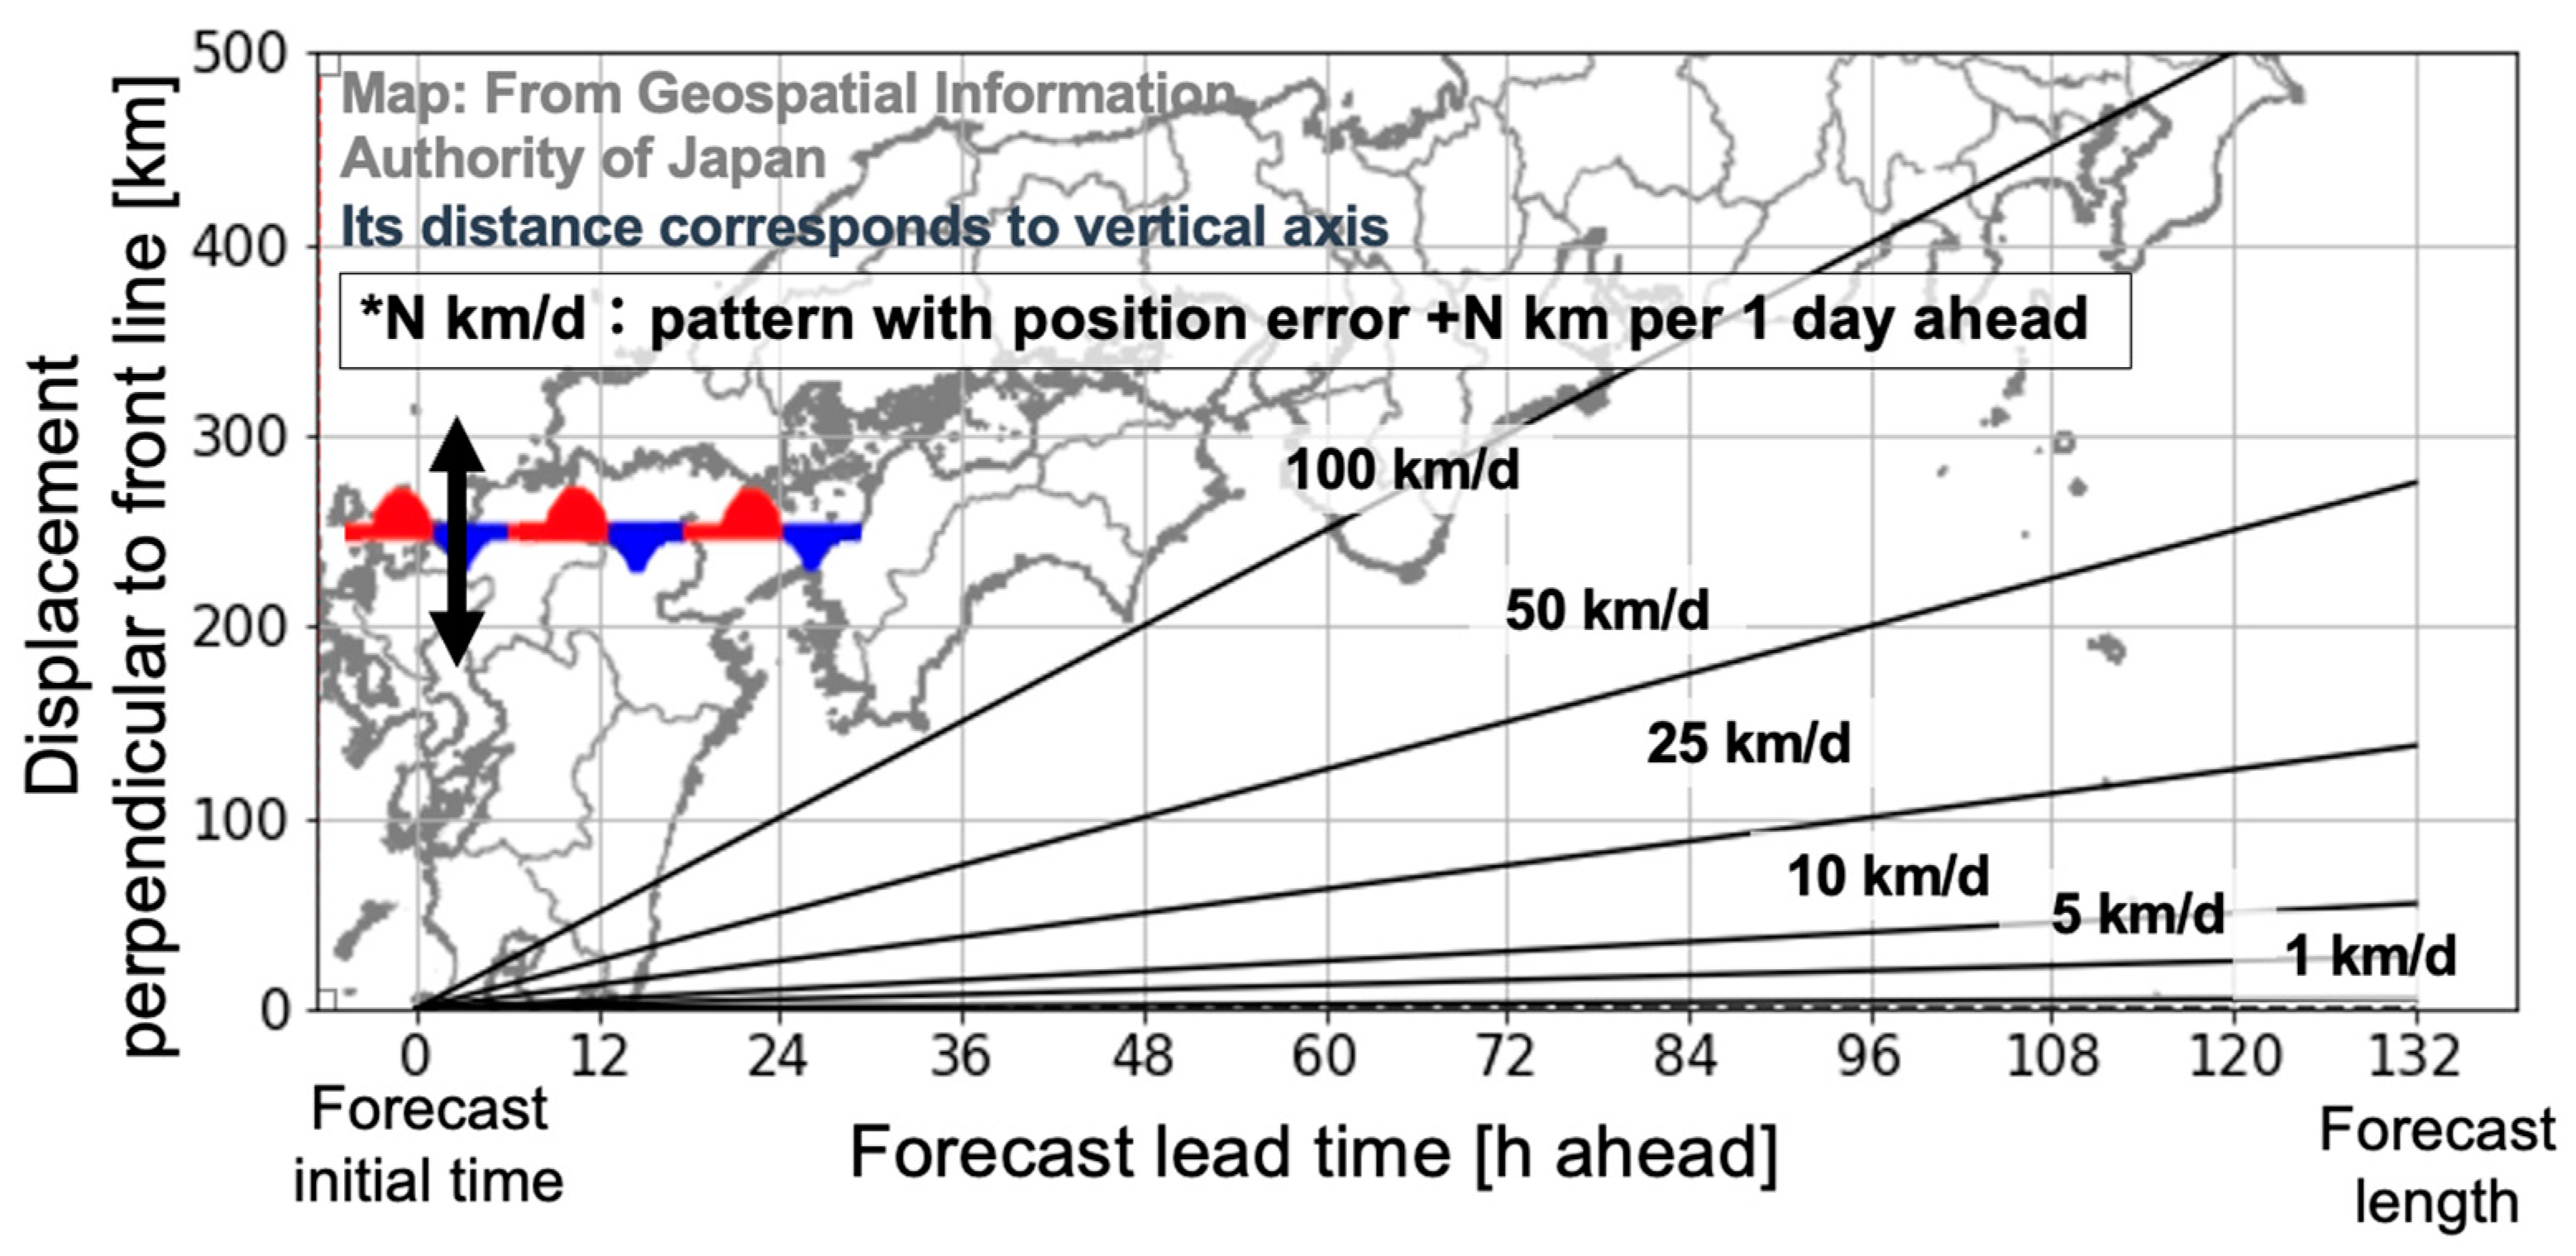
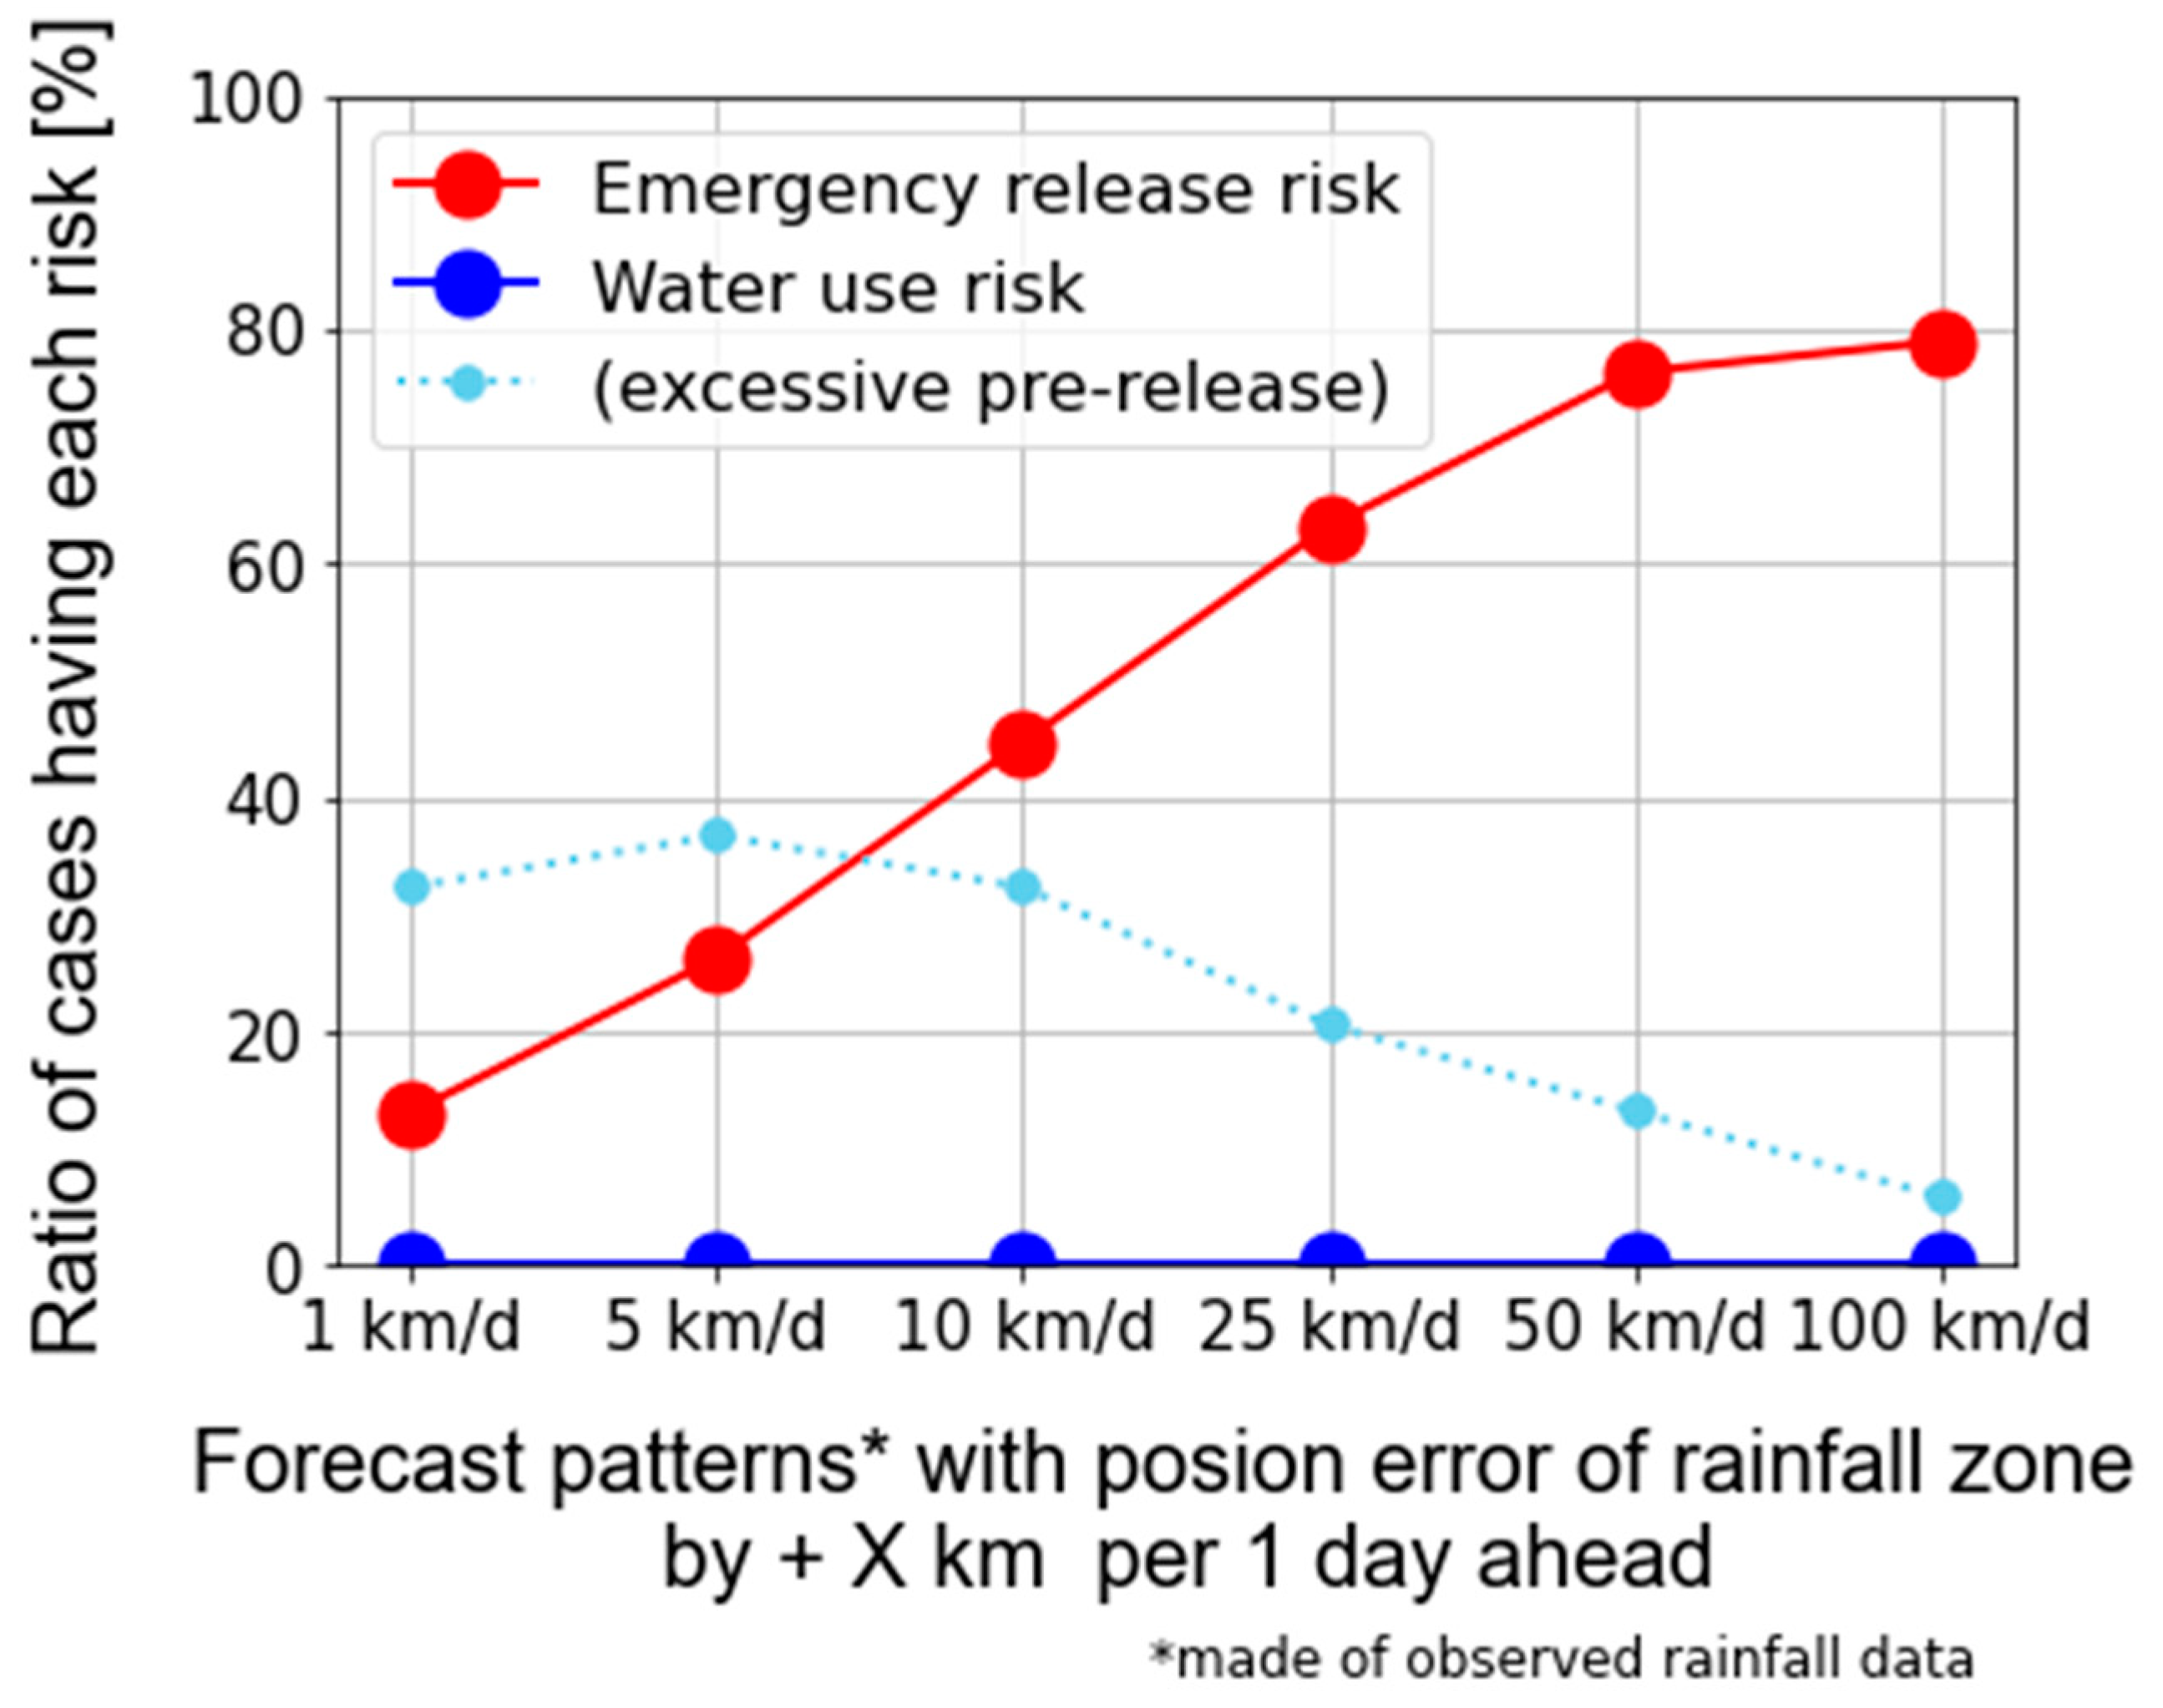
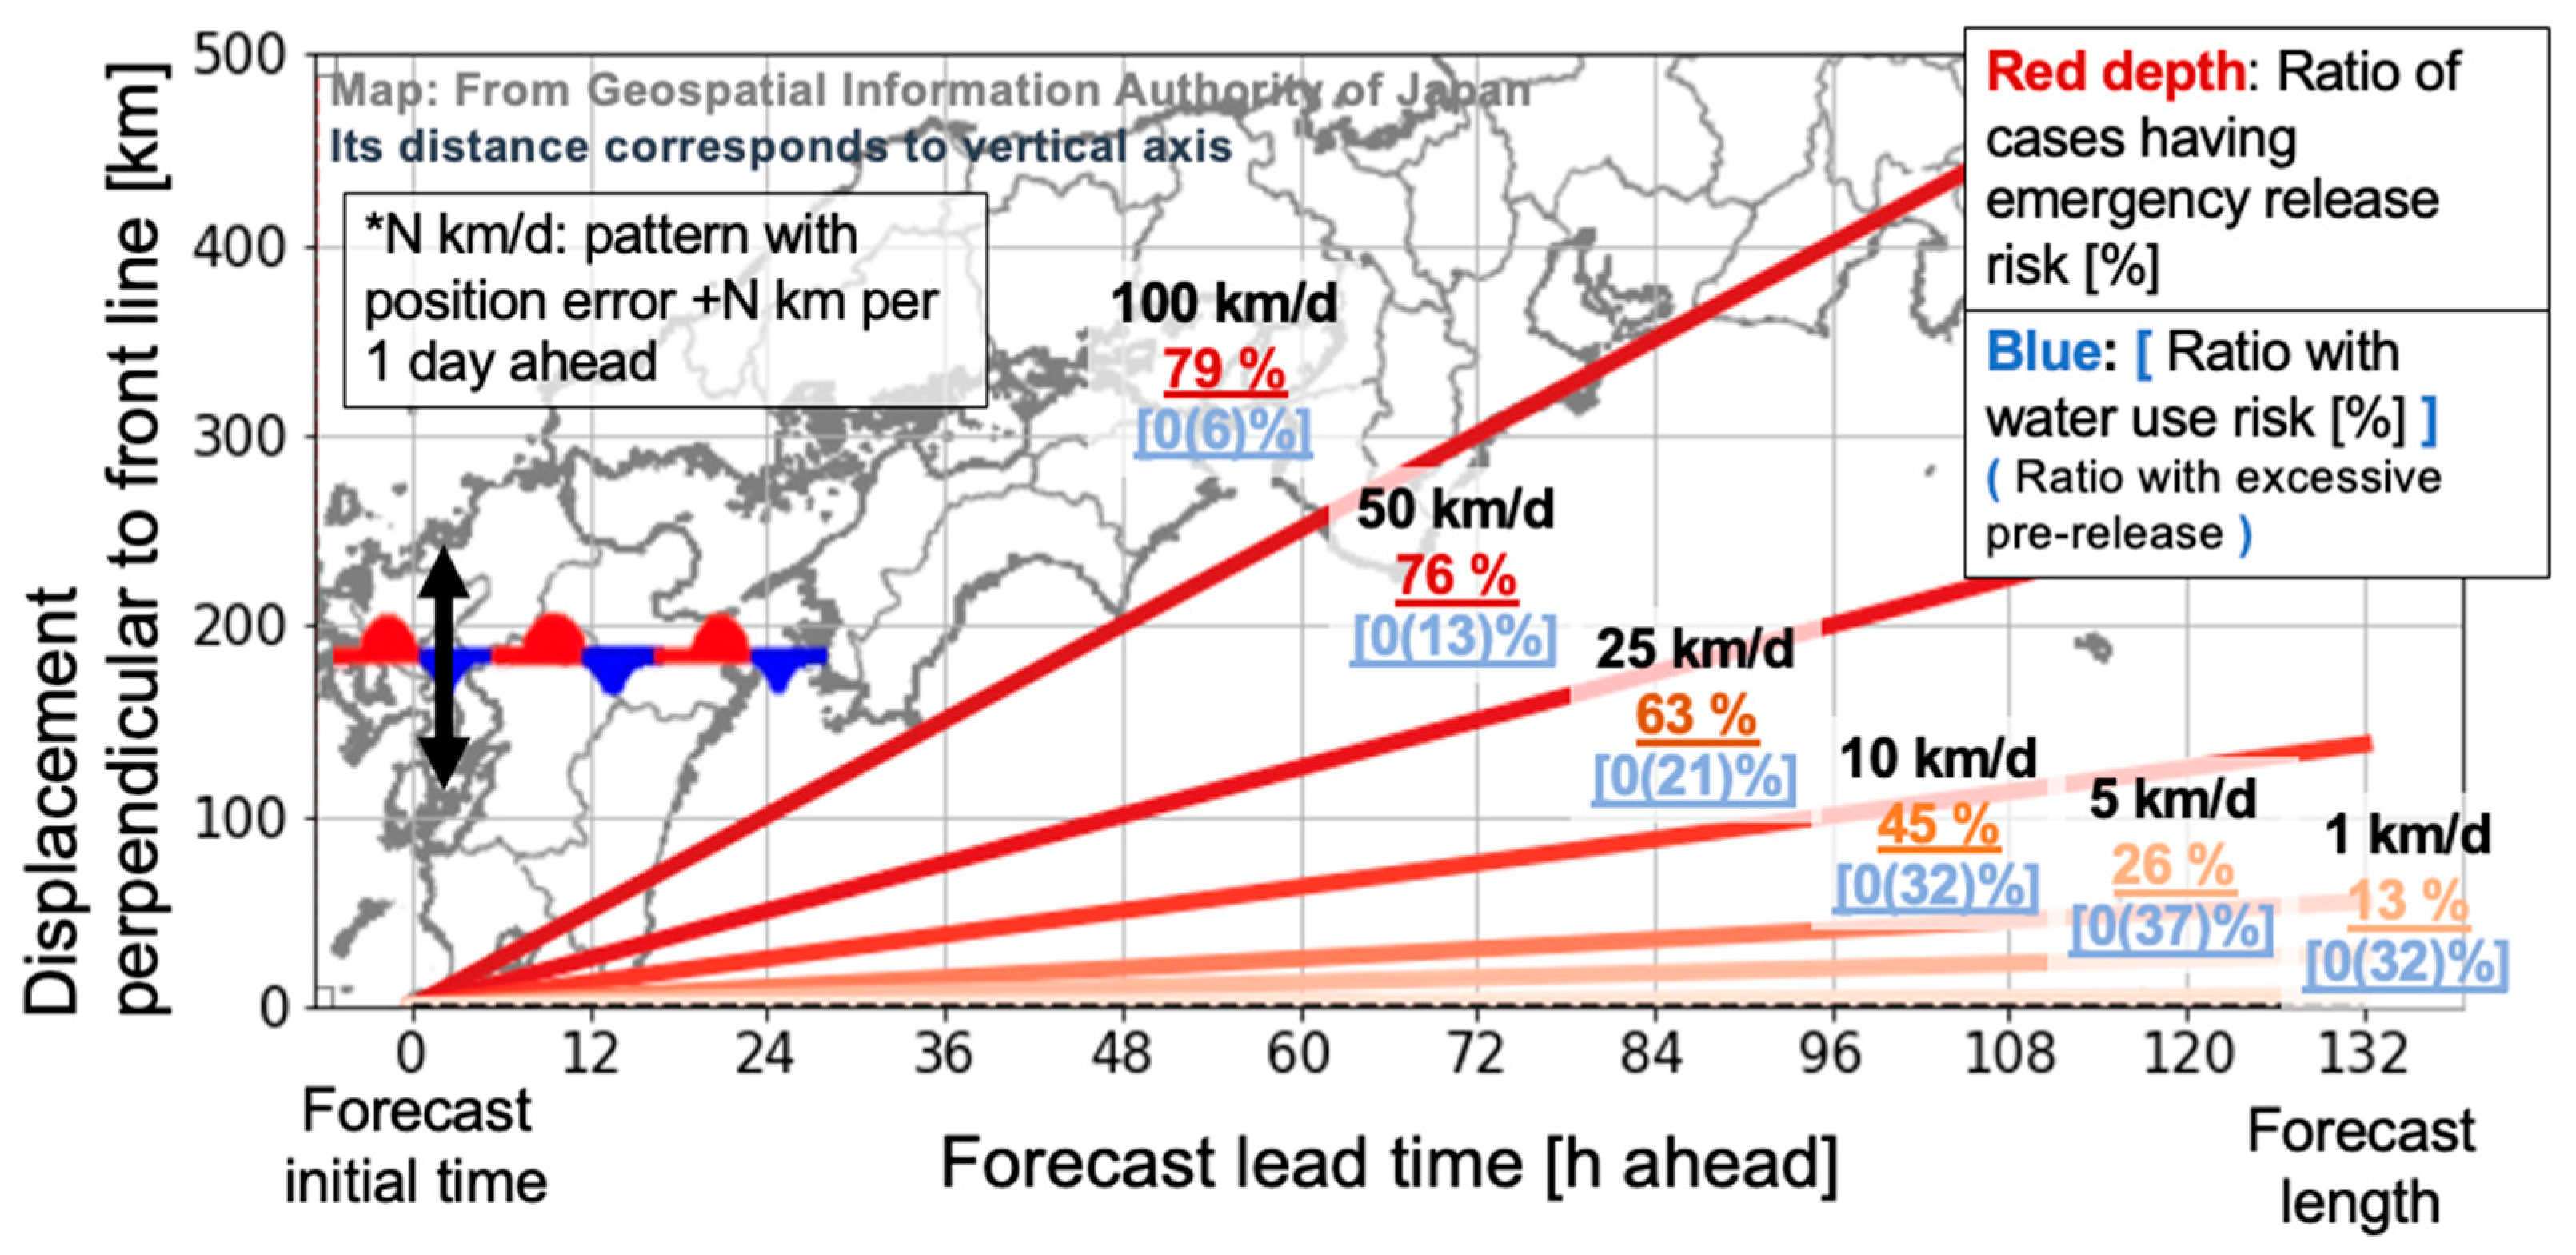
2.4.5. Position Accuracy of Rainfall Zone

Rainfall forecasts that introduced various positions of uncertainty of the rainfall zone were examined in terms of two risks (Section 2.3.3) in pre-release simulations (Section 2.3.2) for all pre-release and quasi-pre-release cases. As concerns the other elements, the 1 km spatial resolution with a forecast length of 132 h and a perfect rainfall amount accuracy were assumed. For stationary front cases and typhoon cases, excluding a few cases with flood durations exceeding 2 days, different uncertainties were applied as follows.
  • Position error for stationary front cases
Displacement perpendicular to the front line was introduced as a possible uncertainty of rainfall forecast. The directions of front lines were identified up to intermediate directions from a visual perspective. The degrees of perpendicular displacement in both directions are 100 km, 50 km, 25 km, 10 km, 5 km, and 1 km per day ahead, as shown in Figure 10.
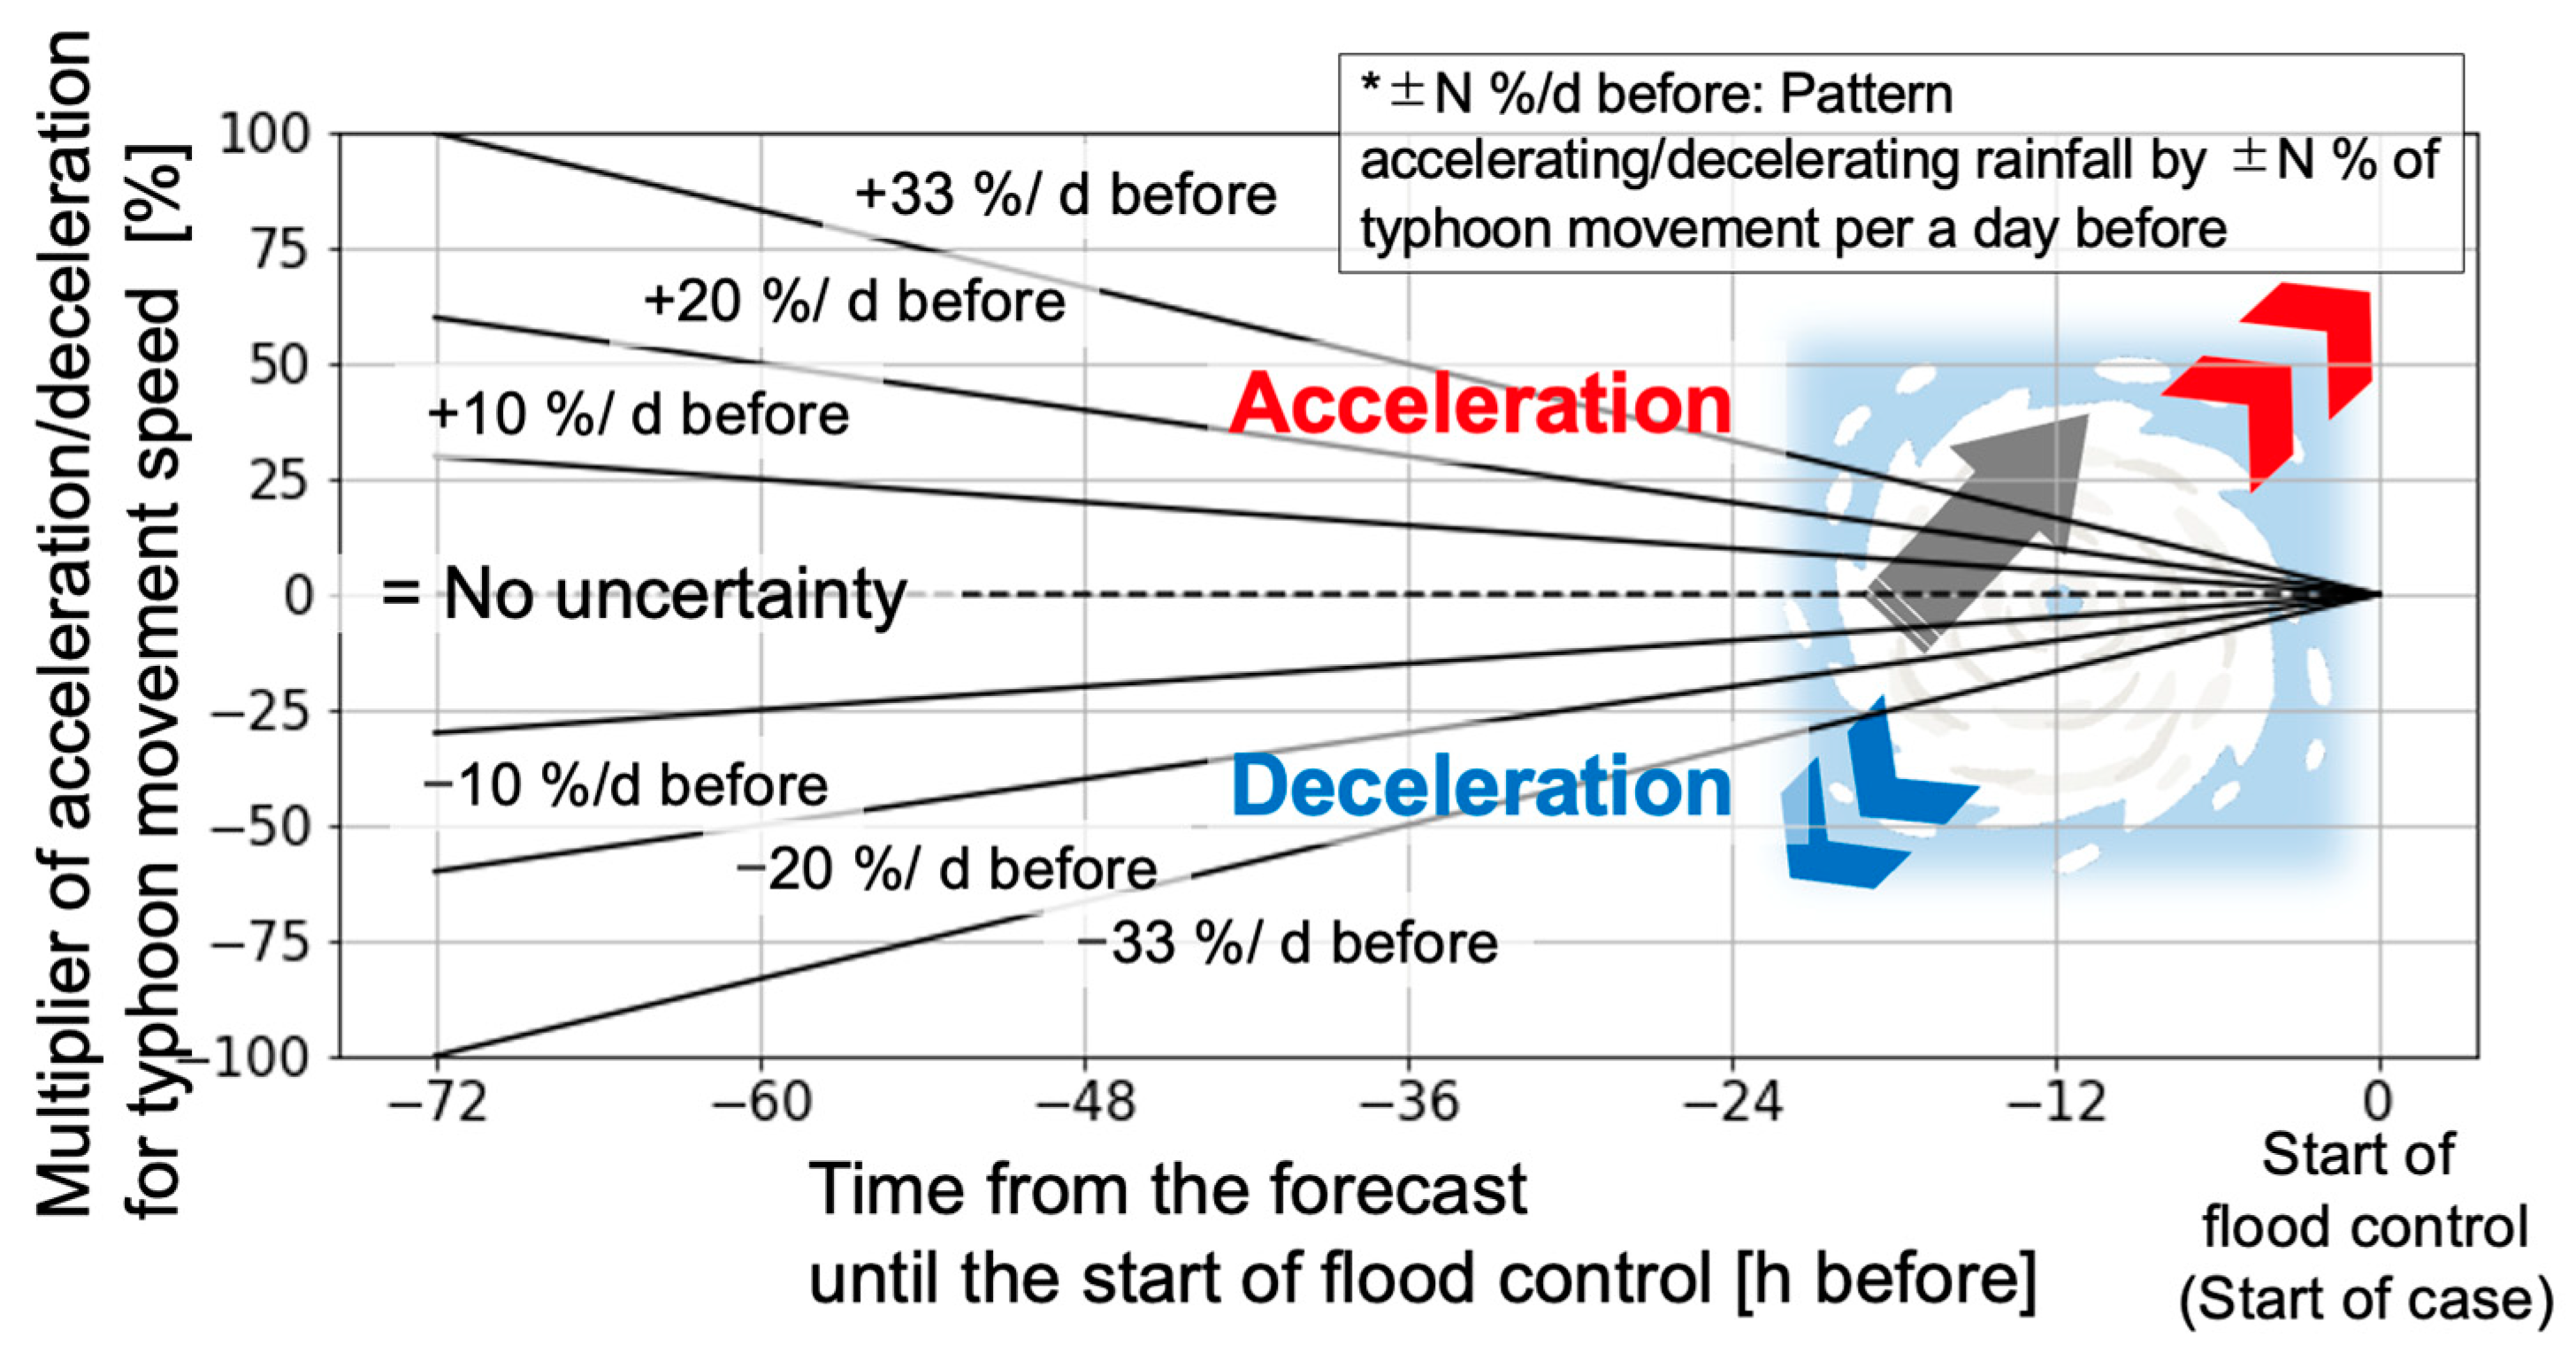
  • Position error for typhoon cases (excluding exceptions)
The acceleration and deceleration of typhoon movement speed were represented by the shifting observed rainfall in the direction of the typhoon path. The degree of shifting was the typhoon movement speed × ±N% × (T − starting time of case) [km] from 6 h before the event to the end of flood control or 18 h after starting time. N was determined according to the time from the forecast until the start of flood control, not the forecast-lead time, as shown in Figure 11. In detail, as the time becomes longer by one day, N increases or decreases by 10, 20, and 33.3%.

3. Results and Discussions

This section explains the results and discussions for the five elements of the rainfall forecast for pre-release: the characteristics of a situation requiring pre-release (Section 3.1), forecast length (Section 3.2), spatial resolution (Section 3.3), rainfall amount accuracy (Section 3.4), and the position accuracy of rainfall zone (Section 3.5).

3.1. Characteristics of Situation Requiring Pre-Release

3.1.1. Frequency and Regionality of Pre-Release Cases

The number of pre-release cases (Section 2.3.1) per year, shown in black in Figure 12, comprised dozen or so at most and averaged about four. Even including quasi-pre-release cases, shown in gray in Figure 12, the number is about seven instances per year, which does not even reach twice the number of pre-release cases. These numbers tend to depend on major flood events, such as typhoon Hagibis in 2019.
The number of pre-release cases for each reservoir are represented by color on the map in Figure 13. Reservoirs experiencing pre-release cases are found throughout the country, regardless of region or capacity size, and some reservoirs have experienced multiple pre-release cases. On the other hand, about 87% of all target reservoirs have not experienced a pre-release case in the last 17 years.
Based on the above, it can be said that the exceedance of reservoir capacity, which pre-release aims to avoid, can occur throughout Japan with a frequency of ~0.2 per reservoir (69 times divided by 326 reservoirs) from a 17-year perspective. The same can be said for the actual record of emergency releases in the last ~60 years and the return period regarding that reservoir is filled, as described by Tanaka et al. [6,9,10]. In terms of the actual record of emergency release, its results are similar to those in Figure 12 and its frequency is almost a same ratio of 0.111 per reservoir for the last 20 years (2000–2019) [6,9]. Tanaka et al., who used d4PDF (past and future rainfall scenarios) for 100 reservoirs nationwide, showed that about 75% of reservoirs in past scenarios and about 60% in four-degree rise scenarios exceeded a 17-year return period, while short return periods existed throughout Japan [10].
On the other hand, there is a significant difference between our result and either actual record of pre-release or the situations of heavy rainfall events as defined meteorologically by Tsuguti and Kato [6,7,11]. The actual record of pre-release included many pre-releases just to make sure. Tsuguti and Kato showed that the number of heavy rainfall events was 386 over a period of 15 years (1995–2009) and its regionality was concentrated on the Pacific side of Japan [11]. This difference is thought to reflect the ability of existing reservoirs, which narrowed down particularly extreme floods exceeding the plans of each reservoir for pre-release cases.
From the perspective of future development, it is important to uniformly capture particularly the extreme floods in the rainfall forecasts for reservoirs nationwide. As for our point about capturing particularly extreme floods, simply focusing on the total number of pre-releases, including the many implementations to merely be on the safe side, can blur critical aspects for the future development of rainfall forecasting. In regard to uniformity nationwide, if requirements were concentrated in a particular reservoir or region, it would be more effective to review structural design or improve the experience of reservoir managers just for these instances.

3.1.2. Meteorological Cause of Pre-Release Cases

All pre-release cases were classified by causal synoptic scale disturbance (2.4.1), as shown in Figure 14. All cases were caused by typhoons or stationary fronts, which accounted for about 70% and 30%, respectively. About 10% were a combination of typhoon and stationary front.
The trend regarding dominant disturbances is same as or becomes clearer than the heavy rainfall events defined meteorologically [11] (typhoon/tropical cyclone: 32.4%; stationary front: 21.2%; typhoon/tropical cyclone remote: 17.9%; low pressure: 14.2%; and cold front: 7.8%). In terms of pre-release, other events, including typhoons/remote tropical cyclones, low pressure, and cold fronts, are excluded.
Based on these ratios, the synoptic scale disturbances that should be focused on for pre-release are, first, typhoons, and second, stationary fronts, amounting to about one-half to one-third the level of a typhoon. One SIP named “Measures in Response to Super Typhoons” and another SIP named “Early Warning for Localized Heavy Rainfall” are actively engaged in research and the development of typhoon and linear rainbands, which tends to occur in stationary fronts, respectively [12,13]. Their importance for pre-release was confirmed through these results.

3.2. Required Forecast Length of Rainfall Forecast

The ratios of cases with emergency release risks (Section 2.3.3) in pre-release simulations using rainfall forecasts of four different forecast lengths (Section 2.4.2, 39 h, 84 h, 132 h, and 264 h) were calculated for all pre-release cases, shown in the left of Figure 15.
The overall trend shows that 84 h avoids an emergency release risk at additional 10% comparing with 39 h, which represents a higher risk at about 20%, and then there is gradual change between 84 h and 264 h.
By meteorological cause, the ratio with emergency release risk in stationary front cases is higher than that in typhoon cases in all patterns of forecast length, and the change among the patterns is also clearer by four times or more in terms of risk reduction from 39 h to 84 h. The reason for this is in the length of flood duration, as shown in the right of Figure 15, which indicates that flood lengths in stationary front cases tend to reach 2 days or more.
From the above, it can be seen forecast lengths of 84 h or more, which are present in Japan as described in Section 2.4.2, are generally sufficient if their accuracy are assumed to be perfect, although just using MSM, the main length of 39 h is insufficient for stationary front cases. In other words, almost perfect accuracy in terms of not only potential but also quantity is required up to at least 39 h ahead. Note that this result is based on the assumptions in Section 2.3.2, which could be more severe due to the constraints of discharge at each reservoir or certain application methods of pre-release. In such a case, the comparison of feasibility between realization of rainfall forecast and that of the reservoir side is important when evaluating this result.

3.3. Required Spatial Resolution of Rainfall Forecast

The ratios with an emergency release risk (top row in Table 1) in all pre-release cases, and water use risk (bottom row in Table 1) in all pre-release and quasi-pre-release cases (Section 2.3.3) when using rainfall forecasts for three different patterns of spatial resolution (Section 2.4.3, 1: 5 km + 20 km; 2: mainly 5 km; and 3: original 1 km) were calculated.
The ratios of cases with an emergency release risk because of upscaling to 5 km or 20 km grids are merely a few percent. Specifically, except for three cases which were originally at risk at 1 km (original resolution), only about 6% (four cases) in 1 (5 + 20 km) and about 4% (three cases) in 2 (mainly 5 km) were newly at risk.
When it comes to water use risk, there were no changes between the three patterns, that is, no patterns contained risk. In other words, it can be seen that simply upscaling to 5 km or 20 km does not cause water use risk.
Based on the above results, the combined use of the current JMA MSM (5 km) and GSM (20 km) was generally sufficient with respect to spatial resolutions for pre-release if rainfall was correctly predicted. In addition, it could be beneficial to develop a higher spatial resolution of 1 km grids in preparation for insufficiency in a few cases. Maruya et al. targeting one catchment in Japan, also concluded that the effect of upscaling is small but the impact of the dynamic downscaling of the climate model process is relatively large [14]. In this situation, it can be said that appropriate selection for rainfall estimation is the highest priority.

3.4. Required Amount Accuracy of Rainfall Forecasts

The ratios of cases with an emergency release risk when using variously underestimated rainfall forecasts for all pre-release cases is shown in Figure 16 and Figure 17.
When the degree of underestimation of rainfall is minus several tens of percent per 1 day ahead (right side of Figure 16), most of the cases (70–90%) are judged as cases with an emergency release risk (except for cases where emergency release cannot be avoided, despite water use capacity being fully pre-released), which is clearly inadequate. In the cases where the degree of the underestimation is minus about 10% per 1 day ahead, cases with emergency release risk decrease by less than half of all pre-release cases. Finally, in the case of a few % minus per 1 day ahead (left side of Figure 16), which is almost a perfect estimate, about 90% of the cases can avoid emergency release risk.
In conclusion, it can be said that underestimation should be kept within the degrees of a few %/d ahead for appropriately avoiding emergency release risk. However, several tens of %/d ahead is quite possible from comparison with underestimations in the current JMA MSM and GSM (although including those caused by the position errors of the rainfall zone) as shown in the background colors of Figure 17, so the underestimation level needs to be reduced by one digit.
Next, the ratios of cases with water use risk when using variously overestimated rainfall forecasts were calculated for all pre-release cases and quasi-pre-release cases, as shown in Figure 18 and Figure 19.
Water use risk from overestimated amount is almost negligible because only a few percent of cases have this risk, despite using forecasts that include double the actual rainfall, which is larger than the present rainfall forecasting trend shown in the background colors of Figure 19. Therefore, it can be said that the tolerance for water use risk is relatively high. Note that this study does not cover the cases where rainfall was overestimated by ten times or more. In addition, the probability of excessive pe-release beyond what was necessary is high, at more than 90%, and this can be a burden on the reservoir operators.
Based on all the above, it is suggested that it is optimal solution to release as much water as possible to avoid emergency release risk to the extent that water use capacity can predictably be restored. To achieve this, a framework that probabilistically handles lower ensemble members to ensure the inflow for the restoration of water use capacity and the upper ensemble members to capture the possibility of the existence of emergency release risk can be an effective method. In fact, the study by Kido et al. proposed a pre-release method similar to that described above [29], which is confirmed to be an effective approach.

3.5. Required Position Accuracy of Rainfall Zone

3.5.1. Position Error for Stationary Front Cases

The ratios of cases with an emergency release risk (red in Figure 20 and Figure 21) in all pre-release front cases and water use risk (blue in Figure 20 and Figure 21) in all pre-release and quasi-pre-release front cases (Section 2.3.3) when using rainfall forecasts with various patterns of position errors perpendicular to the front line (Section 2.4.5) were calculated.
In the case where rainfall zone shifted by 50–100 km per day ahead (right, upper side of Figure 20 and Figure 21), almost 80% of the cases fail to avoid emergency release risk. Most of the cases succeeded in avoiding the risk when the rainfall zone shifted by just 1–5 km 1 day ahead to a dozen kilometers even several days ahead (left, lower side of Figure 20 and Figure 21). In contrast, water use risk is 0% for all patterns. In short, water use risk is unlikely to be caused by a positioning error of the rainfall zone in pre-release and quasi-pre-release front cases. Note that reservoirs encountering little or no rainfall are not included.
Comparing these results with the present forecast, which shows that the position error should be decreased by one digit: the present forecast is several tens of km to 100 km per day ahead and the ideal is several kilometers to 10 km per day ahead. In JMA’s validation reports about forecasts of recent front events, the deviations of the rainfall zone are frequently pointed out in detail at ~100 km in 12 h forecasts, tens of kilometers in 3 h forecasts, and tens of kilometers in 18 h forecast in terms of visual measurements, which equals to or exceeds the level of the second scenario from the top of Figure 21 [15]. One of the causal elements in the meteorological model relating to this positional error can be identified through the analysis of Meso low pressure, which is a small low pressure formed over the front and accompanies the inflow of water vapor and the wind shear line. A more detailed analysis of this is left to the developers of a meteorological model.
On the other hand, this requirement level cannot simply be expected to improve the accuracy of the forecast model. In the JMA reports, the outputs of the ensemble forecast named MEPS, which display all forecasts obtained by introducing possible perturbations, show that a strong rainfall area corresponding to a linear precipitation zone generally has a spread of around 100 km in a day or less [15]. That is, the location of a strong rainfall area cannot be narrowed down. This means that this degree of error inevitably occurs due to errors in the observation data, the limitations of calculation method, and inherent chaotic nature of weather. Therefore, it is difficult to dramatically improve the requirements in Figure 20 and Figure 21 by clarifying physical processes or improving computational power; instead, it is more realistic that the reservoir aspects should be made more flexible, for example by utilizing a stochastic approach.

3.5.2. Position Error for Typhoon Cases (Excluding Exceptions)

The ratios of cases with an emergency release risk in all pre-release typhoon cases (red in Figure 22 and Figure 23) and water use risk in all pre-release and quasi-pre-release typhoon cases (blue in Figure 22 and Figure 23), excluding exceptions (Section 2.4.5), when using rainfall forecasts with certain patterns of acceleration and deceleration of the rainfall zone against the typhoon movement speed (Section 2.4.5) were calculated.
Emergency release risk increases especially with acceleration (right, upper sides of Figure 22 and Figure 23), while water use risk is nonexistent in both accelerations and decelerations, although many excessive pre-releases may occur despite this, especially with deceleration (left, lower side of Figure 22 and Figure 23). Specifically, 24% of the cases when using forecasts with an uncertainty pattern of 1.1 (…1.2, …1.3) times the typhoon movement speed at 1 (…2, …3) day before a flood, 41% at 1.2 (…1.4, …1.6) times, and 52% at 1.33 (…1.66, …1.99) times represent an emergency release risk. In short, several tens of percentage values of accelerations cause the risk to increase in one-fifth to one half of cases. On the other hand, a speed reduction of less than 0.5 times does not cause water use risk (blue: 0%), although there is excessive pre-release in about 60% of cases.
This trend is consistent with the general theory. The reason why the emergency release risk is higher for acceleration is that the forecast underestimates the amount of rainfall when a typhoon moves faster. In contrast, the reason why the ratio of excessive pre-release is higher during typhoon deceleration is that longer stagnation times of typhoons in forecasts can lead to an overestimation of rainfall. In fact, the JMA report states that one of the reasons for scheduled warnings not being issued during Typhoon Haishen in 2020 was the slow speed of the typhoon in the forecasts [15]. In this case, the slowdown was about −20% at about 36–48 h ahead visually, which roughly equaled the examined pattern of −10%/d ahead, as seen in Figure 22 and Figure 23. Note that the topographic effect was not correctly expressed in this experiment.
The above results indicate that the acceleration/deceleration of the typhoon’s movement speed is a factor influencing emergency release risk, but it is unlikely to cause excessive pre-release which overwhelms water use capacity. Considering that the speed of a typhoon is several tens km/h and the path error in current forecasting is 87 (157) km at 1 (2) day ahead [15], the target accelerations/decelerations of several tens of percentage points can occur, so it is desirable to pre-discharge water aggressively within the allowable range that does not lead to water use risk.

4. Conclusions

This study quantitatively summarized the specifications and accuracy of rainfall forecasts required for reservoir pre-release and the direction of its improvement in terms of five elements: (1) the characteristics of situation requiring pre-release, (2) forecast length, (3) spatial resolution, (4) amount accuracy, and (5) the position accuracy of the rainfall zone, although considerable room for the reproduction of reality and generality was left.
In terms of (1), it is desirable to have a forecast system with clarified mechanism or meteorological observation network capable of accurately and uniformly anticipating particularly extreme rainfall beyond planned capability caused by typhoon or stationary fronts across reservoirs nationwide.
In terms of (2) and (3), changing forecast length and spatial resolution are not as urgent an issue as improving accuracy. Assuming that the accuracy is perfect, the specifications themselves provided by JMA are almost sufficient. Although this does not prevent the attempt at achieving longer forecast lengths and higher resolutions, the comparison between feasibility remaining high in terms of quantitative accuracy and flexibility in reservoirs is required.
In terms of (4) and (5), the forecasting accuracy of rainfall amount and location of the rainfall zone was found to be particularly challenging when compared with the current accuracy of emergency release risks and less challenging in regard to water use risk. Because it is impossible to simply expect the improvement of deterministic forecasts in the former, a new approach in reservoir operation utilizing large allowable ranges of excessive pre-release based on much forecast data could be the optimal option.
It is hoped that this study will play a role in the following values for three different groups. The first is that the civil engineers who are responsible for reservoir operation can gain increased awareness for skill of current forecasting and explore its appropriate uses. The second is that the civil engineers can provide their demand to meteorologists developing forecast model precisely. Third is for the public to understand the difficulties of pre-release and reduce misunderstandings of its effectiveness. The information presented here is not only for the people of Japan but also for individuals in other countries dealing with reservoirs of the same scales and/or with the same topic, namely the advanced use of existing reservoirs against climate change using forecast information.

Author Contributions

Conceptualization and methodology, H.F. and S.K.; software, H.F.; validation, H.F. and S.K.; formal analysis, data curation, and writing—original draft preparation, H.F.; writing—review and editing, H.F. and S.K.; visualization, H.F.; supervision, S.K.; project administration, H.F.; funding acquisition, S.K. All authors have read and agreed to the published version of the manuscript.

Funding

This research was supported by JSPS KAKENHI Grant Number 21K18744.

Data Availability Statement

Data for this study can be found within the article, including the acknowledgments and references.

Acknowledgments

River map data of CaMa-Flood based on J-FlwDir were supplied by Dai Yamazaki of the University of Tokyo. JMA, MSM, and GSM were collected and distributed by the Research Institute for Sustainable Humanosphere, Kyoto University (http://database.rish.kyoto-u.ac.jp/index-e.html (accessed on 10 February 2023)). Observed inflow data were distributed by Water Information System, MLIT. Dam locations and geological maps were obtained from the GIS homepage, MLIT (https://nlftp.mlit.go.jp/index.html (accessed on 16 December 2020)).

Conflicts of Interest

The authors declare no conflict of interest. The funders had no role in the design of the study; in the collection, analyses, or interpretation of data; in the writing of the manuscript; or in the decision to publish the results.

References

  1. Intergovernmental Panel on Climate Change. Climate Change 2021: The Physical Science Basis. Available online: https://www.ipcc.ch/report/ar6/wg1/ (accessed on 7 February 2023).
  2. Delaney, C.J.; Hartman, R.K.; Mendoza, J.; Dettinger, M.; Delle Monache, L.; Jasperse, J.; Ralph, F.M.; Talbot, C.; Brown, J.; Reynolds, D.; et al. Forecast Informed Reservoir Operations Using Ensemble Streamflow Predictions for a Multipurpose Reservoir in Northern California. Water Resour. Res. 2020, 56, e2019WR026604. [Google Scholar] [CrossRef]
  3. Kompor, W.; Yoshikawa, S.; Kanae, S. Use of Seasonal Streamflow Forecasts for Flood Mitigation with Adaptive Reservoir Operation: A Case Study of the Chao Phraya River Basin, Thailand, in 2011. Water 2020, 12, 3210. [Google Scholar] [CrossRef]
  4. Ministry of Land, Infrastructure, Transport and Tourism, Water and Disaster Management Bureau. Guidelines for Reservoirs’ Pre-Release. Available online: https://www.mlit.go.jp/river/shishin_guideline/dam/pdf4/02jizenhouryu_guideline_honbun.pdf (accessed on 7 February 2023).
  5. Japan Meteorological Agency. Numerical Weather Prediction Activities. Available online: https://www.jma.go.jp/jma/en/Activities/nwp.html (accessed on 7 February 2023).
  6. Ministry of Land, Infrastructure, Transport and Tourism; Japan Meteorological Agency. Press Release for Typhoon Nanmadol. Available online: https://www.jma.go.jp/jma/press/2209/19a/siryou.pdf (accessed on 7 February 2023).
  7. Ministry of Land, Infrastructure, Transport and Tourism. Press Release about Pre-Release in 2022. Available online: https://www.mlit.go.jp/report/press/mizukokudo04_hh_000196.html (accessed on 7 February 2023).
  8. Nikkei. Pre-Release Was Difficult at Water Use Reservoirs Due to Unexpected Rainfall in Kumagawa River. Available online: https://www.nikkei.com/article/DGXMZO62295430U0A800C2CC1000/ (accessed on 7 February 2023).
  9. Nakamura, R.; Shimatani, Y. Extreme-flood control operation of dams in Japan. J. Hydrol. Reg. Stud. 2021, 35, 100821. [Google Scholar] [CrossRef]
  10. Tanaka, T.; Kitaguchi, K.; Tachikawa, Y. Future changes of flood control effect by dam reservoirs over Japan using d4PDF. J. Jpn. Soc. Civ. Eng. Ser. B 2021, 77, I_49–I_54. [Google Scholar] [CrossRef] [PubMed]
  11. Tsuguti, H.; Kato, T. Objective Extraction of Heavy Rainfall Events and Statistical Analysis on their Characteristic Features. Tenki 2014, 61, 455–469. [Google Scholar]
  12. Cross-Ministerial Strategic Innovation Promotion Program (SIP); Cabinet Office, Government of Japan; National Research Institute for Earth Science and Disaster Resilience. V. Early Warning for Localized Heavy Rainfall. Available online: https://www.nied-sip2.bosai.go.jp/research-and-development/theme_5.html (accessed on 7 February 2023).
  13. Cross-Ministerial Strategic Innovation Promotion Program (SIP); Cabinet Office, Government of Japan; National Research Institute for Earth Science and Disaster Resilience. VI. Measures in Response to Super Typhoons. Available online: https://www.nied-sip2.bosai.go.jp/research-and-development/theme_6.html (accessed on 7 February 2023).
  14. Maruya, Y.; Harada, M.; Ito, R.; Kawase, H.; Dairaku, K.; Sasaki, H. Influences of spatial resolution of rainfall distribution on runoff analysis toward climate change impact assessment. J. Jpn. Soc. Civ. Eng. Ser. G 2018, 74, 147–156. [Google Scholar] [CrossRef] [PubMed]
  15. Japan Meteorological Agency. Explanatory Materials of Numerical Weather Prediction. Available online: https://www.jma.go.jp/jma/kishou/books/nwpkaisetu/nwpkaisetu.html (accessed on 7 February 2023).
  16. Mito, T.; Matsugahira, K.; Hara, T. Notes on the use of rainfall forecast information for dam operations. Rep. WRERI 2020, 1, 25–41. [Google Scholar]
  17. Fujita, H.; Seto, R.; Kanae, S. Applicability of JMA MSM and GSM for pre-release at multi-purpose dams in Japan. J. Jpn. Soc. Civ. Eng. Ser. B1 2021, 77, 85–90. [Google Scholar] [CrossRef] [PubMed]
  18. Cabinet Secretariat. List of Reservoirs from Class A Rivers in Japan. Available online: https://www.kantei.go.jp/jp/singi/kisondam_kouzuichousetsu/dai3/sankou.pdf (accessed on 7 February 2023).
  19. Ministry of Land, Infrastructure, Transport and Tourism, Disaster Information for River. Available online: https://www.river.go.jp/index (accessed on 7 February 2023).
  20. Japan Meteorological Agency. Measuring Rainfall—What Is Radar/Raingauge-Analyzed Precipitation? Available online: https://www.jma.go.jp/jma/en/Activities/Measuring_Rainfall.pdf (accessed on 7 February 2023).
  21. Ministry of Land, Infrastructure, Transport and Tourism. GIS Homepage. Available online: https://nlftp.mlit.go.jp (accessed on 7 February 2023).
  22. Yamazaki, D.; Togashi, S.; Takeshima, A.; Sayama, T. High-resolution flow direction map of Japan. J. Jpn. Soc. Civ. Eng. 2020, 8, 234–240. [Google Scholar] [CrossRef] [PubMed]
  23. Ishihara, Y.; Kobatake, S. Runoff model for flood forecasting. Bull. Disaster Prev. Res. Inst. 1979, 29, 27–43. [Google Scholar]
  24. Japan Meteorological Agency. Soil Water Index, Runoff Index, and Surface Water Index. Available online: https://www.jma.go.jp/jma/en/Activities/qmws_2018/Presentation/3.1/Soil%20Water%20Index,%20Runoff%20Index,%20and%20Surface%20Water%20Index_revised.pdf (accessed on 7 February 2023).
  25. Oota, T. New index for heavy rain and flood warning work. JMA Tech. Mater. Quant. 2017, 22, 30–47. [Google Scholar]
  26. Ministry of Land, Infrastructure, Transport and Tourism, Water Information System. Available online: http://www1.river.go.jp (accessed on 7 February 2023).
  27. Sayama, T.; Yamada, M.; Sugawara, Y.; Yamazaki, D. Ensemble flash flood predictions using a high-resolution nationwide distributed rainfall-runoff model: Case study of the heavy rain event of July 2018 and Typhoon Hagibis in 2019. Prog. Earth Planet. Sci. 2020, 7, 75. [Google Scholar] [CrossRef]
  28. Japan Weather Association. JWA Ensemble Rainfall Forecasting. Available online: https://www.jwa.or.jp/service/weather-risk-management/flood-hazard-09/ (accessed on 7 February 2023).
  29. Kido, K.; Tano, H.; Sumi, T.; Nohara, D.; Michihiro, Y.; Kitani, K. Development of effective pre-release method for dams during super typhoons using long-term ensemble rainfall forecasts. E3S Web Conf. 2022, 346, 1016. [Google Scholar] [CrossRef]
Figure 1. Flowchart about connections among subsections of second section.
Water 15 01277 g001
Figure 2. Distribution and regular rules of all multi-purpose reservoirs from class A rivers in Japan.
Water 15 01277 g002
Figure 3. Outline of the nationwide rainfall–runoff reservoir model.
Water 15 01277 g003
Figure 4. Schematic diagram of the methods used to obtain reservoir basins’ information.
Water 15 01277 g004
Figure 5. Schematic diagram for “pre-release case” and “quasi-pre-release case”.
Water 15 01277 g005
Figure 8. Forecast patterns of spatial resolutions according to forecast-lead time.
Water 15 01277 g008
Figure 9. Forecast patterns with underestimation (red lines) and overestimation (blue lines) of rainfall amount linearly according to forecast-lead time. 5 h moving and reservoir basin averages of the JMA rainfall forecast for 2018–2022 (MSM –39 h ahead/GSM 40 h ahead–) is represented in background color: gray for 25–75 percentile and light gray for 5–95 percentile.
Water 15 01277 g009
Figure 10. Forecast patterns with displacements [km] of the rainfall zone perpendicular to front line. The vertical distance of the background map is the y-axis. N km/d: a pattern with position error +N km per 1 day ahead.
Water 15 01277 g010
Figure 11. Forecast patterns of accelerations and decelerations to typhoon movement speeds. ±N %/d before: a pattern accelerating/decelerating rainfall by ±N % of typhoon movement per a day before.
Water 15 01277 g011
Figure 12. Number of pre-release cases (black) and quasi-pre-release cases (gray) per year. Number of origin events and major event names are added in orange.
Water 15 01277 g012
Figure 13. Number of pre-release cases for each reservoir on a map.
Water 15 01277 g013
Figure 14. Number of pre-release cases by meteorological cause.
Water 15 01277 g014
Figure 15. (Left) ratio (%) of cases with an emergency release risk when using four different forecast lengths for all pre-release cases. Perfect accuracy for the lengths was assumed. (Right) boxplots of durations (day) of flood control in all pre-release cases.
Water 15 01277 g015
Figure 16. Ratio (%) of cases with an emergency release risk when using variously underestimated rainfall forecasts for all pre-release cases.
Water 15 01277 g016
Figure 17. Another version of Figure 16 shown on the forecast patterns’ variations. Ratio (%) of cases with an emergency release risk when using variously underestimated rainfall forecasts for all pre-release cases. −N%/d: a pattern with underestimation of −N % per a day ahead. 5 h moving and reservoir basin averages of the JMA rainfall forecast (MSM ~39 h/GSM 40 h~) is represented in background color: gray for 25–75 percentile and light gray for 5–95 percentile.
Water 15 01277 g017
Figure 18. Ratio (%) of cases with a water use risk when using variously overestimated rainfall forecasts for all pre-release cases and quasi-pre-release cases (in blue). Ratio of cases implementing excessive pre-release beyond what is necessary is included (in light blue).
Water 15 01277 g018
Figure 19. Another version of Figure 18 shown on the forecast patterns’ variations. Ratio (%) of cases with water use risk when using overestimated rainfall forecasts for all pre-release and quasi-pre-release cases. 5 h moving and reservoir basin averages of JMA’s rainfall forecast (MSM –39 h/GSM 40 h–) is represented in background color: gray for the 25–75 percentile and light gray for the 5–95 percentile.
Water 15 01277 g019
Figure 20. Ratio (%) of cases with an emergency release risk in all pre-release front cases (red), water use risk and excessive pre-release in all pre-release and quasi-pre-release front cases (blue, light blue) when using rainfall forecasts with various position errors of rainfall.
Water 15 01277 g020
Figure 21. Another version of Figure 20 shown on the forecast patterns’ variations. Ratio (%) of cases with an emergency release risk in all pre-release front cases (red) and a water use risk in all pre-release and quasi-pre-release front cases (blue) when using rainfall forecasts with various position errors of the rainfall zone. N km/d: a pattern with position error +N km per 1 day ahead.
Water 15 01277 g021
Figure 22. Ratio (%) of cases with emergency release risk in all pre-release typhoon cases (red) and water use risk and excessive pre-release in all pre-release and quasi-pre-release typhoon cases (blue, light blue) (excluding exceptions) when using rainfall forecast with the acceleration/deceleration of rainfall zone.
Water 15 01277 g022
Figure 23. Another version of Figure 22 shown on the forecast patterns’ variations. Ratio (%) of cases with an emergency release risk in all pre-release typhoon cases (red) and water use risk in all pre-release and quasi-pre-release typhoon cases (in blue square brackets) (excluding exceptions) when using rainfall forecasts with the acceleration/deceleration of rainfall zone. ±N %/d before: a pattern accelerating/decelerating rainfall by ±N % of typhoon movement per a day before.
Water 15 01277 g023
Table 1. Ratios of cases with emergency release risk or water use risk when using three different patterns of spatial resolution of rainfall forecasting. Their accuracies were assumed to be perfect.
1 (5 km + 20 km)2 (Mainly 5 km)3 (Original 1 km)
Ratio with emergency release risk (%)
in 69 cases *1
10.3 (7 cases)8.8 (6 cases)4.4 (3 cases)
Ratio with water use risk (%)
in 111 cases *2
000
Notes: *1 All pre-release cases. *2 All pre-release cases and quasi-pre-release cases.
Disclaimer/Publisher’s Note: The statements, opinions and data contained in all publications are solely those of the individual author(s) and contributor(s) and not of MDPI and/or the editor(s). MDPI and/or the editor(s) disclaim responsibility for any injury to people or property resulting from any ideas, methods, instructions or products referred to in the content.

