Article

Research on Subsidence Prediction Method of Water-Conducting Fracture Zone of Overlying Strata in Coal Mine Based on Grey Theory Model

1
Key Laboratory of Mine Geological Hazards Mechanism and Control, Xi’an 710054, China
2
Shenhua Geological & Exploration Company Ltd., China Energy Group, Beijing 102211, China
3
School of Resources and Geosciences, China University of Mining and Technology, Xuzhou 221116, China
4
Key Laboratory of Ground Fissures Geological Hazards (Jiangsu Research Institute of Geological Survey), Nanjing 210049, China
*
Author to whom correspondence should be addressed.
Water 2023, 15(23), 4177; https://doi.org/10.3390/w15234177
Submission received: 27 September 2023 / Revised: 6 November 2023 / Accepted: 15 November 2023 / Published: 2 December 2023

Abstract

:
The development height and settlement prediction of water-conducting fracture zones caused by coal seam mining play an important role in the stability of overburden aquifers and the safety of roadways. Based on the engineering geological data of the J60 borehole in the Daliuta Coal Mine and the mining conditions of the 2−2 coal seam, China, this study established a similar material test model of mining overburden. The deformation characteristics of overlying strata in the mining process of coal seam were studied by using distributed optical fiber sensing technology, and the development height of water flowing fractured zone was determined. According to the equidistant sampling characteristics of Brillouin optical time domain reflection technology and the principle of the grey theory model, the settlement prediction model of the water-conducting fracture zone was established. By analyzing and comparing the prediction accuracy of the GM (1, 1) model, grey progressive model, and metabolic model, the optimal method for settlement prediction of the water-conducting fracture zone was discussed. The results show that, for the metabolic model, with the increase in the number of test sets and the decrease in the number of prediction sets, the mean square error ratio c and the small error probability p of the prediction accuracy evaluation parameters display a downward trend. The accuracy is related to the sudden change in the settlement of the water-conducting fracture zone caused by the breaking of the key stratum of the overlying rock. The optimal time of test sets selected for the best settlement prediction model is 7~8, and that of prediction sets selected is 5~6. For the GM (1, 1) model and the grey progressive model, the prediction accuracy of mining overburden subsidence is grade 4, which is not suitable for settlement prediction of water-flowing fractured zones.

1. Introduction

As China’s main energy source and important chemical raw material, coal plays an irreplaceable role in ensuring energy security. After the underground coal resources are mined, the overlying rock mass moves to the goaf, and the caving zone, fracture zone, and bending subsidence zone are formed in the overlying strata, referred to as the ‘three zones’. Among them, the sum of the caving zone and the fracture zone is collectively referred to as the water-conducting fracture zone [1]. The spatial relationship between the development height of the water-flowing fractured zone and the distribution of the aquifer determines the risk of water inrush in coal mine roadways [2,3]. Therefore, the development height and settlement prediction of the water-conducting fracture zone caused by coal seam mining play a very important role in the safety of coal mine roadways.
In terms of the measurement of water-conducting fracture zones, geophysical exploration [4,5], the borehole pumping test and water injection test [6,7,8], borehole TV method detection [9,10], and other instruments and methods are used to monitor the mining overburden rock, analyze the physical characteristics of rock and soil fracture evolution, and determine the development height of the ‘three zones’ in the overlying strata. The above testing techniques and methods are affected by the properties of rock and soil and the change in aquifer water level; as a result, it is difficult to quantitatively describe the development height and potential fracture development characteristics of the water-conducting fracture zone. By contrast, the numerical simulation method can quantitatively study the influence of coal mining on overburden disturbance, but it ignores the mining fracture and rock movement state, resulting in low simulation accuracy [11,12]. Distributed optical fiber sensing technology can be used to obtain the continuous distribution information of the measured field in time and space at the same time along the optical fiber path, which can accurately locate the position of the event and make up for the lack of test accuracy in the deformation monitoring of mining overburden [13]. At the same time, the distributed optical fiber is suitable for coal mining overburden deformation monitoring because of its high stability [14], wide monitoring range [15], strong anti-electromagnetic radiation ability [16], dynamic perception [17], and other advantages. Based on the many advantages of distributed optical fiber technology, the deformation of mining overburden is monitored to provide technical support for the safe advancement of the coal mining face.
The settlement prediction of a water-conducting fracture zone is an important means to evaluate the potential cracks of overlying strata. In view of the characteristics of large thickness, complex multi-field action, and long disturbance time of coal seam mining overburden, the grey theory can transform the irregular original data into a more regular generation sequence and then model it to solve the problem of subsidence prediction of mining overburden. At present, based on the measured data of surface settlement, the grey theory settlement prediction model has been established [18,19]. Because the selected surface monitoring data are not directly related to the formation properties and coal seam mining conditions, there is a large error between the predicted results and the actual settlement [20]. The accuracy of the prediction model is an important factor that affects the correctness of the prediction function.
This study, aiming at the problem of subsidence prediction of water-conducting fracture zones caused by coal seam mining, used distributed optical fiber sensing technology to explore the subsidence evolution characteristics of water-conducting fracture zones caused by coal seam mining through the model test of mining overburden. Combined with the grey theory model, the subsidence prediction method of mining overburden was established. By comparing different prediction data and prediction methods, the optimal prediction model was selected. According to the accuracy criterion of the grey theory model, the accuracy of settlement prediction based on the grey model was discussed. On this basis, the applicable conditions of the grey theory model in the prediction of water-conducting fracture zones were put forward. The research results provide a theoretical basis for the prediction of overburden settlement and fracture evolution in coal mines.

2. Prediction Method of Mining-Induced Overburden Subsidence Based on Grey Theory

2.1. Basic Principle of Grey Theory Model

The grey prediction model can describe the development trend of the system with limited data. In grey theory, the GM (1, 1) model, grey progressive prediction model, and metabolic model are the main methods of subsidence prediction in coal mine goaf [21,22].
The GM (1, 1) model is used to perform a cumulative generation (1-AGO) operation on the equidistant monitoring original data sequence X(0) to obtain a new sequence X(1). The prediction formula for the GM (1, 1) model is shown as follows [19].
X ^ ( 1 ) ( k + 1 ) = X ( 0 ) ( 1 ) μ α e α k + μ α , k = 0 , 1 , 2 , , n
where the original sequence X ( 0 ) = x ( 0 ) ( 1 ) , x ( 0 ) ( 2 ) , , x ( 0 ) ( k ) , x ( 0 ) ( n ) ; prediction sequence X ( 1 ) = x ( 1 ) ( 1 ) , x ( 1 ) ( 2 ) , , x ( 1 ) ( k ) , x ( 1 ) ( n ) ; α denotes the development coefficient, reflecting the change trend of x ; and μ represents the grey action quantity, reflecting the change in data sequence.
By substituting k = n into Formula (1), the n+1 prediction result is obtained according to the previous n data.
Before the grey prediction modeling of the settlement sequence data, it is necessary to use the grade ratio test to determine the feasibility of the grey model prediction. When the level ratio of the original sequence data satisfies λ 0 ( k ) = const , the sequence data can be modeled by GM (1, 1), as shown in Formula (2).
λ 0 ( k ) ( e 2 n + 1 , e 2 n + 1 )
It can be seen from Equation (2) that the level ratio of the original sequence data predicted by the grey model falls in the range of ( e 2 n + 1 , e 2 n + 1 ) , and the model GM (1, 1) data are used for grey prediction.
The grey progressive model is used to add the new prediction data x ^ 0 n + 1 to the last data in X 0 , and the n + 1 data are used as the original data to model the data sequence and re-estimate the model parameters. As the number of prediction periods or actual observations increases, the characteristics of poor information data in the grey progressive model change, and the influence of old data on the prediction results may decrease continuously.
The metabolic model is based on the grey progressive model. The predicted value calculated by the GM (1, 1) model is added to the final data of the known sequence, and the first data x 0 1 of each group are deleted to maintain the same sequence dimension. Then, a new GM (1, 1) model is established for the next prediction, and the prediction is carried out in turn.
The sampling interval of distributed optical fiber sensing of mining overburden is set to 0.05 m, which belongs to equal interval data, and the data sequence is suitable for the GM (1, 1) model.

2.2. Model Accuracy Test

For the accuracy discrimination of the grey prediction model, the posterior difference test and the grey correlation degree test are used [23].
(1)
Posteriori error test
The calculation method of the mean square error ratio (C) and the small error probability (P) in the residual test is shown in Formulas (3) and (4).
C = S 1 S 2
P = P Δ ( i ) Δ ¯ < 0.6745 S 1
In Formula (3), S1 denotes the mean square error of the original sequence X ( 0 ) ( k ) , and S2 denotes the mean square error of the residual sequence Δ(i), Δ ¯ denotes the mean of the residual sequence Δ(i).
(2)
Grey correlation degree test
The grey correlation degree (r) is a quantitative representation of the degree of correlation between various factors. The calculation formula of the grey correlation degree is shown in Formulas (5)–(7).
r = 1 + m + m 1 + m + m + m m
m = k = 2 n 1 s ( 0 ) ( k ) s ( 0 ) ( 1 ) + 1 2 s ( 0 ) ( n ) s ( 0 ) ( 1 )
m = k = 2 n 1 s ^ ( 0 ) ( k ) s ^ ( 0 ) ( 1 ) + 1 2 s ^ ( 0 ) ( n ) s ^ ( 0 ) ( 1 )
According to the mean square error ratio (C), small error probability (P), and grey correlation degree (r) of the grey model, the prediction accuracy is divided into four grades. The test and evaluation standards of prediction accuracy are shown in Table 1 [24].

2.3. Grey Theory Prediction Method of Overburden Subsidence Based on Distributed Strain Monitoring

As for the distributed optical fiber monitoring method of mining overburden, the sensing optical fiber is vertically buried into the overlying rock and soil mass of the coal seam through drilling, and sealed with the backfill material; then, the strain distribution of the rock and soil mass within the drilling range is monitored as the mining advances in the working face [25]. When coal seam mining leads to the subsidence of the overburden rock, the sensing fiber would consequently deform. The settlement calculation formula based on measured strain is expressed as Formula (8) [26].
Δ H = H 1 H 2 ε ( H ) d H
where Δ H is the distance between the buried depth of the rock layers H1 and H2, namely, the sampling interval of the Brillouin optical time domain reflection technology; and ε ( H ) denotes the strain of the rock test section.
Brillouin optical time domain reflectometry (BOTDR) in distributed optical fiber sensing technology is featured with distributed, long transmission distance and single-ended measurement, thus boasting clear advantages in the field of coal mining overburden monitoring [27]. The BOTDR system obtains the strain distribution of overburden rock by equal sampling interval, and the minimum sampling interval is 5 cm. Therefore, the subsidence value of overlying strata caused by coal seam mining is calculated by Formula (8), and the GM (1, 1) model is used to construct the prediction model of overburden subsidence. The accuracy of the prediction results of the model is evaluated and the evolution characteristics of overburden subsidence are analyzed by the model parameters of Formula (3)–(5). The grey prediction model program of mining overburden subsidence is shown in Figure 1.

3. Similar Material Model Test of Mining Overburden Deformation

3.1. The Scheme of Similar Material Model Test

A similar model test is widely used in the deformation monitoring of overlying strata in the mining field [28,29,30]. Based on the similarity theory, the calculation formulas of geometric similarity ratio and stress similarity ratio in similar model tests are as shown in Formulas (9) and (10):
The geometric similarity is expressed as
C l = l L
where C l denotes the length similarity scale, also known as the model scale; l is the length of the prototype; and L is the length of the model.
The stress similarity ratio is
C σ = R H R M = l L × r H r M
where C σ is the stress similarity ratio; R M denotes the mechanical properties of the rock in the similarity model; R H is the mechanical property of the rock in the prototype; r M is the unit weight of rock in the similar model; and r H is the unit weight of rock in the prototype.
The study area is located in the Daliuta Coal Mine, Shendong Coalfield, Shenmu County, Shaanxi Province. According to the J60 drilling data of Daliuta Coal Mine and the mining conditions of 2−2 coal seam, the mining method is the strike longwall mining method; the working face is 180 m long in the strike direction, with an average burial depth of 135 m. The length, width, and height of the indoor similar material model test device are 3 m × 2 m × 0.3 m, respectively. According to the similarity principle, the geometric similarity ratio C l = 100 and the stress similarity ratio C σ = 150 in the similar material model test.
In the model, river sand, lime, and gypsum are used as raw materials, which are uniformly mixed according to the ratio number, and 10% water is added as the material. After stirring evenly, they are laid in the model test device. The mechanical parameters and ratio numbers of the prototype and model of the Daliuta Coal Mine are shown in Table 2.
In this experiment, a 2−2 coal seam is taken as the research object. The thickness of coal seam mining is 4.2 cm, and the mining length of the coal seam working face is 5 cm. In order to grasp the deformation characteristics of overlying strata in the process of coal seam mining, 4 sensing optical fibers, A1, A2, A3, and A4, were arranged along the vertical direction of the model, which were 50 cm, 115 cm, 190 cm, and 250 cm away from the left side of the model frame, respectively. The BOTDR instrument (AV6419) was used in the experiment. The sensing fiber layout and coal seam mining scheme in the mining overburden model test are shown in Figure 2.
Using the photogrammetry method, the mark points were arranged at an interval of 10 cm along the horizontal and axial directions on the surface of the model to test the settlement of overlying strata during coal seam mining.

3.2. The Strain Distribution Characteristics of Mining Overburden Rock and the Height Determination of Water-Conducting Fractured Zone

Figure 3 shows the strain distribution map measured by A2 sensing fiber under the condition of 2−2 coal seam mining.
It can be seen from Figure 3 that after the working face passes through the monitoring hole, the overlying strata move to the goaf, and tensile deformation gradually appears from bottom to top in the rock stratum. When the coal seam is mined to 30 cm, the roof of the coal seam moves to the goaf, and the rock strata collapse. When the coal seam is mined to 45 cm, the caving area of the roof is expanded, and the roof settlement monitored by A2 sensing fiber increases. Meanwhile, the tensile strain is concentrated at the position of 5.1 cm from the roof, which is caused by the direct roof caving of the coal seam and the stretching of the sensing fiber at the rock interface. When the coal seam is mined to 60 cm, cracks and subsidence develop from bottom to top in the overlying strata, and separation occurs at 38 cm from the roof. With the further expansion of the mining range, the rock layer where the A2 sensing fiber is located has been fully mined, and the stress is released due to the collapse of the rock layer. The strain in the caving zone gradually decreases, the strain of the overlying rock gradually transfers upward, and the tensile strain at the separation layer gradually expands. When the working face is mined to 100 cm, the maximum tensile strain value appears, reaching up to 6055 μ ε .
According to the variation characteristics of the distributed optical fiber strain gradient in mining overburden, the development height of the water-conducting fracture zone is determined [9]. In this experiment, the development height of the water-conducting fracture zone is 37.8 cm, which is basically consistent with the measured height of 37 cm by photogrammetry. This shows that the method of determining the development height of a water-conducting fracture zone based on the measured strain of optical fiber is in line with the actual engineering situation.

3.3. Grey Model Prediction of Mining Overburden Deformation

According to the deformation distribution map of mining overburden rock in Formula (6) and Figure 3, the settlement value of the water-conducting fracture zone in the process of coal seam mining is obtained. When the working face passes through the A2 monitoring hole by 40 cm~75 cm, the settlement data of the water-conducting fracture zone of the A2 section are selected as the original data to establish the equidistant GM (1, 1) model. The 8 original settlement data of the water-conducting fracture zone are {2.052, 11.926, 10.036, 10.136, 11.614, 13.892, 15.523, 17.47}. When the working face passes through the A2 monitoring hole by 80 cm~100 cm, the settlement data of the water-conducting fracture zone of the A2 section are selected as the prediction data, that is, the 5 settlement data are {20.88, 26.943, 41.896, 69.474, 102.312}.
According to Formula (1), the development coefficient ( α ) in the GM (1, 1) model is −0.0929, and the grey action ( μ ) is 8.9582. The prediction expression of water-conducting fracture zone settlement based on grey theory is shown in Formula (11).
X ^ ( 0 ) ( K + 1 ) = 8.9582 e 0.0929 k
Through the grey progressive model and the metabolic model, the prediction results of the settlement of the water-conducting fracture zone are obtained respectively. The measured settlement curve and predicted settlement curve of the water-conducting fracture zone are shown in Figure 4.
It can be seen from the measured settlement curve in Figure 4 that the settlement of the water-conducting fracture zone in the coal seam mining stage is mainly divided into three stages. First is that, when the coal seam is mined to 45 cm, the settlement increases rapidly due to the direct roof subsidence of the caving zone. Secondly, when the coal seam is mined to 75 cm, the settlement increases slowly with the compression of the voids in the caving zone and the generation of cracks in the overlying strata. Third, with the further mining of coal seams, the separation of water-conducting fracture zones gradually expands, and the settlement enters accelerated development.
The predicted values of the settlement of the water-conducting fracture zone based on the three grey theories are compared with the settlement values of the photogrammetry in the model test. The results are shown in Table 3.
From Table 3 and Figure 4, it can be seen that the residuals of the first two prediction data of the metabolic model in the three grey theory settlement prediction models are 2.50 mm and 3.71 mm, respectively, and the relative residuals are less than 14%, indicating that the prediction results are better. The maximum residual error of the first two prediction data of the GM (1, 1) model and the grey progressive model reaches 6.78 mm, and the relative residual error reaches 25%. As the number of predictions increases, the prediction residuals of the three models gradually increase correspondingly, and the prediction accuracy decreases significantly.
The reason is that, for the GM (1, 1) model and the grey progressive model, the subsidence prediction of overlying strata is affected by the original monitoring data, and the initial subsidence is small. With the fracture and subsidence of rock strata caused by coal seam mining, the subsidence of the water-conducting fracture zone is large. At this time, the prediction model considers that the data are too complicated, resulting in an increase in the prediction residual as the number of predictions increases.

4. Parameter Optimization Evaluation Method of Grey Theory Prediction Model

(1)
Precision evolution characteristics of the grey model
By using the GM (1, 1) model, grey progressive model, and metabolic model, the best-measured data set and prediction data set in the prediction of mining overburden subsidence are analyzed to evaluate the best prediction effect of the model. The mining range of the working face is set to 40 cm–100 cm, and the settlement values of 13 water-conducting fracture zones are taken as the data set of the model. Among them, the mining range of the working face is set to 65 cm–100 cm, and the settlement values of the 8 water-conducting fracture zones are used as the prediction set. The relationship between the training set, the prediction set, and the working face advancing range of the model is shown in Table 4.
The parameter evolution characteristics of the posterior difference test in the prediction model are shown in Figure 5.
It can be seen from Figure 5 that with the increase in training number and the decrease in prediction times, the accuracy of the GM (1, 1) model and grey progressive model shows an increasing trend, but it still does not match the accuracy test, while the metabolic model as a whole shows a decrease in the accuracy of the model. The specific performance is as follows: the small error probability (p) of the GM (1, 1) model and grey progressive model reaches 0.85, but the mean square error ratio (C) is greater than 0.65, and the accuracy level of the model is 4, which is unqualified. The mean square error ratio (C) of the metabolic model is between 0.17 and 0.52, and the small error probability (p) is greater than 0.92. For the metabolic model, when the number of training and prediction times is before (7, 6), the accuracy level of the model is 1, and the accuracy gradually decreases as the number of tests increases. Because the settlement of the water-conducting fracture zone in the overburden changes greatly, with the increase in the number of training choices, the volatility of the data sequence is relatively large, and the settlement data sequence cannot well meet the conditions of the level test, resulting in a decline in prediction accuracy. On the other hand, according to the key stratum theory [31,32] and the experimental results, the breaking distance of the key stratum is 80 cm, the corresponding training number is 7, and the best prediction number is 6.
The variation characteristics of the grey correlation degree in the prediction model are shown in Figure 6.
It can be seen from Figure 6 that the overall prediction accuracy of the GM (1, 1) model and the grey progressive model increases with the increase in the number of training sets and the decrease in the number of predictions, while the metabolic model shows the opposite trend. The specific performance of the grey correlation degree of the GM (1, 1) model and the grey progressive model is as follows: with the increase in the number of training sets and the decrease in the number of prediction times, the grey correlation degree gradually increases. When the number of prediction times is less than 5, the correlation degree meets the accuracy requirements. For the metabolic model, as the number of training sets increases and the number of predictions decreases, the grey correlation degree displays a downward trend. When the number of predictions is greater than 5, the model correlation degree is 1 level, and when the number of predictions is less than 5, the correlation degree of the model becomes 2, and the correlation degree generally meets the requirements. It can be seen from Figure 5 and Figure 6 that there is a large deviation in the prediction accuracy of the grey theory. Both the GM (1, 1) and grey progressive models take all the initial data as the prediction set. However, with the passage of distance, the settlement data of overburden subsidence are large. The model considers that the data are too complicated, which will lead to a continuous decline in the prediction accuracy of the model. For the metabolic model, with the increase in mining times, the initial training data of the model are removed in time, and then the new prediction data are introduced as the new data of the training set, thus improving the prediction accuracy of the model.
(2)
Prediction accuracy analysis and evaluation of the grey model
Due to the similar trend of settlement prediction accuracy between the GM (1, 1) and grey progressive models, the training set and prediction set data of the GM (1, 1) model and metabolic model are used to analyze the settlement prediction accuracy of the water-conducting fracture zone.
The evaluation results of settlement prediction accuracy of the GM (1, 1) model are shown in Table 5.
It can be seen from Table 5 that for the GM (1, 1) model, with the increase in the number of training sets, the prediction accuracy of the model is improved, but the prediction accuracy level fails to meet the requirements. The reason is that the model takes the initial data as the training set. With the increase in the mining distance of the working face, the influence of the initial data in the model on the following new data becomes smaller, or even negligible, which leads to the continuous decline in the prediction accuracy of the model and makes it difficult to meet the requirements.
The evaluation results of the settlement prediction accuracy of the metabolic model are shown in Table 6.
It can be seen from Table 6 that as the number of training sets increases and the number of predictions decreases, the prediction accuracy of the metabolic model begins to decrease, and the accuracy level changes from excellent to good and finally to qualified.
As can be seen from Table 5 and Table 6, the overall accuracy trend of the prediction model shows that the prediction accuracy of the model decreases with the increase in the number of training sets. This is due to the influence of the prediction model by the fracture distance of the overlying strata. In other words, with the advancement of mining, the key stratum of the overlying strata is broken. To be specific, when the mining distance is 75 cm, the key stratum is broken, resulting in rapid settlement. Since then, the settlement sequence has made it difficult to meet the level ratio requirements of the grey theory data sequence, and the accuracy has begun to decline. The prediction model is also affected by the selection of sequence. In other words, the data sequence of GM (1, 1) is lengthy, which affects the accuracy of model prediction. The metabolic model supplements the latest prediction data of the water-conducting fracture zone to the sequence in time, thus improving the prediction accuracy of the model. In the aspect of settlement prediction when the settlement of the water-flowing fractured zone is abrupt, further research is carried out from the model of grey theory.

5. Conclusions

The study has achieved the following conclusions.
(1)
The subsidence prediction model of the water-conducting fracture zone is established by combining the equidistant sampling data of mining overburden strata of Brillouin optical time domain technology with the GM (1, 1) model. Six kinds of subsidence prediction schemes of mining overburden strata are designed by introducing a grey progressive model and metabolic model, and the subsidence of the water-conducting fracture zone of overburden strata in the mining process of coal seam working face is predicted.
(2)
For the metabolic model, the prediction model is related to the mutation of the settlement of the water-conducting fracture zone caused by the breaking of the key stratum of the overlying rock. As for predicting the settlement of the water-conducting fracture zone in the overlying strata of the Shendong Coal Mine, the optimal number of model training is 7 to 8, and the number of predictions is 5 to 6 times. In this case, the prediction accuracy can reach level 1.
(3)
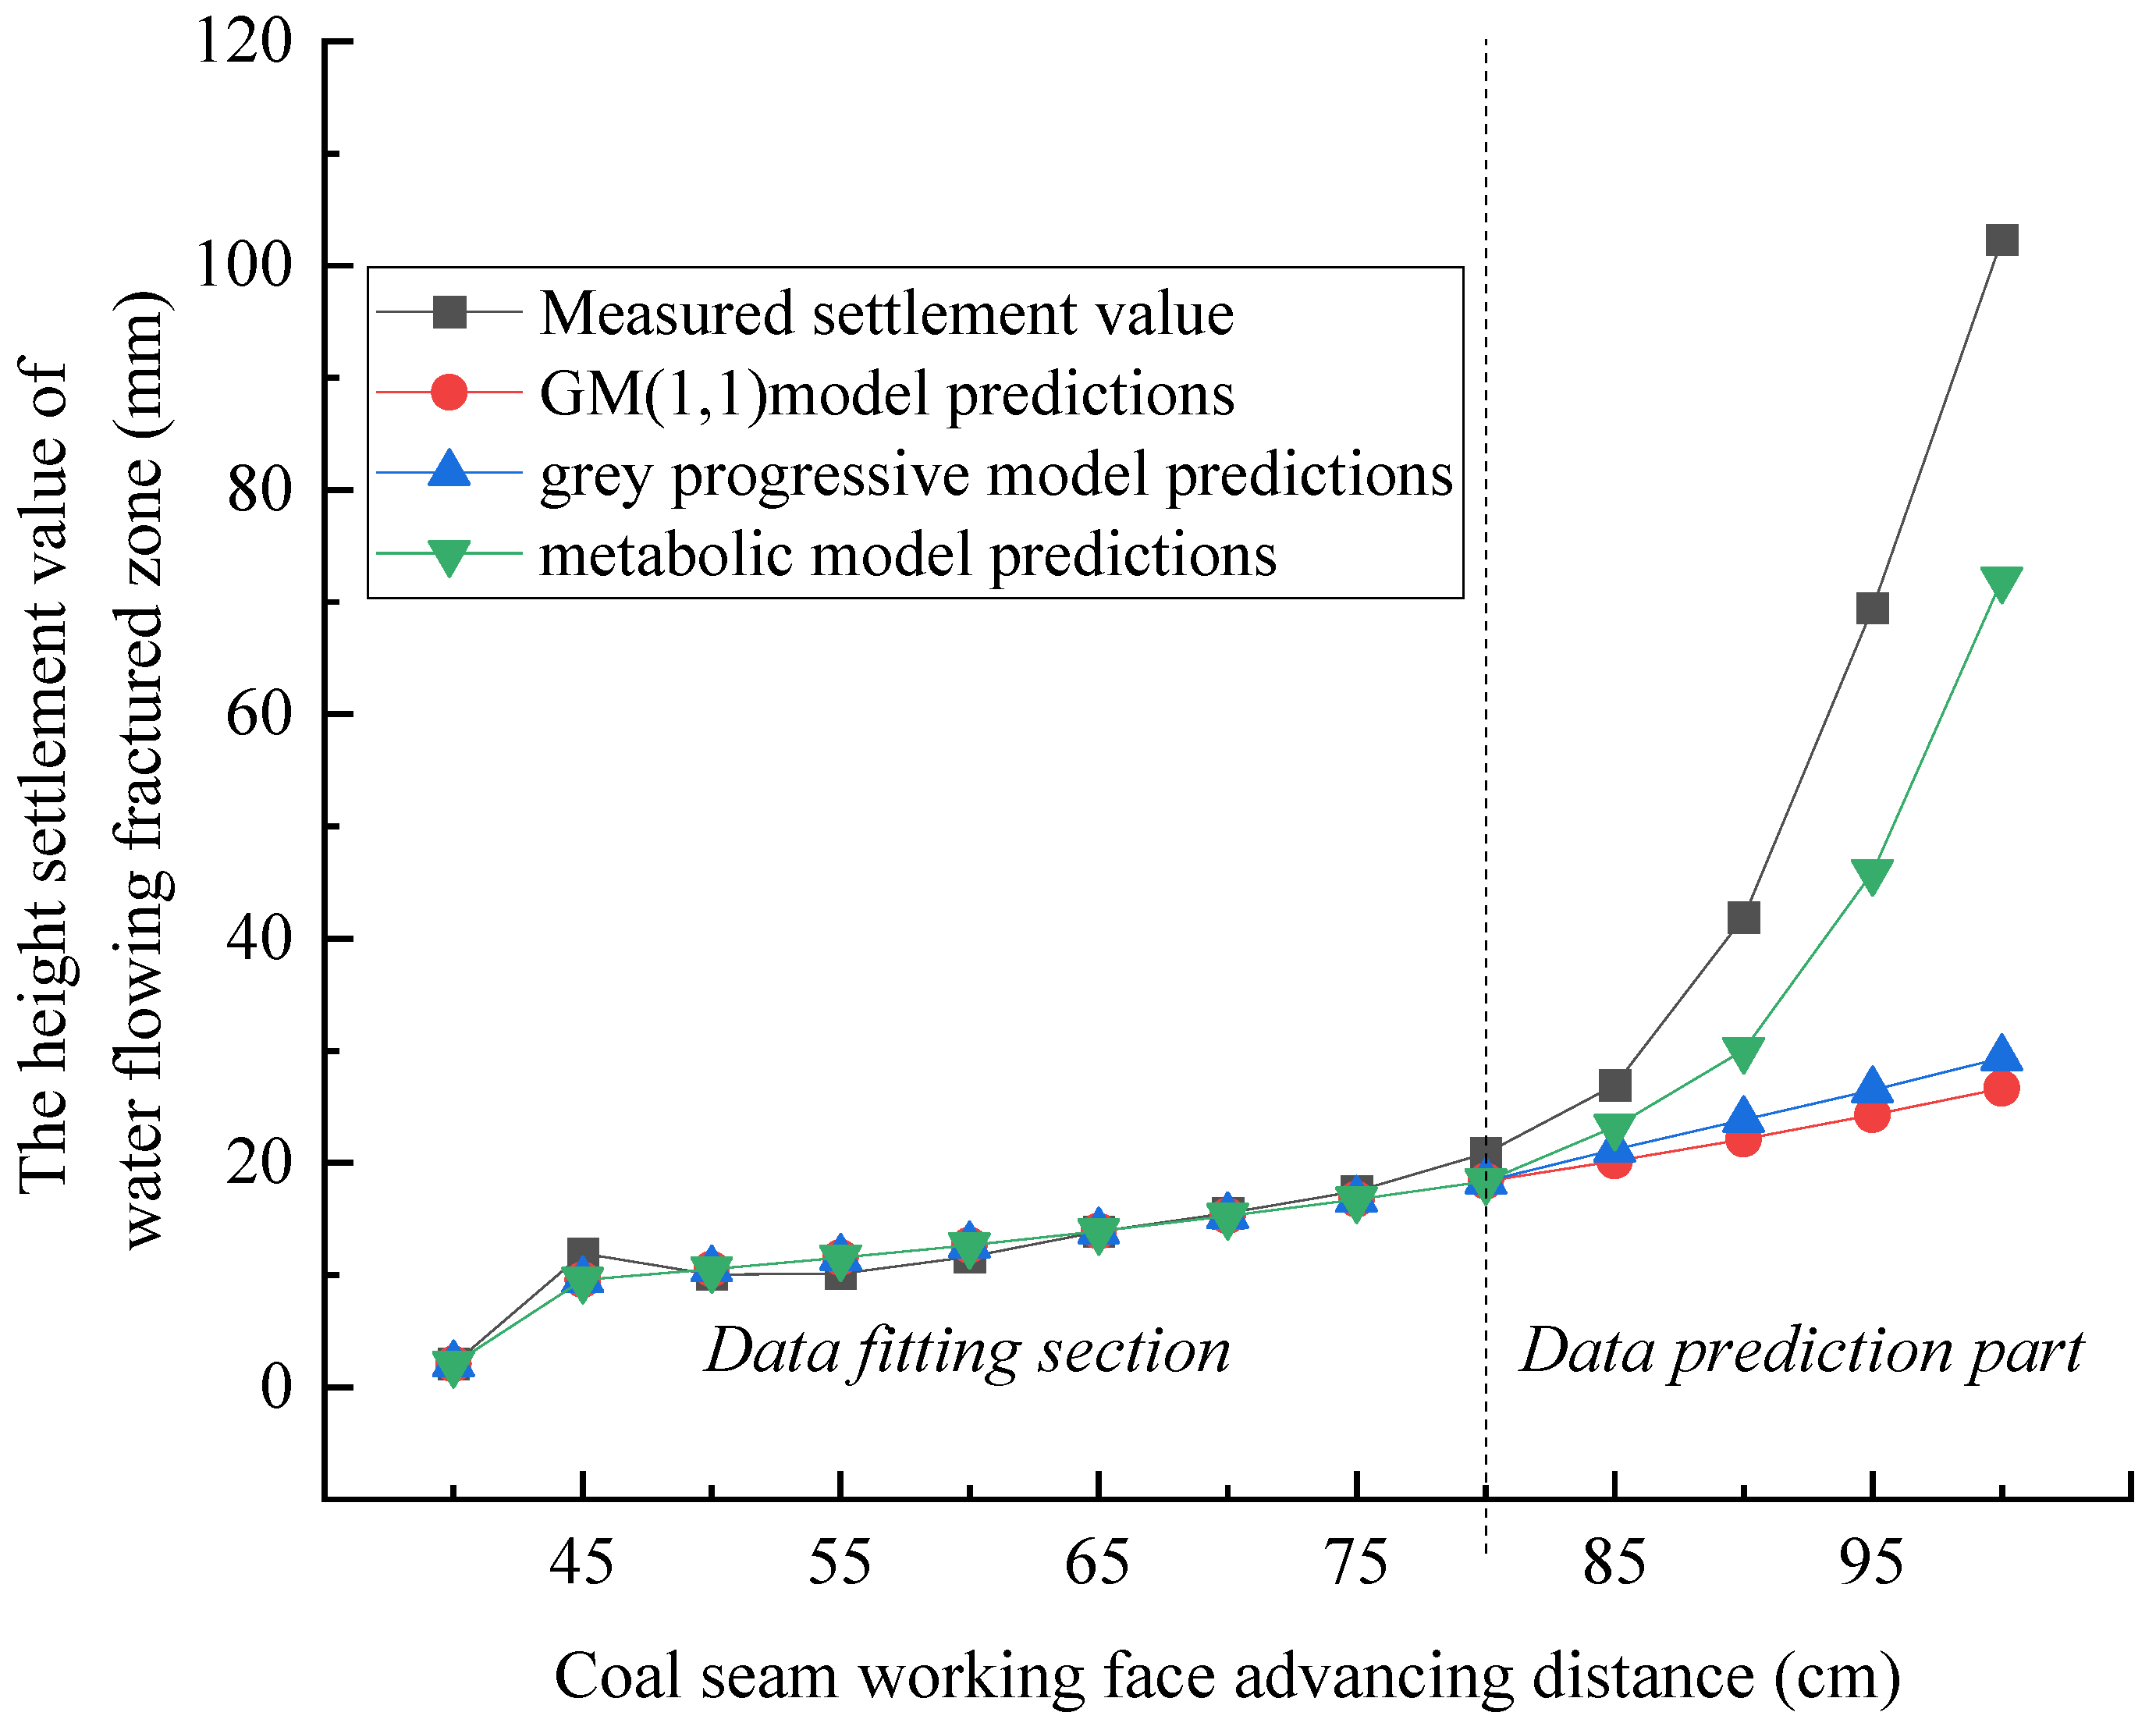
The prediction method of overlying strata settlement based on the GM (1, 1) model and grey progressive model is not suitable for the settlement prediction of the water-conducting fracture zone because the model data sequence is too long and the prediction accuracy in the middle and late stage of coal seam mining is gradually reduced.

Author Contributions

Conceptualization, C.P.; methodology, C.P. and Z.H.; software, Z.H.; validation, Z.H., C.P. and W.C.; investigation, J.L., Y.L.; resources, J.L.; data curation, C.P. and Z.H.; writing—original draft preparation, C.P. and Z.H.; writing—review and editing, Z.H., W.C. and C.P.; supervision, C.P.; project administration, C.P.; funding acquisition, J.L. All authors have read and agreed to the published version of the manuscript.

Funding

The work is funded by supported by the National Natural Science Foundation of China (Grant No. 42130706).

Data Availability Statement

The data used to support the findings of this study are available from the corresponding author upon request. I would like to declare on behalf of my co-authors that the work described was original research that has not been published previously and not under consideration for publication elsewhere, in whole or in part.

Acknowledgments

All individuals agreed to acknowledgements.

Conflicts of Interest

The authors declare no conflict of interest. Author Jinjun Li was employed by the company Shenhua Geological & Exploration Company Ltd. The remaining authors declare that the research was conducted in the absence of any commercial or financial relationships that could be construed as a potential conflict of interest.

References

  1. Adhikary, D.P.; Guo, H. Measurement of Longwall Mining Induced Strata Permeability. Geotech. Geol. Eng. 2014, 32, 617–626. [Google Scholar] [CrossRef]
  2. Teng, Y.H.; Yi, S.H.; Zhu, W.; Jing, S. Development Patterns of Fractured Water-Conducting Zones under Fully Mechanized Mining in Wet-Collapsible Loess Area. Water 2023, 15, 22. [Google Scholar] [CrossRef]
  3. Wu, X.; Jiang, X.W.; Chen, Y.F.; Wang, X.L.; Tan, S.H. Numerical modelling of fractures induced by coal mining beneath reservoirs and aquifers in china. Q. J. Eng. Geol. Hydrogeol. 2013, 46, 237–244. [Google Scholar] [CrossRef]
  4. Cheng, G.W.; Ma, T.H.; Tang, C.A.; Liu, H.; Wang, S. A zoning model for coal mining-induced strata movement based on microseismic monitoring. Int. J. Rock Mech. Min. Sci. 2017, 94, 123–138. [Google Scholar] [CrossRef]
  5. Zheng, D.Q.; Wang, K.Y.; Yang, Z.Q.; Zhao, W.Q.; Wang, Y. Height development law of water-conducting fracture zone in super-thick coal seam under repeated mining. Contemp. Chem. Res. 2023, 11, 52–54. (In Chinese) [Google Scholar]
  6. Wang, Q.; Pan, R.; Jiang, B.; Li, S.C.; He, M.C.; Sun, H.B.; Wang, L.; Qin, Q.; Yu, H.C.; Luan, Y.C. Study on Failure Mechanism of Roadway with Soft Rock in Deep Coal Mine and Confined Concrete Support System. Eng. Fail. Anal. 2017, 81, 155–177. [Google Scholar] [CrossRef]
  7. Guo, X.M.; Liu, Y.F.; Gu, Z.X. Detection and calculation of water-conducting fracture zone height in coal seam mining in Binchang mining area. J. Min. Strat. Control Eng. 2023, 5, 91–100. (In Chinese) [Google Scholar]
  8. Lin, C.G.; Deng, J.; Wang, Q.Z.; Li, C.F.; Wang, J.W.; Huang, H.F.; Liu, Q. Study on the height of water flowing fractured zone in the second panel of Gaojiapu mine field. Coal Technol. 2023, 10, 1–5. (In Chinese) [Google Scholar]
  9. Li, C.; Gao, H.; Qiu, J.; Yang, Y.; Qu, X.; Wang, Y.; Bi, Z. Grey Model Optimized by Particle Swarm Optimization for Data Analysis and Application of Multi-Sensors. Sensors 2018, 18, 2503. [Google Scholar] [CrossRef]
  10. Jiao, A.R. Determination of height of water flowing fractured zone in 15,102 working face of Zhangshigou Coal Mine. Shanxi Metall. 2023, 46, 151–153. (In Chinese) [Google Scholar]
  11. Booth, C.J.; Greer, C.B. Application of MODFLOW using TMR and discrete-step modification of hydraulic properties to simulate the hydrogeologic impact of longwall mining subsidence on overlying shallow aquifers. In Proceedings of the 11th International Mine Water Association Congress—Mine Water—Managing the Challenges, Aachen, Germany, 4–11 September 2011; pp. 211–216. [Google Scholar]
  12. Xu, S.Y.; Zhang, Y.B.; Shi, H.; Wang, K.; Geng, Y.; Chen, J. Physical Simulation of Strata Failure and Its Impact on Overlying Unconsolidated Aquifer at Various Mining Depths. Water 2018, 10, 650. [Google Scholar] [CrossRef]
  13. Piao, C.D.; Li, J.J.; Wang, D.L.; Qiao, W. A DOFS-Based Approach to Calculate the Height of Water-Flowing Fractured Zone in Overlying Strata under Mining. Geofluids 2021, 2021, 8860600. [Google Scholar] [CrossRef]
  14. Zhou, Y.L.; Yang, X.; Xu, F.Q. Distributed optical fiber monitoring technology for height of water-conducting fracture zone in fully mechanized caving face. China Min. Ind. 2022, 31, 108–114. (In Chinese) [Google Scholar]
  15. Li, X.J.; Chi, M.B.; Wu, B.Y.; Jv, Z.Y. Study on the law of overburden fracture development between layers of underground reservoirs in coal mines based on distributed optical fiber monitoring. China Coal 2022, 48, 49–56. (In Chinese) [Google Scholar]
  16. Hou, G.Y.; Hu, Z.Y.; Li, Z.X.; Zhao, Q.R.; Feng, D.X.; Cheng, C.; Zhou, H. The application status and prospect of distributed optical fiber and fiber grating sensing technology in coal mine safety monitoring. Coal J. 2023, 48, 96–110. (In Chinese) [Google Scholar]
  17. Cheng, G.; Wang, Z.X.; Shi, B.; Zhu, W.; Li, T. Research on the construction of multi-field optical fiber neural perception and safety guarantee system for mining-induced overburden deformation. Coal Sci. Technol. 2023, 10, 5947. (In Chinese) [Google Scholar]
  18. Li, W.P.; Li, T.; Shang, R. Study on structural variation and permeability change of overlying strata in coal mining of large mining area in northern Shaanxi. J. Eng. Geol. 2012, 20, 294–299. (In Chinese) [Google Scholar]
  19. Deng, Z.; Ke, Y.H.; Gong, H.L.; Li, X.; Li, Z. Land subsidence prediction in Beijing based on PS-InSAR technique and improved Grey-Markov model. GIScience Remote Sens. 2017, 54, 797–818. [Google Scholar] [CrossRef]
  20. Wang, H.Z.; Zhang, D.S.; Wang, X.F.; Zhang, W. Visual Exploration of the Spatiotemporal Evolution Law of Overburden Failure and Mining-Induced Fractures: A Case Study of the Wangjialing Coal Mine in China. Minerals 2017, 7, 35. [Google Scholar] [CrossRef]
  21. Jiang, G.; Lin, L.; Liu, Z.D.; Wang, Z. Grey prediction model of slope deformation. Rock Soil Mech. 2000, 3, 53–55. [Google Scholar]
  22. Wang, Z.S.; Deng, K.Z. Discrete grey prediction model of residual settlement in old goaf. J. China Coal Soc. 2010, 35, 1084–1088. (In Chinese) [Google Scholar]
  23. Huang, R.; Fu, X.; Pu, Y. A Novel Fractional Accumulative Grey Model with GA-PSO Optimizer and Its Application. Sensors 2023, 23, 636. [Google Scholar] [CrossRef] [PubMed]
  24. Mi, J.W.; Fan, L.B.; Duan, X.C.; Qiu, Y.Y. Short-Term Power Load Forecasting Method Based on Improved Exponential Smoothing Grey Model. Math. Probl. Eng. 2018, 2018, 3894723. [Google Scholar] [CrossRef]
  25. Shi, B.; Gu, K.; Wei, G.Q.; Wu, J.H. Full-section distributed optical fiber monitoring technology for ground subsidence drilling. J. Eng. Geol. 2018, 26, 356–364. (In Chinese) [Google Scholar]
  26. Liu, S.P.; Shi, B.; Gu, K.; Zhang, C.C.; Yang, J.L.; Zhang, S.; Yang, P. Land subsidence monitoring in sinking coastal areas using distributed fiber optic sensing: A case study. Nat. Hazards 2020, 103, 3043–3061. [Google Scholar] [CrossRef]
  27. Cheng, G.; Wang, Z.X.; Shi, B. Research progress of DFOS in safety mining monitoring of mines. J. China Coal Soc. 2022, 47, 2923–2949. (In Chinese) [Google Scholar]
  28. Gilbert, P.; Konietzky, H.; Diering, M. Similarity considerations for mining induced subsidence prediction. Int. J. Rock Mech. Min. Sci. 2005, 42, 576–585. [Google Scholar]
  29. Mitri, H.S.; Severin, J. Physical modelling of rockbolting in coal mines: A review of current status and future needs. Int. J. Rock Mech. Min. Sci. 2014, 70, 318–328. [Google Scholar]
  30. Gharehdash, N.S.; Abd Aziz, S.M. Physical modeling for prediction of strata behavior during longwall mining under weak geological conditions. Geotech. Geol. Eng. 2014, 32, 333–344. [Google Scholar]
  31. Liu, Y.Y.; Song, X.M.; Wang, Z.L. Calculation of periodic breaking step distance of thick and hard rock strata and analysis of influencing factors. Coal Eng. 2020, 52, 106–111. (In Chinese) [Google Scholar]
  32. Sun, Q.X.; Chen, Q.T.; Li, H.J.; Mou, Y. Study on the mechanism of the advance effect of key stratum breaking on surface movement and deformation. Coal Eng. 2023, 55, 105–109. (In Chinese) [Google Scholar]
Figure 1. Grey prediction model program of mining overburden subsidence.
Water 15 04177 g001
Figure 2. Experimental model and sensing fiber layout.
Water 15 04177 g002
Figure 3. Mining overburden deformation distribution map.
Water 15 04177 g003
Figure 4. Comparison chart of subsidence prediction results of water-conducting fracture zone.
Water 15 04177 g004
Figure 5. Posterior error test of prediction model.
Water 15 04177 g005
Figure 6. Grey correlation degree of prediction model.
Water 15 04177 g006
Table 1. Accuracy grades of grey theory model.
Accuracy GradeMean Square Deviation RatioProbability of Small ErrorCorrelation Degree
Grade 1 (good)C ≤ 0.35p ≥ 0.95r ≥ 0.9
Grade 2 (qualified)0.35 < C ≤ 0.50.8 ≤ p < 0.95r ≥ 0.8
Grade 3 (barely)0.5 < C ≤ 0.650.7 ≤ p < 0.8r ≥ 0.7
Grade 4 (unqualified)C > 0.65p < 0.7r ≥ 0.6
Table 2. Mechanical parameters of prototype and model of Daliuta Coal Mine.
LithologyPrototypeModel
Thickness
(m)
Volume Weight
(kN/m3)
Compressive Strength
(MPa)
Thickness
(cm)
Volume Weight
(kN/m3)
Compressive Strength
(kPa)
Proportion Number
Loose layer40170.74011.34.6711:1:0
Sandy mudstone624.117.2616.1114.78:6:4
Fine sandstone52836.5518.7243.33:5:5
Sandy mudstone724.117.2716.1114.78:6:4
Mudstone924.315.3916.210210:5:5
Fine sandstone13.52836.513.518.7243.33:5:5
Sandy mudstone624.117.2616.1114.78:6:4
2−2 coal4.213154.28.71006:5:5
Sandy mudstone624.117.2616.1114.78:6:4
2−3 coal4.213154.28.71006:5:5
Sandy mudstone524.117.2516.1114.78:6:4
The notation:”8:6:4” in Table 2 refers to the ratio of aggregate (river sand) to binder (lime and gypsum), where the proportion of aggregate to the combined amount of lime and gypsum is 8:1, and the ratio between lime and gypsum is 6:4.
Table 3. Comparison of prediction results of stratum subsidence in the range of water conducting.
Advancing DistanceMeasured Displacement Values Based on Photogrammetry (mm)GM(1,1) ModelGrey Progressive ModelMetabolic Model
Predicted Value (mm)Residual Error (mm)Relative Residual (%)Predicted Value (mm)Residual Error (mm)Relative Residual (%)Predicted Value (mm)Residual Error (mm)Relative Residual (%)
8020.8818.37−2.5011.9918.37−2.5011.9918.37−2.511.99
8526.9420.16−6.7725.1521.18−5.7621.3823.22−3.7113.78
9041.8922.12−19.7647.1823.85−18.0443.0630.04−11.8528.29
9569.4724.28−45.1965.0426.50−42.9761.8545.91−23.5633.91
100102.3126.65−75.6673.9529.35−72.9671.3172−30.329.62
Table 4. Relationship between training set, prediction set, and working face advancing range.
Quantity of Training Sets (Number)Working Face Advancing Range (cm)Quantity of Prediction Sets
(Number)
Representation Methods
540~608(5, 8)
640~657(6, 7)
740~706(7, 6)
840~755(8, 5)
940~804(9, 4)
1040~853(10, 3)
Table 5. Evaluation of prediction accuracy of GM (1, 1) model.
Number of Training SetsNumber of PredictionsMean Square Deviation RatioProbability of Small ErrorGrey Correlation DegreeAccuracy Grade
580.990.460.68Level 4 (unqualified)
670.90.620.74Level 4 (unqualified)
760.850.770.78Level 4 (unqualified)
850.810.850.80Level 4 (unqualified)
940.770.850.82Level 4 (unqualified)
Table 6. Evaluation of prediction accuracy of metabolic model.
Number of Training SetsNumber of PredictionsMean Square Deviation RatioProbability of Small ErrorGrey Correlation DegreeAccuracy Grade
580.171.000.94Level 1 (excellent)
670.221.000.92Level 1 (excellent)
760.281.000.91Level 1 (excellent)
850.360.920.90Level 2 (good)
940.430.920.89Level 2 (good)
1030.520.920.88Level 3 (qualified)
Disclaimer/Publisher’s Note: The statements, opinions and data contained in all publications are solely those of the individual author(s) and contributor(s) and not of MDPI and/or the editor(s). MDPI and/or the editor(s) disclaim responsibility for any injury to people or property resulting from any ideas, methods, instructions or products referred to in the content.

