Article

Water Consumption Structure and Root Water Absorption Source of an Oasis Cotton Field in an Arid Area of China

1
Center for Agricultural Resources Research, Institute of Genetics and Developmental Biology, Chinese Academy of Sciences, Shijiazhuang 050021, China
2
Key Laboratory of Agricultural Water Resources, Hebei Laboratory of Water-Saving Agriculture, Chinese Academy of Sciences, Shijiazhuang 050021, China
3
College of Advanced Agricultural Sciences, University of Chinese Academy of Sciences, Beijing 100049, China
4
State Key Laboratory of Desert and Oasis Ecology, Xinjiang Institute of Ecology and Geography, Chinese Academy of Sciences, Aksu 830011, China
*
Author to whom correspondence should be addressed.
Water 2023, 15(23), 4140; https://doi.org/10.3390/w15234140
Submission received: 29 September 2023 / Revised: 5 November 2023 / Accepted: 16 November 2023 / Published: 29 November 2023
(This article belongs to the Special Issue Water Management in Arid and Semi-arid Regions)

Abstract

:
This research, conducted at the National Field Science Observation and Research Station of the Aksu Farmland Ecosystem in Xinjiang, was performed to partition evapotranspiration components, identify the main water absorption depth, and quantify the contribution of soil water at different depths during different growing stages of cotton by combining hydrogen and oxygen stable isotopes and the MixSIAR model. The results indicated that evapotranspiration in the seeding stage, bud stage, flowering and boll stage, boll opening stage, and harvesting stage were 88 mm, 137 mm, 542 mm, 214 mm, and 118 mm, respectively, and the corresponding transpiration accounted for 51%, 82%, 88%, 85%, and 72% of evapotranspiration. With the development of cotton roots, the water absorption depth gradually increased, and the main absorption depths in the late bud stage, mid flowering and boll stage, late flowering and boll stage, boll opening stage, and harvesting stage were 0–20 cm, 40–60 cm, 60–80 cm, 80–100 cm, and 0–20 cm, respectively, with corresponding contributions of 35.4%, 40.9%, 27.7%, 29.9%, and 22.5%. Our results can provide a theoretical foundation for the accurate irrigation management of cotton fields.

1. Introduction

Xinjiang is the main cotton-producing area in China, and cotton has become an indispensable part of Xinjiang’s economy. However, Xinjiang is located in an arid region, where there is little rain and high evaporation, making water a major constraint on crop growth [1]. Investigating the water consumption patterns of cotton cultivated in arid areas and calculating its root water absorption sources are critical for guiding the scientific irrigation of agriculture in this region, achieving agricultural water savings, and ensuring stable and high crop yields.
Evapotranspiration is the main component of water consumption in agricultural areas and connects energy and water balance. In arid regions, 90% of precipitation returns to the atmosphere through evapotranspiration [2]. Therefore, the accurate measurement of evapotranspiration is of great significance for studies on heat allocation and water cycling in soil-plant-atmosphere-continuum (SPAC) systems. Many studies have been conducted on the evapotranspiration of farmland in Xinjiang, while quantitative research on partitioning water consumption to transpiration and evaporation is still lacking. The complex impact factors of transpiration and evaporation make it difficult to accurately separate the two components of evapotranspiration; however, the isotope mass conservation method provides a promising approach for this purpose. For example, Liebhard et al. [3] quantified the evaporation and transpiration rates of soybean using water stable isotopes and lysimeter measurements under natural conditions. Wu et al. [4] quantitatively estimated the ratio of evaporation to evapotranspiration for maize under plastic film mulching to be approximately 21.2% using isotopic methods. Guo [5] combined water balance and isotope mass conservation to partition the evapotranspiration of corn in an oasis, and found that the proportion of transpiration to evapotranspiration for corn after flood irrigation was 87.3%. These studies have suggested that stable hydrogen and oxygen isotope technology is a viable tool for studying the structures of water consumption. Compared with traditional hydrologic research methods, such as water balance, aerodynamics, and model estimation, the advantages of the stable isotope method are mainly reflected in its fine precision and controllability. Using the stable hydrogen and oxygen isotope method to estimate and distinguish evapotranspiration is an important research direction [6].
The water absorption of plant roots is a key process in the water cycling of the SPAC system, as it reflects the extent of water absorption and utilization by crops and its effect on soil moisture. Traditional methods for plant water sources involve direct methods such as digging roots [7], which has implications for water cycling research related to SPACs [8]. However, studies have demonstrated that the distribution of plant roots and the area where they absorb water do not always align, i.e., the root systems in a certain layer do not necessarily correlate with the amount of water absorbed by the roots in the same proportion [9]. The excavation method is immensely destructive and damaging to the plant’s growth and its surrounding environment. Hydrogen and oxygen isotopes provide a simple and effective way to investigate the water uptake of plant roots. According to Zimmermann (1967), there is no stable hydrogen and oxygen isotope fractionation when plant roots absorb water from soil [10], which implies that the water absorbed by roots is a combination of several water sources. By comparing the hydrogen and oxygen isotope composition of xylem water and possible source water, we can determine the source of water used by plants [11]. Fischer [12] demonstrated that no fractionation of hydrogen and oxygen isotopes occurred during the transfer of water from the roots to the stems of plants. Zhang et al. [13] also showed that except for a few halophytes, there is no fractionation of hydrogen and oxygen isotopes before transpiration through leaves. These findings provide a solid theoretical basis for the quantitative analysis of water uptake by plant roots.
Recently, the methods for determining the sources and proportions of water in plants include the direct comparison method, binary/ternary linear mixing model, multiple linear mixing model (IsoSource, Version 1.3) [14], and Bayesian mixture model (MixSIR; SIAR, Version 4.2; MixSIAR, Version 3.1.12) [15,16,17]. Nevertheless, the results of these methods for quantitatively distinguishing plant water sources and proportions are still controversial. The direct comparison method can qualitatively determine the main water absorption level of crop roots; however, when there are multiple points of intersection, it becomes challenging to pinpoint a particular water absorption level. Multivariate linear mixing models can provide a proportion of multiple potential sources of water, yet they do not take into account the complexity of potential sources of water or random errors [18]. The MixSIAR model combines the following two characteristics: first, it includes the uncertainty of different water sources; and second, it includes isotopic characteristics and isotopic fractionation, which allows the input data to be the average of the measured δD and δ18O of each water source and the standard deviation of the isotope values of each water source, rather than a single average value of all source isotope data [19]. Zhang et al. [20] reported that Bayesian mixture models are reliable in distinguishing plant water sources. Therefore, D and 18O isotopes and the MixSIAR model can be applied to quantitatively identify the sources of water absorption of cotton at different growth stages to compensate for the current understanding of the cotton water absorption process in arid areas.
Although the use of isotopes to study plant water sources has been developed for many years, the quantitative identification of plants’ utilization of each potential water source through the MixSIAR model has only been applied to farmland ecosystems in recent years, and has rarely been applied to scientific guidance for cotton irrigation and other studies in arid areas. In this study, combining the Bowen ratio-energy balance and a soil microlysimeter, the components of evapotranspiration and water consumption of a cotton field were determined. We also quantified the water use sources of cotton at different growth stages by combining the hydrogen and oxygen stable isotope method with the MixSIAR model. The results will provide a theoretical foundation for the scientific irrigation of cotton fields in arid areas, thereby promoting the sustainable utilization of oasis agriculture and watershed water resources.

2. Materials and Methods

2.1. Study Area

The experiment was conducted in 2016 at the National Field Scientific Observation and Research Station of Aksu Agricultural Ecosystem in Xinjiang, which is located in Alar City, Xinjiang, 1100 km away from Urumqi and 80 km away from Aksu City. It is a typical warm and arid region in the hinterland of Asia and Europe. The station is located in a desert oasis plain (80°52′ E, 40°38′ N, altitude 1024 m) near the confluence of the three major tributaries of the Tarim River, namely, the Aksu River, the Yeerqiang River, and the Hotan River. This area is characterized by a typical extreme arid climate. Compared with the same latitude region, it has higher temperature in summer and lower temperature in winter, less rainfall, high evaporation, a dry climate, and abundant solar and thermal resources. The average temperature (T) over a long period of time is 11.3 °C, with an average annual precipitation of 46 mm, 2950 h of sunshine, and total annual solar radiation of 6000 MJ/m2. It has a frost-free period of 207 days, and its solar and thermal resources are abundant, with annual evaporation of 2111 mm (Table 1). The type of soil is sulfated tidal soil, with a bulk density of 1.43–1.53 g/cm3, field capacity of 28–32%, and saturated water content of 43–50% (Table 1). This region is an important cotton-producing area in China, where cotton is the main agricultural product and irrigation is the main method of cultivation. The irrigation amounts (dates) are 200 mm (7 July 2016), 200 mm (25 July 2016), 280 mm (20 August 2016), and 300 mm (30 August 2016).
In 2016, the mean temperature at Aksu Station was 12.29 °C, with the maximum temperature recorded in July and the minimum temperature in January (Figure 1). The average daily relative air humidity was 51%, with a peak of 85% after precipitation events. The annual precipitation was 42.4 mm, with 86% of precipitation occurring from May to September, and the largest rainfall event occurred on September 10th, with a record of 5.2 mm. The snowfall in winter made up 14% of the annual precipitation. The wind speed was low in winter and high in summer. The seasonal patterns of wind speed and temperature significantly influence the seasonal changes in evaporation. The annual evaporation, measured using a 20 cm evaporating dish, was 1498 mm, with a daily average of 4 mm. Evaporation in the summer months accounted for 44% of the annual evaporation, and the maximum daily evaporation occurred in July, which was 14 mm (Figure 1). Additionally, the growth of oasis cotton fields was classified into five stages (Table 2).

2.2. Determination of Evapotranspiration and Soil Evaporation

Soil evaporation was measured using a microlysimeter constructed of PVC tubing, with an inner diameter of 10 cm, a wall thickness of 5 mm, and a height of 15 cm. A PVC pipe with an inner diameter of 12 cm was placed on the outside and fixed between the crop rows to ensure that the soil structure in the vicinity was not disturbed during the experiment. The soil was compressed into a lysimeter and the bottom sealed with plastic tape for weighing. An electronic balance (0.001 kg) was used to weigh the lysimeter daily, and the difference between two adjacent days was the daily evaporation (1 g being equivalent to 0.127 mm of evaporation) [21]. Generally, the inner soil of the microlysimeter had to be changed every 3–5 days to uphold its field-like condition, and the soil was immediately replaced after rain or irrigation events.
The Bowen ratio-energy balance method is used to calculate the evapotranspiration of farmland [22]:
LE = (Rn − G)/(1 + γ⋅ΔT/Δe)
ET = LE/λ
where LE is the latent heat flux, W/m2; Rn is the net radiation, W/m2; G is the soil heat flux, W/m2; λ is the coefficient of latent heat of vaporization, J/g; γ is the psychrometric constant, Pa/°C; and ΔT and Δe represent the temperature gradient, °C, and the water vapor pressure gradient, Pa, ET is the evapotranspiration, mm.

2.3. Sample Collection

Groundwater (irrigation water), soil, stems, leaves, and rainwater were collected for stable isotope analysis. The fresh samples were kept in a 5 mL glass bottle and stored in a refrigerator at 4 °C to avoid evaporation or freezing. A total of 166 samples were taken during the cotton growth period, which included one groundwater sample, 122 soil samples from different depths, 22 stem samples, 22 leaf samples, and one rainwater sample.
  • Groundwater (irrigation water) sample collection: The hydrogen and oxygen isotopic composition in groundwater is generally stable, so it was sampled once each growth cycle.
  • Soil water sample collection: We selected three sampling points on the farmland and used soil drills to collect soil samples, with depths in the ranges of 0–5 cm, 5–20 cm, 20–40 cm, 40–60 cm, 60–80 cm, 80–100 cm, and 100–120 cm. Then, the samples were placed in sealed bags and stored in a refrigerator at 4 °C. The sampling dates were 9 July, 22 July, 20 August, 30 August, and 15 October.
  • Plant sample collection: Three to five cotton plants were collected, separated into fresh stems (diameter 0.6–0.8 cm and length 3–5 cm, without outer skin and phloem) and leaves, quickly sealed in a 10 mL glass bottle, and frozen. The collection times of the plant and soil samples were synchronous.
  • Rain sample: A self-constructed precipitation sampler was used to collect rainfall. The rain accumulated in a triangular container through a glass funnel connected with a rubber stopper. A table tennis ball was situated on the funnel entrance to stop the water sample from evaporating in the bottle. The apparatus was placed in the area prior to rainfall and promptly collected after rainfall to minimize the effect of water vaporization.

2.4. Sample Determination

Low-temperature vacuum extraction was used to obtain water from the stems and leaves of cotton and soil, and the stable hydrogen and oxygen isotope ratios of the various water bodies were measured using an LGR liquid water isotope analyzer (Model DLT-100, Los Gatos Research, San Jose, CA, USA) [23]:
δ‰ = (Rsample − Rstandard)/Rstandard × 1000
where Rsample is the ratio of the heavy isotope of hydrogen (oxygen) to the abundance of light isotopes in the collected sample, and Rstandard is the ratio of the abundance of heavy isotopes of hydrogen (oxygen) to light isotopes in Vienna Standard Mean Ocean Water. The uncertainties of δD and δ18O measurements are ±1‰ and ±0.1‰, respectively.

2.5. Data Analysis

The direct comparison method can preliminarily determine the main water absorption depth of crop roots, that is, by comparing the δD and δ18O of stem water with those of soil water at different depths at the same time. The soil depth corresponding to the intersection of the isotope composition of stem water and the soil water is the main water absorption depth of the crop. However, the main water absorption depth can only be determined when a unique intersection point is present. When multiple intersections exist, it is difficult to pinpoint the main water absorption depth of crop roots using the direct comparison method.
We used the MixSIAR model to calculate the proportion of soil water at different depths used by plants. The input data of the MixSIAR model included the mean and standard deviation of δD and δ18O in the soil water in each layer and stem water. The Markov chain Monte Carlo step was set to “normal”, and the model error was set to “process only”. The estimated median contribution of each water source was considered to be the contribution of that water source to plant water.

3. Results

3.1. Changes in Evapotranspiration Structure at Different Growth Stages of Cotton

Combining the soil microlysimeter and Bowen ratio-energy balance methods, the evapotranspiration structure in cotton fields was quantified. During the seedling, bud, flowering and boll, boll opening, and harvesting stages, the evapotranspiration were 88 mm, 137 mm, 542 mm, 214 mm, and 118 mm, and the corresponding transpiration accounted for 51%, 82%, 88%, 85%, and 72% of evapotranspiration, respectively (Figure 2). At the seedling stage, mulching inhibits soil evaporation; thus, the transpiration amount is larger than that without mulching. As the leaf area increases, the amount of transpiration and the proportion of transpiration to evapotranspiration increase. When the bolls open, the leaves begin to senesce, the leaf area gradually decreases, and the amount of transpiration and the proportion of transpiration to evapotranspiration begins to decrease. As the harvest period approaches, the proportion of transpiration to evapotranspiration decreases to the lowest value throughout the growth cycle. Over the entire growth period, 84% of evapotranspiration is attributed to transpiration.

3.2. Isotopic Composition Characteristics of Precipitation, Soil Water, Stem Water, and Leaf Water

The ranges of δD and δ18O values in local atmospheric precipitation were −144.00‰ to −40.00‰ and −20.00‰ to −5.30‰, both of which were located in the global atmospheric precipitation range (δD: −190.00‰ to 20.00‰; δ18O: −24.00‰ to 2.00‰). The average values were −83.08‰ and −12.26‰, with standard deviations of 38.49‰ and 5.24‰, respectively (Figure 3). The local meteorological water line (LMWL) equation is δD = 7.06δ18O + 3.61 (R2 = 0.92). Compared with that of the global meteorological water line (GMWL: δD = 8.20δ18O + 10.00), the slope and intercept of the LMWL were lower, which implied that the local water vapor underwent significant evaporation and had a drier climate than the global average climate. Compared with that of precipitation, the isotopic composition of groundwater at the study site was relatively stable, mainly falling on the LMWL, indicating that rainwater is an important source of groundwater recharge.
The δD and δ18O of soil water were distributed on the right side of the local meteoric water line (Figure 3), and the equation of the soil water line (SWL) was δD = 5.01δ18O − 23.92 (R2 = 0.91), and its slope and intercept were smaller than those of the LMWL, which indicated that soil water experienced strong evaporation during the infiltration of precipitation or irrigation water. Moreover, almost all the soil water isotope composition values were on the right side of the LMWL, suggesting that the precipitation or irrigation water was enriched by evaporation after being absorbed by the soil. The equation of the plant stem water line was δD = 5.64δ18O − 54.37 (R2 = 0.96), most of which overlapped with the distribution interval of the soil water isotope, indicating that soil water was the main water source of cotton. Comparing the hydrogen and oxygen stable isotope characteristic lines of plant stem water, leaf water, and soil water (Figure 3), the slope of the stem water characteristic line was relatively larger than that of the soil water and leaf water characteristic lines, which indicated significant evaporation. The absence of isotopic fractionation when cotton roots absorb soil water showed that surface soil water evaporated significantly, and there was no substantial direct exchange of water vapor from the leaves to the external environment.

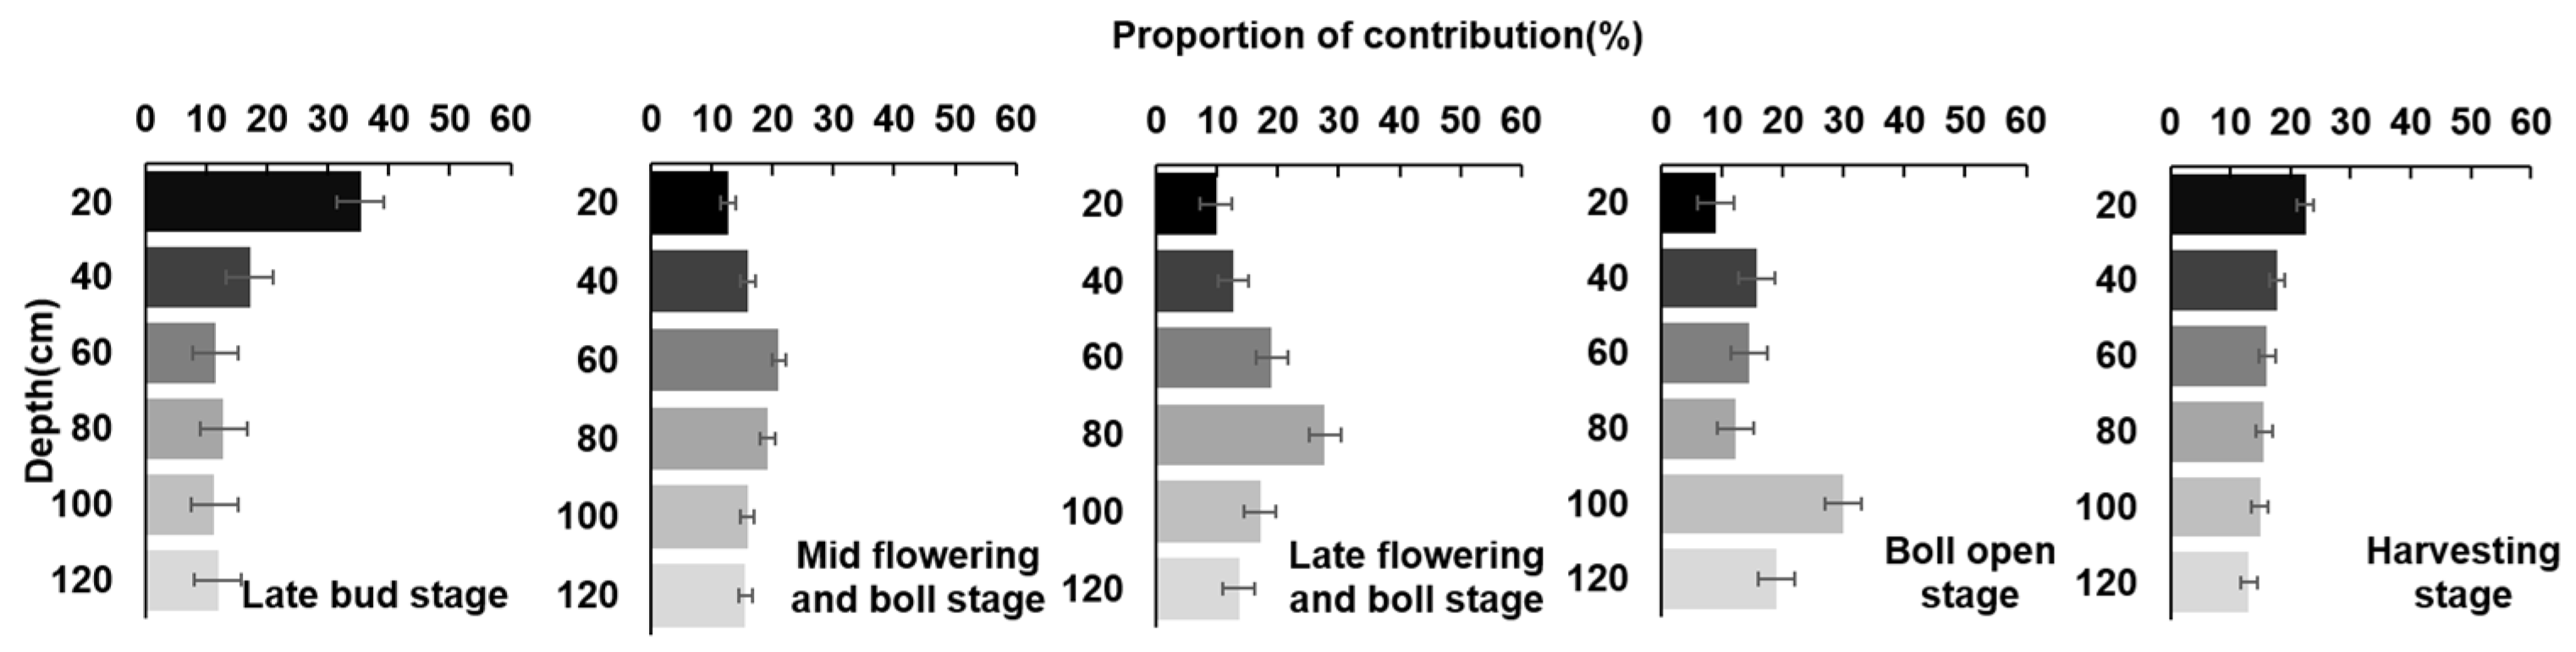
3.3. Water Absorption Depth of the Root System at Different Growth Stages

The stable hydrogen and oxygen isotopes of soil water showed obvious vertical and seasonal changes (Figure 4). The δD and δ18O of soil water decreased with increasing soil depth because the high evaporation rate at the surface led to the fractionation of hydrogen and oxygen isotopes. The δD and δ18O values of stem water at the end of the cotton bud stage (9 July 2016) and the middle of the flowering and boll stage (22 July 2016) had only one intersection point with soil water in the soil layer, and the determined depth of the intersection point was consistent. The δD and δ18O values of stem water and soil water intersections in the two growth stages were 20–40 cm and 80–100 cm, respectively, indicating that the depth of soil water mainly absorbed in the 20–40 cm soil layer at the end of the cotton bud stage moved down to 80–100 cm at the middle of the flowering and boll stage. The δD and δ18O values of stem water during the boll opening stage (30 August 2016) were consistent with the depth determined at the intersection of soil water in the soil layer, but there were two intersection points. In this period, the root system began to decline, and the water absorption ability of cotton decreased significantly. There were two intersections between the δD and δ18O values of the stem water and the soil water in the soil layer at approximately 20–40 cm and 60–80 cm, and the main water absorption depth could not be determined. The δD and δ18O values of cotton stem water at the end of the flowering and boll stage (20 August 2016) and harvesting stage (15 October 2016) were not consistent with the depth determined by the soil–water intersection in the soil layer. At the end of the cotton flowering and boll period, the stem water δ18O had two intersections with the soil water of the 80–100 cm and 100–120 cm soil layers, while the δD had one intersection point with the soil water of the 20–40 cm soil layer, which made it difficult to determine the main depth of water absorption. During the harvesting stage (15 October 2016), the main water absorption depth of the root moved upward, but there was an intersection point between the δ18O of stem water and the soil water of the 0–20 cm soil layer. The δD had two intersections with the soil water of the soil layer near 40 cm and 60 cm, and the main water absorption depth could not be determined.

3.4. Quantitative Analysis of Water Sources Based on the MixSIAR Model

We used the MixSIAR model to further quantify the contribution of soil water at different depths to cotton roots at each growth stage. During the key growing seasons, the water absorption depth of cotton roots migrated downward. The main water absorption depths and the corresponding proportions of contribution at the late bud stage, mid flowering and boll stage, late flowering and boll stage, boll opening stage, and harvesting stage were 0–20 cm (35.4%), 40–60 cm (40.9%), 60–80 cm (27.7%), 80–100 cm (29.9%), and 0–20 cm (22.5%), respectively. In the late bud stage, the contributions of soil water in the 0–20 cm, 20–40 cm, 40–60 cm, 60–80 cm, 80–100 cm, and 100–120 cm soil layers to cotton roots were 35.4%, 17.1%, 11.5%, 12.8%, 11.3%, and 11.9%, respectively, which are similar to the result from the direct method, suggesting that during the early growth stage, cotton roots are mainly distributed in shallow soil, thus absorbing surface soil water. At the flowering and boll stage, cotton mainly absorbed soil water from 40–80 cm, which indicates that the roots grow rapidly downward and can absorb the soil water at deeper layers. The contribution ratio of deep soil water to plant water was the largest in the boll opening stage, i.e., the contribution ratio of 80–120 cm soil water was 48.9%, because shallow roots senesced and deep roots increased. As the roots senesced, the water absorption level of the roots moved upward, and 22.5% of the water was provided by the 0–20 cm soil layer in the later stage of maturity (Figure 5).

4. Discussion

Throughout the growing season of cotton, the proportion of transpiration is always greater than that of evaporation. The proportion of transpiration to evapotranspiration first increased at the early growth stage, and then, peaked in the flowering and boll stages, and finally, declined slowly in the late growth stage. Based on the water–carbon flux coupling method to distribute cotton evapotranspiration, Liu et al. [24] also found similar seasonal characteristics of transpiration and evapotranspiration in a cotton field in arid areas. The decrease in the percentage of transpiration from the boll opening period to the end of the growth period may be because there is less dry matter accumulation at the seedling stage of cotton, cotton requires less water, and transpiration is low. In addition, the leaf area index is relatively low during this period, resulting in most of the bare soil being directly exposed to sunlight and an increase in the proportion of soil evaporation. Zhang et al. [25] also showed that bare land evaporation was higher than crop-covered soil evaporation in the North China Plain using stable isotope research results, which is in accordance with the research results of this study. Mulching in the early stage of planting can effectively reduce ineffective soil evaporation and increase water reserves. Studies have shown that film drip irrigation technology in cotton fields in Xinjiang can promote crop biomass accumulation and increase crop yield [26]. At the same time, Ge et al. [27] also showed that the surface soil water content of mulched film increased by 20.5% compared with that of non-mulched film, and the increase in soil water content was conducive to the emergence and early growth of cotton. In the flowering and boll stage of cotton, the proportion of transpiration to evapotranspiration could reach 88%. This is because the good environment and moisture conditions at the early growth stage of cotton, as well as the high temperature and radiation in this stage, enhanced photosynthesis, transpiration and leaf area; simultaneously, cotton leaves shaded the soil and decreased the relative proportion of soil evaporation, although soil evaporation reached a peak due to high temperature and radiation. In the later stage, with the decreases in temperature and radiation, leaf senescence led to a continuous decline in the transpiration of cotton, and soil evaporation was weakened. Under water-scarce conditions, the main ways to improve the water use efficiency of crops are as follows [28]: (1) reduce water consumption; (2) expose crops to more water; and (3) improve the drought resistance ability of different crop varieties. However, for arid oasis farmland, optimizing the structure of water consumption to redistribute evapotranspiration will be an effective approach for improving water use efficiency.
A large number of studies have shown that stable hydrogen and oxygen isotopes do not fractionate during water absorption by plant roots, and the isotopic composition of xylem water can be regarded as a mixture of isotopic values in water from various sources [29,30]. The water absorption depth, determined via the direct comparison method, was generally consistent with that determined by the MixSIAR model. However, the direct comparison method can only judge the approximate source of plant water and ignores the influence of multiple water source combinations on plant water utilization. The MixSIAR model combines the advantages of the MixSIR and SIAR models and includes the uncertainty in source values, classification, and continuous covariates (random, fixed, classified, and nested effects) and prior information; therefore, the results will be more accurate [31]. In this study, based on the MixSIAR model, we found that the main water absorption depths at the late bud stage, mid flowering and boll stage, late flowering and boll stage, and boll opening stage of cotton were 0–20 cm, 40–80 cm, and 80–100 cm, respectively. Because cotton is a taproot crop, the roots continue to grow downward as the growth cycle progresses, and the absorption of deep soil water increases. Zhang et al. [32] found that the root density of cotton in the early flowering stage was the highest in the range of 0–30 cm, and in the flowering and boll stage, the root density was mainly 40–60 cm. After the boll opening stage, the shallow root density gradually decreased, while the deep root density increased in the range of 70–100 cm. In this study, the main water absorption depths were 0–20 cm and 40–80 cm in the bud stage and flowering and boll stage of cotton, which were similar to the results reported by Wang et al. [33] (0–30 cm, 50–90 cm), Li et al. [30] (0–30 cm, 30–60 cm), and Guo et al. [29] (0–20 cm, 20–40 cm). In the late growth stages, the increase in irrigation amount and irrigation frequency increased the shallow soil water content, and a large number of cotton roots tended to gather toward the surface, which was slightly different from the observations of other studies. Therefore, the irrigation amount should be reduced to expand the distribution of cotton roots, so as to improve the scope and efficiency of water use.

5. Conclusions

(1)
The LMWL equation was δD = 7.06δ18O + 3.61, with a smaller slope and intercept than that of the GMWL, which implies an arid climate and strong evaporation in the study area. The SWL equation was δD = 5.01δ18O − 23.92, and the slope and intercept were smaller than those of the LMWL, indicating that soil moisture is strongly subjected to evaporative fractionation during the infiltration of precipitation and irrigation.
(2)
During the growing seasons of cotton, the proportions of transpiration to evapotranspiration at the seedling, bud, flowering and boll, boll opening, and harvesting stages were 51%, 82%, 88%, 85%, and 72%, respectively.
(3)
Cotton’s main water absorption depths and corresponding contributions in the late bud stage, mid flowering and boll stage, late flowering and boll stage, boll opening stage, and harvesting stage were 0–20 cm (35.4%), 40–60 cm (40.9%), 60–80 cm (27.7%), 80–100 cm (29.9%), and 0–20 cm (22.5%), respectively.

Author Contributions

Y.Z. (Yang Zhao): data curation, formal analysis, methodology, writing—original draft, and writing—review and editing; Y.C.: supervision and equipment maintenance; S.H.: experimental observation and data curation; Y.S.: conceptualization, experimental design and supervision; F.L.: data curation and writing—review and editing; Y.Z. (Yucui Zhang): conceptualization, experimental design, supervision, and writing—review and editing. All authors have read and agreed to the published version of the manuscript.

Funding

This work was supported by the National Natural Science Foundation of China (41930865, 42171023, 41971262), the Project for Innovative Research Group of the Natural Science Foundation of Hebei Province (D2021503001), the Key Research and Development program of Hebei Province (21327004D), and the Open Fund of the State Key Laboratory of Desert and Oasis Ecology, Xinjiang Institute of Ecology and Geography, CAS (G2014-02-03).

Data Availability Statement

Data are available from the first author or the corresponding author on reasonable request.

Acknowledgments

We express our thanks to the researchers and students who helped with the experiment in Aksu Experimental Station and the State Key Laboratory of Desert and Oasis Ecology in Xinjiang.

Conflicts of Interest

The authors declare no conflict of interest.

References

  1. Zhang, N.; Zuo, Q.; Shi, J.C.; Xu, X. Estimating the yields and profits of saline water irrigated cotton in Xinjiang based on ANSWER model. Trans. Chin. Soc. Agric. Eng. 2023, 39, 78–89. [Google Scholar]
  2. Kite, G. Using a Basin-Scale Hydrological Model to Estimate Crop Transpiration and Soil Evaporation. J. Hydrol. 2000, 229, 59–69. [Google Scholar] [CrossRef]
  3. Liebhard, G.; Klik, A.; Stumpp, C.; Nolz, R. Partitioning evapotranspiration using water stable isotopes and information from lysimeter experiments. Hydrol. Sci. J. 2022, 67, 646–661. [Google Scholar] [CrossRef]
  4. Wu, Y.; Du, T.; Ding, R. An isotope method to quantify soil evaporation and evaluate water vapor movement under plastic film mulch. Agric. Water Manag. 2017, 184, 59–66. [Google Scholar] [CrossRef]
  5. Guo, H.W. Water Consumption of Maize in the Minqin Oasis Based on Hydrogen and Oxygen Stable Isotopes. Master’s Thesis, Northwest Normal University, Lanzhou, China, 2020. [Google Scholar]
  6. Wu, Y.J.; Du, T.S. Estimating and partitioning evapotranspiration of maize farmland based on stable oxygen isotope. Trans. Chin. Soc. Agric. Eng. 2020, 36, 127–134. [Google Scholar]
  7. Wang, X.Y.; He, X.L.; Yang, G. Study on water distribution in cotton field based on hydrogen and oxygen isotopes under different salt and fertilizer conditions. J. Northeast. Agric. Univ. 2022, 53, 65–71. [Google Scholar]
  8. Thorburn, P.J.; Ehleringer, J.R. Root Water Uptake of Field-Growing Plants Indicated by Measurements of Natural-Abundance Deuterium. Plant Soil 1995, 177, 225–233. [Google Scholar] [CrossRef]
  9. Lehmann, J. Subsoil Root Activity in Tree-Based Cropping Systems. Plant Soil 2003, 255, 319–331. [Google Scholar] [CrossRef]
  10. Zimmermann, U.; Ehhalt, D.; Muennich, K.O. Soil-water movement and evapotranspiration: Changes in the isotopic composition of the water. In Proceeding of the IAEA Symposium on the Use of Isotopes in Hydrology; IAEA: Vienna, Austria, 1968; pp. 567–585. [Google Scholar]
  11. Zhang, G.X.; Meng, W.H.; Pan, W.H.; Han, J.; Liao, Y.C. Effect of soil water content changes caused by ridge-furrow plastic film mulching on the root distribution and water use pattern of spring maize in the loess plateau. Agric. Water Manag. 2022, 261, 107338. [Google Scholar] [CrossRef]
  12. Fischer, M.J. iCHASM, a Flexible Land-Surface Model That Incorporates Stable Water Isotopes. Glob. Planet. Chang. 2006, 51, 121–130. [Google Scholar] [CrossRef]
  13. Zhang, X.; Xiao, Y.; Wan, H.; Deng, Z.M.; Pan, G.Y.; Xia, J. Using stable hydrogen and oxygen isotopes to study water movement in soil-plant-atmosphere continuum at Poyang Lake wetland, China. Wetl. Ecol. Manag. 2016, 25, 221–234. [Google Scholar] [CrossRef]
  14. Phillips, D.L.; Gregg, J.W. Source Partitioning Using Stable Isotopes: Coping with Too Many Sources. Oecologia 2003, 136, 261–269. [Google Scholar] [CrossRef] [PubMed]
  15. Moore, J.W.; Semmens, B.X. Incorporating Uncertainty and Prior Information into Stable Isotope Mixing Models. Ecol. Lett. 2008, 11, 470–480. [Google Scholar] [CrossRef]
  16. Parnell, A.C.; Inger, R.; Bearhop, S.; Jackson, A.L. Source Partitioning Using Stable Isotopes: Coping with Too Much Variation. PLoS ONE 2010, 5, e9672. [Google Scholar] [CrossRef] [PubMed]
  17. Semmens, B.X.; Stock, B.C.; Ward, E.; Moore, J.W.; Inger, R. MixSIAR: A Bayesian stable isotope mixing model for characterizing intrapopulation niche variation. In Proceedings of the 98th ESA Annual Convention 2013, Minneapolis, MN, USA, 4–9 August 2013. [Google Scholar]
  18. Du, J.S.; Ma, Y.; Hu, X.N.; Tong, J.X.; Zhang, B.Z.; Sun, N.X.; Gao, G.Y. Applying dual stable isotopes and a MixSIAR model to determine root water uptake of winter wheat. Acta Ecol. Sin. 2018, 38, 6611–6622. [Google Scholar]
  19. Yang, B.; Wen, X.; Sun, X. Irrigation Depth Far Exceeds Water Uptake Depth in an Oasis Cropland in the Middle Reaches of Heihe River Basin. Sci. Rep. 2015, 5, 15206. [Google Scholar] [CrossRef]
  20. Zhang, Y.; Zhang, M.H.; Wang, S.J.; Guo, R.; Che, C.W.; Ma, Z.Z. Comparison of different methods for determining plant water sources based on stable oxygen isotope. Chin. J. Ecol. 2020, 39, 1356–1368. [Google Scholar]
  21. Sun, H.Y.; Liu, C.M.; Zhang, Y.Q.; Zhang, X.Y. Experimental study on measuring soil surface evaporation with micro-evaporator. J. Hydraul. Eng. 2004, 8, 114–118. [Google Scholar]
  22. Bowen, I.S. The ratio of heat losses by conduction and by evaporation from any water surface. Phys. Rev. 1926, 27, 779–789. [Google Scholar]
  23. West, A.G.; Patrickson, S.J.; Ehleringer, J.R. Water Extraction Times for Plant and Soil Materials Used in Stable Isotope Analysis. Rapid Commun. Mass Spectrom. 2006, 20, 1317–1321. [Google Scholar] [CrossRef]
  24. Liu, Y.; Qiao, C. Partitioning Evapotranspiration in a Cotton Field under Mulched Drip Irrigation Based on the Water-Carbon Fluxes Coupling in an Arid Region in Northwestern China. Agriculture 2023, 13, 1219. [Google Scholar] [CrossRef]
  25. Zhang, Y.; Shen, Y.; Wang, J.; Qi, Y.Q. Estimation of evaporation of different cover types using a stable isotope method: Pan, bare soil, and crop fields in the North China Plain. J. Hydrol. 2022, 613, 128414. [Google Scholar] [CrossRef]
  26. Guo, Y.Y.; Yang, M.F.; Ji, C.R.; Hu, Q.R.; Wang, X.J.; Liu, A.L. Growth and development of Xinluzao 45 in response to drought and rewatering in Xinjiang cotton field with drip-irrigation under plastic-film. China Cotton 2023, 50, 1–6. [Google Scholar]
  27. Ge, R.C. Study of Evapotranspiration Law and Water Demand Model of Cotton Field in Drip Irrigation Oasis under Mulch. Master’s Thesis, Shihezi University, Shihezi, China, 2020. [Google Scholar]
  28. Sadok, W.; Sinclair, T.R.; Sparks, D.L. Crops yield increase under water-limited conditions: Review of recent physiological advances for soybean genetic improvement. Adv. Agron. 2011, 113, 5–349. [Google Scholar]
  29. Guo, H.; Zhao, Y.; Cai, D.X.; Lan, Z.L.; Lei, J.Q. Application of hydrogen and oxygen isotopes to study the source of water and competition in shelter-forest-cotton systems in the Xinjiang Oasis. Acta Ecol. Sin. 2019, 39, 6642–6650. [Google Scholar]
  30. Xing, D.; Xiao, J.J.; Han, S.Y.; Peng, G.H.; Fu, W.T.; Jia, Y.L. Water absorption source analysis of mulberry roots based on stable isotopes in rocky desertification area. Trans. Chin. Soc. Agric. Eng. 2019, 35, 77–84. [Google Scholar]
  31. Li, N. Characteristics of Soil Water Utilization in Jujube Plantation of Different Stand Ages on Loess Plateau of China Based on Stable Oxygen Isotope. Master’s Thesis, Northwest A&F University, Xianyang, China, 2018. [Google Scholar]
  32. Zhang, Z.; Cao, W.X.; Zhang, S.P.; Zhou, Z.G. Characterizing root growth and spatial distribution in cotton. Acta Phytoecol. Sin. 2005, 29, 266–273. [Google Scholar]
  33. Wang, P.; Song, X.F.; Yuan, R.Q.; Han, D.M.; Zhang, Y.H. Study on water consumption of summer maize in North China based on stable isotopes of hydrogen and oxygen. J. Nat. Resour. 2013, 28, 481–491. [Google Scholar]
Figure 1. Daily air temperature, precipitation, and evaporation in the study area in 2016.
Water 15 04140 g001
Figure 2. Changes in the evapotranspiration components and the proportion of transpiration to evapotranspiration at different growth stages of cotton.
Water 15 04140 g002
Figure 3. Relationship between δD and δ18O in various waters (LMWL: local meteorological water line, SWL: soil water line, GMWL: global meteorological water line).
Water 15 04140 g003
Figure 4. Comparison of δD and δ18O of soil water at different depths and stem water during different growth periods of cotton.
Water 15 04140 g004
Figure 5. Contribution of soil water at different depths to cotton roots at each growth stage.
Water 15 04140 g005
Table 1. Climatic and soil characteristics in arid areas.
Annual mean temperature11.3 °C
Annual mean precipitation46 mm
Annual sunshine hours2950 h
Annual solar radiation6000 MJ/m2
Frost-free period207 d
Annual evaporation2111 mm
Type of soilSulfated tidal soil
Bulk density1.43–1.53 g/cm3
Field capacity28–32%
Saturated water content43–50%
Table 2. Growth stage distribution of cotton in arid areas.
Date (m–d)Growth Period
2 May 2016–15 June 2016Seeding stage
16 June 2016–11 July 2016Bud stage
12 July 2016– 24 August 2016Flowering and boll stage
25 August 2016–5 October 2016Boll opening stage
6 October 2016–16 October 2016Harvesting stage
Disclaimer/Publisher’s Note: The statements, opinions and data contained in all publications are solely those of the individual author(s) and contributor(s) and not of MDPI and/or the editor(s). MDPI and/or the editor(s) disclaim responsibility for any injury to people or property resulting from any ideas, methods, instructions or products referred to in the content.

