Article

Numerical Simulation Study on the Distribution Characteristics of Precipitation Seepage Field in Water-Rich Ultra-Thick Sand and Gravel Layer

1
School of Civil Engineering and Architecture, Henan University of Science and Technology, Luoyang 471023, China
2
China Railway 15th Bureau Group Corporation Limited, Luoyang 471023, China
*
Author to whom correspondence should be addressed.
Water 2023, 15(21), 3720; https://doi.org/10.3390/w15213720
Submission received: 19 September 2023 / Revised: 18 October 2023 / Accepted: 19 October 2023 / Published: 25 October 2023
(This article belongs to the Special Issue Rainfall and Water Flow-Induced Soil Erosion-Volume 2.0)

Abstract

:
The distribution characteristics of a seepage field generated by precipitation affects the deformation damage of the geological body and engineering geological stability, especially a seepage field with a water-rich ultra-thick sand and gravel layer. In order to study the seepage field distribution characteristics of a water-rich ultra-thick sand and gravel layer, taking Luoyang Metro Line 1 as the engineering background, combined with the actual monitoring data of on-site precipitation, numerical simulation was used to study the seepage characteristics of the pit project precipitation with a suspended water-stop curtain. Through the study, the distribution characteristics of the seepage field under different precipitation depths and aquifer thicknesses were obtained, and the changes in pore water pressure characteristics, flow velocity and water inflow, depending on the precipitation depth and aquifer thickness, were analyzed. The research results show that, when comparing the calculated and measured results of the water level drop in the foundation pit, the average value of the error of the water level drop value in the pit and the descending well is 11.7%, which indicates that the calculation model meets the needs for its use in calculation and analysis. Under the conditions of a suspended water-stop curtain and precipitation, for the pore water pressure characteristics, the variation amplitude of the pore water pressure inside the pit increases with the precipitation depth and aquifer thickness. For the maximum flow velocity, all characteristics are present at the bottom of the suspended water-stop curtain, near the inside of the pit. The maximum flow velocity increases linearly with the precipitation depth and there is a threshold when the aquifer thickness is five times the precipitation depth. For water inflow, it increases with the increase in the precipitation depth and aquifer thickness, but, with a continuous increase in the aquifer thickness, the magnitude of water inflow growth decreases.

1. Introduction

The seepage field generated by precipitation is one of the most important environmental influences in sand and gravel formations and an important influence on the evolution of a geoid [1]. As part of the crustal stress, the groundwater condition in the seepage field is directly linked to the distribution of crustal stress inside the geological body. The excessive extraction of groundwater increases the effective stress between the internal structures of the geological body, causing the compression of the structural skeleton, which is macroscopically manifested as deformation of the geological body, causing the subsidence of the ground; meanwhile, seepage causes particles in the strata to flow out with the water, resulting in a ground cavity and leading to the collapse of the ground [2,3,4,5]. A series of problems unfavorable to the project are closely related to the distribution of the seepage field around it. In order to prevent the deformation and damage of the surrounding engineering and geological stability, the pumping of groundwater should be minimized. Therefore, generally, during precipitation, a circular water-stop curtain can be set up. For a falling-bottom water-stop curtain, the construction cost is high and the construction is difficult; for a suspended water-stop curtain, the advantages of both water-stop curtain methods are fully utilized, which not only reduces the cost of the project but also minimizes the pumping of groundwater and the ground settlement around the pit [6,7,8].
Sand and gravel geological layers have a very widespread distribution in China; this is a complex stratum, especially in a section adjacent to a river. Sand and gravel layers have complex characteristics, such as large voids, high porosity, and strong permeability, which brings a series of unfavorable problems to engineering construction projects, such as potential collapse, water permeability, pipe surges, and so on. The excavation of foundation pits in a sand and gravel layer with a high water level may cause a series of problems, such as seepage damage or quicksand, which directly affect the safety of the project. In order to prevent the occurrence of engineering accidents in foundation pits and to reduce the phenomena of quicksand and the rumbling of surging sand in the basement, it is necessary to lower the groundwater level to below the bottom of the foundation pit [9]. This prevents the occurrence of accidents in foundation pit engineering and reduces the phenomenon of quicksand [10].
The research on water-stop curtains mainly includes two aspects: analytical methods and numerical simulations. Regarding research using analytical methods, Banerjee S et al. [11,12] and Bereslavskii [13] deduced the analytical solution for a steady seepage field, based on the theory of fluid dynamics, which was used to study the distribution characteristics of a seepage field. Shen et al. [14] derived a series of simple formulas to calculate the head difference between two sides of the stop curtain. Wu et al. [15] proposed a semi-analytical method, combined with pumping test data, to determine the aquifer parameters. Chen Zheng [16] proposed a semi-analytical solution for the unsteady flow of groundwater in semi-confined pressurized aquifers in strip and circular pits, for drop-bottom stopping curtains and suspended stopping curtains, respectively, and established a finite difference numerical model. Many scholars have also conducted research on analytical methods for water-stop curtains [17,18,19,20,21,22]. The above analytical solutions for seepage are based on ideal conditions and generally assume more conditions, e.g., soils are generally assumed to be homogeneous and isotropic. With the rapid development of computer technology, some complex ground seepage problems that are difficult to address with analytical methods can be better solved using numerical methods.
Regarding numerical simulation studies, Madanayaka et al. [23] derived simple expressions to estimate the flow rate and hydraulic gradient values, based on hundreds of finite element simulations. Miyake N et al. [24] investigated the optimal length of a water-stop curtain, based on an example of a large-scale pit excavation project in Tokyo, Japan, using finite element analyses. Pujades E et al. [25] used numerical analysis to derive semi-empirical equations to analyze the water isolation effect of suspended and drop-bottom water-stop curtains. Xu et al. [26] carried out numerical analysis based on a groundwater flow model to evaluate the seepage interception effect of water-stop curtains. Wu et al. [27,28,29] studied the seepage characteristics of a seepage field with a water-stop curtain by combining pumping test data and numerical simulation data, which was based on a subway pit project in Hangzhou City. Wang et al. [30,31] carried out a numerical simulation by using a three-dimensional finite difference method to study the comprehensive effect of water pumping, the curtain stopping efficiency, and groundwater recharge. Luo et al. [32] used a three-dimensional finite element simulation method to design a precipitation optimization scheme for the pit precipitation method and set up a water-stop curtain for water isolation. Liu Shengli et al. [33] used a numerical simulation to compare and analyze various groundwater control schemes, such as the water isolation method, precipitation method, and combination method of water isolation and precipitation, and they formulated a reasonable precipitation scheme. You Yang et al. [34] simulated the effect of the insertion depth of the water-stop curtain on the depth of the water level drop outside the pit based on the finite difference method. Ma, Changhui [35] and Jiang, Xinliang [36] directly used numerical simulation software to analyze the seepage field under different working conditions, which they used to solve actual engineering seepage problems. Many scholars have also conducted research on the numerical simulation method for water-stop curtains [37,38,39,40]. However, there is relatively little research on the influence of factors such as the precipitation depth and aquifer thickness on the characteristics of the seepage field [41,42].
From the current research on water-stop curtain pit precipitation, there are many assumptions about the theoretical analytical solution of the distribution characteristics of the seepage field and few numerical analytical solutions for the distribution characteristics of a seepage field. Therefore, in this study, numerical simulation is used to investigate the effects of the precipitation depth and aquifer thickness on the seepage field distribution characteristics of the pit. Finally, the calculated values of the numerical simulation are compared with the measured values in engineering tests to verify the reliability of the numerical simulation, which provides a theoretical basis for the impact of precipitation on the ground and the setting of the precipitation control index, and also provides information for the decision making and construction of similar foundation pit engineering projects.

2. Methods of Analysis

This paper takes Luoyang Metro Line 1 as the engineering background and firstly establishes a universal model using FLAC3D. FLAC3D has some advantages in seepage calculation. It can simulate a reasonable seepage field by using the seepage parameters of the fluid medium and soil medium [43], and a hybrid discrete method is used. This method is more accurate and reasonable than the discrete integration method usually used in the finite element domain. Then, combined with the research results regarding the permeability coefficient of the stratigraphic conditions and the actual precipitation monitoring data of Yangwan Station, the precipitation calculation model under the condition of the suspended water-stop curtain in Yangwan Station is established. Finally, under the condition of different precipitation depths and aquifer thicknesses, the distribution characteristics of the seepage field, such as the pore water pressure size and distribution pattern, seepage path, and seepage flow velocity size, etc., around the pit are studied, and the change rule of water inflow in the pit with the precipitation depth and the aquifer thickness is analyzed.

2.1. Universal Model

The finite difference method software FLAC3D 5.0 is used to establish a universal numerical model [44]. The model width is taken as 600 m, the length is 630 m, and the height is 120 m. Considering the large influence range of precipitation, the outer boundary of the model is a permeable boundary, and the left, right, front, and rear boundaries of the model constrain the horizontal displacements, while the bottom constrains the horizontal and vertical displacements. The stratum adopts the Moore–Cullen model, and the enclosure structure adopts an elastic model, both of which use solid units. The specific coordinate system of the universal model is shown in Figure 1, where (0,0,0) is located at the intersection of the centerline of the longitudinal foundation pit, the beginning of the end excavation section, and the bottom of the model.

2.2. Calculation Model

Based on the universal model, a calculation model for suspended water-stop curtain precipitation at Yangwan Station is established. Yangwan Station is located below the northern section of Zhongzhou East Road in Luoyang City and is laid along the east–west direction of Zhongzhou East Road, serving as the terminal station of Line 1. The station is an underground two-story island-type platform station, with a platform width of 12 m, a total station length of 432.3 m, a total width of 20.7 m for the standard section of the structure, a width of 27.8 m for the west end head section, and an approximate depth of 18 m. The groundwater type in the site belongs to the Quaternary pore phreatic water, mainly stored in the sand and gravel layer, and is a strong permeable layer. During the survey, the burial depth of groundwater was generally 9.8~11.5 m, and the water level elevation was 113.08~115.85 m. The foundation pit of Yangwan Station is equipped with interlocking piles and an internal support enclosure structure, which is equivalent to a suspended water-stop curtain. The calculation model only takes the western end part to establish a numerical model, and it adopts the actual strata of Yangwan Station. The strata distribution and physical and mechanical indicators used in the model are shown in Table 1 below.

3. Distribution Characteristics of Seepage Field in Foundation Pits

Using the universal model, the range of the foundation pit is set to be 20 m deep (z in the model as 100), 26 m wide (x in the model ranging from −13 to 13), and 19 m long (y in the model ranging from 0 to 19 and 191 to 210), and the standard section is 20 m deep (z in the model is 100), 22 m wide (x in the model ranging from −11 to 11), and 172 m long (y in the model ranging from 19 to 191). The foundation pit is set as a waterless operation area, and an impermeable layer is installed inside the foundation pit to simulate a suspended water-stop curtain. We simulate and study the distribution characteristics of the seepage field by changing the precipitation depth and aquifer thickness. Considering the use of suspended water-stop curtains, the aquifer thickness is generally large, and many geometric parameters affect the characteristics of the seepage field. Therefore, the influence of the embedding depth of the water-stop curtain is not considered at this time.

3.1. Distribution Characteristics of Seepage Field under the Influence of Precipitation Depth

To study the distribution characteristics of the seepage field under the influence of the precipitation depth, in combination with the situation of groundwater involved in the foundation pit project of Luoyang Metro Line 1, the calculation conditions and model parameters are as shown in Table 2, whereas the corresponding physical and mechanical parameters of the strata are as shown in Table 1.

3.1.1. Effect on Pore Water Pressure

The variation in the pore water pressure in both the longitudinal and transverse sections of the foundation pit under different precipitation depths, considering the condition of suspended water-stop curtains, is shown in Figure 2. From the figure, it can be seen that the longitudinal and transverse sections of the foundation pit exhibit the same pattern. In the vertical direction, as the depth z decreases, the pore water pressure continues to increase. A certain amount of fluctuation occurs at the bottom of the suspended curtain, at the connection between the permeable layer and the impermeable bedrock, which decreases and disappears as it moves away from the pit. The change in the pore water pressure will also increase with the increase in the precipitation depth. In the horizontal direction, as it moves away from the foundation pit, the pore water pressure gradually tends to approach the initial horizontal water pressure distribution state. As the distance from the edge of the foundation pit becomes smaller, the change in pore water pressure is larger, i.e., the density becomes greater as the boundary of the foundation pit approaches. As the distance from the edge of the foundation pit increases, the pore water pressure gradually returns to the initial horizontal distribution state. Near the water-stop curtain, there are drastic changes and dense boundary lines, bypassing the water-stop curtain in an almost broken line form [45]. This indicates that near the water-stop curtain, the pore water pressure amplitude changes sharply, there is a jump in pore water pressure on both sides of the water-stop curtain, and the jump amplitude increases with the increase in precipitation depth.
For the different precipitation depths, the amplitude of the pore water pressure changes around the foundation pit increases with the increase in the precipitation depth. This is because the change in the precipitation depth has an impact on the hydraulic slope. The greater the precipitation depth, the greater the hydraulic slope drop. To reflect the impact of different precipitation depths on the distribution of the pore water pressure, Figure 3 shows the extraction of groundwater level curves under different precipitation depth conditions. From the figure, it can be seen that the decrease in the water level around the foundation pit has a funnel-shaped distribution, so the water level drop around the entire foundation pit has a similar funnel-shaped distribution, with large values nearby and small values far away [46]. As it moves away from the foundation pit, the groundwater level gradually tends to approximate the horizontal initial distribution state, which is similar to the distribution characteristics of the pore water pressure.

3.1.2. Effect on Flow Velocity

The cross-sectional flow velocity distribution and seepage path under the condition of a suspended water-stop curtain are shown in Figure 4. From the figure, it can be seen that the groundwater flows into the water-stop curtain below the outside of the foundation pit and then enters the interior of the foundation pit. Within the range of the bottom of the foundation pit and the suspended water-stop curtain, vertical seepage is mainly present, and the bottom part of the water-stop curtain presents horizontal seepage. On the outside of the foundation pit, the groundwater flows between the portion above the elevation of the stop curtain and the dynamic water level, bypassing the curtain and entering the inside of the foundation pit, with an increased seepage path.
In terms of flow velocity, the seepage velocity within the range of the foundation pit bottom and the suspended water-stop curtain on the cross-section is much greater than the external seepage flow velocity. The maximum flow velocity occurs at the bottom of the suspended water-stop curtain near the inner side of the foundation pit and extends towards the centerline of the foundation pit and the deeper strata centered on it, while the seepage flow velocity becomes smaller. This is because the pore water pressure varies the most at the bottom of the suspended water-stop curtain, resulting in the largest hydraulic gradient at this location, and therefore the maximum seepage rate occurs at the bottom of the suspended water-stop curtain [47]. On the transverse section, at a constant distance from the side wall of the foundation pit, the groundwater seepage flow velocity near the dynamic water level is greater than the seepage flow velocity of the deep strata.
Based on the distribution pattern of the seepage size of the suspended water-stop curtain, the projected area of the cross-section x > 0 is used for areas with flow velocities greater than 0.1875 mm/s, 0.375 mm/s, 0.5625 mm/s, and 0.75 mm/s, reflecting the influence of the precipitation depth on the seepage flow velocity [48]. We extract the maximum flow velocity of the foundation pit, and the results are shown in Table 3 and Figure 5 and Figure 6.
As shown in Figure 5, according to the variation in the projected area on the transverse section with the precipitation depth and velocity range, as the precipitation depth increases, the area that reaches a certain seepage flow velocity increases; the larger the seepage velocity in the corresponding interval, the slower the growth of the projection area. This is because the seepage flow velocity within the range of the bottom of the foundation pit and the suspended water-stop curtain is much greater than the external seepage flow velocity. Therefore, within the precipitation depth reduction range used in the statistical flow rate model, the projection area of the area that reaches a certain seepage flow velocity on the transverse section increases to a certain range, and the growth trend slows down.
As shown in Figure 6, the maximum seepage flow velocity increases linearly with the increase in the precipitation depth. This is because the change in the precipitation depth has an impact on the hydraulic slope, and, according to Darcy’s law, the seepage flow velocity is proportional to the hydraulic slope, indicating that the calculation results comply with the basic assumptions [49].

3.1.3. Effect on Water Inflow

Under the condition of a suspended water-stop curtain, the variation pattern of the water inflow to the foundation pit with the precipitation depth is as shown in Figure 7. As the precipitation depth increases, the water inflow increases. When determining the thickness and permeability coefficient of the aquifer, under the condition that the aquifer thickness is much greater than the precipitation depth, fitting the precipitation depth and water inflow using a straight line or parabolic curve leads to good fitting results. This is because the change in precipitation depth has an impact on the hydraulic slope, and, according to Darcy’s law, the seepage flow velocity is proportional to the hydraulic slope and the water inflow is directly proportional to the seepage flow velocity, indicating that the calculation results comply with the basic assumptions [48].

3.2. Distribution Characteristics of Seepage Field under the Influence of Aquifer Thickness

The aquifer thicknesses used in this calculation are 2.5, 5, 7.5, 10, and 12.5 times the precipitation depth of 8 m. The calculation conditions and model parameters are shown in Table 4, and the corresponding physical and mechanical parameters of the strata are shown in Table 1.

3.2.1. Effect on Pore Water Pressure

Under the condition of suspended water-stop curtain precipitation, the distribution law of the pore water pressure in the longitudinal and transverse sections is the same. Therefore, the distribution law of the pore water pressure with different aquifer thicknesses on the longitudinal section is studied. The specific details are shown in Figure 8. From the figure, it can be seen that in the vertical direction, as the depth z decreases, the pore water pressure continues to increase, and there will be certain fluctuations at the bottom of the suspended water-stop curtain. This fluctuation will continue to decrease and disappear as it moves away from the foundation pit. Additionally, the magnitude of the pore water pressure change with the aquifer thickness also decreases as it moves away from the suspended water-stop curtain. In the horizontal direction, as the distance from the edge of the foundation pit becomes greater, the variation in pore water pressure becomes smaller, i.e., the density becomes greater as the distance from the edge of the foundation pit increases. The pore water pressure gradually returns to the initial horizontal distribution state as the distance from the edge of the foundation pit increases. At depth z = 80 m, the aquifer thickness of 20 m is horizontal. This is because, at a depth of z = 80 m, the location is in impermeable bedrock, and the pore water pressure does not change with the location of the pit, so it remains a horizontal line. Near the water-stop curtain, there are drastic changes and dense boundary lines, bypassing the water-stop curtain in an almost broken line form. This indicates that near the water-stop curtain, the amplitude of the changes in pore water pressure increases sharply, and there is a jump in the pore water pressure on both sides of the water-stop curtain. However, when the precipitation depth decreases to a certain extent, the greater the aquifer thickness, the greater the change in pore water pressure at the bottom of the foundation pit and outside the suspended water-stop curtain [50]. Moreover, as the aquifer thickness increases, the increment of changes in the pore water pressure decreases. When the aquifer thickness reaches 10 times or more of the precipitation depth, the pore water pressure tends to be consistent. This is because the greater the aquifer thickness, the greater the hydraulic slope drop. The effect of the suspended water-stop curtain on the pore water pressure is relatively small. However, after the aquifer reaches 10 times the precipitation depth, this effect becomes negligible. Therefore, the difference in water pressure on both sides of the suspended water-stop curtain increases with the increase in the aquifer thickness. When the aquifer thickness is greater than 10 times the precipitation depth, the influence of the aquifer thickness on the difference in pore water pressure on both sides of the curtain is relatively small.
To reflect the impact of different aquifer thicknesses on the distribution of the pore water pressure, groundwater level curves were extracted for different aquifer thicknesses, as shown in Figure 9. From the figure, it can be seen that the decrease in the water level around the foundation pit follows a funnel-shaped distribution. Therefore, the water level drop around the entire foundation pit follows a similar funnel-shaped distribution, with large values nearby and small values far away. As it moves away from the foundation pit, the groundwater level gradually approximates the horizontal initial distribution state, which is similar to the distribution characteristics of the pore water pressure.

3.2.2. Effect on Flow Velocity

The cross-sectional flow velocity distribution and seepage path under the condition of a suspended water-stop curtain are shown in Figure 10. As shown in Figure 10, the seepage flow velocity within the range of the bottom of the foundation pit and the suspended water-stop curtain on both the horizontal and vertical sections is much greater than the external seepage velocity. The maximum flow velocity occurs at the bottom of the suspended water-stop curtain near the inner side of the foundation pit, and it extends towards the center and deeper strata of the foundation pit, while the seepage flow velocity is relatively small. On both the horizontal and vertical sections, at a distance equal to the distance from the side wall of the foundation pit, the seepage velocity of groundwater near the dynamic water level is greater than that in the deep strata [51].
Based on the same analysis as above, the intervals of the flow velocity greater than 0.1875 mm/s, greater than 0.375 mm/s, greater than 0.5625 mm/s, and greater than 0.75 mm/s are extracted from the projected area in the x > 0 portion of the cross-section. This reflects the effect of the precipitation depth on the seepage flow velocity. Additionally, the maximum flow velocity within the foundation pit is extracted. The results are shown in Table 5 and Figure 11 and Figure 12.
As shown in Figure 11, as the aquifer thickness increases, the projected area increases. Without considering the depth of the water-stop curtain, when the aquifer thickness is less than 7.5 times the precipitation depth, the projected area of the transverse section with a seepage flow velocity greater than 0.1875 mm/s increases rapidly. When the aquifer thickness is greater than 7.5 times the precipitation depth, the projected area of the transverse section with a seepage flow velocity greater than 0.1875 mm/s increases, but the rate of increase decreases.
As shown in Figure 12, when the aquifer thickness is between 20 and 40 m, the maximum seepage velocity decreases with the increase in the aquifer thickness; Afterwards, as the aquifer thickness increases, it continuously increases. Based on the geometric dimensions, it can be seen that when the water flow width between the bottom of the water-stop curtain and the top of the impermeable layer is less than four times the precipitation depth, the maximum seepage flow velocity decreases with the increase in the aquifer thickness. When the water flow width is greater than four times the depth reduction, the aquifer thickness increases, and the maximum seepage flow velocity increases, but the amplitude decreases.

3.2.3. Effect on Water Inflow

Under the condition of a suspended water-stop curtain, the variation pattern of the water inflow of the foundation pit with respect to the aquifer thickness is as shown in Figure 13 when the precipitation depth is 8 m. From the figure, it can be seen that the relationship between the aquifer thickness and water inflow can be characterized by a logistic function [51]. As the aquifer thickness increases, the water inflow increases, but as the aquifer thickness further increases, the magnitude of the increase in water inflow decreases. Under the conditions of determining the precipitation depth and permeability coefficient, when the aquifer thickness increases from 10 times the depth reduction (80 m) to 12.5 times the depth reduction (100 m), the water inflow increases by 4.7%. The results show that under the condition of a suspended water-stop curtain, when the aquifer thickness is more than 10 times the precipitation depth, the continued increase in the aquifer thickness still affects the size of the water inflow in the foundation pit, but the degree of influence decreases. This is because a greater aquifer thickness is equivalent to a greater overwater area. However, as the aquifer thickness increases, the degree of influence of the overwater area on the water inflow becomes smaller [52]. Therefore, the water inflow increases with the increase in the aquifer thickness; however, as the aquifer thickness further increases, the magnitude of the increase in water inflow decreases.

4. Model Validation

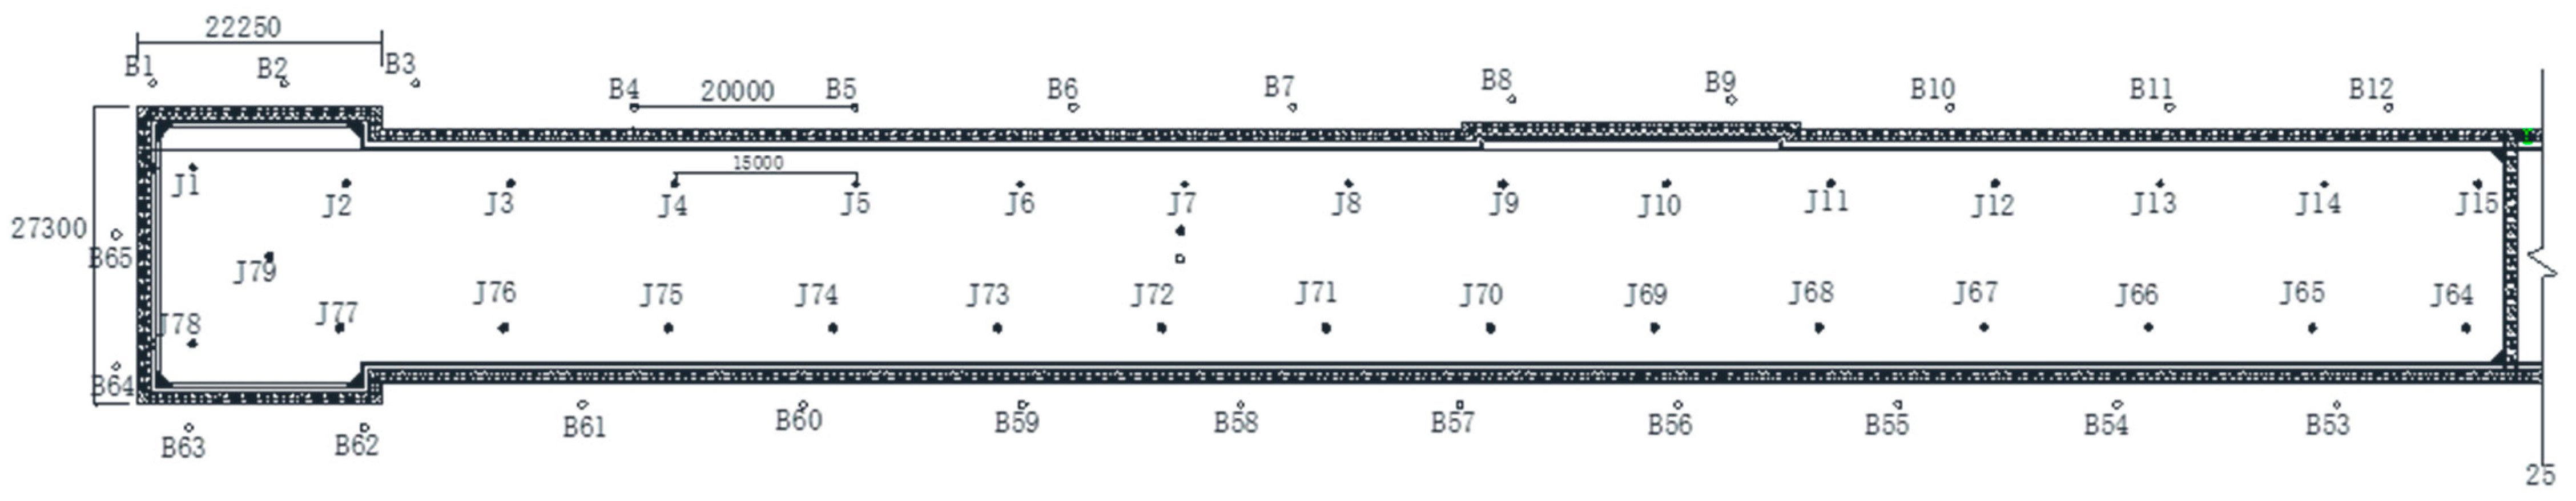
The dewatering wells for the foundation pit operation of Yangwan Station include J1~J7 and J73~79, and the specific distribution is shown in Figure 14. The spacing between the dewatering wells is 15 m, and the actual depth is about 30 m. The water pump is lowered to a depth of 24 m, and the water level at the end of the foundation pit is stable at around 105.9 m, which is 8.38 m lower than the initial groundwater level of 114.28. An ultrasonic flow meter is used to monitor the water output of the operating dewatering well and measure the water level inside the dewatering well.
We bring the measured water volume from the dewatering well into the calculation model for calculations and compare the measurement and calculation results of the water level drop in the foundation pit and dewatering well. The comparison results are shown in Table 6.
Upon comparison of the calculated and measured results, it can be seen that the calculated water level drop in the pit at the west end of Yangwan Station is 7.63% lower than the measured value. The absolute error of the calculated water level drop in the dewatering well ranges from 5.09% to 26.62%, and the average error of the water level drop in the pit and dewatering well is 11.7%. This is mainly attributed to the non-uniformity of the strata and the error of the dewatering well position, indicating that the calculation model can meet the calculation and analysis needs. By studying the distribution characteristics of seepage field in a water-rich ultra-thick sand and gravel layer under precipitation conditions, the characteristics of its pore water pressure, flow direction, flow rate, and water inflow are investigated. This provides a theoretical basis for the design and construction of pit descending in similar projects.

5. Conclusions

The main conclusions drawn from the numerical simulation study regarding the distribution characteristics of the precipitation seepage field in the water-rich ultra-thick layer of sand and gravel are summarized as follows.
(1)
Under the condition of the suspended water-stop curtain, the pore water pressure on the outer side of the water-stop curtain is greater than that on the inner side of the foundation pit. It increases linearly with an increase in the precipitation depth. As the aquifer thickness increases, it increases. The pore water pressure distribution characteristics deeply influence the dynamic water level curve.
(2)
Under the condition of the suspended water-stop curtain, the maximum seepage flow velocity occurs at the position where the curtain’s bottom leans towards the inner side of the foundation pit. The maximum seepage flow velocity increases linearly with an increase in the precipitation depth, and there is a threshold value for the aquifer thickness, which is five times the precipitation depth.
(3)
Under the condition of the suspended water-stop curtain, the relationship between the precipitation depth and water inflow can be described by a linear or parabolic function; the relationship between the aquifer thickness and water inflow can be described by a logistic function.
(4)
The calculation results are compared with the measured water level measurements. The average error of the water level drop in the pit and precipitation well under the suspended water-stop curtain condition is 11.7%, indicating that the established numerical model can meet the calculation requirements.

Author Contributions

Conceptualization, D.L. and S.C.; methodology, S.C.; software, N.L.; validation, Y.S., N.L. and S.C.; formal analysis, Y.S.; investigation, Z.L.; resources, D.L.; data curation, S.C.; writing—original draft preparation, S.C.; writing—review and editing, D.L.; visualization, S.C.; supervision, D.L.; project administration, Z.L.; funding acquisition, D.L. All authors have read and agreed to the published version of the manuscript.

Funding

This work was supported by the National Key R&D Project: Research and Development of Intelligent Interconnected Equipment Network Collaborative Manufacturing/Operation and Maintenance Integration Technology and Platform (No. 2020YFB1712105), and the National Key R&D Project: Theory and Method of Underground Space Development and Construction (No. 2019YFC0605104).

Data Availability Statement

Data sharing is not applicable to this article as no datasets were generated or analyzed during the current study.

Acknowledgments

We sincerely thank all the reviewers and editors for their professional comments and suggestions regarding this manuscript.

Conflicts of Interest

The authors declare no conflict of interest.

References

  1. Vaziri, H.H.; Xiao, Y.; Islam, R.; Nouri, A. Numerical modeling of seepage-induced sand production in oil and gas reservoirs. J. Pet. Sci. Eng. 2002, 36, 71–86. [Google Scholar] [CrossRef]
  2. Bai, H.; Ma, D.; Chen, Z. Mechanical behavior of groundwater seepage in karst collapse pillars. Eng. Geol. 2013, 164, 101–106. [Google Scholar] [CrossRef]
  3. Jafarian, Y.; Haddad, A.; Mehrzad, B. Load-Settlement Mechanism of Shallow Foundations Rested on Saturated Sand with Upward Seepage. Int. J. Geomech. 2017, 17, 1–14. [Google Scholar] [CrossRef]
  4. Yao, Y.; Ni, J.; Jue, L. Stress-dependent water retention of granite residual soil and its implications for ground settlement. Comput. Geotech. 2020, 129, 103835. [Google Scholar] [CrossRef]
  5. Xu, Y.; Yan, Y.Y. Optimal Design of Foundation Pit Dewatering Based on Objective Functions and Numerical Analysis. Adv. Mater. Res. 2012, 368–373, 2495–2499. [Google Scholar] [CrossRef]
  6. Chen, Z.; Huang, J.; Zhan, H.; Wang, J.; Dou, Z.; Zhang, C.; Chen, C.; Fu, Y. Optimization schemes for deep foundation pit dewatering under complicated hydrogeological conditions using MODFLOW-USG. Eng. Geol. 2022, 303, 106653. [Google Scholar] [CrossRef]
  7. Wang, J.; Deng, Y.; Ma, R.; Liu, X.; Guo, Q.; Shao, Y.; Wu, L.; Zhou, J.; Yang, T. Model test on partial expansion in stratified subsidence during foundation pit dewatering. J. Hydrol. 2018, 557, 489–508. [Google Scholar] [CrossRef]
  8. Yong, Z.; YunYun, Z. Real time prediction of land subsidence caused by foundation pit dewatering. Rock Soil Mech. 2008, 29, 1593–1596. [Google Scholar] [CrossRef]
  9. Zeng, C.F.; Zheng, G.; Zhou, X.F.; Xue, X.L.; Zhou, H.Z. Behaviours of wall and soil during pre-excavation dewatering under different foundation pit widths. Comput. Geotech. 2019, 115, 103169. [Google Scholar] [CrossRef]
  10. Shi, J.; Wu, B.; Liu, Y.; Xu, S. Analysis of the influence of groundwater seepage on the deformation of deep foundation pit with suspended impervious curtain. Adv. Mech. Eng. 2022, 14, 117–121. [Google Scholar] [CrossRef]
  11. Banerjee, S. Design charts for double-walled cofferdams. J. Geotech. Eng. 1993, 119, 214–222. [Google Scholar] [CrossRef]
  12. Banerjee, S.; Muleshkov, A. Analytical Solution of Steady Seepage Into Double-Walled Cofferdams. J. Eng. Mech. 1992, 118, 525–539. [Google Scholar] [CrossRef]
  13. Bereslavskii, E.N. The flow of ground waters around a Zhukovskii sheet pile. J. Appl. Math. Mech. 2011, 75, 210–217. [Google Scholar] [CrossRef]
  14. Shen, S.L.; Wu, Y.X.; Misra, A. Calculation of head difference at two sides of a cut-off barrier during excavation dewatering. Comput. Geotech. 2017, 91, 192–202. [Google Scholar] [CrossRef]
  15. Wu, Y.X.; Shen, J.S.; Cheng, W.C.; Hino, T. Semi-analytical solution to pumping test data with barrier, wellbore storage, and partial penetration effects. Eng. Geol. 2017, 226, 44–51. [Google Scholar] [CrossRef]
  16. Zheng, C.; Xudong, W.; Jie, Z. Solution to one-dimensional nonlinear consolidation of foundation soil with variable pore pressure boundary. J. Nanjing Univ. Technol. Nat. Sci. Ed. 2014, 36, 90–94. [Google Scholar] [CrossRef]
  17. Schultz, D. Characterization of suspended substances in water. I. Analytical methods. Acta Hydrochim. Hydrobiol. 1980, 8, 175–180. [Google Scholar] [CrossRef]
  18. Kitajima, S.; Hatakeyama, M.; Tsuchiya, T.; Yasutaka, T. Development of an Analytical Method for Radioactive Cesium in Water Containing Suspended Solids Using Gellant. Bunseki Kagaku 2013, 62, 513–519. [Google Scholar] [CrossRef]
  19. Giraldez, H.; Segarra, C.D.P.; Rodriguez, I.; Oliva, A. Improved semi-analytical method for air curtains prediction. Energy Build. 2013, 66, 258–266. [Google Scholar] [CrossRef]
  20. Liu, X. Analytical solutions for steady two-dimensional suspended sediment transport in channels with arbitrary advection velocity and eddy diffusivity distributions. J. Hydraul. Res. 2016, 54, 389–398. [Google Scholar] [CrossRef]
  21. Zhao, N.; Shao, Z.; Yuan, B.; Chen, X.; Wu, K. Analytical Approach to the Coupled Effects of Slope Angle and Seepage on Shallow Lined Tunnel Response. Int. J. Appl. Mech. 2022, 14, 2250003. [Google Scholar] [CrossRef]
  22. Li, Z.; He, C.; Chen, Z.; Yang, S.; Ding, J.; Pen, Y. Study of seepage field distribution and its influence on urban tunnels in water-rich regions. Bull. Eng. Geol. Environ. 2019, 78, 4035–4045. [Google Scholar] [CrossRef]
  23. Madanayaka, T.A.; Sivakugan, N. Simple solutions for square and rectangular cofferdam seepage problems. Can. Geotech. J. 2018, 56, 730–745. [Google Scholar] [CrossRef]
  24. Miyake, N.; Kohsaka, N.; Ishikawa, A. Multi-aquifer pumping test to determine cutoff wall length for groundwater flow control during site excavation in Tokyo, Japan. Hydrogeol. J. 2008, 16, 995–1001. [Google Scholar] [CrossRef]
  25. Pujades, E.; López, A.; Carrera, J.; Vázquez-Suñé, E.; Jurado, A. Barrier effect of underground structures on aquifer. Eng. Geol. 2012, 145–146, 41–49. [Google Scholar] [CrossRef]
  26. Xu, Y.S.; Shen, S.L.; Du, Y.J.; Chai, J.-C. Modelling the cutoff behavior of underground structure in multi-aquifer-aquitard groundwater system. Nat. Hazards 2013, 66, 731–748. [Google Scholar] [CrossRef]
  27. ShuiLong, S.; ZhenYu, Y.; YeShuang, X.; YongXia, W. Characteristics of groundwater seepage with cut-off wall in gravel aquifer. I: Field observations. Can. Geotech. J. 2015, 52, 1526–1538. [Google Scholar] [CrossRef]
  28. Wu, Y.X.; Shen, S.L.; Yin, Z.Y.; Xu, Y.S. Characteristics of groundwater seepage with cut-off wall in gravel aquifer. II: Numerical analysis. Can. Geotech. J. 2015, 52, 1539–1549. [Google Scholar] [CrossRef]
  29. Wu, Y.X.; Shen, S.L.; Yuan, D.J. Characteristics of dewatering induced drawdown curve under blocking effect of retaining wall in aquifer. J. Hydrol. 2016, 539, 554–566. [Google Scholar] [CrossRef]
  30. Feng, B.; Liu, Y.; Wu, L.; Zhu, Y.; Zhang, X.; Tang, Y.; Yang, P. Controlling subsidence caused by de-watering in a deep foundation pit. Bull. Eng. Geol. Environ. 2012, 71, 545–555. [Google Scholar] [CrossRef]
  31. Wang, J.; Hu, L.; Tang, L.W.Y.; Zhu, Y.; Yang, P. Hydraulic barrier function of the underground continuous concrete wall in the pit of subway station and its optimization. Environ. Geol. 2009, 57, 447–453. [Google Scholar] [CrossRef]
  32. Luo, Z.J.; Zhang, Y.Y.; Wu, Y.X. Finite Element Numerical Simulation of Three-Dimensional Seepage Control for Deep Foundation Pit Dewatering. J. Hydrodyn. 2008, 20, 596–602. [Google Scholar] [CrossRef]
  33. Liu, S.; Jiang, S.; Cao, C. Comparison and optimization of alternatives to groundwater control for a deep excavation in highly permeable sand and gravel. J. Railw. Sci. Eng. 2018, 15, 3189–3197. [Google Scholar] [CrossRef]
  34. You, Y.; Yan, C.; Liu, S.; Xu, B.; Che, C.; Liu, J. Optimization Design for Dewatering of Large Deep Foundation Pit under Complex Geological Conditions. J. Eng. Geol. 2017, 25, 715–722. [Google Scholar] [CrossRef]
  35. Ma, C.; Mao, Y.; Huang, W.; Cai, H. Effects of dewatering methods on seepage and deformation of foundation pits. Chin. J. Geotech. Eng. 2014, 36, 294–298. [Google Scholar] [CrossRef]
  36. Jiang, X.; Zong, J. Three-dimensional finite element analysis of seepage fields in foundation pit. Chin. J. Geotech. Eng. 2006, 28, 564–568. [Google Scholar] [CrossRef]
  37. Bin, W.; Chang, Y.-H.; Zhi, L.-J. High yield production of graphene and its improved property in detecting heavy metal ions. J. Refrig. 2011, 26, 31–35. [Google Scholar] [CrossRef]
  38. Li, W.-Y.; Li, F.; Zhu, Z.-F. Numerical simulation and land subsidence control for deep foundation pit dewatering of Longyang Road Station on Shanghai Metro Line 18. J. Groundw. Sci. Eng. 2019, 7, 133–144. [Google Scholar] [CrossRef]
  39. Zhou, N.; Vermeer, P.A.; Lou, R.; Tang, Y.; Jiang, S. Numerical simulation of deep foundation pit dewatering and optimization of controlling land subsidence. Eng. Geol. 2010, 114, 251–260. [Google Scholar] [CrossRef]
  40. Li, J.; Ma, J.; Sun, X.; Shen, X.; Liu, Q. Numerical simulation of soil nitrogen transformation for water storage single pit irrigation. Trans. Chin. Soc. Agric. Eng. 2012, 28, 111–117. [Google Scholar] [CrossRef]
  41. Li, Z.; Chen, Z.Q.; He, C.; Ma, C.C.; Duan, C.R. Seepage field distribution and water inflow laws of tunnels in water-rich regions. J. Mt. Sci. Engl. Ed. 2022, 19, 591–605. [Google Scholar] [CrossRef]
  42. Zhao, L.; Zhang, H.; Mao, J.; Guan, C. Numerical simulation of the bubbling phenomenon ahead of the dam using a two-phase seepage free surface model. Comput. Geotech. 2023, 155, 105239. [Google Scholar] [CrossRef]
  43. Zhang, Y.T. Analysis of Seepage Field of Highway Tunnel Excavation by Finite Difference Method. Appl. Mech. Mater. 2014, 638–640, 798–803. [Google Scholar] [CrossRef]
  44. Lin, Z.; Zhang, B.; Guo, J. Analysis of a Water-Inrush Disaster Caused by Coal Seam Subsidence Karst Collapse Column under the Action of Multi-Field Coupling in Taoyuan Coal Mine. Comput. Model. Eng. Sci. (Engl.) 2021, 126, 311–330. [Google Scholar] [CrossRef]
  45. Wang, X.; Tan, Z.; Wang, M.; Zhang, M.; Ming, H. Theoretical and experimental study of external water pressure on tunnel lining in controlled drainage under high water level. Tunn. Undergr. Space Technol. 2008, 23, 552–560. [Google Scholar] [CrossRef]
  46. Wang, W.; Han, Z.; Deng, J.; Zhang, X.; Zhang, Y. Study on soil reinforcement param in deep foundation pit of marshland metro station. Heliyon 2019, 5, e02836. [Google Scholar] [CrossRef] [PubMed]
  47. Chen, B.; Liu, M.; Deng, S.; Li, Y.; Zhang, X.; Liu, T. Study on the law of influence of seepage field anomalies on displacement field induced by leakage of enclosure structure. Appl. Sci. 2022, 12, 3809. [Google Scholar] [CrossRef]
  48. Nikvar Hassani, A.; Katibeh, H.; Farhadian, H. Numerical analysis of steady-state groundwater inflow into Tabriz line 2 metro tunnel, northwestern Iran, with special consideration of model dimensions. Bull. Eng. Geol. Environ. 2016, 75, 1617–1627. [Google Scholar] [CrossRef]
  49. Yuan, C.; Hu, Z.; Zhu, Z.; Yuan, Z.; Fan, Y.; Guan, H.; Li, L. Numerical simulation of seepage and deformation in excavation of a deep foundation pit under water-rich fractured intrusive rock. Geofluids 2021, 2021, 6628882. [Google Scholar] [CrossRef]
  50. Tan, Y.; Smith, J.V.; Li, C.Q.; Currell, M.; Wu, Y. Predicting external water pressure and cracking of a tunnel lining by measuring water inflow rate. Tunn. Undergr. Space Technol. 2018, 71, 115–125. [Google Scholar] [CrossRef]
  51. Zhang, Q.; Wei, M.; Wang, C. Numerical Simulation of Groundwater Seepage from Suspended Water Stop Curtains. Geotech. Eng. Tech. 2021, 35, 146–150. [Google Scholar] [CrossRef]
  52. Hwang, J.-H.; Lu, C.-C. A semi-analytical method for analyzing the tunnel water inflow. Tunn. Undergr. Space Technol. 2007, 22, 39–46. [Google Scholar] [CrossRef]
Figure 1. Calculation model coordinate system.
Water 15 03720 g001
Figure 2. Changes in pore water pressure of foundation pits under different precipitation depths.
Water 15 03720 g002aWater 15 03720 g002b
Figure 3. Dynamic water level curve of foundation pit at different precipitation depths.
Water 15 03720 g003
Figure 4. Transverse section velocity distribution and seepage path at different precipitation depths (i.e., y = 105) (m/s).
Water 15 03720 g004
Figure 5. The projected area of the precipitation depth–velocity range on the transverse section.
Water 15 03720 g005
Figure 6. The variation law of maximum seepage flow velocity with precipitation depth.
Water 15 03720 g006
Figure 7. The variation law of water inflow with precipitation depth.
Water 15 03720 g007
Figure 8. Changes in pore water pressure of foundation pits under different aquifer thicknesses.
Water 15 03720 g008
Figure 9. Dynamic water level curve of foundation pit at different aquifer thicknesses.
Water 15 03720 g009
Figure 10. Transverse section velocity distribution and seepage path at different aquifer thicknesses (i.e., y = 105) (m/s).
Water 15 03720 g010
Figure 11. The projected area of the aquifer thickness–velocity range on the transverse section.
Water 15 03720 g011
Figure 12. The variation law of maximum seepage flow velocity with aquifer thickness.
Water 15 03720 g012
Figure 13. The variation law of water inflow with the aquifer thickness.
Water 15 03720 g013
Figure 14. Layout of dewatering wells at Yangwan Station.
Water 15 03720 g014
Table 1. Strata distribution and physical and mechanical indicators.
Soil Layer NumberSoil LayerThicknessPhysical and Mechanical Parameters
Poisson’s RatioDensity (kg/m3)Elastic Modulus (MPa)Permeability Coefficient (m/d)Internal Friction Angle (°)Cohesive Force (MPa)Void Ratio
1Miscellaneous fill, loess- shaped silty clay20.35175015.46200.0220.9
2Fine sand60.30185024152000.46
3Loose to slightly dense sandy and gravel60.25210046603000.42
4Medium-dense to dense sand and gravel160.252200120803500.39
5Dense sand and gravel700.2222001206042 0.36
6Impermeable bedrock200.2025001500---0.2
7Enclosure structure-0.202500310080--0.2
Table 2. Calculation conditions and parameter settings for the influence of precipitation depth on the seepage field.
Calculation ConditionsParameter Setting Values
Precipitation depth (m)468101214
Groundwater level (m)104106108110112114
Silty clay bottom (m)114
Medium-dense to dense pebble bottom (m)242628303234
Impermeable bedrock (m)0~240~260~280~300~320~34
The bottom of the suspended water-stop curtain (m)86
Table 3. The effect of precipitation depth of on seepage flow velocity.
Precipitation Depth (m)Projected Area (m2)Maximum Seepage Flow Velocity (mm/s)
>0.1875 mm/s>0.375 mm/s>0.5625 mm/s>0.75 mm/s
400000.18
631.10000.28
8174.662000.38
101944000.45
12238.398000.54
14273.92884400.66
Table 4. Calculation conditions and parameter settings for the influence of aquifer thickness on seepage field.
Calculation ConditionsParameter Setting Values
Precipitation depth (m)8
Groundwater level (m)108
Silty clay bottom (m)114
Medium-dense to dense gravel bottom (m)886848288
Impermeable bedrock (m)0~880~680~480~280~8
The bottom of the suspend water-stop curtain (m)92
Table 5. The effect of aquifer thickness on seepage flow velocity.
Aquifer Thickness (m)Projected Area (m2)Maximum Seepage Flow Velocity (mm/s)
>0.1875 mm/s>0.375 mm/s>0.5625 mm/s>0.75 mm/s
2024.330000.37
4050.660000.32
60115.052000.40
80128.004000.44
100136.004000.46
Table 6. Measurement and calculation results of water level drop in foundation pit ends and dewatering wells.
PositionMeasurement ValueCalculated Value of Water Level Drop (m)
Elevation (m)Water Level Drop Value (m)
B8112.501.781.53
J6101.7812.5013.9
J9112.381.902.01
J70112.391.881.98
J72109.454.835.08
West End Head105.98.389.02
Disclaimer/Publisher’s Note: The statements, opinions and data contained in all publications are solely those of the individual author(s) and contributor(s) and not of MDPI and/or the editor(s). MDPI and/or the editor(s) disclaim responsibility for any injury to people or property resulting from any ideas, methods, instructions or products referred to in the content.

