Article

Application of Modified DRASTIC Method for the Assessment and Validation of Confined Aquifer Vulnerability in Areas with Diverse Quaternary Deposits

1
Department of Geology, Institute of Ecology and Earth Sciences, University of Tartu, Ravila 14a, EE-50411 Tartu, Estonia
2
Geological Survey of Estonia, F. R. Kreutzwaldi 5, EE-44314 Rakvere, Estonia
*
Author to whom correspondence should be addressed.
Water 2023, 15(20), 3585; https://doi.org/10.3390/w15203585
Submission received: 25 August 2023 / Revised: 21 September 2023 / Accepted: 10 October 2023 / Published: 13 October 2023

Abstract

:
Accurate vulnerability assessment methods are essential for effective groundwater management and protection, allowing the identification of areas vulnerable to pollution. The widely used DRASTIC method has been modified to improve groundwater vulnerability assessment in regions where Quaternary sediments form a confining layer above the main useful aquifer. This study applied the modified DRASTIC method to two study areas in Estonia with heterogenous Quaternary sediments. The results were compared to the original DRASTIC method and a groundwater vulnerability assessment method used formerly in Estonia. The results significantly improved with the modified version compared to the original method. The modified method also exhibited stronger correlations with nitrate concentration data, illustrating the higher accuracy of the modified DRASTIC method in vulnerability assessment in regions with confined aquifers. The results highlight the significance of modifying the vulnerability assessment methods according to regional geological conditions to evaluate groundwater vulnerability accurately and support informed decision-making in groundwater management and protection.

1. Introduction

Groundwater is a crucial resource that plays a fundamental role in sustaining ecosystems and supporting human activities. Precise groundwater vulnerability assessment is needed for the management and protection of groundwater. Using groundwater vulnerability maps, areas most vulnerable to pollution can be delineated to support informed decision making and protect the resource [1].
The DRASTIC method, developed by the U.S. Environmental Protection Agency [2], is one of the most used techniques for assessing groundwater vulnerability. The DRASTIC method uses seven parameters in order to determine the vulnerability: the depth to groundwater table, net recharge, aquifer media, soil media, topography, impact of the vadose zone, and hydraulic conductivity [2]. The original DRASTIC method has been applied by many authors to create vulnerability maps [3,4,5], but the accuracy of the method has been further improved through modifications [6,7,8]. Furthermore, additional parameters, e.g., the fractured media parameter [9], land use [8], and anthropogenic influence [10], have been introduced to the DRASTIC vulnerability index calculation.
However, existing studies mainly focus on assessing groundwater vulnerability in unconfined aquifers [4,11,12], while relatively few studies address the complex hydrogeological situation of confined aquifers [13,14,15]. In regions where the main useful aquifer is confined, a modification to the DRASTIC method is needed to achieve an accurate vulnerability assessment [13,15]. In regions where the aquifer is confined, an impermeable layer is a natural shield against the influx of pollutants. In such areas, the modification of the DRASTIC method has a critical role, as the properties and the thickness of the confining layer are the main factors in defining the vulnerability. The traditional DRASTIC method has limitations when applied to confined aquifers, as these parameters are not considered.
Quaternary deposits often act as a confining layer covering the main useful aquifer in Estonia. In some cases, the piezometric head is above ground level, leading to artesian areas and spring outflows. Because of the higher level of hydraulic pressure in the first bedrock aquifer, these areas are well protected. However, according to the original DRASTIC method, these areas might be classified as unprotected, due to the piezometric head near the ground surface. Furthermore, due to the heterogeneity of the deposits, areas with Quaternary sediments are prone to water quality issues [16], causing a need for precise vulnerability assessment methods to delineate regions most vulnerable to pollution. Therefore, a new modified DRASTIC method has been proposed for a more accurate assessment of the vulnerability in such areas [13,15]. Three parameters related to the properties of the confining layer have been incorporated into the method.
In this paper, the modified DRASTIC for improved vulnerability assessment was applied in Estonia. Two study areas with different Quaternary sediment cover types were selected to highlight the heterogeneity of the sediments. For comparison, maps were developed using the original DRASTIC method and the existing vulnerability maps using a former methodology for local geological conditions. Additionally, nitrate concentration data was used to validate the accuracy of the obtained maps.

2. Materials and Methods

2.1. The Study Area

Geologically, Estonia is located on the slope of the crystalline Baltic Shield, which is composed of Paleoproterozoic gneisses and migmatites of the Svecofennian orogenic complex and slopes southwards at about 3–4 m km–1. The basement rocks are overlain by sedimentary rocks and Quaternary deposits. The sedimentary cover of Estonia is composed of terrigenous and carbonate rocks belonging to the Ediacaran, Cambrian, Ordovician, Silurian, and Devonian systems.
Quaternary deposits consist predominantly of glacial, glaciolacustrine, and glaciofluvial deposits of the Pleistocene Series formed during the last glaciation [17]. The continental glacier retreated from the Estonian territory between 15 to 13 ka B.P. [18]. This period is known for the widespread distribution and activity of glacial flows. Different landforms and deposits were left behind by retreating glaciers, composed of glaciofluvial sands and gravels, glaciolacustrine clays and sands, glacial moraine sediments, and alluvial sediments and sediments of bogs [19]. The thickness of the Quaternary sediments is typically less than 5 m in northern Estonia and more than 10 m in southern Estonia. Exceptionally, they exceed 100 m in the Haanja and Otepää heights and the buried valleys. Hydrogeologically, terrigenous and carbonate Palaeozoic and Proterozoic rocks form five major aquifer systems in Estonia (Cambrian–Vendian, Ordovician–Cambrian, Silurian–Ordovician, Middle–Lower Devonian, and Middle Devonian), which are separated from each other with aquitards.
To modify and test the DRASTIC methodology, two map sheets of the Estonian geological base map (Rapla and Võru; [20]) were selected as study areas, whereas groundwater vulnerability maps have been previously compiled based on the mapping guidelines of the Land Board [21]. Both areas were used to test the modified DRASTIC methodology as they comprise various types and thicknesses of Quaternary sediments. In the Rapla area, a thin sediment layer covers the Silurian–Ordovician aquifer system, consisting of carbonate rocks. On the other hand, in the Võru region, thick Quaternary sediments are spread, under which the terrigenous Middle Devonian aquifer system spreads. Thus, the current study was performed in central and southeastern Estonia (Figure 1) within the Rapla and Võru base map sheets (625 km2), representing different geological settings and resulting groundwater vulnerability. The climate is moderately cool and humid in Estonia, with the average annual precipitation around 500–750 mm. Net recharge varies from 10 to 300 mm/year [22].
In the central part of Estonia, Quaternary deposits cover the limestones and dolomites of the Ordovician and Silurian ages. Those carbonate rocks form the first bedrock aquifer (Silurian–Ordovician aquifer system), which is widely utilised for water supply. The uppermost part of the aquifer forming limestones and dolomites is often fractured and karstified to the depth of 30 m and, therefore, characterised by active water exchange. The hydraulic conductivity of the aquifer system varies from 10 to 50 m/d, and the piezometric head is 30–60 m.a.s.l. [23]. The Quaternary sediments have an average thickness of less than 5 m within the Rapla area. Areas with a thin layer of sediments (<1 m) make up about 16% of the map sheet. Thicknesses up to 70 m are present in buried valleys [24]. In those areas where the Quaternary cover is missing or thin, the phreatic groundwater in underlying carbonate rocks is weakly protected against surface pollution [23]. In areas where the clayey Quaternary sediments are thick, the groundwater in the bedrock aquifer is confined, the piezometric head is above the bedrock surface, and the groundwater is less vulnerable.
The Devonian sand- and siltstones form the first bedrock aquifer in southern Estonia [23]. The Võru base map sheet represents the area where the first bedrock aquifer is the Middle Devonian aquifer system, which is recharged by precipitation infiltrating through the Quaternary aquifer, mainly from the Haanja, Karula and Otepää highlands [25]. The Quaternary cover of the Võru area consists mainly of moraines and glaciofluvial sediments (Figure 1). The Võru valley is located in the central part and the Haanja upland on the southern part of the map sheet. The Haanja upland represents a hilly moraine relief, where on the flat roofs of the hills, the moraine is sometimes covered by glaciolimnical sands and clays. In the northern part of the study area, on the moraine plain, sediments with a thickness of 1–20 m are spread. The thickness of the Quaternary sediments is 100–190 m in the highest part of the Haanja upland and decreases to 50–60 m on the slopes. In the Võru valley, the Quaternary sediments have a thickness of 60–80 m [25]. In cases where the piezometric head is higher than the bedrock surface, the aquifer is considered confined, and this restricts the movement of contaminants into the aquifer. Within the Võru base map sheet, the Middle Devonian aquifer system is overlain by a thick layer of moraine and clays, making the groundwater confined in most of the study area.

2.2. Groundwater Vulnerability Assessment in Estonia

In Estonia, the Water Act [26] defines five groundwater vulnerability classes for the first bedrock aquifer, the primary aquifer for water supply. Heterogenous Quaternary sediments cover the main useful aquifer, and therefore, the assessment of groundwater vulnerability relies on the thickness and properties of the deposits.
Areas classified as unprotected include karst regions and areas where up to 2 m thick moraine or up to 20 m of sand/gravel covers the aquifer. Similarly, if the moraine layer is 2–10 m thick, the sand/gravel 20–40 m, or the aquifer is covered by a clay layer up to 2 m, the region is considered weakly protected. Medium-protected areas are covered by a moraine layer with a thickness of 10–20 m or a clay layer with a 2–5 m thickness. If the moraine layer has a thickness of 10–20 m or if the clay layer is 2–5 m thick, the area is delineated as relatively protected. In the Water Act, only locations where a regional aquitard covers the aquifer are considered protected.

2.3. The DRASTIC Method

The DRASTIC method is one of the most popular methods to assess groundwater vulnerability to pollution [2]. The DRASTIC method uses seven parameters in order to determine the vulnerability of groundwater (Table 1): the depth to groundwater table, net recharge, aquifer media, soil media, topography, impact of the vadose zone, and hydraulic conductivity [2].
Each parameter is assigned to a range or sediment types based on the influence on contamination potential. The rating ranges from 1 to 10, with 1 being the lowest vulnerability and 10 the highest [2]. The DRASTIC vulnerability index is a result of a sum of all seven parameters multiplied by their weights to balance their significance [1]:
D i = J = 1 7 W j × R j ,
where Di presents the vulnerability index for a mapping unit, Wj stands for the weight of parameter j, and Rj represents the rating of parameter j. A higher vulnerability index indicates a greater risk of groundwater contamination.
Classifications for the resulting vulnerability indexes are established based on their values, e.g., divided into five classes which have equal intervals [11,27,28]. Hamza et al. [9] propose a categorisation by dividing the vulnerability index values into five equal classes using the percentage range: “very low” (10.00–28.99), “low” (29.00–46.99), “medium” (47.00–64.99), “high” (65.00–82.99) and “very high” (83.00–100).

2.4. The Modified DRASTIC Method

In regions where the main useful aquifer is covered by a confining layer, e.g., in areas with a Quaternary sediment cover, a modification to the DRASTIC method is needed, as the original method does not consider the characteristics and thickness of the confining layer [13,15]. Additionally, the method does not take into account the relationship between the piezometric head and the confining layer [15]. The aquifer is confined when the piezometric surface is above the bedrock, preventing the movement of the contaminant to the aquifer.
The modified DRASTIC method was developed in order to enhance the accuracy of vulnerability maps within regions characterised by a confining layer [15]. The method incorporates modified versions of three parameters of the DRASTIC method, specifically those influenced by the Quaternary layer: the depth to groundwater table (D), the soil type (S), and the impact of the vadose zone (I) parameters. However, it is worth noting that the net recharge (R), aquifer media (A), topography (T), and hydraulic conductivity (C) parameters remain unchanged, as they are universally applicable and not influenced by specific geological conditions. The original and modified parameters, along with their respective weights, are detailed in Table 1, while Table 2 provides information on the parameter ranges and ratings.
The modified D-parameter characterises the piezometric surface of the main useful aquifer in relation to the bedrock surface. A piezometric head above the bedrock surface prevents pollutants’ movement and increases the area’s protection. The vulnerability rating of the parameter is lower if the piezometric head is above the bedrock and higher if below the bedrock surface. Table 2 shows the ranges to assess the modified D-parameter.
The modified S-parameter represents the Quaternary sediment types and their effect on the pollution potential. A new weight of 5 was incorporated for the parameter to enhance its importance. The modified I-parameter replaces the properties of the vadose zone parameter and describes the Quaternary sediments’ thickness. The assessment ranges for the new S- and I-parameters are shown in Table 2.
The natural vulnerability index of the aquifer covered by a Quaternary layer can be calculated using the Equation (2) [15]:
D i = D × 5 + R × 4 + A × 3 + S × 5 + T × 1 + I × 5 + C × 3
where Di represents the vulnerability index for a specific mapping unit, with the following variables: D for the depth to groundwater, R for net recharge, A for aquifer media, S for Quaternary sediment type, T for topography, I for the thickness of the Quaternary sediments, and C for hydraulic conductivity.

2.5. Data Sources

The Estonian Geological Base Map 1:50,000 [20] was the main geodatabase used for the assessment of groundwater vulnerability for most of the parameters (depth to groundwater table, aquifer media, soil media/Quaternary sediment type, and impact of the vadose zone/thickness of the Quaternary). The net infiltration map of Estonia [22] was used for the net infiltration parameter. Digital elevation models (DEM) with a resolution of 10 m from Lidar data [29] were used for the topography parameter. The coordinate system for the collected data is the Estonian Coordinate System of 1997.

2.6. Defining Vulnerability Classes

The final values of the modified DRASTIC method’s vulnerability index (Di) resulted in a range from 51 to 225. The values were classified into five quantile classes (Table 3) using the method by Hamza et al. [9], which was aligned with the regulation defined in the Estonian Water Act [26]. The adjustment included assigning the lowest vulnerability class to values from 0% to 10% of the vulnerability index values. “Relatively well protected” received values from 10% to 28%, “moderately protected” from 29% to 46%, “weakly protected” from 47% to 64%, and “unprotected” from 65% to 100%.

2.7. Validation

The Spearman correlation coefficient was used to assess the extent of correlation between the vulnerability assessment outcomes derived from the DRASTIC method and the nitrate concentration. The Spearman’s rank correlation coefficient stands as a nonparametric statistical metric that quantifies the strength of the relationship between two datasets [29] and is calculated using Equation (3):
ρ = 1 n 1 n d 2 n n 2 1 ,
where ρ is the Spearman’s rank correlation coefficient, d represents the difference between the two ranks of each observation, and n is the number of observations. For validation with the nitrate concentration, nitrate concentration data from 59 wells in Rapla and 193 wells in Võru were used from the Estonian Nature Information System database [30]. R Studio was used to calculate Spearman’s correlation coefficient [31].

2.8. Sensitivity Analysis

Sensitivity analysis is used to assess the contribution of the input parameters to the modelling outcomes. In the assessment of parameters within the DRASTIC method, two approaches are used: single parameter [32] and map removal sensitivity analysis [33].
Within the scope of the single parameter sensitivity analysis, each parameter’s influence on the overall vulnerability index calculation is analysed. The theoretical weight of the parameter is compared to the calculated effective weight. For each pixel of the map, the effective weight (Wpi) is computed by Equation (4):
W p i = P R i P W i D i × 100
where Pri is the rating, PWi is the weight of the parameter, P, assigned to the pixel, i, and Di is the vulnerability index.
Map removal sensitivity analysis evaluates the vulnerability map’s response to removing one or more parameters from the analysis [33]. This analysis determines the necessity of incorporating each of the DRASTIC parameters. The sensitivity measure, S, of a parameter is computed using Equation (5):
S = V N   V   n V × 100
where V is the original vulnerability index, and V′ represents the perturbed index; N and n are the number of parameters employed to calculate V and V′, respectively. The original vulnerability index is calculated using all seven parameters of the DRASTIC method, while the perturbed one is computed with fewer parameters.

3. Results and Discussion

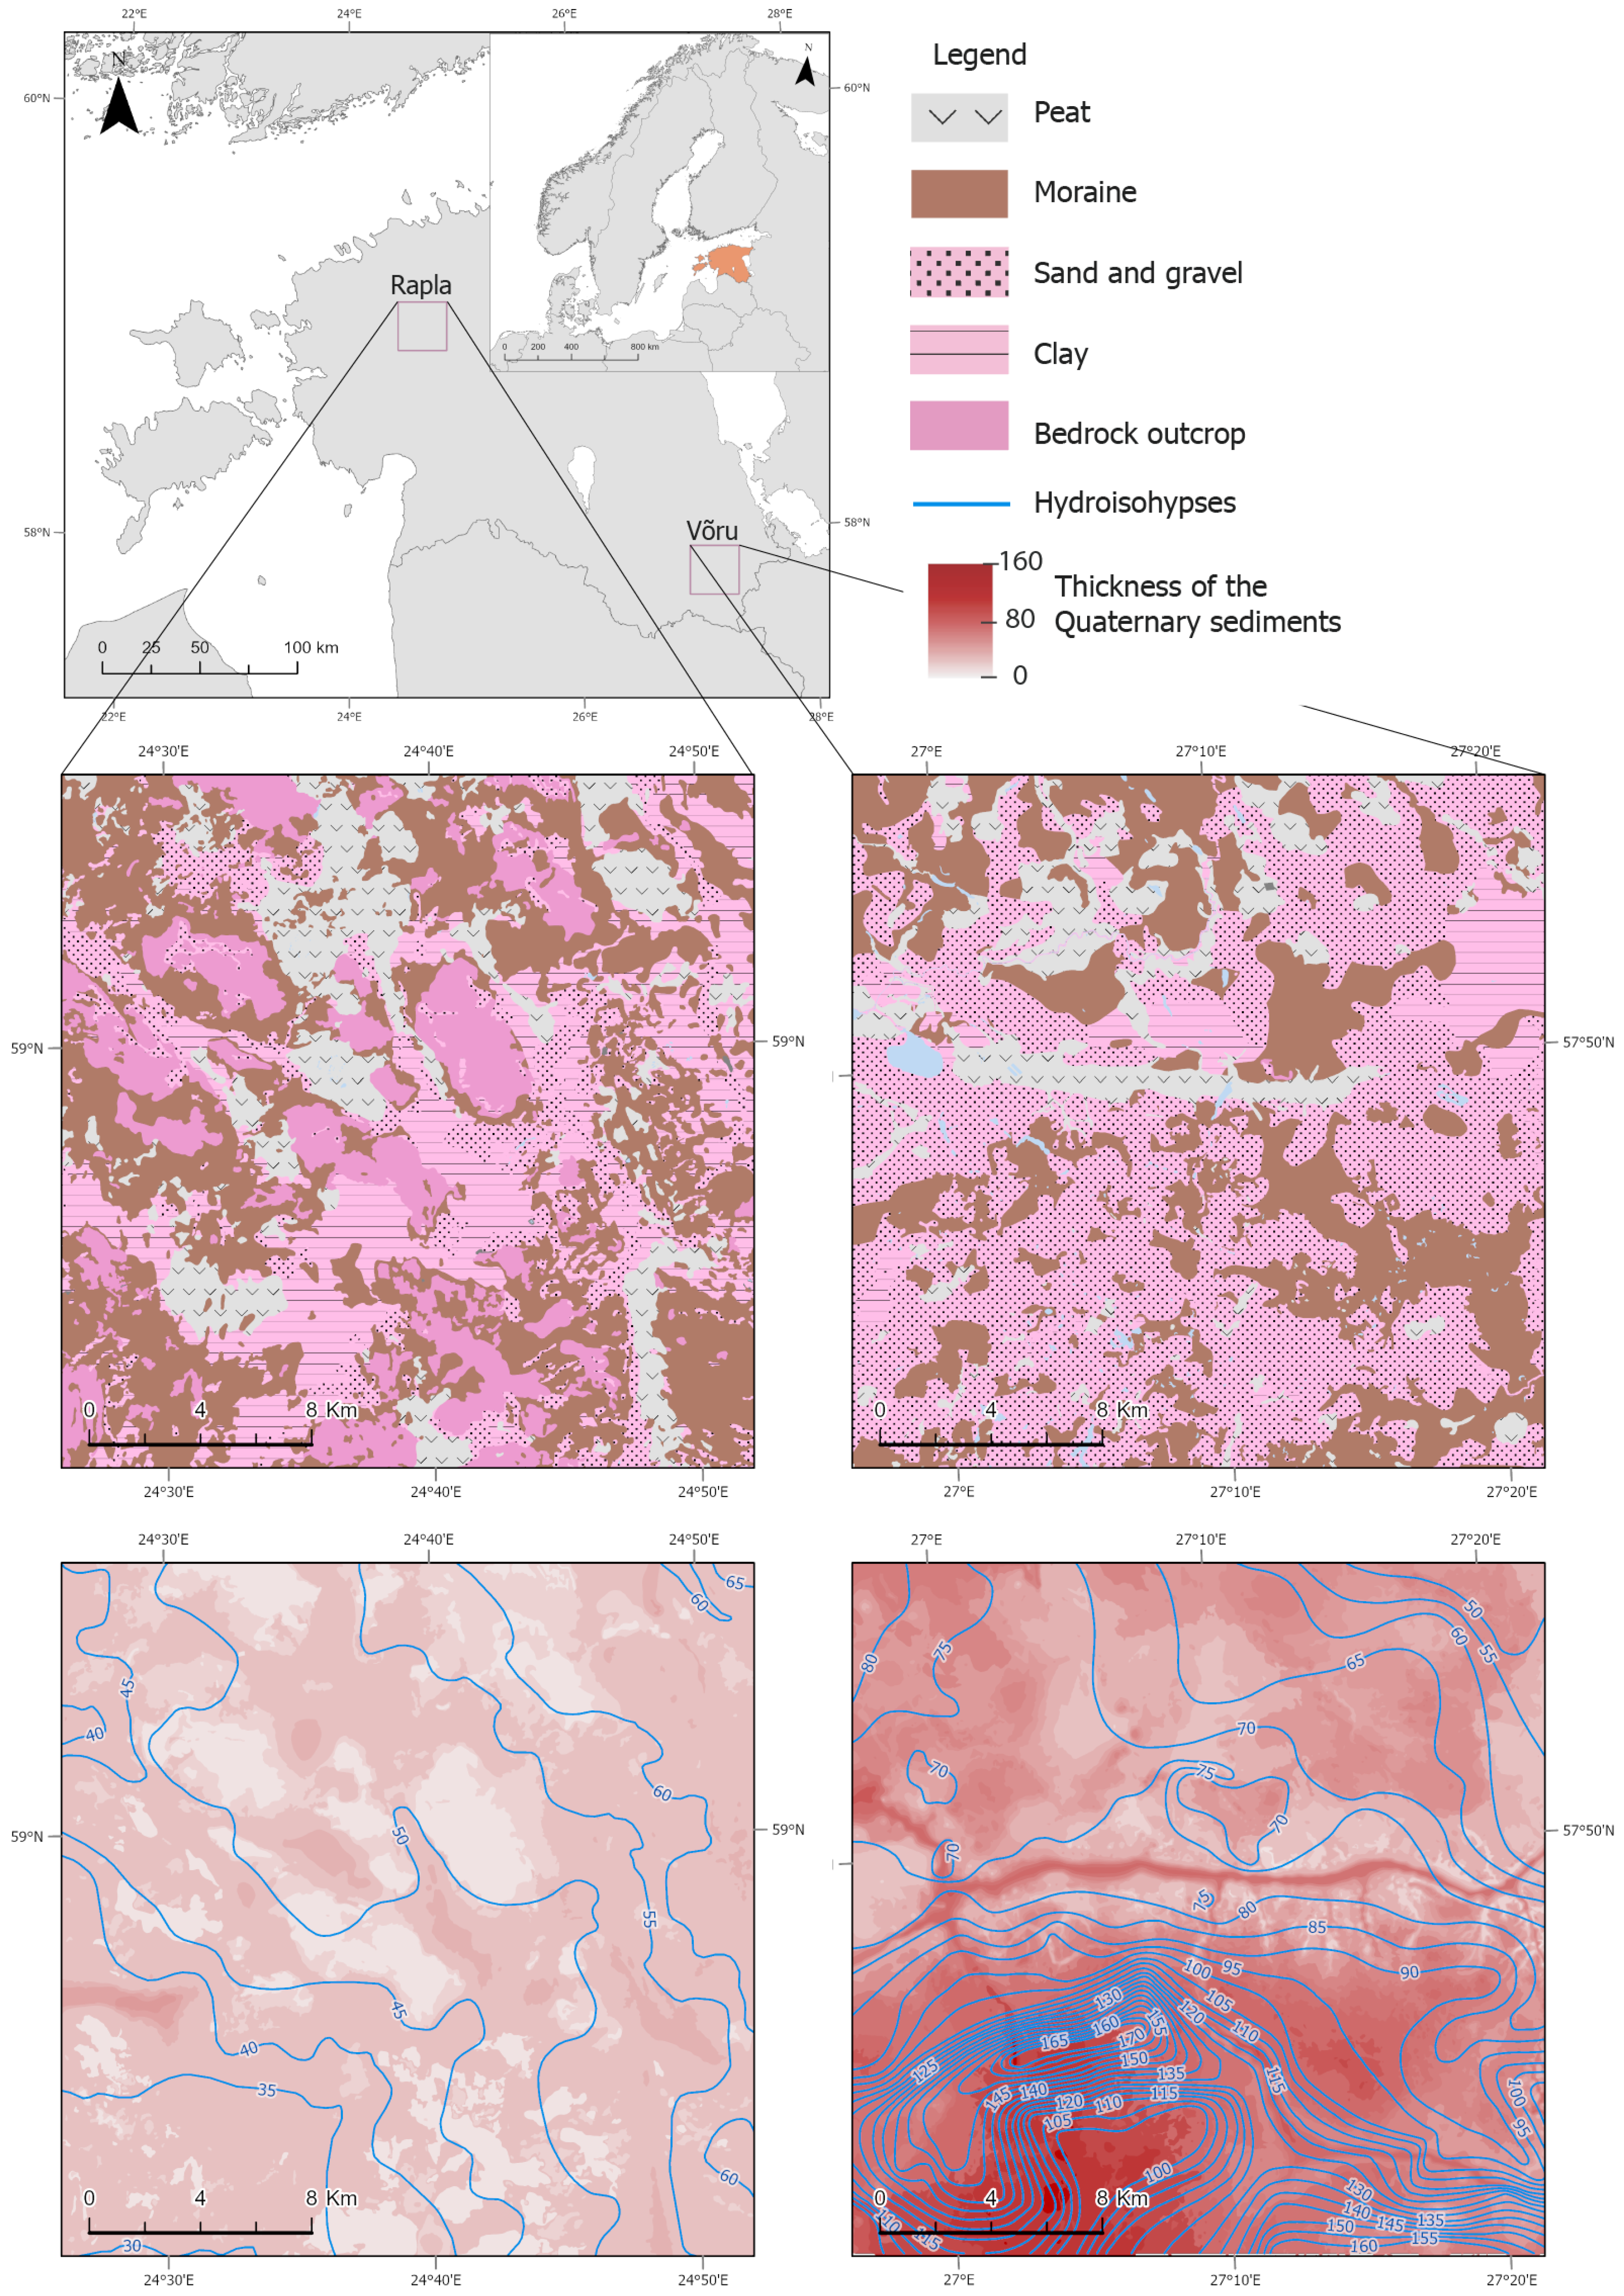
3.1. Vulnerability Maps

Therefore, in this paper, the modified DRASTIC method for improved vulnerability assessment was applied in Estonia. Two study areas with different Quaternary sediment cover types were selected to highlight the heterogeneity of the sediments. For comparison, maps were developed using the original DRASTIC method and the existing vulnerability maps using a former methodology for local geological conditions. Thirdly, nitrate concentration data was used to validate the accuracy of the obtained maps.
The modified DRASTIC method was used for the vulnerability assessment of the first bedrock main useful aquifer in two regions in Estonia: Rapla and Võru. In addition, for comparison, maps were developed using the original DRASTIC method. Thirdly, the existing vulnerability maps by a former methodology of groundwater vulnerability assessment in Estonia were used for comparison. The percentages of the five vulnerability classes of the resulting maps are given in Table 4.
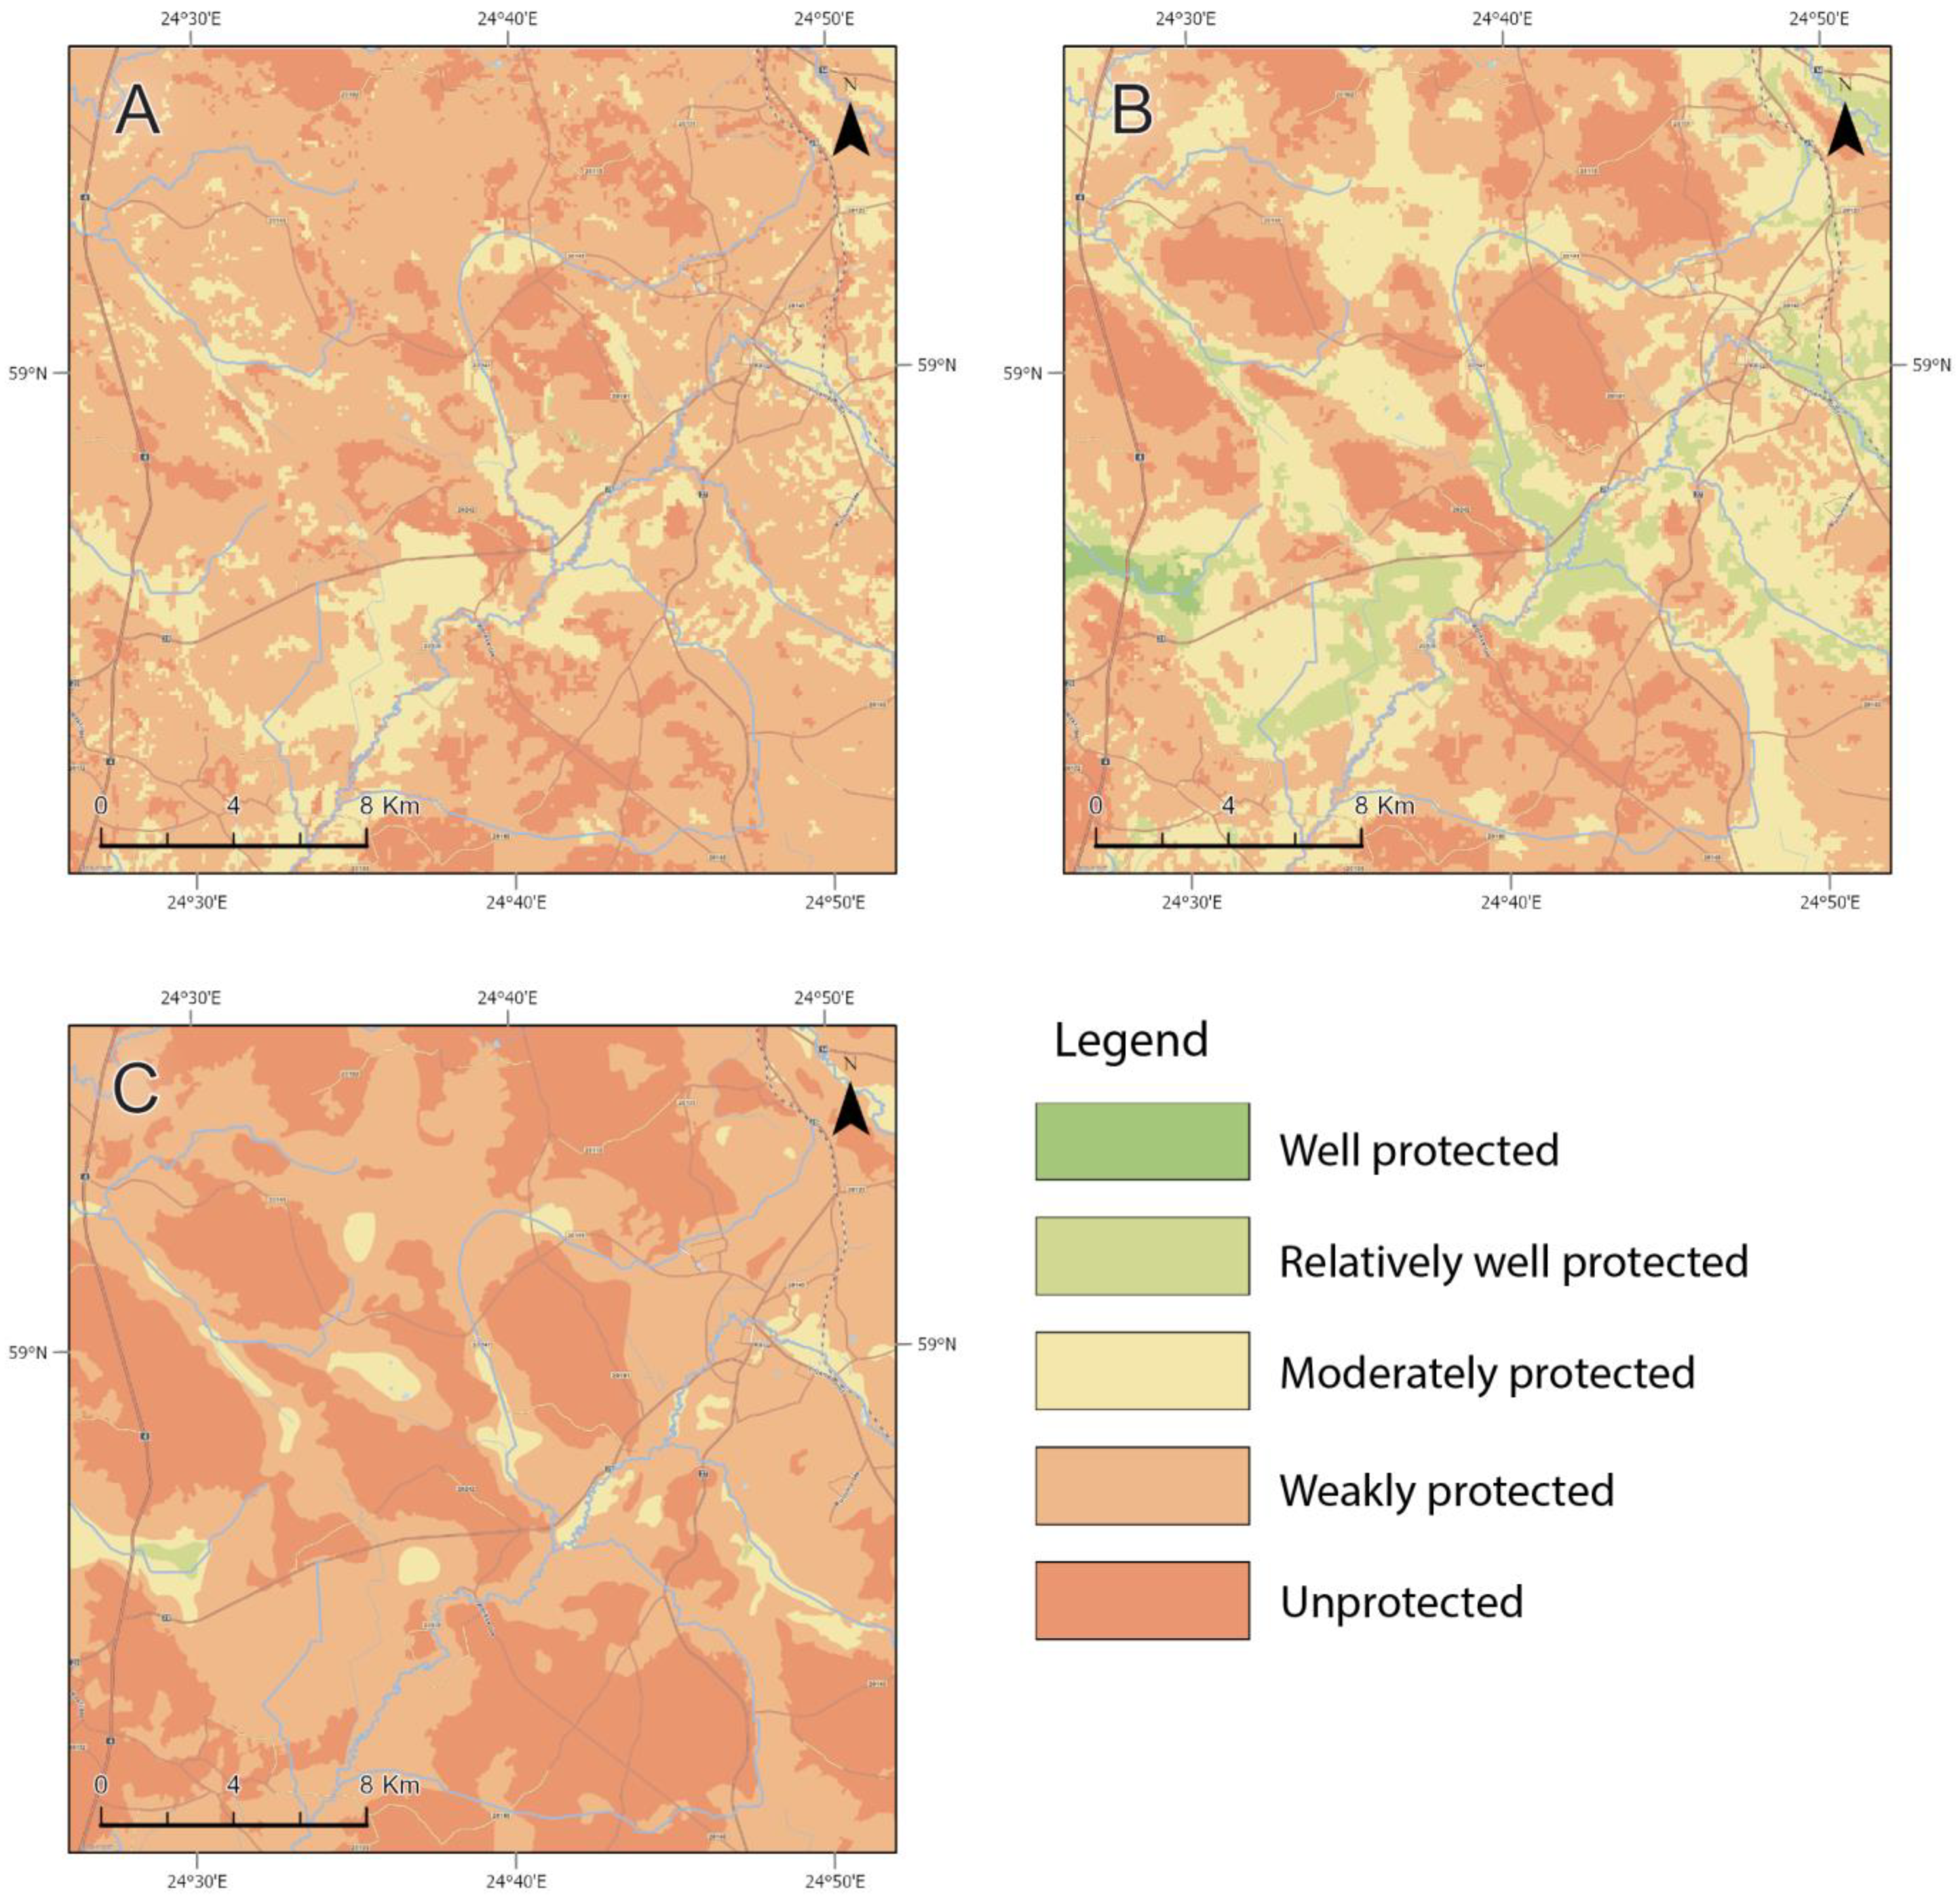
The vulnerability map generated using the modified DRASTIC method for the Rapla area indicates that approximately 0.5% of the area is classified as well protected, areas characterised by more than 15 m of Quaternary sediments and by clays, offering protection to the aquifer (Figure 2). Relatively well-protected areas make up 8.1% of the study area, consisting of more than 10 m of Quaternary sediments, often including clays. Additionally, the modified method delineates areas of artesian overflow as well protected or relatively well protected. The area is covered by moderately protected areas in 30.7%, consisting of either peat or more than 5 m of moraine sediments. Weakly protected areas cover 42.1% of the Rapla area in areas, with less than 5 m of moraine and sands, which offer limited protection to the aquifer. Lastly, 18.5% of the study area is unprotected and highly vulnerable, characterised by less than 2 m of moraine.
In contrast, the assessment using the original DRASTIC method shows that 0.1% of the study area is relatively well protected. These areas consist of clay and have deeper groundwater levels. Moderately protected areas, which are also in areas with clayey sediments, cover 16.6% of the area. Weakly protected areas make up 69.5% of the area. In these areas, the groundwater level is near the surface, and Quaternary sediments consist of moraine or peat. A smaller area of 13.8% is unprotected, where the Quaternary sediment layer is less than 1 m.
Furthermore, the Estonian vulnerability assessment method identifies 0.2% of the area as relatively well protected, 4.6% moderately protected, 52.9% as weakly protected, and 42.6% as unprotected.
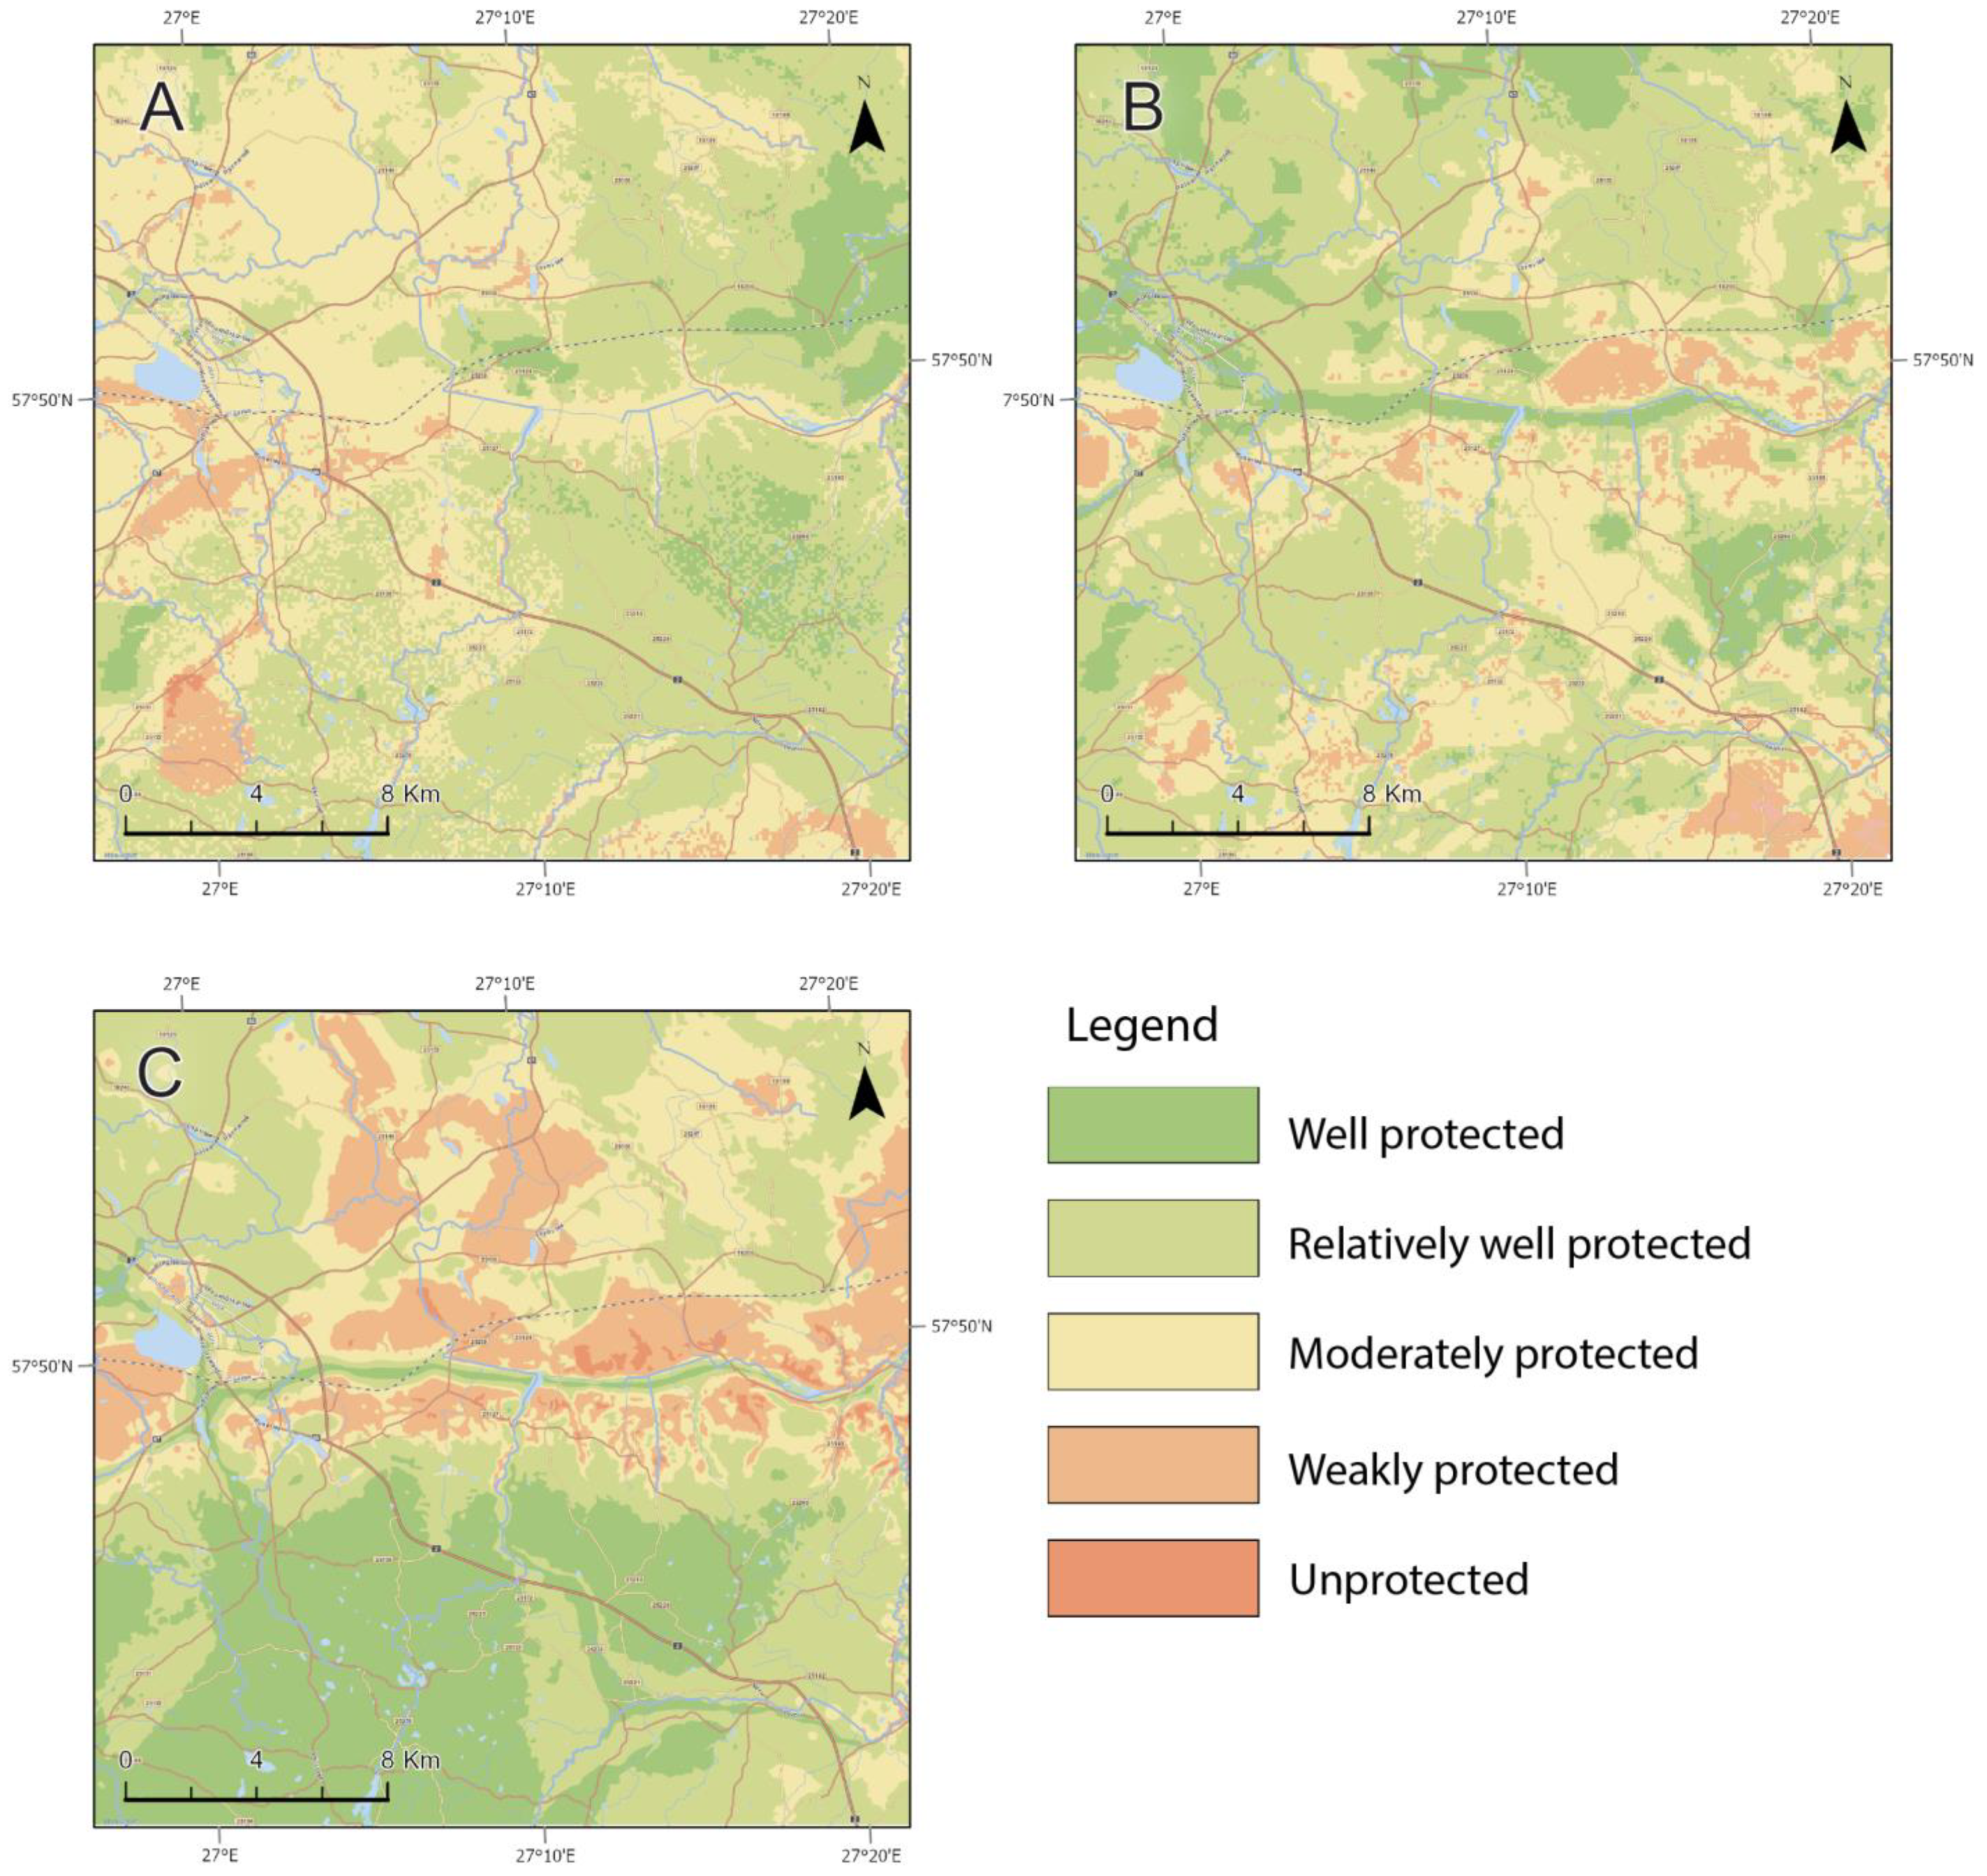
Secondly, the vulnerability assessment using the modified DRASTIC method was conducted in the Võru study area (Figure 3). Well-protected areas make up 12.5% of the study area, characterised by artesian overflow and more than 15 to 20 m of Quaternary sediments. Relatively well-protected areas cover 53.8% of the area, where Quaternary sediment cover consists of thick layers of sand. Moderately protected regions account for 27.4% of the area. Weakly protected areas, consisting of less than 5 m of clay, make up 5.9% of the area. Only a small portion, 0.2% of the area, is unprotected, with only a thin Quaternary sediment layer covering the aquifer.
Using the original DRASTIC method, 7.4% resulted as well protected, 46.8% relatively well protected, 40.5% moderately protected, 5.2% weakly protected, and 0.1% unprotected. Comparatively, the Estonian method identified 26.1% of the area as relatively well protected, 37.5% as moderately protected, 52.9% as weakly protected, and 42.6% as unprotected.
The vulnerability assessment results obtained by the modified and original DRASTIC methodologies demonstrate a significant improvement with the modified version. Both in the Rapla and Võru study area, the modified DRASTIC method categorises a higher percentage of areas as well protected and relatively well protected, with 8.6% in Rapla and 66.4% in Võru, compared to the original method, which shows 0.1% and 54.2%, respectively (Table 4). This outcome is caused by the Quaternary sediments protecting the first bedrock aquifer and making it confined.
Additionally, the modified method identifies more unprotected areas in Rapla (18.5%) compared to the original method (13.8%), and the trend can also be seen on the Estonian method map (42.6%). Moreover, the modified groundwater vulnerability map shows a higher resemblance to the map by the former Estonian vulnerability assessment method, indicating improved accuracy in representing the vulnerability in the region.

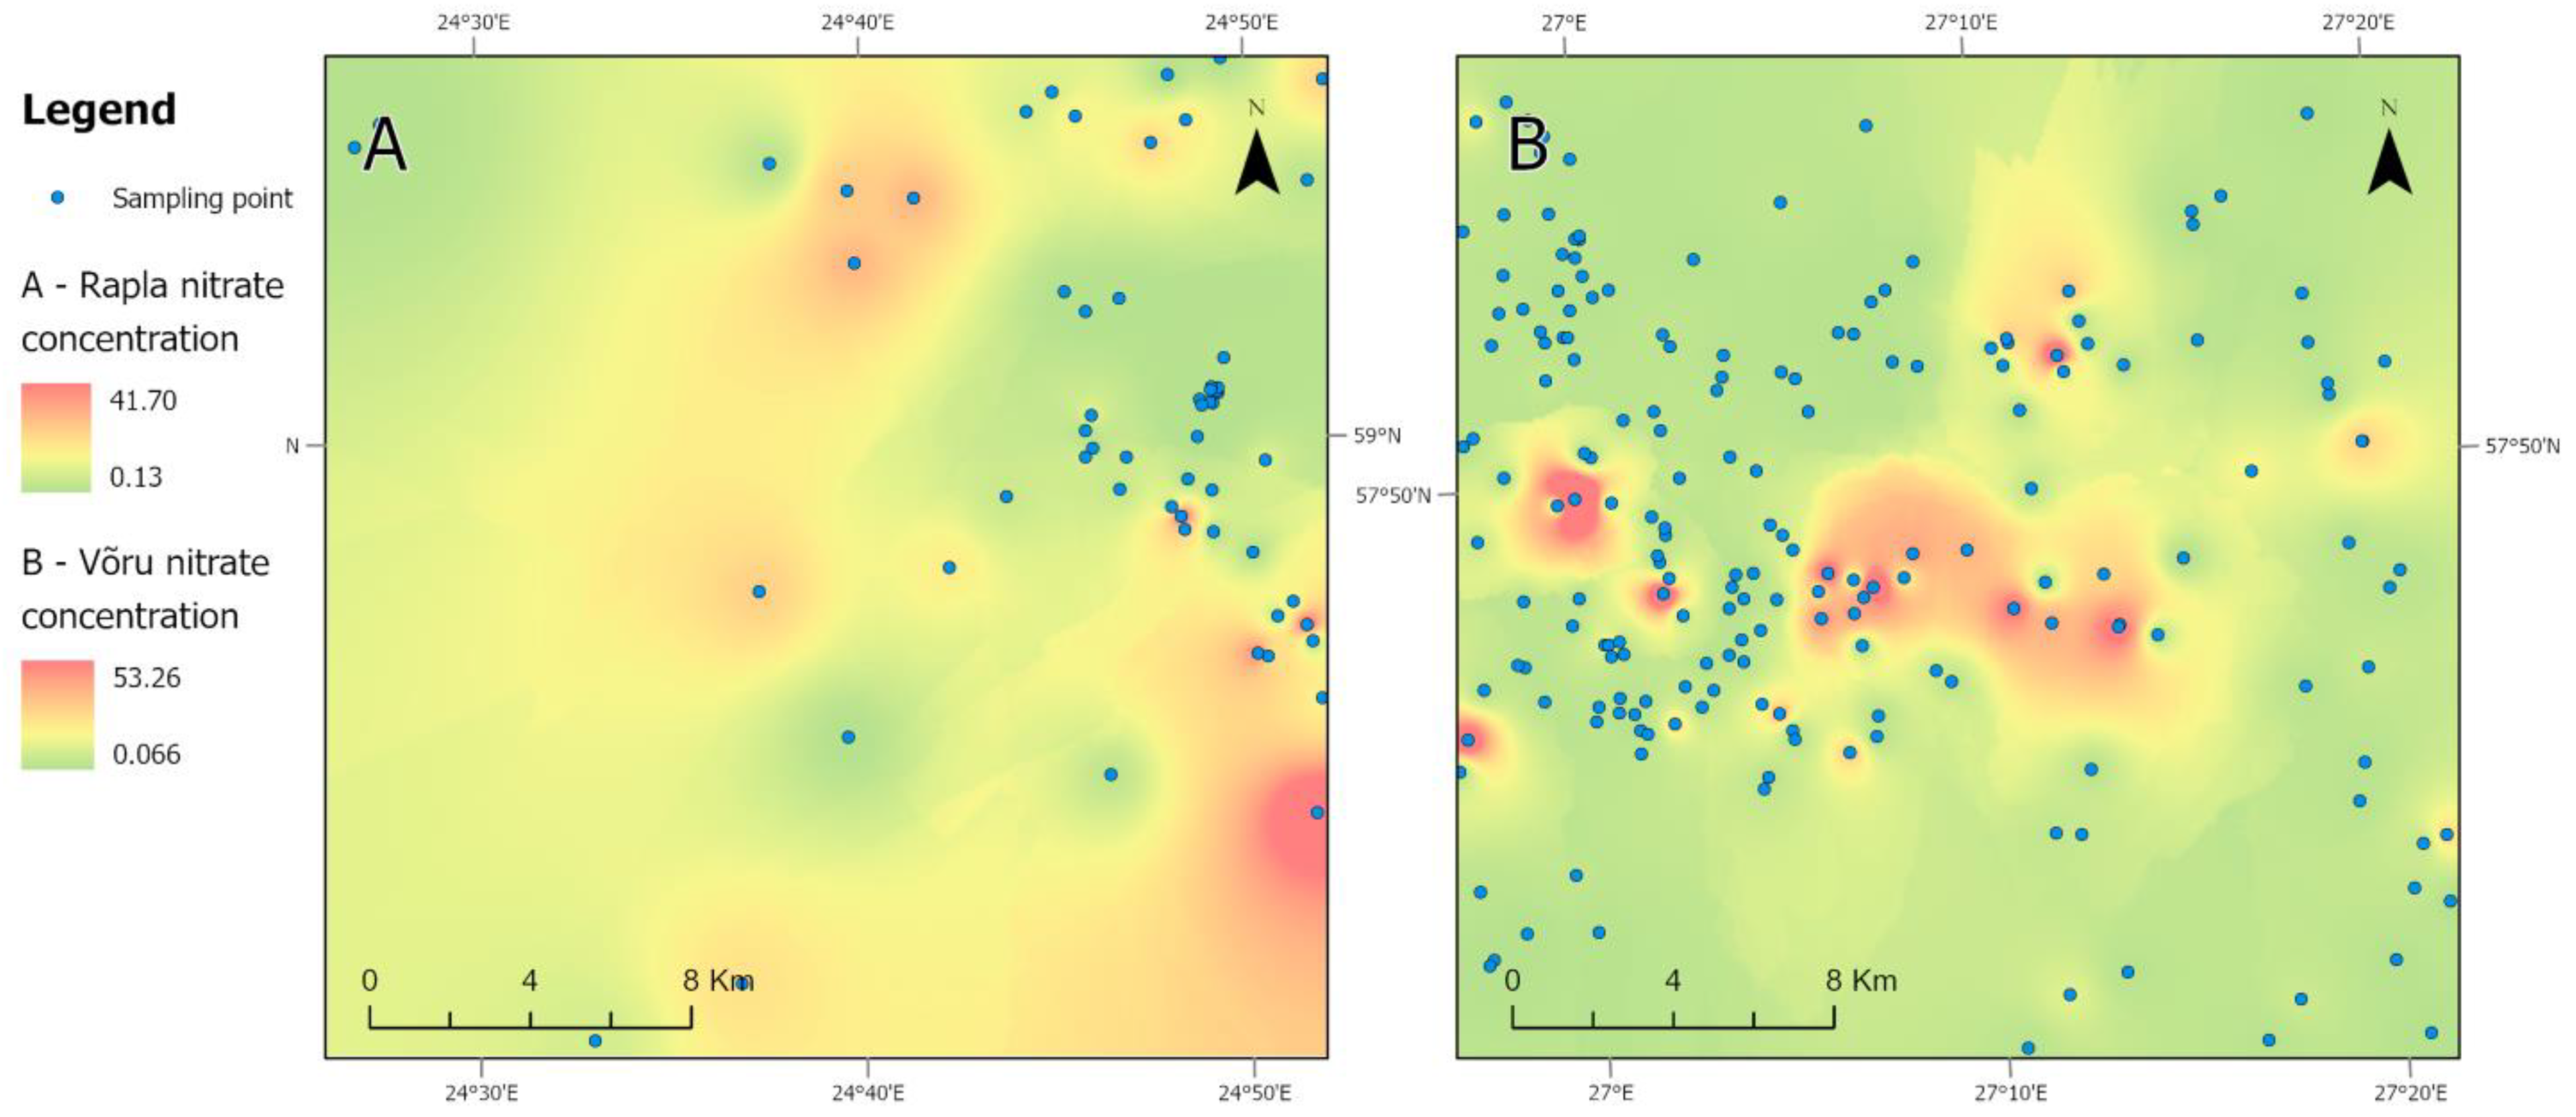
3.2. Validation by Using Nitrate Values

To validate the modified DRASTIC method, the nitrate concentration (NO3) in groundwater was used (Figure 4). Nitrate concentration serves as a vital indicator of groundwater pollution, as elevated nitrate levels are associated with contamination resulting from anthropogenic and agricultural activities [34]. Therefore, nitrate concentration is a reliable and commonly used parameter for validating groundwater vulnerability assessment results [7,27,28]. In Estonia, monitoring nitrate concentration is a crucial aspect of national groundwater quality assessment. Therefore, it is both a practical and relevant parameter for validating groundwater vulnerability assessments in the Estonian context. In addition to Estonia, nitrogen pollution is a pressing issue in the other Nordic and Baltic countries, therefore being a subject to extensive research and monitoring [35,36,37].
The extent of correlation between the vulnerability indices and the nitrate concentration was assessed using the Spearman correlation coefficient, due to the nonparametric nature of the data. The Spearman’s rank correlation coefficient is resistant to the influence of outliers and can capture various types of correlations, both linear and nonlinear. For the analysis, nitrate concentration data from 59 wells from Rapla and 193 wells from Võru were used to examine the relationship between calculated indices and nitrate concentration values. In Rapla, wells up to a depth of 20 m were chosen from the most cavernous upper part of the aquifer, where the hydraulic conductivity is the highest [23]. In Võru, wells up to a depth of 80 m were chosen, based on the thicker Quaternary sediments leading to predominantly deeper wells in the area.
The vulnerability maps of Rapla and Võru using the modified DRASTIC method were evaluated using the Spearman correlation method (Table 5). The results show a stronger correlation between the nitrate concentration and the modified DRASTIC map than the original DRASTIC map. However, it is worth emphasising that all the correlations observed in the analysis are relatively low in comparison with findings by other researchers [28,38,39]. Firstly, it can be attributed to lower pollution levels in both the Rapla and Võru regions, with only 43.6% of the area being used for agriculture, according to Corine Land Cover data [40]. Secondly, Estonia typically has a background level of zero nitrates in groundwater. Any detectable nitrate concentration is considered an anthropogenic input, making nitrate concentration an especially sensitive pollution indicator in this context. Thirdly, as the nitrate concentration is extensively monitored in Estonia, the database of observations is high, which contributes to the high level of points in areas where the vulnerability index indicates a higher level of vulnerability, yet no nitrate pollution is present.

3.3. Sensitivity of the DRASTIC Method

Table 6 shows a statistical overview of the parameters which were used in the modified DRASTIC method calculations in Rapla and Võru. The statistical summary revealed that the primary contributors to the groundwater contamination risk are the topography (T), the aquifer media (A), and the thickness (I) and type (S) of the Quaternary parameters.
According to the coefficient of variation (CV%) analysis, the depth to groundwater table (D) parameter has the largest contribution to the variation in the overall index in Võru (94.4%). This emphasises the need to modify the parameter to ensure a precise vulnerability assessment, especially in complex hydrogeological areas, with an occasionally confined aquifer. In Rapla, the depth to groundwater table (D) parameter also significantly contributes to the variation (52.4%), supporting the need for modifications. Furthermore, in Rapla, the greatest variation in the vulnerability index is due to the net recharge (R) parameter (56.3%), which can be attributed to the low-resolution data available. The second highest contribution in Võru (69.4%) is due to the thickness of the Quaternary layer, highlighting the significance of modifying the method to account for the specific properties of the overlying Quaternary aquifer.

3.3.1. Single-Parameter Sensitivity Analysis

A single-parameter sensitivity analysis was conducted to assess each parameter’s influence. This analysis compares the effective weight (using Equation (4)) assigned in the study area to each parameter to the theoretical weight assigned to the parameters by the modified DRASTIC method in Equation (2). By looking at the effective weights in relation to their theoretical weight, we gain a better understanding of which parameters have the highest influence on the vulnerability of the study area. The results (Table 7) reveal that certain parameters have higher weights compared to the theoretical contributing to the vulnerability index in the study area. Specifically, in Rapla, the thickness of the Quaternary (I) parameter has a substantial weight (27.3%) because the thickness of the layer is thinner, and therefore the mean effective weight of the I-parameter is higher than the theoretical weight. Conversely, in Võru, the sediment layer is thicker and makes the area more protected, and therefore the mean effective weight of the I-parameter is lower than the theoretical weight. Additionally, in Võru, the Quaternary sediments (S) parameter shows a significant weight (29.6%), which emphasises the heterogeneous nature of the Quaternary sediments in the regions.
Remarkably, both the Rapla and Võru vulnerability maps have a theoretical weight higher than the depth to groundwater table (D) parameter’s effective weight. This observation suggests the abundance of regions where the piezometric head is making the aquifer confined and protected against pollution by being above the bedrock surface. In Rapla, the effective weight of the net recharge parameter is substantially lower than the theoretical, due to the low recharge rate in the area.
High variation in the effective weights in both the parameters describing Quaternary sediments indicates the highly varying nature of the sediments. This emphasises that in the DRASTIC calculation, it is important to consider detailed information about the Quaternary deposits. The modified DRASTIC method’s ability to account for such variability is a notable improvement, as it enables the assessment of vulnerability in areas where the Quaternary layer confines the aquifer. In these cases, the properties of the confining layer define the vulnerability, which further justifies the necessity for the modification of the DRASTIC method. As illustrated by the obtained vulnerability maps, the modified DRASTIC method aligns more accurately with the underlying geological map, which enhances the method’s reliability and underscores its capacity to provide a more precise representation of vulnerability patterns within the study area.

3.3.2. Map Removal Sensitivity Analysis

In order to conduct the map removal sensitivity analysis for the modified DRASTIC model, one parameter layer was excluded at a time (Table 8). In Rapla, the parameter showing the most substantial variation was the thickness of the Quaternary sediments layer (I), with a 2.16% variation. This variation can be attributed to the relatively thin Quaternary layer contributing to a high contamination risk. Conversely, in Võru, the highest variation index (2.74%) was contributed by the Quaternary sediment type (S) parameter, due to the presence of sands with a higher contamination risk. These results emphasise the role played by the parameters describing the attributes of the Quaternary sediments overlying the aquifer in determining the vulnerability.
Additionally, the parameters with the least variability were excluded, one at a time, in accordance with the findings of the map removal analysis conducted individually for each parameter. This process resulted in inconsistent outcomes (Table 9), demonstrating the significance of each parameter in the assessment process. Excluding parameters could potentially lead to incomplete and inaccurate vulnerability maps.

4. Conclusions

The present study aimed to apply the improved vulnerability assessment, the modified DRASTIC method, to accurately estimate groundwater vulnerability in areas with confined aquifers due to overlying Quaternary sediments in Estonia. The paper focuses on two distinct study areas with different Quaternary sediment cover types, highlighting the heterogeneous nature of the sediments.
The results demonstrate a significant improvement in groundwater vulnerability mapping using the modified version of the DRASTIC method compared to the original version. In both the Rapla and Võru study areas, the modified method categorised a higher percentage of areas as well protected and relatively well protected than the original method. This outcome was attributed to the protective nature of the Quaternary sediments, making the first bedrock aquifer confined and therefore contributing to improved groundwater protection.
Additionally, the modified method identified more unprotected areas in Rapla than the original method, even more so when compared to the vulnerability map generated using a methodology for local geological conditions. The modified groundwater vulnerability map also demonstrated a higher alignment with the map using the previous Estonian vulnerability assessment method, illustrating its improved accuracy in representing vulnerability in the region.
Furthermore, the correlation analysis between the nitrate concentration and vulnerability maps generated using the modified and original DRASTIC methods revealed a higher correlation with the modified version. However, it is important to note that all the observed correlations were relatively low, primarily due to the lower pollution levels in both the Rapla and Võru regions. With 43.6% of the area being used for agriculture, areas with a higher vulnerability index might not necessarily include nitrate pollution.
In conclusion, the application of the modified DRASTIC method demonstrated its effectiveness in achieving a more accurate assessment of groundwater vulnerability, particularly in areas with confined aquifers in Estonia. The results highlight the significance of modifying the vulnerability assessment methods according to regional geological conditions to evaluate groundwater vulnerability accurately and support informed decision-making in groundwater management and protection. The findings of this study contribute to improving groundwater vulnerability assessment methods in areas with a confined aquifer.

Author Contributions

Conceptualisation, M.M. and E.K.; methodology, M.M.; software, M.M.; validation, M.M. and E.K.; writing—original draft preparation, M.M. and E.K.; writing—review and editing, M.M. and E.K.; visualisation, M.M.; supervision, E.K. All authors have read and agreed to the published version of the manuscript.

Funding

The study has been funded by Iceland, Liechtenstein, and Norway through the EEA and Norway Grants Fund for Regional Cooperation project No. 2018-1-0137 “EU-WATERRES: EU-integrated management system of cross-border groundwater resources and anthropogenic hazards”.

Data Availability Statement

Not applicable.

Conflicts of Interest

The authors declare no conflict of interest.

References

  1. Gogu, R.C.; Dassargues, A. Current Trends and Future Challenges in Groundwater Vulnerability Assessment Using Overlay and Index Methods. Environ. Geol. 2000, 39, 549–559. [Google Scholar] [CrossRef]
  2. Aller, L.; Bennett, T.; Lehr, J.H.; Petty, R.J.; Hackett, G. DRASTIC: A Standardized System for Evaluating Ground Water Pollution Potential Using Hydrogeologic Settings; EPA 600/2-87-035; Environmental Research Laboratory, Office of Research and Development, US Environmental Protection Agency: Washington, DC, USA, 1987; p. 622. [Google Scholar]
  3. Kong, M.; Zhong, H.; Wu, Y.; Liu, G.; Xu, Y.; Wang, G. Developing and Validating Intrinsic Groundwater Vulnerability Maps in Regions with Limited Data: A Case Study from Datong City in China Using DRASTIC and Nemerow Pollution Indices. Environ. Earth Sci. 2019, 78, 262. [Google Scholar] [CrossRef]
  4. Ahmed, S.I.; Cheng, C.L.; Gonzalez, J.; Kang, J.J.; Ho, J.; Soto-Sanchez, L. Groundwater Vulnerability Assessment of Shallow Aquifer in the South Texas Sand Sheet Using a GIS-Based DRASTIC Model. Model Earth Syst. Environ. 2022, 8, 4075–4091. [Google Scholar] [CrossRef]
  5. Gonçalves, V.; Albuquerque, A.; Carvalho, P.; Almeida, P.; Cavaleiro, V. Groundwater Vulnerability Assessment to Cemeteries Pollution through GIS-Based DRASTIC Index. Water 2023, 15, 812. [Google Scholar] [CrossRef]
  6. Mallik, S.; Bhowmik, T.; Mishra, U.; Paul, N. Local Scale Groundwater Vulnerability Assessment with an Improved DRASTIC Model. Nat. Resour. Res. 2021, 30, 2145–2160. [Google Scholar] [CrossRef]
  7. Gupta, T.; Kumari, R. Assessment of Groundwater Nitrate Vulnerability Using DRASTIC and Modified DRASTIC in Upper Catchment of Sabarmati Basin. Environ. Earth Sci. 2023, 82, 216. [Google Scholar] [CrossRef]
  8. Zhang, Q.; Li, P.; Lyu, Q.; Ren, X.; He, S. Groundwater Contamination Risk Assessment Using a Modified DRATICL Model and Pollution Loading: A Case Study in the Guanzhong Basin of China. Chemosphere 2022, 291, 132695. [Google Scholar] [CrossRef] [PubMed]
  9. Hamza, S.M.; Ahsan, A.; Imteaz, M.A.; Ghazali, A.H.; Mohammed, T.A. GIS-Based FRASTIC Model for Pollution Vulnerability Assessment of Fractured-Rock Aquifer Systems. Environ. Earth Sci. 2017, 76, 197. [Google Scholar] [CrossRef]
  10. Albuquerque, T.; Roque, N.; Rodrigues, J.; Antunes, M.; Silva, C. DRASTICAI, a New Index for Groundwater Vulnerability Assessment—A Portuguese Case Study. Geosciences 2021, 11, 228. [Google Scholar] [CrossRef]
  11. Liu, M.; Xiao, C.; Liang, X. Assessment of Groundwater Vulnerability Based on the Modified DRASTIC Model: A Case Study in Baicheng City, China. Environ. Earth Sci. 2022, 81, 230. [Google Scholar] [CrossRef]
  12. Moustafa, M. Assessing Perched Aquifer Vulnerability Using Modified DRASTIC: A Case Study of Colliery Waste in North-East England (UK). Hydrogeol. J. 2019, 27, 1837–1850. [Google Scholar] [CrossRef]
  13. Yan, X.; Dong, W.; Li, R.; Cui, L.; Zhu, G. Assessment and Validation of Confined Aquifer Vulnerability Based on the VEBHAT Method: A Case Study in Heilongjiang Province, Northeastern China. Hydrogeol. J. 2019, 27, 2551–2561. [Google Scholar] [CrossRef]
  14. Nadiri, A.A.; Sedghi, Z.; Khatibi, R.; Sadeghfam, S. Mapping Specific Vulnerability of Multiple Confined and Unconfined Aquifers by Using Artificial Intelligence to Learn from Multiple DRASTIC Frameworks. J. Environ. Manag. 2018, 227, 415–428. [Google Scholar] [CrossRef] [PubMed]
  15. Männik, M.; Karro, E.; Marandi, A.; Polikarpus, M.; Ani, T.; Rosentau, A. Modified DRASTIC Method for Groundwater Vulnerability Assessment in Areas with Diverse Quaternary Deposits. Hydrol. Res. 2023, 54, 840–854. [Google Scholar] [CrossRef]
  16. Koit, O.; Retiķe, I.; Bikše, J.; Terasmaa, J.; Tarros, S.; Abreldaal, P.; Babre, A.; Hunt, M.; Pärn, J.; Vainu, M.; et al. Hydrochemical Signatures of Springs for Conceptual Model Development to Support Monitoring of Transboundary Aquifers. Groundw. Sustain. Dev. 2023, 21, 100927. [Google Scholar] [CrossRef]
  17. Raukas, A.; Kajak, K. Quaternary Cover. In Geology and Mineral Resources of Estonia; Raukas, A., Teedumäe, A., Eds.; Estonian Academy Publishers: Tallinn, Estonia, 1997. [Google Scholar]
  18. Kalm, V. Pleistocene Chronostratigraphy in Estonia, Southeastern Sector of the Scandinavian Glaciation. Quat. Sci. Rev. 2006, 25, 960–975. [Google Scholar] [CrossRef]
  19. Raukas, A. When and How Did the Continental Ice Retreat from Estonia? Quat. Int. 2009, 207, 50–57. [Google Scholar] [CrossRef]
  20. Geological Survey of Estonia Spatial Data of the Geological Survey of Estonia. Available online: https://www.egt.ee/maapouealane-teave/geoloogilised-andmed/ruumiandmed-ja-kaardid#ruumiandmed (accessed on 27 March 2023).
  21. Estonian Land Board Guide for Digital Geological Mapping. 2015. Available online: https://geoportaal.maaamet.ee/docs/geoloogia/Geoloogilise_kaardistamise_juhend_2_5_2019.pdf (accessed on 13 July 2023).
  22. Vallner, L.; Porman, A. Groundwater Flow and Transport Model of the Estonian Artesian Basin and Its Hydrological Developments. Hydrol. Res. 2016, 47, 814–834. [Google Scholar] [CrossRef]
  23. Perens, R.; Vallner, L. Water-Bearing Formation. In Geology and Mineral Resources of Estonia; Raukas, A., Teedumäe, A., Eds.; Estonian Academy Publishers: Tallinn, Estonia, 1997. [Google Scholar]
  24. Suuroja, K.; Kaljuläte, K.; Mardim, T.; Morgen, E.; Ploom, K.; Karimova, M.; Vahtra, T.; Veski, A. Estonian Geological Base Map Rapla Map Sheet; Geological Survey of Estonia: Tallinn, Estonia, 2017. [Google Scholar]
  25. Põldvere, A.; Põldvere, A.; Grünberg, R.; Rohtla, R.; Ariva, K.; All, T. Estonian Geological Base Map Võru Map Sheet; Geological Survey of Estonia: Tartu, Estonia, 2016. [Google Scholar]
  26. Water Act. Available online: https://www.riigiteataja.ee/en/eli/ee/509122020007/consolide/current (accessed on 13 July 2023).
  27. Maqsoom, A.; Aslam, B.; Alwetaishi, M.; Awais, M.; Hassan, U.; Maqsoom, S.; Alaloul, W.S.; Musarat, M.A.; Zerouali, B.; Hussein, E.E. A GIS-Based Groundwater Contamination Assessment Using Modified DRASTIC Geospatial Technique. Water 2021, 13, 2868. [Google Scholar] [CrossRef]
  28. Goodarzi, M.R.; Niknam, A.R.R.; Jamali, V.; Pourghasemi, H.R. Aquifer Vulnerability Identification Using DRASTIC-LU Model Modification by Fuzzy Analytic Hierarchy Process. Model. Earth Syst. Environ. 2022, 8, 5365–5380. [Google Scholar] [CrossRef]
  29. Laerd Statistics Spearman’s Rank-Order Correlation. Available online: https://statistics.laerd.com/statistical-guides/spearmans-rank-order-correlation-statistical-guide.php (accessed on 13 July 2023).
  30. Estonian Environment Agency. Estonian Nature Information System Web Feature Service. Available online: https://metadata.geoportaal.ee/geonetwork/srv/eng/catalog.search#/metadata/%7BA3FD7235-1187-49A4-BBDA-CA51D016B03D%7D (accessed on 29 May 2023).
  31. R Core Team. R Studio; R Core Team: Vienna, Austria, 2011. [Google Scholar]
  32. Napolitano, P.; Fabbri, A.G. G. Single-Parameter Sensitivity Analysis for Aquifer Vulnerability Assessment Using DRASTIC and SINTACS. IAHS Publ. Ser. Proc. Rep. Intern. Assoc. Hydrol. Sci. 1996, 235, 559–566. [Google Scholar]
  33. Lodwick, W.A.; Monson, W.; Svoboda, L. Attribute Error and Sensitivity Analysis of Map Operations in Geographical Informations Systems: Suitability Analysis. Int. J. Geogr. Inf. Syst. 1990, 4, 413–428. [Google Scholar] [CrossRef]
  34. Kalvāns, A.; Popovs, K.; Priede, A.; Koit, O.; Retiķe, I.; Bikše, J.; Dēliņa, A.; Babre, A. Nitrate Vulnerability of Karst Aquifers and Associated Groundwater-Dependent Ecosystems in the Baltic Region. Environ. Earth Sci. 2021, 80, 628. [Google Scholar] [CrossRef]
  35. Kitterød, N.O.; Kværner, J.; Aagaard, P.; Arustiene, J.; Bikše, J.; Dagestad, A.; Gundersen, P.; Hansen, B.; Hjartarson, Á.; Karro, E.; et al. Hydrogeology and Groundwater Quality in the Nordic and Baltic Countries. Hydrol. Res. 2022, 53, 958–982. [Google Scholar] [CrossRef]
  36. Højberg, A.L.; Hansen, A.L.; Wachniew, P.; Żurek, A.J.; Virtanen, S.; Arustiene, J.; Strömqvist, J.; Rankinen, K.; Refsgaard, J.C. Review and Assessment of Nitrate Reduction in Groundwater in the Baltic Sea Basin. J. Hydrol. Reg. Stud. 2017, 12, 50–68. [Google Scholar] [CrossRef]
  37. Hansen, B.; Thorling, L.; Kim, H.; Blicher-Mathiesen, G. Long-Term Nitrate Response in Shallow Groundwater to Agricultural N Regulations in Denmark. J. Environ. Manag. 2019, 240, 66–74. [Google Scholar] [CrossRef]
  38. Kumar, A.; Pramod Krishna, A. Groundwater Vulnerability and Contamination Risk Assessment Using GIS-Based Modified DRASTIC-LU Model in Hard Rock Aquifer System in India. Geocarto Int. 2020, 35, 1149–1178. [Google Scholar] [CrossRef]
  39. Kardan Moghaddam, H.; Rahimzadeh kivi, Z.; Bahreinimotlagh, M.; Moghddam, H.K. Evaluation of the Groundwater Resources Vulnerability Index Using Nitrate Concentration Prediction Approach. Geocarto Int. 2022, 37, 1664–1680. [Google Scholar] [CrossRef]
  40. European Union. Copernicus Land Monitoring Service Copernicus Land Data; European Union: Maastricht, The Netherlands, 2018. [Google Scholar]
Figure 1. The location and the Quaternary sediments (Geological Survey of Estonia 2023) of the Rapla and Võru study areas.
Water 15 03585 g001
Figure 2. Vulnerability assessment results of the Rapla study area. (A) Vulnerability map produced using original DRASTIC; (B) vulnerability map produced using modified DRASTIC; (C) vulnerability map produced using the Estonian method for groundwater vulnerability assessment.
Water 15 03585 g002
Figure 3. Vulnerability assessment results of the Võru study area. (A) Vulnerability map produced using original DRASTIC; (B) vulnerability map produced using modified DRASTIC; (C) vulnerability map produced using the Estonian method for groundwater vulnerability assessment.
Water 15 03585 g003
Figure 4. Nitrate concentration and selected wells in the Rapla and Võru areas.
Water 15 03585 g004
Table 1. DRASTIC method parameters, descriptions, and weights.
ParameterMethodWeightDescription
Depth to groundwater table (D)DRASTIC5The vertical distance from the ground surface to the piezometric head affects the pollution risk: the risk is lower when the water table is deeper.
Modified DRASTIC5The relative position of the piezometric head and the bedrock surface is compared: the pollution risk is higher if the piezometric head is below the bedrock surface and vice versa.
Net recharge (R)DRASTIC4The transportation of the contaminants into the aquifer depends on the amount of the infiltrating water. The higher the recharge through the vadose zone, the higher the contamination potential.
Aquifer media (A)DRASTIC3More fractures and larger grain sizes of the sediments forming the aquifer lead to higher permeability and lower attenuation capacity.
Soil media/Quaternary sediment type (S)DRASTIC2The presence of clays and organic material in the soil lowers the potential for contaminant migration.
Modified DRASTIC5The Quaternary sediments above the aquifer regulate the extent of water infiltrating into the ground.
Topography (T)DRASTIC1The amount of potential pollutant infiltration or runoff depends on the topography of the land surface, especially on its slope gradients.
Impact of the vadose zone (I)/Thickness of the Quaternary sedimentsDRASTIC5The unsaturated zone above the water table is crucial in determining the degree of contaminant attenuation.
Modified DRASTIC5The vertical distance from the ground surface to the bedrock surface influences the vulnerability of the aquifer: higher risk is caused by a thin layer of sediments.
Hydraulic conductivity (C)DRASTIC3Higher hydraulic conductivity means a higher ability of the aquifer to transmit water and move contaminants, leading to a higher contamination risk.
Table 2. Original [2] and modified DRASTIC parameters [15].
(D) Depth to Groundwater Table (Original)(D) Depth to Groundwater Table (Modified)(R) Net Recharge (Original)(A) Aquifer Media (Original)(S) Soil Media (Original)
Range (m)RatingDepth of the piezometric head compared to the bedrock surface a (m)RatingRange (mm/y)RatingTypeRatingTypeRating
0–1.510<−10100–501Massive shale1–3Thin/absent 10
1.5–59−10…−5950–1003Metamorphic/igneous2–5Gravel10
5–107−5…−17100–1756Weathered metamorphic/igneous3–5Sand9
10–155−1…06175–2508Glacial till4–6Peat 8
15–2030…15>2509Bedded sandstone, limestone5–9Shrinking clay7
20–3021…33 Massive sandstone4–9Sandy loam6
>3013…52 Massive limestone4–9Loam5
>51 Sand and gravel4–9Silty loam4
Basalt2–10Clay loam3
Karst limestone9–10Muck2
No shrinking clay1
(S) Quaternary Sediment Type (Modified)(T) Topography (Original)(I) Impact of the Vadose Zone (Original)(I) Thickness of the Quaternary Sediments (Modified)(C) Hydraulic Conductivity (Original)
TypeRatingSlope (%)RatingTypeRatingRange (m)RatingRange (m/d)Rating
Clay10–210Confining layer 10–2100.04–41
Gyttja22–69Silt/clay32–594–122
Silt66–125Shale35–10712–284
Peat612–183Limestone610–20528–406
Till7>181Sandstone620–40340–808
Fine/coarse sand, gravel8 Bedded limestone/sandstone6>401>8010
Cobbles, boulders9 Sand, gravel with silt, clay6
Bedrock outcrop10 Metamorphic/igneous4
Karst field10 Sand and gravel8
Basalt9
Karst limestone10
Note: a piezometric head below the bedrock surface is indicated by a negative value.
Table 3. Vulnerability index (Di) values classification.
Vulnerability ClassPercentage of the Di Range (51–225)Di Values
Well protected0–1051–101
Relatively well protected10–28102–133
Moderately protected29–46134–164
Weakly protected47–64165–195
Unprotected65–100196–225
Table 4. Percentages of the vulnerability classes in the resulting maps.
Rapla Modified DRASTICRapla Original DRASTICRapla Estonian MethodVõru Modified DRASTICVõru Original DRASTICVõru Estonian Method
Well protected0.50.0-12.67.426.1
Relatively
protected
8.10.10.253.846.837.5
Moderately
protected
30.716.64.627.440.520.7
Weakly
protected
42.169.552.65.95.215.0
Unprotected18.513.842.60.20.10.7
Table 5. The relationship between nitrate concentration and groundwater vulnerability maps.
Original DRASTIC RaplaModified DRASTIC RaplaOriginal DRASTIC VõruModified DRASTIC Võru
Spearman0.2720.424−0.0230.225
p-value0.03720.0008070.74910.00167
Table 6. Statistical overview of the DRASTIC method parameters used in the vulnerability assessment in Rapla and Võru.
RaplaDRASTIC
Min1191158
Max103101010108
Mean4.81.69.26.69.79.28
SD2.50.90.42.60.81.10
Coefficient of variation (%)52.156.34.339.48.212.00.0
VõruDRASTIC
Min1151112
Max109101010108
Mean3.64.86.27.37.83.62.2
SD3.42.51.12.02.82.51.1
Coefficient of variation (%)94.452.117.727.435.969.450.0
Table 7. Single-parameter sensitivity analysis results in Rapla and Võru.
RaplaTheoretical Weight (%)Effective Weight (%)
MinMaxMeanSD
D19.22.927.813.45.7
R15.41.910.63.82.2
A11.512.128.416.52.8
S19.23.033.318.86.3
T3.80.510.05.81.1
I19.216.541.727.33.1
C11.510.625.314.42.4
VõruTheoretical Weight (%)Effective Weight (%)
MinMaxMeanSD
D19.23.048.413.111.0
R15.43.148.015.78.2
A11.57.835.615.33.4
S19.23.350.629.68.5
T3.80.515.96.52.7
I19.22.546.914.59.1
C11.53.021.55.42.1
Table 8. Map removal sensitivity analysis results in Rapla and Võru (one parameter removed).
Rapla—Parameter RemovedVariation Index (%)
MinMaxMeanSD
D0.002.250.830.48
R0.612.071.750.36
A0.002.360.430.40
S0.003.171.190.49
T0.073.061.410.23
I0.364.562.160.52
C0.001.830.310.26
Võru—Parameter RemovedVariation Index (%)
MinMaxMeanSD
D0.005.681.660.79
R0.005.621.100.85
A0.003.550.460.38
S0.006.052.740.99
T0.002.291.310.45
I0.005.421.270.84
C5.791.881.500.28
Table 9. Map removal sensitivity analysis results in Rapla and Võru (parameters used).
Rapla—Parameters UsedVariation Index (%)
MinMaxMeanSD
D, R, A, S, T, I0.001.830.310.26
D, R, S, T, I2.145.020.810.79
R, S, T, I0.004.030.820.66
R, T, I0.005.892.181.13
R, I0.008.571.651.47
I2.1827.2812.973.14
Võru—Parameters UsedVariation Index (%)
MinMaxMeanSD
D, R, A, S, T, I0.003.550.460.38
D, R, S, T, I0.008.721.381.19
R, S, T, I0.009.331.641.28
R, T, I0.0010.522.612.24
R, I0.0020.607.464.05
I0.0036.2816.445.93
Disclaimer/Publisher’s Note: The statements, opinions and data contained in all publications are solely those of the individual author(s) and contributor(s) and not of MDPI and/or the editor(s). MDPI and/or the editor(s) disclaim responsibility for any injury to people or property resulting from any ideas, methods, instructions or products referred to in the content.

