Article

Evaluation of the Groundwater Ecological Water Requirement in the Southeast Margin of Otindag Sandy Land Based on Allowable Groundwater Depth Drawdown

1
China Aero Geophysical and Remote Sensing Center for Natural Resources, Beijing 100083, China
2
Zhejiang Qianjiang Biochemistry Co., Ltd., Provincial Key Agricultural Enterprise Research Institute, Jiaxing 314400, China
3
Information Center (Hydrogeology Monitor and Forecast Center), Ministry of Water Resources, Beijing 100083, China
*
Author to whom correspondence should be addressed.
Water 2023, 15(19), 3504; https://doi.org/10.3390/w15193504
Submission received: 27 June 2023 / Revised: 4 September 2023 / Accepted: 25 September 2023 / Published: 7 October 2023
(This article belongs to the Special Issue China Water Forum 2023)

Abstract

:
Water resources in arid and semi-arid areas are limiting factors for ecosystem health and economic development. Therefore, an accurate and reasonable assessment of ecological water demand is crucial for efficient water resource utilization. In this study, we used vegetation coverage and groundwater depth to assess the state of vegetation growth in the Zhenglanqi, located at the southeastern edge of Otindag Sandy Land. Our results indicate the existence of a statistical power index function between vegetation coverage and groundwater depth scatter plots, where even minor changes in groundwater depth can have a significant impact on vegetation growth. In order to quantitatively assess the impact of subsidence on vegetation ecology, we propose a maximum allowable subsidence level under conditions that maintain normal ecological conditions, based on the initial subsidence depth and ecological guarantee rate. Our findings suggest that regions with shallower initial groundwater depths are more sensitive to changes in their environment than regions with deeper groundwater depths. The total groundwater consumption in the study area was 83 million cubic meters while maintaining an ecological guarantee rate of 80%; thus, while ensuring normal environmental conditions, human exploitation of shallow groundwater accounts for only 16 percent.

1. Introduction

In arid and semi-arid areas where surface water is scarce, groundwater is not only the main source of water for people’s production and daily life but also the key to maintaining ecosystem stability [1,2]. At least 30% of all global vegetation communities in dry lands use groundwater as their main source of water [3]. However, in recent years, the increase in production and domestic water usage has resulted in the encroachment on ecological water, intensifying the conflict between water supply and ecological issues [4,5]. The exploration and utilization of groundwater resources while ensuring ecosystem health has become a pressing concern in ecohydrogeology [6,7,8]. For this reason, many ecological hydrologists have conducted extensive research and found that most groundwater-dependent ecosystems depend on the distribution of shallow groundwater, and the key factor affecting the growth of vegetation in arid areas is the depth of the groundwater table [9,10,11]. Based on this, the concept of ecological groundwater level has been put forward in relation to arid and semi-arid areas [12,13,14]. The ecological groundwater level is defined as the groundwater level that corresponds to the depth capable of sustaining non-zonal natural vegetation growth. Horton Jonathan studied the physiological responses of plants at different groundwater depths and proposed a groundwater depth threshold for plants to experience physiological effects such as photosynthesis [15]. Hatton concluded that there was generally a poor understanding of the degree to which terrestrial vegetation is dependent upon groundwater; this dependency can be influenced by the type of vegetation and often the depth of the groundwater table [16]. In southwest Western Australia, Zencich estimated that the highest proportion (>50%) of groundwater is used by vegetation, mainly Banksia species, growing over shallower groundwater (<6 m depth to the groundwater table) [17]. Derek studied groundwater ecosystems that rely solely on groundwater to maintain vegetation health, analyzed the relationship between groundwater and vegetation, and summarized the optimal water level for dominant plants [18]. Rossatto studied the response relationship between vegetation structure, soil moisture, and groundwater table depth in the highlands of central Pakistan [19]. Wang conducted a study on the root depth and capillary rise height of vegetation in the Ejin Oasis and proposed using a burial depth of 1.8–3.5 m as the groundwater depth suitable for vegetation growth [20]. It can be seen that in existing research, the ecological water level is widely used as an ecological constraint indicator for groundwater extraction to maintain healthy ecological conditions.
Nevertheless, relying solely on the ecological water level is inadequate for evaluating the impact of groundwater on vegetation in a comprehensive manner. While these levels provide a suitable depth for plant survival from a macro perspective, they cannot fully assess the extent of ecosystem changes resulting from reduced groundwater depths. Vegetation is primarily influenced by fluctuations in groundwater depth, which are partially regulated by both groundwater recharge and human exploitation. In general, a decline in the water table level can result in the degradation of vegetation [21,22,23]. Moreover, groundwater directly determines the patterns of vegetation populations and communities in groundwater-dependent ecosystems. The results showed that the plots with larger herbaceous perennials were the most sensitive to groundwater decline [24,25]. For example, with the decrease in groundwater level in the lower reaches of the Tarim River, the plant community gradually evolved from a tree, shrub, and herb community to a shrub community and finally to a single-shrub community [26]. The evidence indicates that wetland lakes in arid and semi-arid regions of northern China exhibit heightened sensitivity to fluctuations in groundwater levels [27]. Even minor changes within the ecological water level range are capable of triggering a cascade of ecological and environmental issues [28,29,30,31]. Therefore, it is more appropriate to use the allowable groundwater drawdown, which refers to the maximum groundwater table depth change that an ecosystem can withstand without adverse effects, as an ecological indicator for safeguarding ecosystem health [28,32].
Based on the aforementioned considerations, this study utilizes vegetation indices to characterize regional terrestrial ecosystems, establishes a correlation between vegetation indices and groundwater depth, and determines the permissible variation in groundwater depth under a specific ecological guarantee rate. The southeastern boundary of Hunshandake Sandy Land was selected as a representative research subject, and in conjunction with findings from field ecohydrogeological investigations, an appropriate allowable groundwater depth for the study area is proposed. Furthermore, based on these findings, the ecological water requirement necessary to ensure environmental health is determined. This research has significant implications for the protection and restoration of the region’s ecology.

2. Study Area and Data Sources
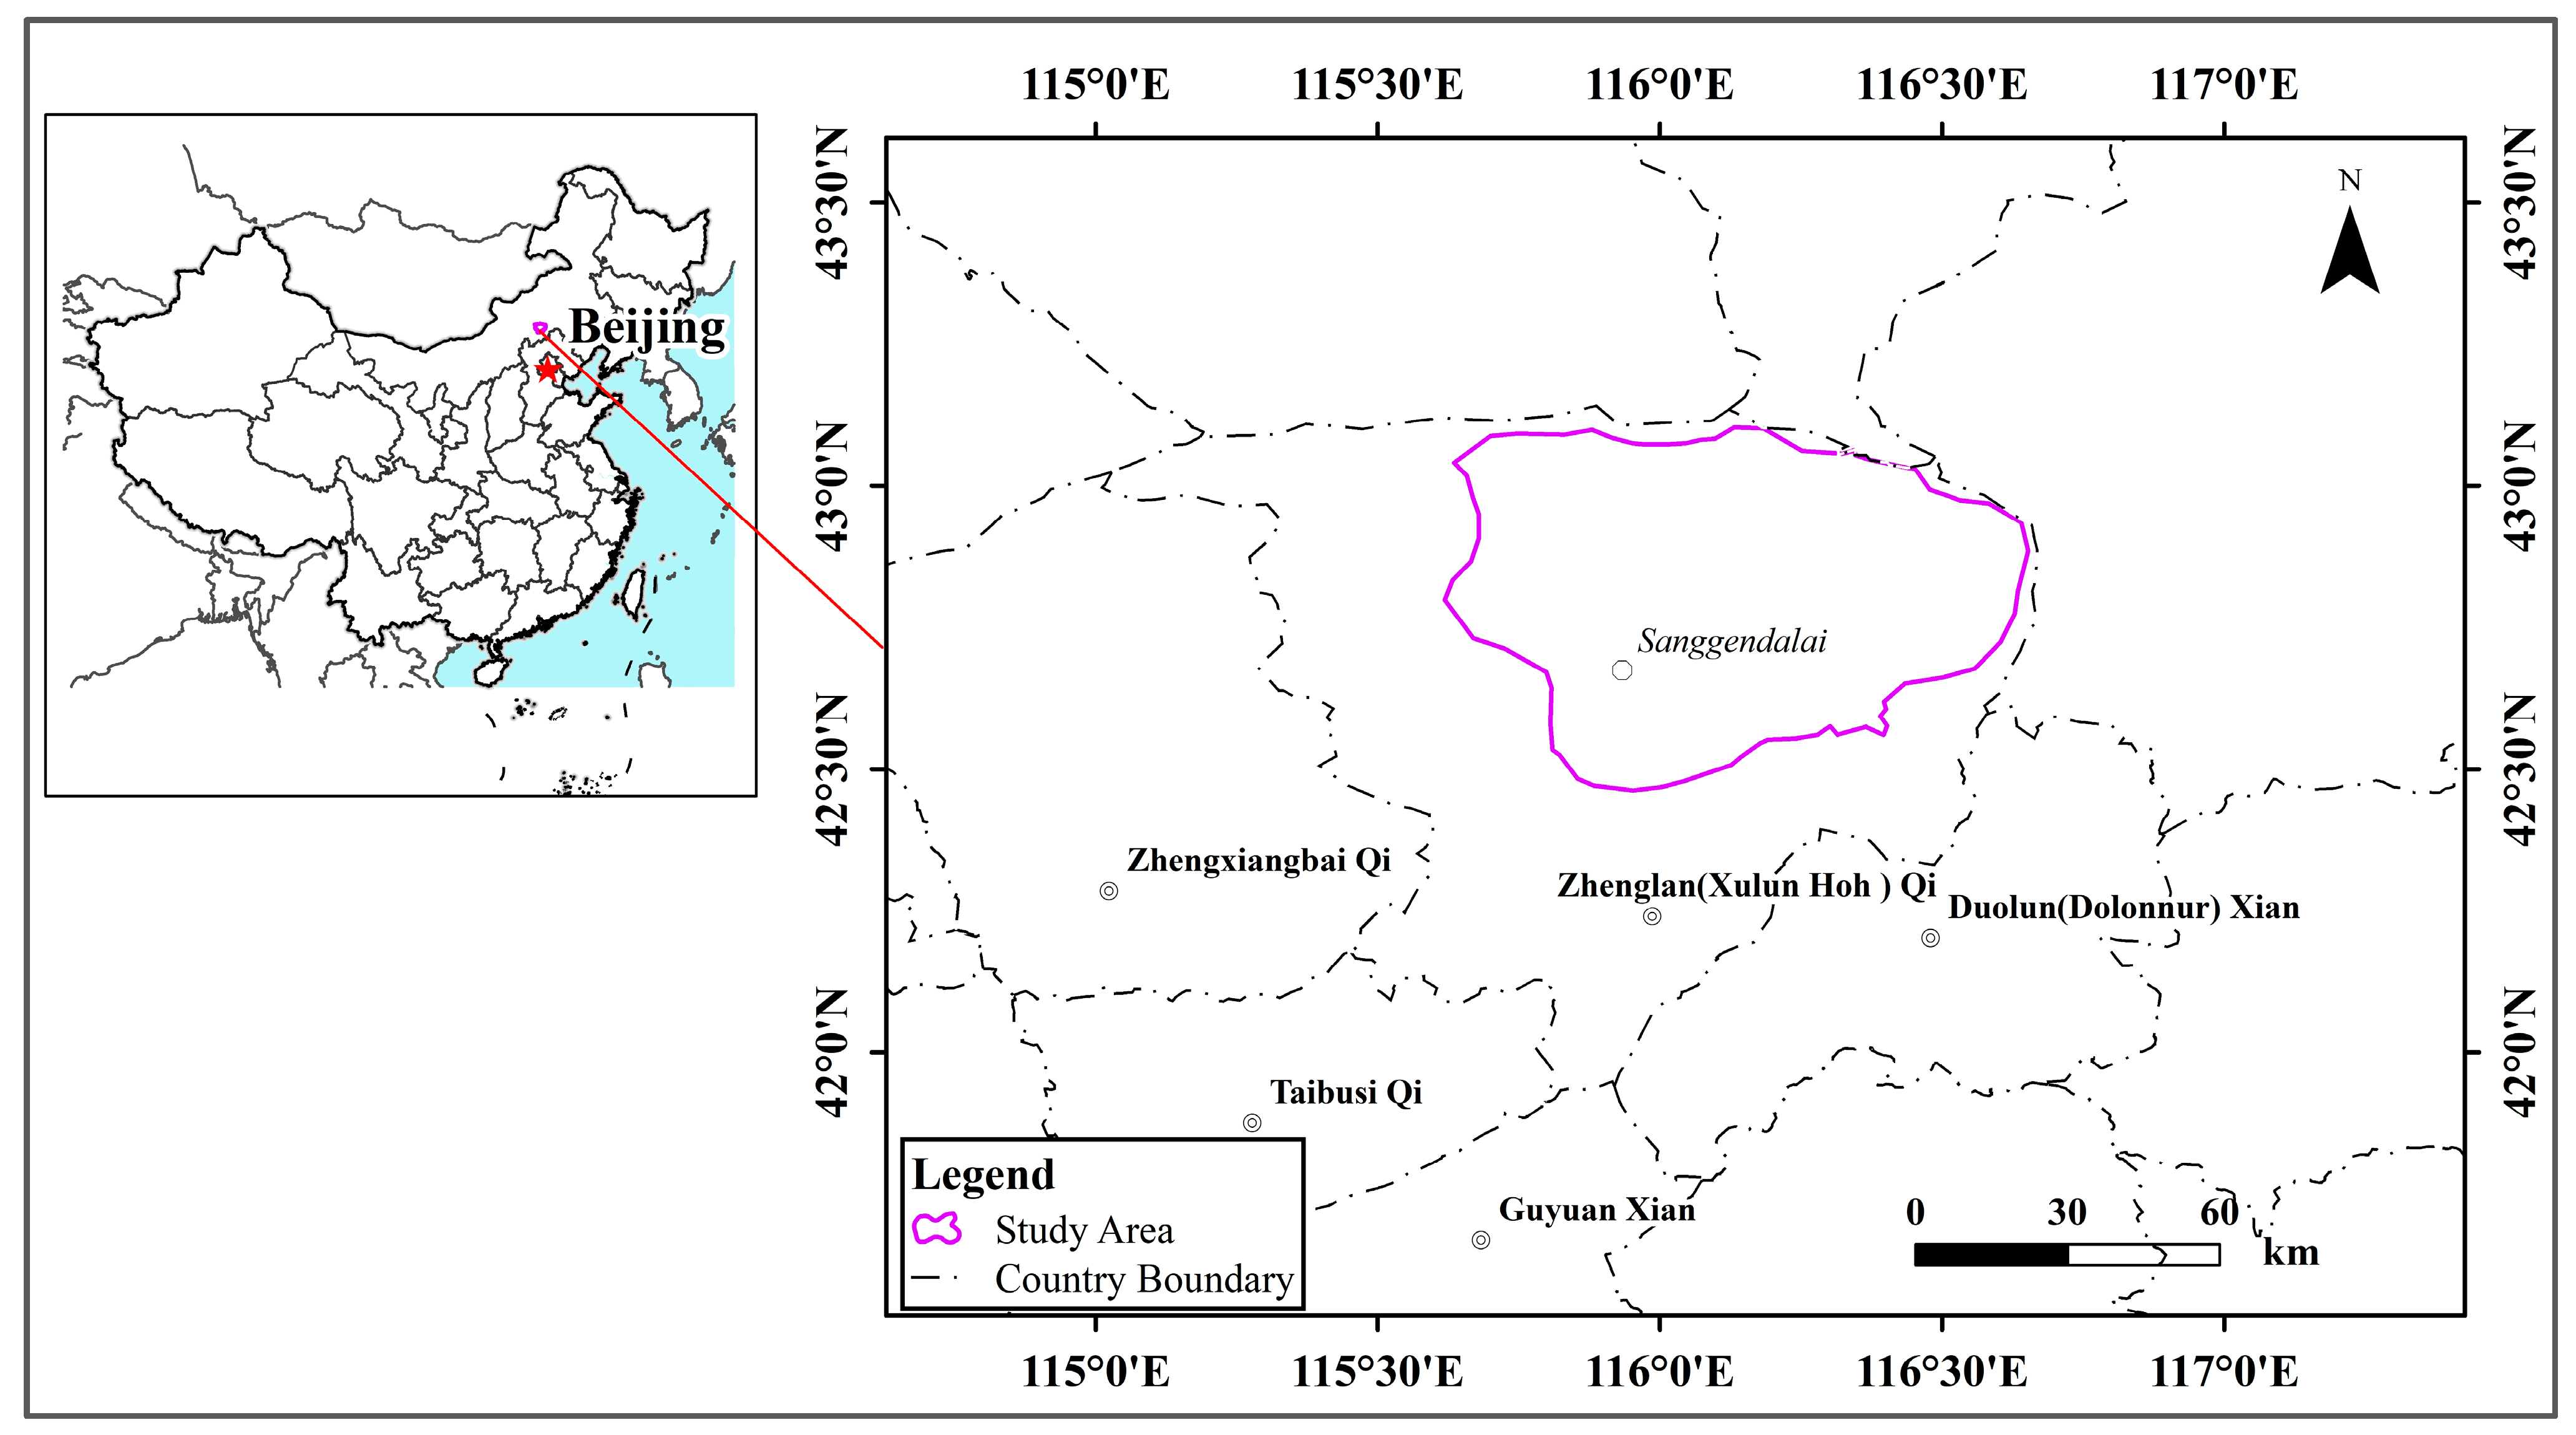
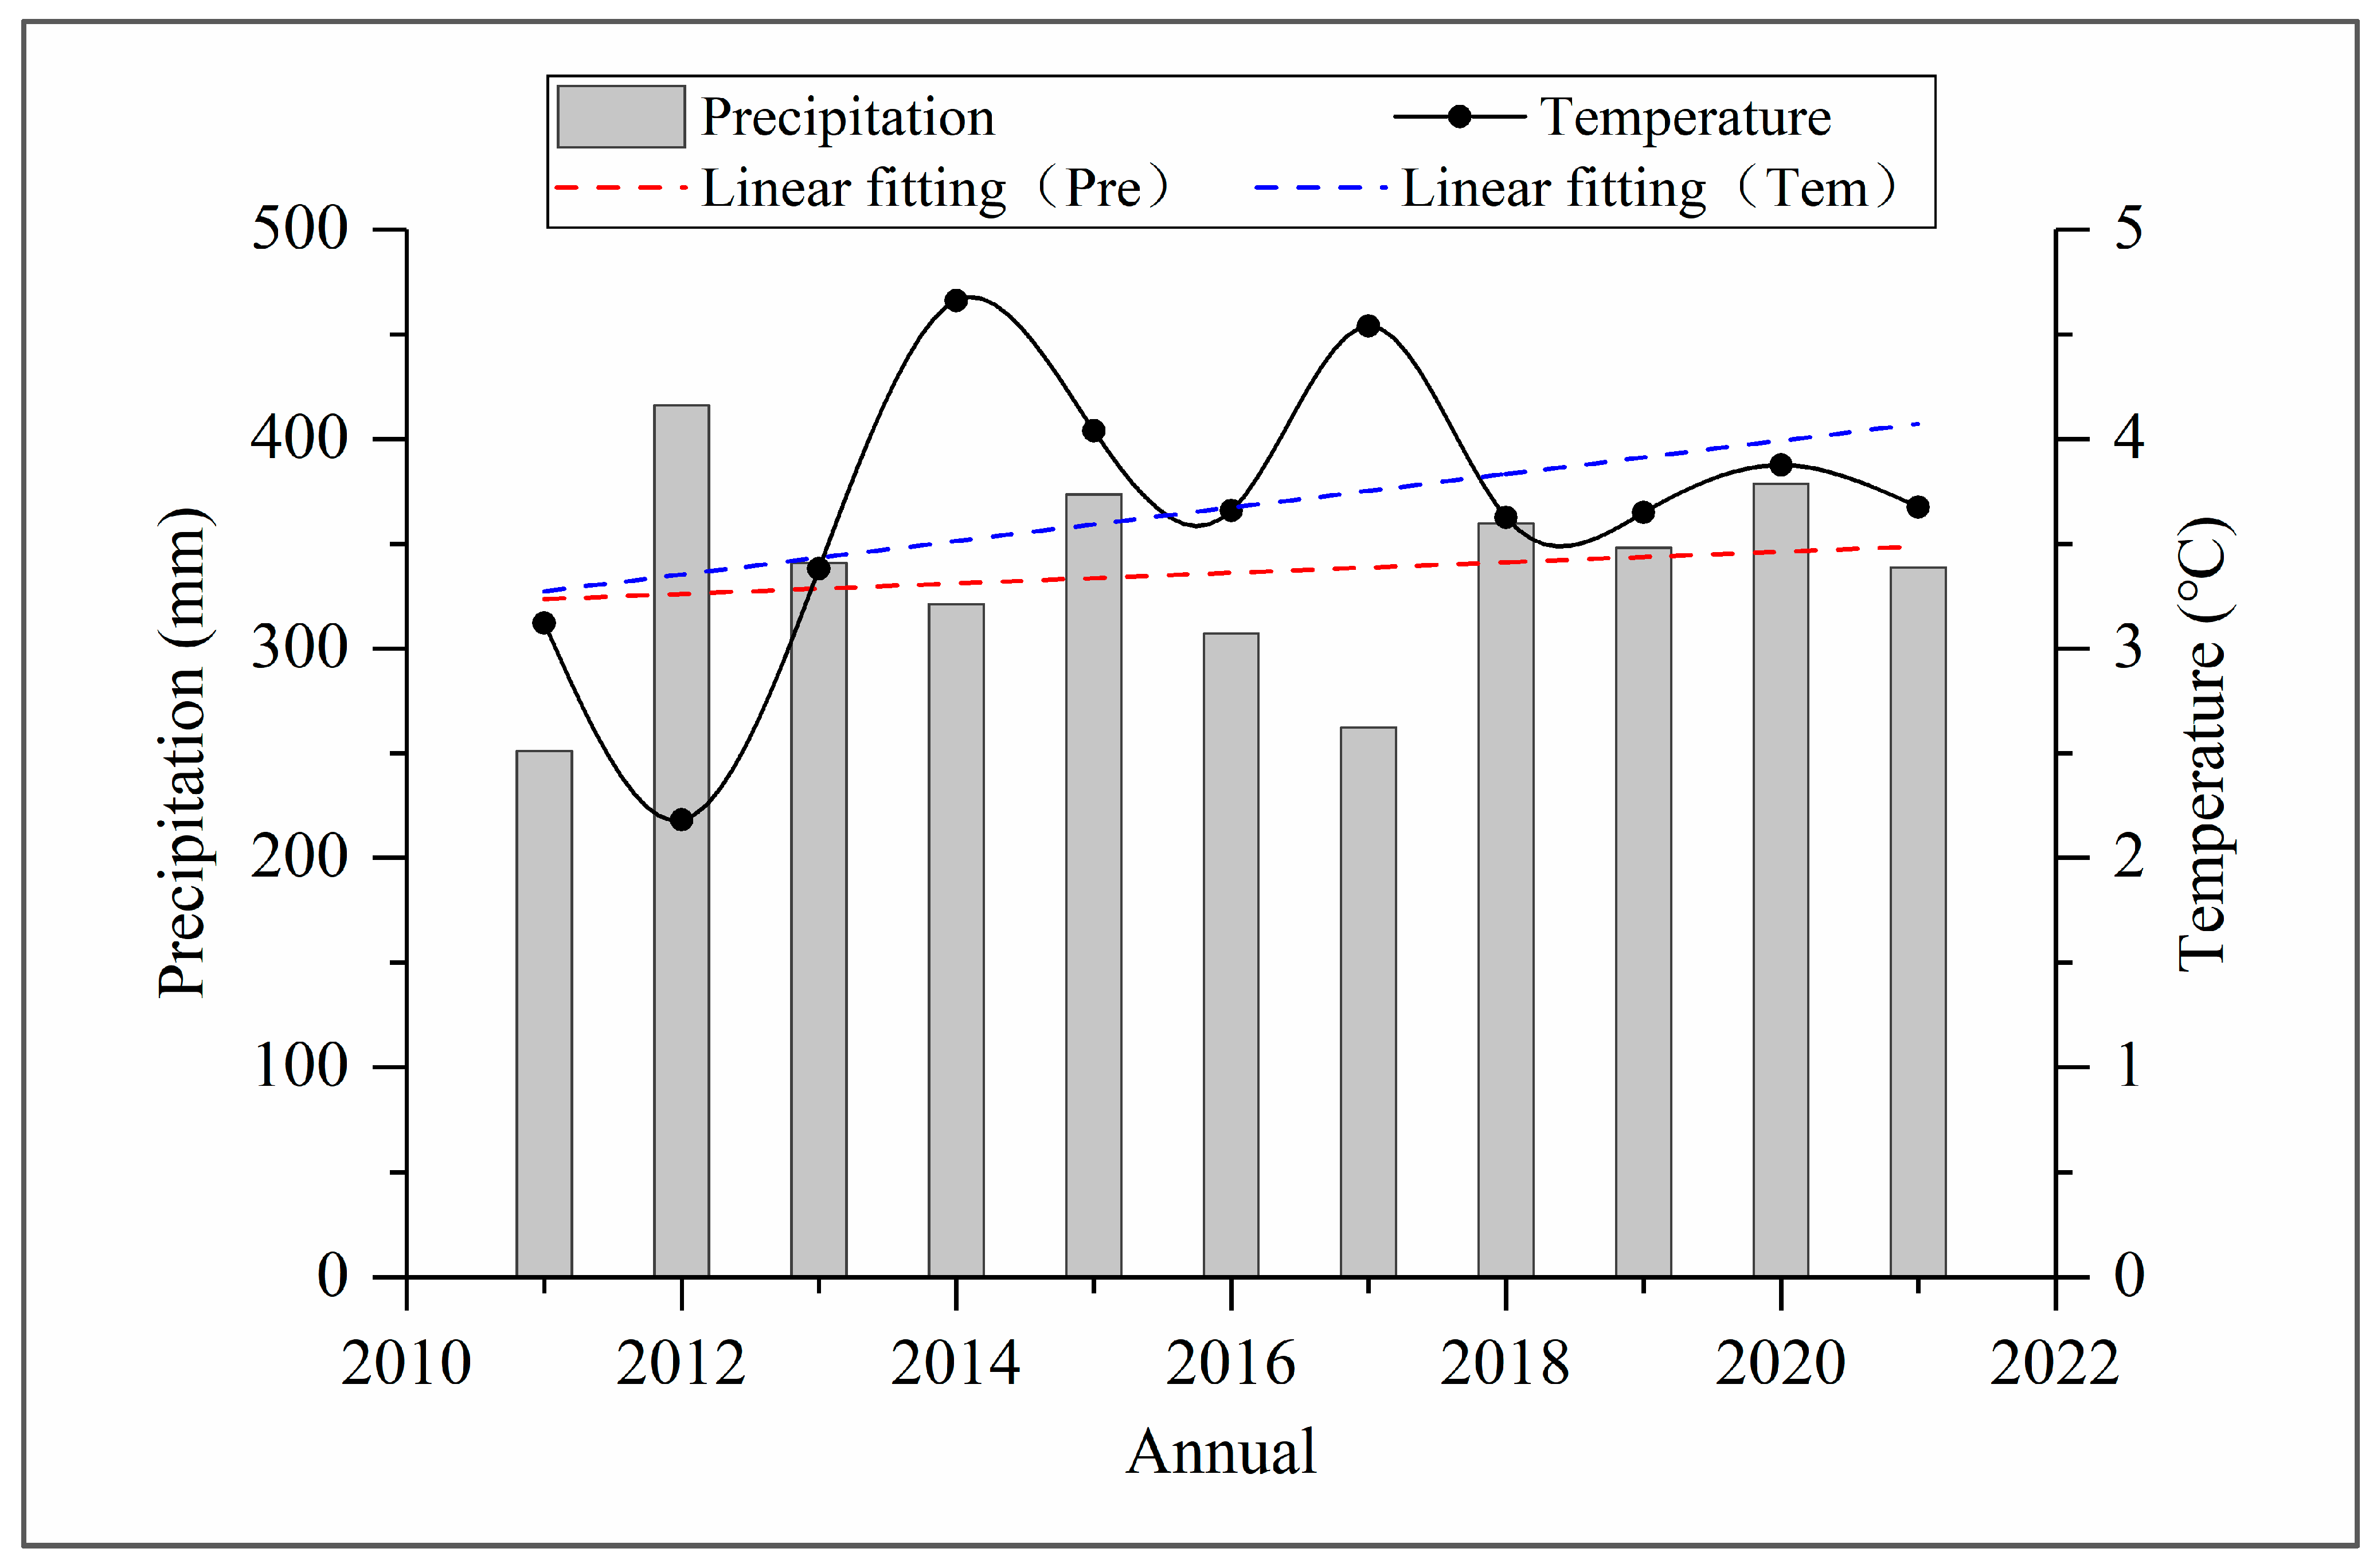
2.1. Study Area

Otindag Sandy Land is situated in the ecologically sensitive zone of arid and semi-arid regions in northern China, serving as a transitional area between grassland pastoralism and agriculture. The ecological environment in this region is highly vulnerable, with frequent occurrences of ecological issues such as drought, land desertification, and lake shrinkage due to the impact of climate change and human activities [33,34]. The research area selected for this study is Zhenglan Banner, located in the southeast of Otindag Sandy Land, covering an approximate area of 5000 km2, as shown in Figure 1. The study area features a mid-temperate arid and semi-arid plateau continental monsoon climate, characterized by intense solar radiation and ample sunshine. Annual sunshine hours range from 2800 to 3200 h, while the average annual wind speed is between 3.5 and 5 m per second, with an average of 49 to 74 windy days annually. The mean annual temperature stands at 3.67 °C, accompanied by an average yearly precipitation of approximately 335 mm, as shown in Figure 2. The annual average evaporation observed by the small evaporating dish at the weather station amounts to 1853 mm. Precipitation is concentrated in June–August, accounting for more than half of the annual total. The climate in this region is characterized by cold temperatures, strong winds, low rainfall, and drought [35].
The topography of the study area exhibits a general pattern of high elevation in the southern and eastern regions, gradually decreasing towards the north and west. The southern region is characterized by low mountains and hills, while the central portion features wide valley grasslands of the meadow–steppe type. Moving further northwards, desert grasslands dominate with non-zonal vegetation comprising mainly sand ground cover, low-lying terrain meadow vegetation, and a small amount of swamp vegetation. The dominant plant species found on the dunes include Ulmus pumila, Salix gordejevii, Caragana microphylla, Artemisia intramangolica, and other psammophytes. The dominant plant species in the inter-dune lowlands include Stipa grandis, Agropyron monglicum, Adesertorum, Leymus chinensis, Elymus dahuricus, Cleistogenes squarrosa, Artemisia frigida, and others [36]. The natural landscape types comprise mobile dunes, semi-mobile dunes, semi-fixed dunes, fixed dunes, wetlands, and grasslands. The typical superzonal open forest grassland landscape is also present. The soil types include Castanozems, Aeolian soil, Solonetzs, and meadow soil.
The primary surface water systems within the region are comprised of the Heifeng River, Shandian River, Gaogesitai River, and BaiyinBaolige River, with the Heifeng River and Shandian River being part of the Luanhe River system. Inland lakes are widely distributed throughout the study area, primarily formed by wind erosion. Notable large lakes include Zhagesitai Lake, Bayin Lake, and Sanggendalai Lake; their water surface maintenance is reliant on groundwater discharge. The aquifer distribution in the study area is relatively straightforward, consisting entirely of porewater within quaternary unconsolidated rocks. The primary composition of the aquifer is fine sand and silty sand.

2.2. Data Sources

To investigate the correlation between vegetation, steam emission, and groundwater, the initial step is to gather and systematize the relevant data. The primary data utilized in this research encompass deep-seated groundwater burial information, the remote sensing vegetation index, as well as land surface steam remote sensing model data. It is imperative to elucidate the groundwater distribution characteristics of the study area by analyzing the terrain, hydrogeological conditions, and various groundwater-level drilling holes. To achieve this goal, a survey was conducted on both the depth of drilling groundwater and local residents’ groundwater. The investigation of groundwater resources within the research area primarily utilized data from 87 individuals in a unified test conducted in July 2021, while simultaneously extracting information from 22 lakes and water sources. After inputting all groundwater level data into ArcGIS 10.6 software and creating a scattered point map of the research area, we utilized the interpolation analysis tool in Spatial Analyst to comprehensively interpolate using both triangular linear and reverse weight methods. This allowed us to obtain accurate groundwater levels for the entire research area, which were then used to create water level grid data.
The vegetation index utilized in this study through remote sensing is an enhanced vegetation index (EVI) that was specifically selected by the Moderate Resolution Imaging Spectroradiometer (MODIS) data. The MODIS EVI possesses the advantages and characteristics of being freely accessible, having a higher temporal resolution (16 days), and a finer spatial resolution (250 m). This article utilizes the MOD13Q1 EVI dataset from 2021 with a spatial resolution of 250 m. The data were sourced from the latest Modis-C6-MOD13Q1 data product, which was released by the Land Processes Distributed Active Archive (LPDAAC) Essence. To accurately reflect the general characteristics of vegetation distribution in the research area, we utilized Groeneveld’s method [37] and other approaches to calculate the relative vegetation coverage.
The land evapotranspiration data (MODIS16) were developed and released by NASA based on the Penman–Monteith remote sensing model and MODIS data. The dataset comprises four distinct series, namely evapotranspiration (ET), latent heat flux (LE), potential evapotranspiration (PET), and potential latent heat flux (PLE). The data have a spatial resolution of 1 km and a temporal resolution of 8 days, monthly and annually. This study utilizes the ET year dataset for the year 2021.

3. Research Methods

In the arid and semi-arid study area, groundwater plays a crucial role in supporting the natural ecosystem through vegetation evapotranspiration and lake recharge. Regarding the evapotranspiration of vegetation that relies on groundwater, it is primarily within areas with high vegetation coverage that transpiration exceeds precipitation, and any excess beyond atmospheric precipitation is supplied through capillary uplift from groundwater sources. The ecological water consumption by vegetation takes the form of land evapotranspiration, encompassing not only plant transpiration but also soil evaporation under necessary vegetation cover. Regarding the base discharge of groundwater to the lake, the base discharge of groundwater controls the lake area, water depth, and even the source of salt.

3.1. Relationship between Vegetation Coverage and Groundwater Depth

At the regional level, remote sensing vegetation indices are utilized to assess the status of vegetation growth, and a robust correlation has been established between vegetation coverage and groundwater depth in arid and semi-arid regions [38]. Within our study area, it has been observed that the natural vegetation’s statistical average coverage tends to decrease as groundwater depth increases [39], which can be roughly approximated as:
C P ¯ = a + b exp ( η D w )
Among these parameters, ‘ C ¯ P ’ is the average annual vegetation cover, ‘a’ signifies the mean relative vegetation cover (about 20%) in regions with significant groundwater depths (Dw > 10 m). Parameter ‘b’ indicates amplitude variation (~0.1) while ‘ η ’ represents the attenuation factor of vegetation coverage (η = 0.3~0.4 m−1).
When groundwater depth changes from D w 0 in the initial state to D w , the corresponding vegetation coverage will change from C P 0 to C P , which can be described by Formula (2):
C P C P 0 = a + b exp ( η D w ) a + b exp ( η D w 0 )

3.2. Ecological Water Demand of Groundwater in a Vegetation Landscape

The consumption of groundwater by vegetation landscapes can be quantified as the contribution of subaqueous evaporation to land surface evapotranspiration in shallow groundwater areas. In vegetative ecosystems reliant on groundwater, there exists a positive correlation between phreatic evaporation intensity and vegetation coverage. Therefore, submersible evaporation can be calculated separately for vegetated and bare soil areas. The Averyanov formula, widely used both domestically and internationally, is employed to calculate submersible evaporation in bare soil areas, while an improved version of the Aviniyanov formula is utilized for calculating submersible evaporation in vegetated areas. Consequently, the annual average groundwater consumption of vegetation landscapes can be expressed as follows:
E T G = k p E 0 [ ( 1 C p ) ( 1 k 1 ) g 1 ( D w ) + C p ( 1 k 2 ) g 2 ( D w ) ]
Among these parameters, E T G is the ecological water consumption of vegetation landscape groundwater, E0 represents the corrected water surface evaporation intensity, which is treated as a value of 20 cm evaporation dish water surface evaporation intensity (approximately 600 mm). The maximum value of the landscape-scale land surface evapotranspiration coefficient is represented by k P (approximately 0.5 according to experience), while C P represents the relative vegetation coverage (dimensionless and ranging from 0 to 1), and k 1 and k 2 are the distribution ratios of large burial depth evaporation in bare soil areas and vegetation-covered areas (corresponding to land surface evapotranspiration intensity unrelated to groundwater). According to the analysis results of MOD16 evapotranspiration data, the results of large burial depth area are obtained, k 1 = 0.56, k 2 = 0.69. g 1 ( D w ) is the phreatic water evaporation function in the bare soil area, using the Averyanov formula:
g 1 ( D w ) = ( 1 D w d 1 ) 2 , D w < d 1 ; g 1 ( D w ) = 0 , D w d 1
Among these parameters, d 1 is the maximum burial depth of phreatic water evaporation in the bare soil area.
g 2 ( D w ) is the phreatic water evaporation function in vegetation-covered areas, which is similar in form to the Avinyanov formula, but is affected by the root layer, resulting in a downward movement of the evaporation surface. It can be approximately rewritten as:
g 2 ( D w ) = 1 , D w < d r ; g 2 ( D w ) = ( 1 D w d r d 2 d r ) 2 , d r D w < d 2 ; g 2 ( D w ) = 0 , D w d 2
Among these parameters, d r is the depth of evaporation caused by the root layer, and d 2 is the ultimate burial depth of phreatic water evaporation in vegetation-covered areas. The maximum burial depth of bare soil areas and vegetation-covered areas may be the same or significantly different. Moreover, it is possible that both d r and d 2 vary with vegetation type. Due to the lack of a quantitative basis, this study will temporarily simplify their parameter values to constants. In Hunshandak Sandy Land, the empirical value of the maximum burial depth in the bare soil area is d 1 = 3 m, the empirical value of the maximum burial depth in the vegetation-covered area is d 2 = 5 m, and the downward displacement depth of the evaporation surface can be taken as d r = 1 m.

3.3. Groundwater Demand of Lakes

High-salinity lakes, such as Sanggendalai Lake and Zhagesitai Lake, are distributed throughout the study area, including small shallow wetland lakes. These bodies of water play a crucial ecological role in local microclimates and wildlife habitats, deriving their sustenance from the baseflow drainage of groundwater. Assuming a circular geometry for these lakes’ surfaces, their areas can be calculated as follows:
A L = π R L 2
where A L is the lake area and R w is the equivalent radius of the lake surface (m).
The water consumption of the lake is:
Q L = E 0 A L
where Q L represents the ecological water requirement of the lake (m3/a) and E 0 is evaporation from the water surface.

4. Evaluation Results of Groundwater Ecological Water Demand
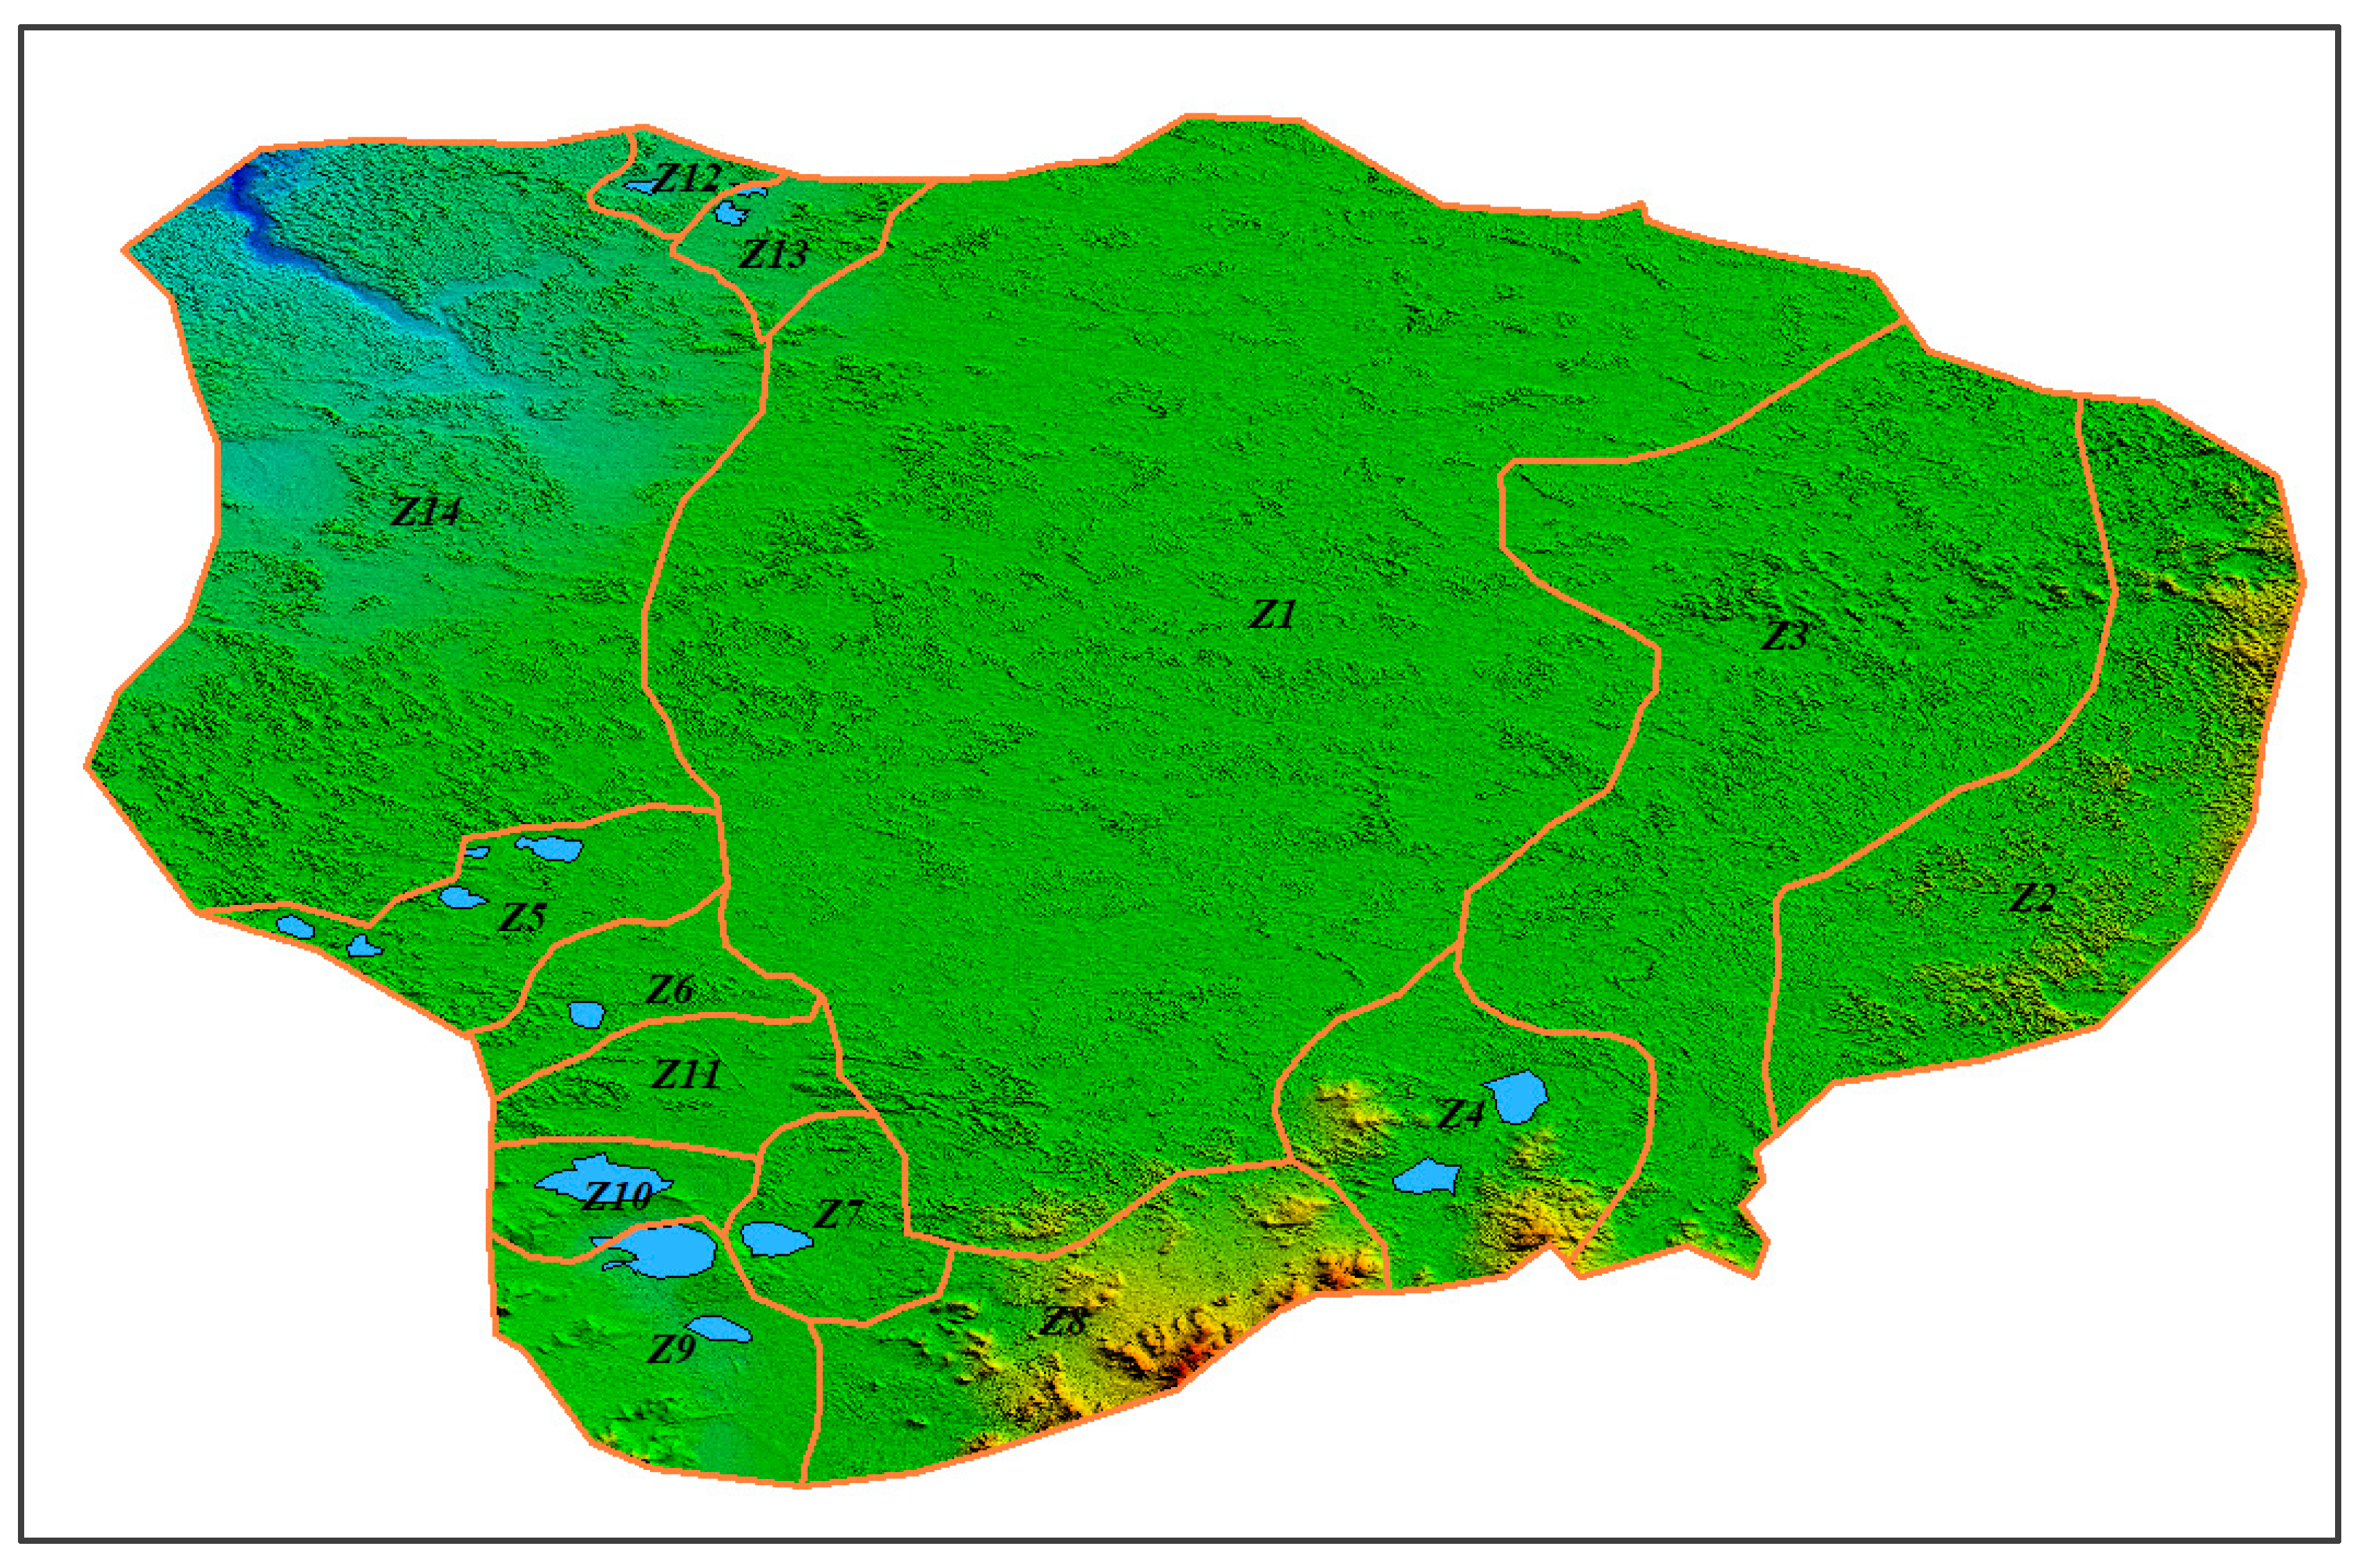
4.1. Block Division

The natural ecological water demand of groundwater primarily manifests in wetland and grassland areas centered around lakes, as well as in vegetation such as shrubs and trees that rely on groundwater. From a hydrogeological perspective, this demand occurs within the shallow-buried deep zone of groundwater where significant evapotranspiration takes place. This study identified the area as a bare soil zone with groundwater depths ranging from 0 to 3 m and vegetation coverage ranging from 0 to 5 m. The objective was to determine the contribution of phreatic water evaporation in maintaining the lake and vegetation ecologies.
To illustrate the spatial distribution characteristics of ecological water demand, the study area was partitioned into blocks for ecological water demand assessment based on relatively independent lake landforms and basins (Figure 3). The preliminary division of 14 relatively independent blocks is primarily based on geomorphic watersheds and the distribution characteristics of lake groups. For areas with groundwater depths greater than 5 m, the consumption of phreatic water evaporation is partially offset by effective infiltration recharge, and no separate assessment for ecological water demand is conducted.

4.2. Evaluation Results

By conducting a comprehensive groundwater depth analysis in the study area, we determined that the lake area spans 40.17 km2, with an estimated annual water consumption of 4017 × 104 m3/a. Additionally, we identified the distribution characteristics of the bare soil area with a groundwater depth of less than 3 m, which covers an area of 51.31 km2 and has an average groundwater depth of 1.51 m. The ecological water consumption associated with this underground water resource is calculated to be approximately 22.94 × 10⁴ m3/a.
Furthermore, our investigation revealed a vegetation-covered region spanning an extensive area of 2401.64 km2, where average groundwater depths are 3.2 m and vegetation coverage reaches approximately 0.33 on average within this zone. Consequently, the ecological water consumption attributed to this groundwater source amounts to approximately 5746.137 × 104 m3/a.
In summary, the total ecological water consumption related to groundwater resources within the study area is estimated at 9763.13 × 104 m3/a. Table 1, Table 2 and Table 3 present detailed calculations for each partition.

5. Discussion

5.1. Allowable Groundwater Drawdown under the Control of Ecological Guarantee Rate

In order to ensure a healthy ecological situation, human water intake needs to be limited. The Michigan Water Intake Evaluation Method is a large-scale permitted water intake evaluation technology proposed by the Michigan Department of Natural Resources. According to this method, when the number of characteristic species (density) drops below 90% of the original level, or the number of dominant species drops below 80% of the original level, human water extraction has a negative resource impact [40]. The vegetation coverage serves as an indicator of the ecological status characteristics within the study area, exhibiting a certain correlation with groundwater depth [41]. Within a specific range, there is a negative relationship between vegetation coverage and groundwater depth. According to the research on the ecological value of Otindag Sandy Land, the zonal vegetation in this area is a typical grassland. Since 2000, the desertification of Otindag Sandy Land has shown a reversing trend, and about 21% of the sandy land has been converted to low- and medium-coverage grassland. From the perspective of ecological value, the current vegetation coverage should be maintained at no less than 80%, thus necessitating control over groundwater levels to meet this requirement. The response curve of relative vegetation coverage to changes in groundwater depth can be depicted using Formula (2). It is observed that the shape of the response curve varies with different initial groundwater depths. We define a minimum ecological response threshold for vegetation at C P / C P 0 = 80 % . Therefore, when C P / C P 0 reaches 80%, it corresponds to the maximum allowable decrease in groundwater burial depth. By adhering to these ecological conservation principles, we can determine the permissible depth for any given site. Our findings indicate that higher initial groundwater depths result in reduced sensitivity of vegetation to declining water levels. To obtain an expression for the maximum allowable drop ( s p ) in depth, Formula (2) can be reformulated as follows:
s p = D w D w 0 = 1 η ln [ exp ( η D w 0 ) 0.8 exp ( η D w 0 ) 0.2 ( a / b ) ]
The findings demonstrate that for an initial groundwater depth of 0 m, the maximum permissible depth is determined to be 0.9 m. Similarly, when the initial underground water depth is set at 2 m, the maximum allowable depth increases to 1.9 m.
In the case of anthropogenic interference, there is a general decline in groundwater levels and subsequent reduction in base flow to the lake, leading to a decrease in lake level and shrinkage of its surface area. From an ecological perspective, the extent of the lake area plays a pivotal role in determining its ecosystem dynamics. Assuming that the lakeshore can be approximated as a conical ring, we can establish the following relationship between lake water level and equivalent radius:
h = z 0 + J R L
The water level of the lake, represented by the base elevation (m), is influenced by factors such as the slope of the lake bank and the equivalent radius of the lake surface. A change in the lake level from its initial state results in a corresponding alteration in the lake surface area, which can be described as follows:
A L A L 0 = R L 2 R L 0 2 = ( h z 0 ) 2 ( h 0 z 0 ) 2
Among these parameters, A L 0 , R L 0 , and h 0 represent the lake area, equivalent radius, and lake level in its pristine state. The objective of ecological preservation is to uphold a minimum of 80% resemblance to the natural conditions of the lake; thus, A L / A L 0 = 0.8 . Consequently, the permissible decline in the lake level is as follows:
s L = 0.11 ( h 0 z 0 ) = 0.11 R L J
The allowable drop of the lake level is 0.55 m, given an equivalent radius of the lake surface ( R L ) of 1000 m and a slope of the lake bank ( J ) at 0.5%.

5.2. Ecological Water Demand Coefficient

In the allocation of water resources in arid and semi-arid areas, it is imperative to fully consider the natural ecological water demand for water resources, particularly groundwater resources [42,43,44]. The ecological impacts of groundwater within the study area primarily manifest through lake surface evaporation that sustains the scenic landscape and vegetation transpiration reliant on groundwater. The fundamental approach to assessing the natural ecological water demand of groundwater can be elucidated by the following formula:
Q d = β Q g
where Q d represents the groundwater’s ecological water requirement, Q g denotes the ecological water consumption resulting from long-term groundwater discharge, and β is the coefficient reflecting the ecological water demand under a specific guarantee rate. The coefficient depends on the proportion of necessary water consumption for maintaining ecological health relative to the average long-term ecological water consumption.
In this study, the coefficient of ecological water demand was determined by calculating the proportion of water consumption required to maintain 80% of the natural perennial average state based on ecological indices. For lakes, a decrease in the water table results in a reduction in evaporation water consumption and subsequently lake shrinkage. The ecological threshold of the lake is established at 80%, indicating that the lake area should reach 0.8 times the long-term average state. Similarly, as groundwater depth increases in shallow-buried areas, relative vegetation coverage decreases and an ecological threshold of 80% is set for vegetation; critical conditions occur when the characteristic values of vegetation coverage decrease to 80% of normal states. The critical depth-to-normal diving evaporation intensity ratio typically falls below 0.8. The groundwater’s ecological water requirement was determined to be 82 million cubic meters per year, accounting for 86% of the average ecological water requirement coefficient. This finding indicates that, on average, only 14% of the groundwater discharge to the ecosystem is non-essential for ecological consumption. As groundwater recharge and discharge are in equilibrium over a natural multi-year period, this implies that 86% of the area’s groundwater resources are required to maintain ecological health, leaving only 14% available for human use. The ecological water requirement of groundwater was calculated, while ensuring a certain vegetation ecological guarantee rate in the study area. However, it is necessary to further investigate the intricate dynamic processes of ecosystem response to changes in groundwater levels during the study.

6. Conclusions

The objective of this study was to evaluate the ecological water requirements of groundwater-dependent lakes and vegetation in arid regions. Based on the comprehensive use of a previous remote sensing interpretation of a lake area, remote sensing interpretation of vegetation coverage, remote sensing data of the land evapotranspiration model, and high-resolution data of groundwater depth, it is determined that in a shallow-buried groundwater area, vegetation coverage tends to decrease with the increase in groundwater depth, and the functional relationship between vegetation coverage and groundwater depth is established. In order to assess the ecological water requirement of groundwater in the study area, the study area was divided into 14 blocks according to the relatively independent characteristics of lake basins. It is calculated that the total ecological water consumption in shallow groundwater areas (vegetation-covered areas with groundwater buried at a depth of less than 5 m and bare soil areas with groundwater buried at a depth of less than 3 m) is 97 million cubic meters per year. In recent years, the intervention of human activities has inevitably hindered the healthy development of the groundwater-dependent ecosystem. In order to ensure the health of the ecosystem, it is determined that the groundwater consumption in the study area under the condition that the ecological guarantee rate is 80% is 83 million cubic meters, which means that on the premise of ensuring healthy ecological conditions, the allowable human exploitation and utilization rate of shallow groundwater is only 16%. The relationship between vegetation coverage and groundwater depth is not a deterministic and unique function but involves a great deal of randomness. In this study, only the statistical relationship between them is considered. Given that, how does randomness affect the evaluation of ecological water demand? This is another problem that remains to be solved.

Author Contributions

Conceptualization, Y.C., C.X. and Y.Z.; Investigation, H.L., Z.Z. and D.Z.; Writing—original draft, G.Z.; Project administration, H.N. All authors have read and agreed to the published version of the manuscript.

Funding

This research work was supported by the National Major Ecological Risk Monitoring and Assessment, Geological Survey Level II Project (no. DD20221772) and the Youth Innovation Fund of China Natural Resources Aeronautical Geophysical Exploration and Remote Sensing Center (no. 2020YFL21).

Data Availability Statement

The vegetation index data that support the findings of this study are openly available in [repository name MODIS13Q1] at https://lpdaac.usgs.gov/. The buried depth data of water table presented in this study are available in [Zhang, G.; Nie, H.; Xiao, C.; Xue, H.; Zhao, X.; Li, T.; Zhu, Z. Effect of groundwater depth on vegetation coverage in southeastern margin of Otindag Sandy Land, Journal of Arid Land Resources and Environment. 2022, 36, 147–153].

Acknowledgments

The authors would like to thank the editors and anonymous reviewers for their helpful comments, which improved the quality of the final manuscript. The authors would also like to thank the Geospatial Data Cloud website supported by the Computer Network Information Center, Chinese Academy of Sciences, as the source of the remote sensing image data.

Conflicts of Interest

The authors declare that they have no known competing financial interests or personal relationships that could have appeared to influence the work reported in this paper.

References

  1. Pang, X.; Fatichi, S.; Lei, H.; Cong, Z.; Yang, H.; Duan, L. Environmental changes promoted vegetation growth and reduced water yield over the temperate semi-arid grassland of China during 1901–2016. J. Hydrol. 2023, 618, 129235. [Google Scholar] [CrossRef]
  2. Soldo, B.; Mahmoudi Sivand, S.; Afrasiabian, A.; Đurin, B. Effect of Sinkholes on Groundwater Resources in Arid and Semi-Arid Karst Area in Abarkooh, Iran. Environments 2020, 7, 26. [Google Scholar] [CrossRef]
  3. Fan, Y.; Li, H.; Miguez-Macho, G. Global Patterns of Groundwater Table Depth. Science 2013, 339, 940–943. [Google Scholar] [CrossRef]
  4. Ding, Z.; Fang, G.; Wen, X.; Tan, Q.; Lei, X.; Liu, Z.; Huang, X. Cascaded Hydropower Operation Chart Optimization Balancing Overall Ecological Benefits and Ecological Conservation in Hydrological Extremes Under Climate Change. Water Resour. Manag. 2022, 34, 1231–1246. [Google Scholar] [CrossRef]
  5. Jiangyi, L.; Shiquan, D. Eco-compensation in China: Achievement, experience, and improvemen. Environ. Sci. Pollut. Res. 2022, 29, 60867–60884. [Google Scholar] [CrossRef] [PubMed]
  6. Botai, C.M.; Botai, J.O.; Muchuru, S.; Ngwana, I. Hydrometeorological Research in South Africa: A Review. Water 2015, 7, 1580–1594. [Google Scholar] [CrossRef]
  7. Reynolds, J.F.; Smith, D.; Lambin, E.F.; Turner, B.L.; Mortimore, M.; Batterbury, S.P.J.; Downing, T.E.; Dowlatabadi, H.; Fernandez, R.J.; Herrick, J.E.; et al. Global Desertification: Building a Science for Dryland Development. Science 2007, 316, 847–851. [Google Scholar] [CrossRef]
  8. Mechelen, C.V.; Dutoit, T.; Hermy, M. Adapting green roof irrigation practices for a sustainable future: A review. Sustain. Cities Soc. 2015, 19, 74–90. [Google Scholar] [CrossRef]
  9. Meinzer, O.E. Plants as Indicators of Ground Water; US Geological Survey Water-Supply Paper 577; US Government Printing Office: Washington, DC, USA, 1927. [Google Scholar]
  10. Naumburg, E.; Mata-Gonzalez, R.; Hunter, R.G.; Mclendon, T.; Martin, D.W. Phreatophytic Vegetation and Groundwater Fluctuations: A Review of Current Research and Application of Ecosystem Response Modeling with an Emphasis on Great Basin Vegetation. Environ. Manag. 2005, 35, 726–740. [Google Scholar] [CrossRef]
  11. Huntington, J.; Mcgwire, K.; Morton, C.; Snyder, K.; Peterson, S.; Erickson, T.; Niswonger, R.; Carroll, R.; Smith, G.; Allen, R. Assessing the role of climate and resource management on groundwater dependent ecosystem changes in arid environments with the landsat archive. Remote Sens. Environ. 2016, 185, 186–197. [Google Scholar] [CrossRef]
  12. Hao, X.; Li, W.; Huang, X.; Zhu, C.; Ma, J. Assessment of the groundwater threshold of desert riparian forest vegetation along the middle and lower reaches of the Tarim River, China. Hydrol. Process. Int. J. 2010, 24, 178–186. [Google Scholar] [CrossRef]
  13. Wang, Y.; Chen, M.; Yan, L.; Yang, G.; Ma, J.; Deng, W. Quantifying Threshold Water Tables for Ecological Restoration in Arid Northwestern China. Groundwater 2020, 58, 132–142. [Google Scholar] [CrossRef]
  14. Li, D.; Li, X.; He, X.; Yang, G.; Du, Y.; Li, X. Groundwater Dynamic Characteristics with the Ecological Threshold in the Northwest China Oasis. Sustainability 2022, 14, 5390. [Google Scholar] [CrossRef]
  15. Horton, J.L.; Kolb, T.E.; Hart, S.C. Physiological response to groundwater depth varies among species and with river flow regulation. Ecol. Appl. 2001, 11, 1046–1059. [Google Scholar] [CrossRef]
  16. Hatton, T.; Evans, R. Dependence of Australian ecosystems on groundwater. Water Resour. Res. 1998, 25, 40–43. [Google Scholar]
  17. Zencich, S.J.; Froend, R.H.; Turner, J.T.; Gailitis, V. Influence of groundwater depth on the seasonal sources of water accessed by Banksia tree species on a shallow, sandy coastal aquifer. Oecologia 2002, 131, 8–19. [Google Scholar] [CrossRef] [PubMed]
  18. Eamus, D.; Froend, R.; Loomes, R.; Hose, G.; Murray, B. A functional methodology for determining the groundwater regime needed to maintain the health of groundwater-dependent vegetation. Aust. J. Bot. 2006, 54, 97–114. [Google Scholar] [CrossRef]
  19. Rossatto, D.R.; Silva, L.d.C.R.; Villalobos-Vega, R.; Sternberg, L.d.S.L.; Franco, A.C. Depth of water uptake in woody plants relates to groundwater level and vegetation structure along a topographic gradient in a neo tropical savanna. Environ. Exp. Bot. 2012, 77, 259–266. [Google Scholar] [CrossRef]
  20. Wang, P.; Zhang, Y.; Yu, J.; Fu, G.; Ao, F. Vegetation dynamics induced by groundwater fluctuations in the lower Heihe River Basin, northwestern China. J. Plant Ecol. 2011, 1–2, 77–90. [Google Scholar] [CrossRef]
  21. Elmore, A.; Mustard, J.F.; Manning, S.J. Regional patterns of plant community response to changes in water: Owens Valley, California. Ecol. Appl. 2003, 13, 443–460. [Google Scholar] [CrossRef]
  22. Yang, X.; Smith, P.L.; Yu, T.; Gao, H. Estimating evapotranspiration from terrestrialgroundwater-dependent ecosystems using landsat images. Int. J. Digit. Earth 2011, 4, 154–170. [Google Scholar] [CrossRef]
  23. Kath, J.; Boulton, A.J.; Harrison, E.T.; Dyer, F.J. A conceptual framework for ecological responses to groundwater regime alteration (FERGRA). Ecohydrology 2018, 11, e2010. [Google Scholar] [CrossRef]
  24. Eamus, D.; Froend, R. Groundwater-dependent ecosystems: The where, what and why of GDEs. Aust. J. Bot. 2006, 54, 91–96. [Google Scholar] [CrossRef]
  25. Shukla, J.; Dhyani, S.; Pujari, P.; Verma, P. Groundwater-Dependent Vegetation to Address the Loss of Ecosystems Dependent on Groundwater Resources. For. Ecol. Manag. 2022, 263–278. [Google Scholar]
  26. Chen, Y.N.; Li, W.H.; Xu, H.L.; Liu, J.Z.; Zhang, H.F.; Chen, Y.P. The influence of groundwater on vegetation in the lower reaches of Tarim River, China. Acta Geogr. Sin. 2003, 58, 542–549. [Google Scholar]
  27. Chen, J.; Lv, J.; Li, N.; Wang, Q.; Wang, J. External Groundwater Alleviates the Degradation of Closed Lakes in Semi-Arid Regions of China. Remote Sens. 2019, 12, 45. [Google Scholar] [CrossRef]
  28. Renger, M.; Wessolek, G. Influence of groundwater depth and available soil water on evapotranspiration and plant growth. Int. Agrophys. 2000, 14, 127–134. [Google Scholar]
  29. Pritchett, D.; Manning, S.J. Response of an intermountain groundwater-dependent ecosystem to water table drawdown. West. N. Am. Nat. 2011, 72, 48–59. [Google Scholar] [CrossRef]
  30. Chimner, R.A.; Cooper, D.J. Using stable oxygen isotopes to quantify the water source used for transpiration by native shrubs in the San Luis Valley, Colorado USA. Plant Soil 2004, 260, 225–236. [Google Scholar] [CrossRef]
  31. Lv, J.; Wang, X.S.; Zhou, Y.; Qian, K.; Wan, L.; Eamus, D.; Tao, Z. Groundwater-dependent distribution of vegetation in Hailiutu River catchment, a semi-arid region in China. Ecohydrology 2013, 6, 142–149. [Google Scholar] [CrossRef]
  32. Elmore, A.J.; Kaste, J.M.; Okin, G.S.; Fantle, M.S. Groundwater influences on atmospheric dust generation in deserts. J. Arid. Environ. 2008, 72, 1753–1765. [Google Scholar] [CrossRef]
  33. Zhou, D.; Zhao, X.; Hu, H.; Shen, H.; Fang, J. Long-term vegetation changes in the four mega-sandy lands in Inner Mongolia, China. Landsc. Ecol. 2015, 30, 1613–1626. [Google Scholar] [CrossRef]
  34. Hu, Y.; Zhang, Y. Using 137Cs and 210Pbex to investigate the soil erosion and accumulation moduli on the southern margin of the Hunshandake Sandy Land in Inner Mongolia. J. Geogr. Sci. 2019, 29, 1655–1669. [Google Scholar] [CrossRef]
  35. Lv, C.; Li, X.; Han, Z.; Yong, W.; Zhou, Y.; Jiang, M.; Yang, Q.; Xu, Z.; Yi, S.; Lu, H. Fluvial response to precipitation variations since 36 ka in the Hunshandake Sandy Land in North China. Geomorphology 2018, 317, 128–138. [Google Scholar] [CrossRef]
  36. Zhang, J.; Zhang, Y.; Qin, S.; Wu, B.; Zhu, Y.; Shao, Y.; Gao, Y.; Lai, Z. Effects of seasonal variability of climatic factors on vegetation coverage across drylands in northern China. Land Degrad. Dev. 2018, 29, 1782–1791. [Google Scholar] [CrossRef]
  37. Groeneveld, D.P.; Baugh, W.M.; Sanderson, J.S. Annual Groundwater evapotranspiration mapped from single satellite scenes. J. Hydrol. 2007, 344, 146–156. [Google Scholar] [CrossRef]
  38. Huang, F.; Zhang, Y.; Zhang, D.; Chen, X. Environmental Groundwater Depth for Groundwater-Dependent Terrestrial Ecosystems in Arid/Semiarid Regions: A Review. Int. J. Environ. Res. Public Health 2019, 16, 763. [Google Scholar] [CrossRef]
  39. Wang, W.; Kong, J.; Duan, L.; Yang, Z.; Cheng, D.; Zhao, G. Supergene ecological effects induced by groundwater and its thresholds in the arid areas. In Proceedings of the 2011 International Symposium on Water Resource and Environmental Protection, Xi’an, China, 20–22 May 2011; IEEE: New York, NY, USA, 2011; pp. 1–8. [Google Scholar]
  40. Shen, Z.; Zhang, Q.; Chen, D.; Singh, V.P. Varying effects of mining development on ecological conditions and groundwater storage in dry region in Inner Mongolia of China. J. Hydrol. 2021, 597, 125759. [Google Scholar] [CrossRef]
  41. Yang, Z.; Li, W.; Li, X.; He, J. Quantitative analysis of the relationship between vegetation and groundwater buried depth: A case study of a coal mine district in Western China. Ecol. Indic. 2019, 102, 770–782. [Google Scholar] [CrossRef]
  42. Pappalardo, G.; Ferrara, V.; Rapisarda, F.; Termine, R. Groundwater interaction with endoreic lake: Effects on the ecological system of the Pergusa Lake, central-eastern Sicily, Italy. In Proceedings of the International Multidisciplinary Conference on Hydrology and Ecology: The Groundwater Ecology Connection, Karlovy Vary, Czech Republic, 11–14 September 2006. [Google Scholar]
  43. Arai, T. On the Comparison between Calculated and Observed Evaporation Amounts. J. Agric. Meteorol. 2010, 21, 23–27. [Google Scholar] [CrossRef]
  44. Chen, P.; Chen, K.; Gao, Y. Analysis of phreatic evaporation law and influence factors of typical lithology in Hebei Plain. J. Groundw. Sci. Eng. 2018, 4, 270–279. [Google Scholar]
Figure 1. Geographical location of the study area.
Water 15 03504 g001
Figure 2. Interannual variation characteristics of meteorological elements in the research area.
Water 15 03504 g002
Figure 3. Division of groundwater ecological water demand assessment blocks.
Water 15 03504 g003
Table 1. Evaluation of lake ecological water demand in different blocks.
Block CodingLake Area/ A L (km2)Water Surface Evaporation Intensity/ E 0 (mm)Ecological Water Consumption/ Q L (104 m3/a)
Z10.0010000.00
Z20.0010000.00
Z30.0010000.00
Z47.461000746.00
Z56.171000617.00
Z61.591000159.00
Z73.551000355.00
Z80.0010000.00
Z911.2210001122.00
Z107.881000788.00
Z110.0010000.00
Z120.63100063.00
Z131.671000167.00
Z140.0010000.00
Total40.1710004017
Table 2. Evaluation of the ecological water demand of bare soil areas in different blocks.
Block CodingBare Soil Area
(km2)
Average Depth of Groundwater
(m)
Groundwater Evaporation Intensity
(mm)
Ecological Water Consumption
(104 m3/a)
Z128.062.156.1517.27
Z20.000.000.000.00
Z37.752.581.481.15
Z40.381.889.380.36
Z50.811.8812.771.03
Z60.252.135.540.14
Z70.000.000.000.00
Z80.000.000.000.00
Z90.000.000.000.00
Z100.130.9525.400.33
Z110.312.017.560.23
Z120.312.314.420.14
Z130.062.680.990.01
Z1413.252.551.722.28
Total51.311.515.3922.94
Table 3. Evaluation of the ecological water demand of vegetation-covered areas in different blocks.
Block CodingVegetation-Covered Area (km2)Average Depth of Groundwater
(m)
Vegetation CoverageGroundwater Evaporation Intensity
(mm)
Ecological Water Consumption
(104 m3/a)
Z11029.632.880.328923.762446.70
Z28.564.540.31571.050.90
Z3311.383.570.322810.46325.73
Z459.753.700.32178.4850.68
Z598.062.190.336342.85420.22
Z658.632.130.337044.76262.42
Z713.134.210.31793.194.19
Z83.814.640.31510.640.25
Z934.694.110.31864.0914.21
Z1047.251.870.340153.20251.39
Z1172.311.790.341156.59409.19
Z1219.752.730.330427.2253.75
Z1313.883.540.323010.9515.19
Z14630.812.900.328723.281468.37
Total2401.643.20.3322.185723.19
Disclaimer/Publisher’s Note: The statements, opinions and data contained in all publications are solely those of the individual author(s) and contributor(s) and not of MDPI and/or the editor(s). MDPI and/or the editor(s) disclaim responsibility for any injury to people or property resulting from any ideas, methods, instructions or products referred to in the content.

