Article

Enhanced Soil Moisture Retrieval through Integrating Satellite Data with Pedotransfer Functions in a Complex Landscape of Ethiopia

1
Center for Environment and Development Studies, Addis Ababa University, Addis Ababa P.O. Box 1176, Ethiopia
2
Water and Land Resource Center (WLRC), Addis Ababa University, Addis Ababa P.O. Box 3880, Ethiopia
3
School of Engineering, Newcastle University, Newcastle upon Tyne NE1 7RU, UK
4
Department of Hydraulic and Water Resources Engineering, Debre Tabor University, Debre Tabor P.O. Box 272, Ethiopia
5
Australia River Institute and School of Engineering, Griffith University, Brisbane QLD 4111, Australia
*
Author to whom correspondence should be addressed.
Water 2023, 15(19), 3396; https://doi.org/10.3390/w15193396
Submission received: 6 July 2023 / Revised: 13 September 2023 / Accepted: 22 September 2023 / Published: 27 September 2023

Abstract

:
Remotely sensed soil moisture products potentially provide a valuable resource for monitoring agricultural drought and assessing food security. The agriculture dominated countries of Eastern Africa experience high inter-annual variability of rainfall, but the monitoring and assessment of the predominantly rainfed agriculture systems is hindered by an absence of ground-based observations. This study evaluates the accuracy of three soil moisture products: ASCAT SWI 12.5 km, SMAP soil moisture data 9 km (SPL3SMP_E), and enhanced surface soil moisture map derived through integrating ASCAT SWI and Pedotransfer Functions (PTFs) (ASCAT_PTF_SM), in Ethiopia, through comparison with in situ-observed soil moisture datasets. Additionally, a new water retention PTF, developed for Ethiopian soils, is integrated with a high-resolution soil property dataset to enhance the spatial resolution of the soil moisture product. The results show that the new integrated dataset performs better in terms of unbiased root mean square error (ubRMSE = 0.0398 m3/m3) and bias (0.0222 m3/m3) in comparison with ASCAT SWI 12.5 km (ubRMSE = 0.0.0771 m3/m3, bias = 0.1065 m3/m3). SMAP is found to have limitations during the wet season, overestimating soil moisture. The finer spatial resolution of the data allows for a better depiction of heterogeneity of soil moisture across the landscape and can be used to identify water-related issues and improve hydrological models for agricultural water management.

1. Introduction

Soil moisture plays a crucial role in regulating plant transpiration and photosynthesis, which in turn affect the water, energy, and biogeochemical cycles [1,2]. Soil moisture affects how incoming solar radiation is partitioned into sensible heat flux and latent heat flux [3], as well as the distribution of rainfall into surface runoff and sub-surface infiltration [4]. The Global Climate Observing System (GCOS) recognizes soil moisture, specifically up to a depth of 5 cm, as an essential climate variable (ECV) [5]. Soil moisture availability is an important control on the growth of crops and vegetation in general [6]. Therefore, knowledge of the amount and distribution of soil moisture for plant growth is critical to effective agricultural planning. This knowledge is vital for conducting hydrological research and enabling applications like flood/drought prediction, climate forecasting, and efficient agricultural management practices [7]. Unfortunately, a high degree of variability cover time in soil moisture conditions makes planning difficult. With the exception of a handful of fragmented stations, land use planners in Ethiopia do not have access to high-resolution soil moisture data. This lack of spatially explicit and enhanced soil moisture data severely limits the ability of planners to create more effective land use plans.
The measurement of soil moisture can be performed in two ways. The first method is by directly measuring it using in situ techniques such as gravimetric sampling or time domain reflectometry (TDR). The second method involves estimating soil moisture indirectly through remote sensing (RS) techniques. Currently, there are three main remote sensing-based methods of soil moisture measurement: (1) optical/thermal methods, (2) microwave methods, and (3) the microwave-optical/IR synergistic approach. The microwave remote sensing-based methods include active microwave (e.g., [8]), passive microwave (e.g., [9]) and merged product (i.e., active and passive). Microwave remote sensing offers several benefits, including the ability to observe under various weather conditions and at any time of day. One of its advantages is the ability to penetrate the soil surface, enabling the estimation of surface soil moisture content. Advanced scatterometer (ASCAT) microwave sensors include the Advanced Microwave Scanning Radiometer (AMSR-E), the Soil Moisture and Ocean Salinity (SMOS), the Advanced Microwave Scanning Radiometer 2 (AMSR2), and the Soil Moisture Active Passive (SMAP). The different soil moisture products have different spatial resolutions and accuracy. Microwave remote sensing (MW RS) of soil moisture relies on the contrast between the dimensionless dielectric constant of wet soil (80) and dry soil (less than 4). However, the presence of vegetation and rough surface conditions can decrease the sensitivity of MW observations to changes in soil moisture. These effects become more pronounced as the frequency increases, and hence, low frequencies such as L-band (1.4 GHz) are preferred as compared to C-band (6.9 GHz) and X-band (10.7 GHz) [10]. The L-band frequency used by the SMAP satellite has been identified as highly advantageous because it can penetrate through the Earth’s surface to measure soil moisture up to a depth of 5 cm. Moreover, passive remote sensing at the L-band frequency allows for more accurate soil moisture measurements and better detection of temporal soil moisture changes, making it a valuable tool for various applications, including flood risk assessment in poorly gauged basins [11], rainfall-runoff modelling, regional scale irrigation studies [12] and the monitoring of ecosystems [13].
Soil moisture measurement over large areas through in situ soil moisture measurements is impractical because this method is time-consuming, and hence, datasets are typically spatially very sparse. Alternatively, satellite-based soil moisture measurements using microwave methods are of coarse spatial resolution (>9 km), with shallow sensing depth (~5 cm). However, obtaining relatively high spatial-resolution soil moisture data with good temporal resolution is important for water resources management. There is a mismatch between the coarse resolution of microwave remote sensed data and the spatial resolution required for agricultural applications [14]. Various downscaling approaches have been employed to enhance the coarse spatial resolution of satellite-derived soil moisture products, including machine learning techniques, physics-based models, and hydrological models (e.g., [15,16,17]). These methods aim to incorporate additional information from higher-resolution ancillary data sources to effectively increase the spatial detail of the coarse satellite soil moisture data. By integrating satellite data with these techniques, downscaled high-resolution soil moisture estimates can be generated from the native low-resolution observations. Apart from downscaling, it is necessary to integrate satellite observations and PTFs to achieve a complementary advantage and improve the estimation of soil moisture [18,19]. Pedotransfer functions (PTFs) predict soil water retention characteristics from readily available soil data [20]. PTFs allow satellite soil moisture data to be connected to soil properties, providing enhanced consideration for sub-grid variability in soil moisture. Additionally, PTFs fill the gap between the available soil data and other difficult-to-measure properties such as soil moisture values at field capacity and permanent wilting point [21]. There are relatively few studies in the area of soil moisture retrieval from the integration of satellite observations and pedotransfer functions (e.g., [18,19,21]).
The majority of published pedotransfer functions are derived from databases of temperate soils [22,23]. However, PTFs developed elsewhere cannot be applied directly to soils of Ethiopia due to distinctive pedological properties of high-altitude tropical soils. Tropical and temperate clay soils exhibit different properties; the former have low bulk densities, higher permeability, and lower available water capacity [24]. Additionally, PTFs developed for tropical soils are often limited to predicting water content at a few water potentials [23]. Here, we apply a new PTF that predicts the soil water retention parameters of the van Genuchten equation. The PTFs were developed using data on soil water retention collected from 123 soil profiles across Ethiopia and have great potential for supporting agricultural management in this data-scarce region [25].
The specific objectives of this study were to (1) evaluate ASCAT SWI 10-daily 12.5 km and SPL3SMP_E 9 km soil moisture products, (2) generate new spatial layers of soil hydraulic attributes based on locally developed PTFs for Ethiopia, and (3) generate new PTF-integrated high-resolution SM data (250 m) retrieved from the ASCAT SWI in combination with locally developed PTFs for Ethiopia. The SMAP (SPL3SMP_E) and ASCAT SWI soil moisture data and the integrated SM data were validated using ground observations. The effectiveness of these products in the rainfed agricultural landscape of Ethiopia has not previously been fully studied. A national assessment of soil moisture products in an agriculturally dominated country such as Ethiopia can assist watershed scientists and agriculturalists in effectively monitoring hydrological processes and managing water in agriculture. Evaluating the performance of satellite-based soil moisture retrievals is crucial for enhancing their accuracy and exploring their potential applications in hydrology, agriculture, climate studies, and mitigating natural disasters such as droughts and floods.

2. Materials and Methods

2.1. Study Area

Ethiopia is a landlocked country situated in the Horn of Africa, covering approximately 1,127,000 km2. Its landmass primarily consists of a vast elevated plateau that is separated by the rift valley into the northwestern and southeastern highlands (Figure 1). These highland areas are accompanied by corresponding lowlands, creating a noticeable difference in topography. Near the Eritrean border, the elevation reaches its lowest point in Africa, the Afar depression, at a depth of −188 m below sea level. On the other hand, the highest peak is Mount Ras Dejen, located in the Simen Mountains in northern Ethiopia, reaching an elevation of 4509 m above sea level (Figure 1). The most prominent river system in Ethiopia is the Blue Nile, along with the Tekeze/Atbara River system, which is a tributary to the Nile. According to a study by Berhanu et al. [26], Ethiopia has a diverse range of soil types. The researchers classified the land area of Ethiopia into 60 different soil types, with the major three types being lithic leptosols, humic nitisols, and eutric vertisols, covering approximately 18.5%, 11.9%, and 10.2% of the total area, respectively.
The experimental sites for the soil moisture validation are situated in the Aba Gerima watershed, which is located in the Amhara region within the West Gojam Zone of Bahir Dar Zuria woreda. These sites are approximately 15 km northeast of Bahir Dar, the regional capital. Geographically, the watershed is located between latitude 11°8′ and 11°41′ N, and longitude 37°28′ and 37°31′ E.

2.2. Data Sources

2.2.1. In Situ Soil Moisture Data Collection

Between 2017 and 2018, extensive soil moisture and weather data were collected in the Aba Gerima watershed. Eight stations were designated for the in situ measurements (Figure 1). These observation sites were geographically distributed within the SMAP grid of 3 km to account for the spatial soil moisture variability. Since soil moisture heterogeneity is driven by precipitation distribution, topography, soil texture and land cover, the sites are believed to represent these drivers. The basic biophysical characteristics of these sites are described in Table 1.
Access tubes were installed to monitor the volumetric soil water content, specifically in the top layer of the soil (0–5 cm), using the PR2/4 profile probe manufactured by Delta-T Devices Ltd. A hand-held HH2 display device was used to obtain readings of soil moisture with measurements taken daily during the early morning hours (6:00–8:00 a.m.) at regular intervals. The PR2/4 probe was specifically designed for mineral soils and has a high level of measurement accuracy (±6%) based on factory calibration. A weather station located near the soil moisture monitoring sites measured weather data, including rainfall (p), air temperature (t), and relative humidity (rh), at 5-min intervals.
With respect to spatial up-scaling, using the arithmetic mean of the in situ measurements of soil moisture does not give us an accurate estimate of the grid average soil moisture. Therefore, Thiessen polygons were constructed to find the weighting of the stations and to obtain an accurate estimate of the average soil moisture. The Thiessen polygon method was chosen as the standard approach by the SMAP science team [27,28]. The method uses a Voronoi diagram to determine the weighting of the stations. A Voronoi diagram divides a plane into regions that partition the area covered by the input point features into polygons. These polygons are called Thiessen polygons. Each Thiessen polygon contains just one of the point input features, which is a soil moisture station, as illustrated in Figure 1.

2.2.2. Remote Sensing Data for Soil Moisture

ASCAT SWI 12.5 km: Soil moisture is a secondary product that is derived using the Soil Water Index (SWI) data product (10-daily SWI 12.5 km Global V3, SWI10) from Metop ASCAT sensors. The SWI10 product was obtained from the Copernicus Global Land Service website (https://land.copernicus.eu/global/products/swi (accessed on 15 January 2023)). The SWI processing algorithm utilizes near-real-time ASCAT-25 km surface soil moisture (SSM) data to create daily global SWI images. The algorithm is based on the two-layer water balance model suggested by Wagner et al. [29]. It estimates an average profile soil moisture, using SSM obtained from scatterometer data, as an indicator that ranges from 0 to 1. However, as the ASCAT SWI data do not directly represent the actual soil moisture content, they need to be converted into soil moisture units for accurate representation.
SMAP soil moisture data 9 km (SPL3SMP_E): The Soil Moisture Active Passive (SMAP) satellite carried an L-band radar and an L-band radiometer to monitor the Earth’s surface during descending (AM) and ascending (PM) overpasses [12]. This combined approach utilized both active (radar) and passive (radiometer) microwave remote sensing for soil moisture mapping. However, due to mechanical failure, the radar stopped providing active microwave products on 7 July 2015, and since then, only the radiometer has been used for measurements. The SMAP products can be freely downloaded from the website of NSIDC (https://nsidc.org/data/smap/smap-data.html (accessed on 15 January 2023)). SPL3SMP_E is a daily composite of SMAP Level-2 (L2) soil moisture, which is derived from SMAP Level-1C (L1C) interpolated brightness temperatures [30]. The NASA SMAP mission provides various grid sizes of soil moisture data, including 36 km, 9 km, 3 km, and 1 km. The 9 km grid size data, known as SPL3SMP_E, is widely used and has been evaluated in this study. It should be noted that the higher-resolution retrievals from SPL2SMAP_S have not shown significant improvement over the 9 km SPL3SMP_E data [31] and, hence, the latter were chosen for evaluation herein.

2.2.3. Spatial Soil Property Data

Soil properties including percent sand/clay/silt, percent organic carbon, cation exchange capacity (CEC, cmol/kg), pH, and bulk density (BD, g/cm3) were obtained from AfSoilGrids250 m [32] and used as input to the PTF to compute water retention maps for the top layer of the soil (0–5 cm), including maps of the volumetric moisture content (VMC) at permanent wilting point (PWP; pF 4.2) and at field capacity (FC; pF 2.3) and the corresponding maps of the available water content.

2.3. Methods

2.3.1. Computing the Pedotransfer Functions

Measuring a soil water retention curve (θ(h)) is laborious, expensive and time-consuming, with curves often fragmentary, with relatively few θ-h pairs. For modeling, characterization and comparison purposes, it is important to describe the whole of the soil water retention curve in a parametric form. In this study, the unsaturated soil hydraulic functions were described using the widely used van Genuchten (VG) parametric model [33]:
θ h = θ r + θ s θ r 1 + α h n m ,                           h < 0 θ s                                                                           h 0 ,
where θ(h) is the volumetric water content at potential h (cm); θr is the residual water content (cm3 cm−3), i.e., the water content at which the gradient dθ/dh tends to zero as h becomes increasingly negative; θs is the saturated water content (cm3 cm−3); α (cm−1), n, and m are the shape parameters.
Based on the measured and available data, the following water potentials were used to optimize the VG model parameters: pF 0, 2.3, 2.5, 3.0, 3.5, 3.7 and 4.2. In the optimization process, θs was fixed to the measured saturated water content, and Mualem’s restriction of m =1 − (1/n), with n > 0, was implemented in order to reduce the number of model parameters to be optimized. The remaining parameters (θr, α, and n) were optimized by fitting Equation (1) to the measured θ-h data by means of a weighted non-linear least square approach based on Marquardt’s method, as provided by the (RETention Curve (RETC) program [34]. However, during the fitting process, most of the measured water retention data resulted in fitted values for θr equal to zero. Therefore, θr was fixed at the value of zero throughout.

2.3.2. Mapping FC, PWP and Available Water Content

PTFs have been developed for tropical soils in general [22,23], but we used the PTFs indicated in Table 2 that were specifically developed and validated for Ethiopia [25] to parameterize the van Genuchten [33] equation. Pedotransfer functions require specific data to make accurate predictions. Here, these include information on the sand, silt, and clay composition of the soil, as well as the organic carbon content, bulk density, cation exchange capacity, and pH in water. The last two factors act as surrogates for mineralogy, specifically the presence of kaolinite, in heavily washed-out tropical soils. In this study, data on soil water retention were collected from 123 soil profiles. Measurements were taken at different water potentials, including field capacity (FC), permanent wilting point (PWP), and saturation levels. These data were obtained from a previous study conducted by Teferi [25]. The model for predicting θs explained 93% of the variability using predictors such as clay content, bulk density and CEC. However, substantial unexplained variability was observed in ln(α) (51% explained variability) and ln(n − 1) (57% explained variability) PTFs [25].

2.3.3. Merging Satellite Data with PTF

Converting SWI into a quantitative estimate of soil moisture at time t (SM (t)) requires solving the following equation [29,35]:
S M t = W m i n + S W I ( t ) ( W m a x W m i n ) ,
which requires auxiliary information about soil properties. The minimum and maximum soil wetness limits are represented by Wmin and Wmax, respectively. In this context, critical soil moisture values are commonly defined using the permanent wilting point (θPWP), field capacity (θFC), and total water capacity (TWC) (Figure 2). Wmin is closely related to the moisture content at PWP (θPWP), and Wmax can be set equal to the soil moisture content at FC (θFC), except immediately after a heavy rainfall event or irrigation when it can be expected to be between FC and TWC. For practical purposes, Wmax can be taken as the arithmetic mean of FC and TWC [36,37].

2.3.4. Performance Evaluation

Calibration and validation of soil moisture products require knowledge of the “true” value. However, in situ soil moisture measurements often include their own measurement errors. Triple collocation (TC) can be used to characterize errors, using observations from three mutually independent, error-prone measurement sources without requiring a reference dataset or truth [38]. TC-based evaluation [39,40,41] and the extended TC [42] have been used widely in hydrology to estimate errors in soil moisture products. TC-based methods are only reliable if the number of samples is large enough [43,44]. There is a tension between the number of sites that can be practically measured using TC and obtaining a good characterization of the spatial variation over a large area. Thus, this study is based on direct comparison between two datasets (i.e., relative metrics).
To quantitatively evaluate ASCAT SWI, SMAP soil moisture data 9 km (SPL3SMP_E) and the merged SM products (ASCAT_PTF_SM), four performance evaluation indices, including RMSE, the mean bias, the unbiased RMSE (ubRMSE) and Pearson correlation coefficient (r) were computed. The metrics are defined as follows:
R M S E = E [ ( θ e s t θ r e f ) 2 ] ,
B i a s = E θ e s t E [ θ r e f ] ,
u b R M S E = ( R M S E 2 B i a s 2 ) ,
r = ( θ r e f θ r e f ¯ ) ( θ e s t θ e s t ¯ ) ( θ r e f θ r e f ¯ ) 2 ( θ e s t θ e s t ¯ ) 2   ,
θest and θref represent the ASCAT_PTF_SM or SMAP or ASCAT SWI and in situ observed soil moisture values, respectively.

3. Results

3.1. Performance Evaluation Results

3.1.1. SMAP Soil Moisture Data 9 km (SPL3SMP_E)

The performance evaluation results for the comparison between SPL3SMP_E AM, SPL3SMP_E PM, ASCAT SWI 12.5 km, and ASCAT_PTF_SM and in situ surface soil moisture are presented in Table 3. When all months (dry season and wet season) are considered, the RMSEs were 0.2348 and 0.2005 m3/m3 for AM and PM overpasses, respectively (Figure 3a,b). The SPL3SMP_E products from both the AM and PM satellite overpass times show a strong positive correlation (r > 0.9) with ground-measured soil moisture data. The ubRMSE calculated between the SPL3SMP_E products and in situ data is 0.1064 m3/m3 for both morning (AM) and evening (PM) satellite overpasses. However, the correlation is somewhat higher for AM than for PM, but otherwise, the differences between AM and PM metrics are small, as they both have a similar ubRMSE value of 0.1064 m3/m3. This ubRMSE value exceeds the targeted accuracy requirement of 0.04 m3/m3 specified for the Soil Moisture Active Passive (SMAP) mission, indicating that further improvements are needed to meet the desired performance goals.

3.1.2. ASCAT SWI 12.5 km and ASCAT_PTF_SM

Soil moisture maps (decadal) derived by integrating ASCAT SWI and PTF (ASCAT_PTF_SM) were compared and validated with the in situ-observed soil moisture measured between 22 August 2017 and 22 September 2018 at Aba Gerima watershed. The RMSE, ubRMSE, Bias, and correlation coefficient between the in situ measurements and ASCAT SWI 12.5 km and ASCAT_PTF_SM are presented in Table 3 and Figure 4. The soil moisture product derived from this study (i.e., ASCAT_PTF_SM) has smaller ubRMSE (0.0398 m3/m3) than the original ASCAT SWI (0.0771 m3/m3) product. The bias for the ASCAT_PTF_SM product (0.0222 m3/m3) is smaller than that of ASCAT SWI (0.1065 m3/m3). The low RMSE and ubRMSE indicate the predictions performed by the ASCAT_PTF_SM product are quite close to the true values, on average. Therefore, by combining the ASCAT SWI with local PTFs, improved overall accuracy of the SM data was obtained. We assumed that the combination of satellite data and PTFs developed based on local data would provide complementary abilities that could lower the ubRMSE and bias values. However, the ASCAT_PTF_SM product showed a lower value for the correlation coefficient as compared to that of ASCAT SWI, suggesting that although the predictions are fairly accurate overall, the model has some limitations in capturing the complete patterns in the data.

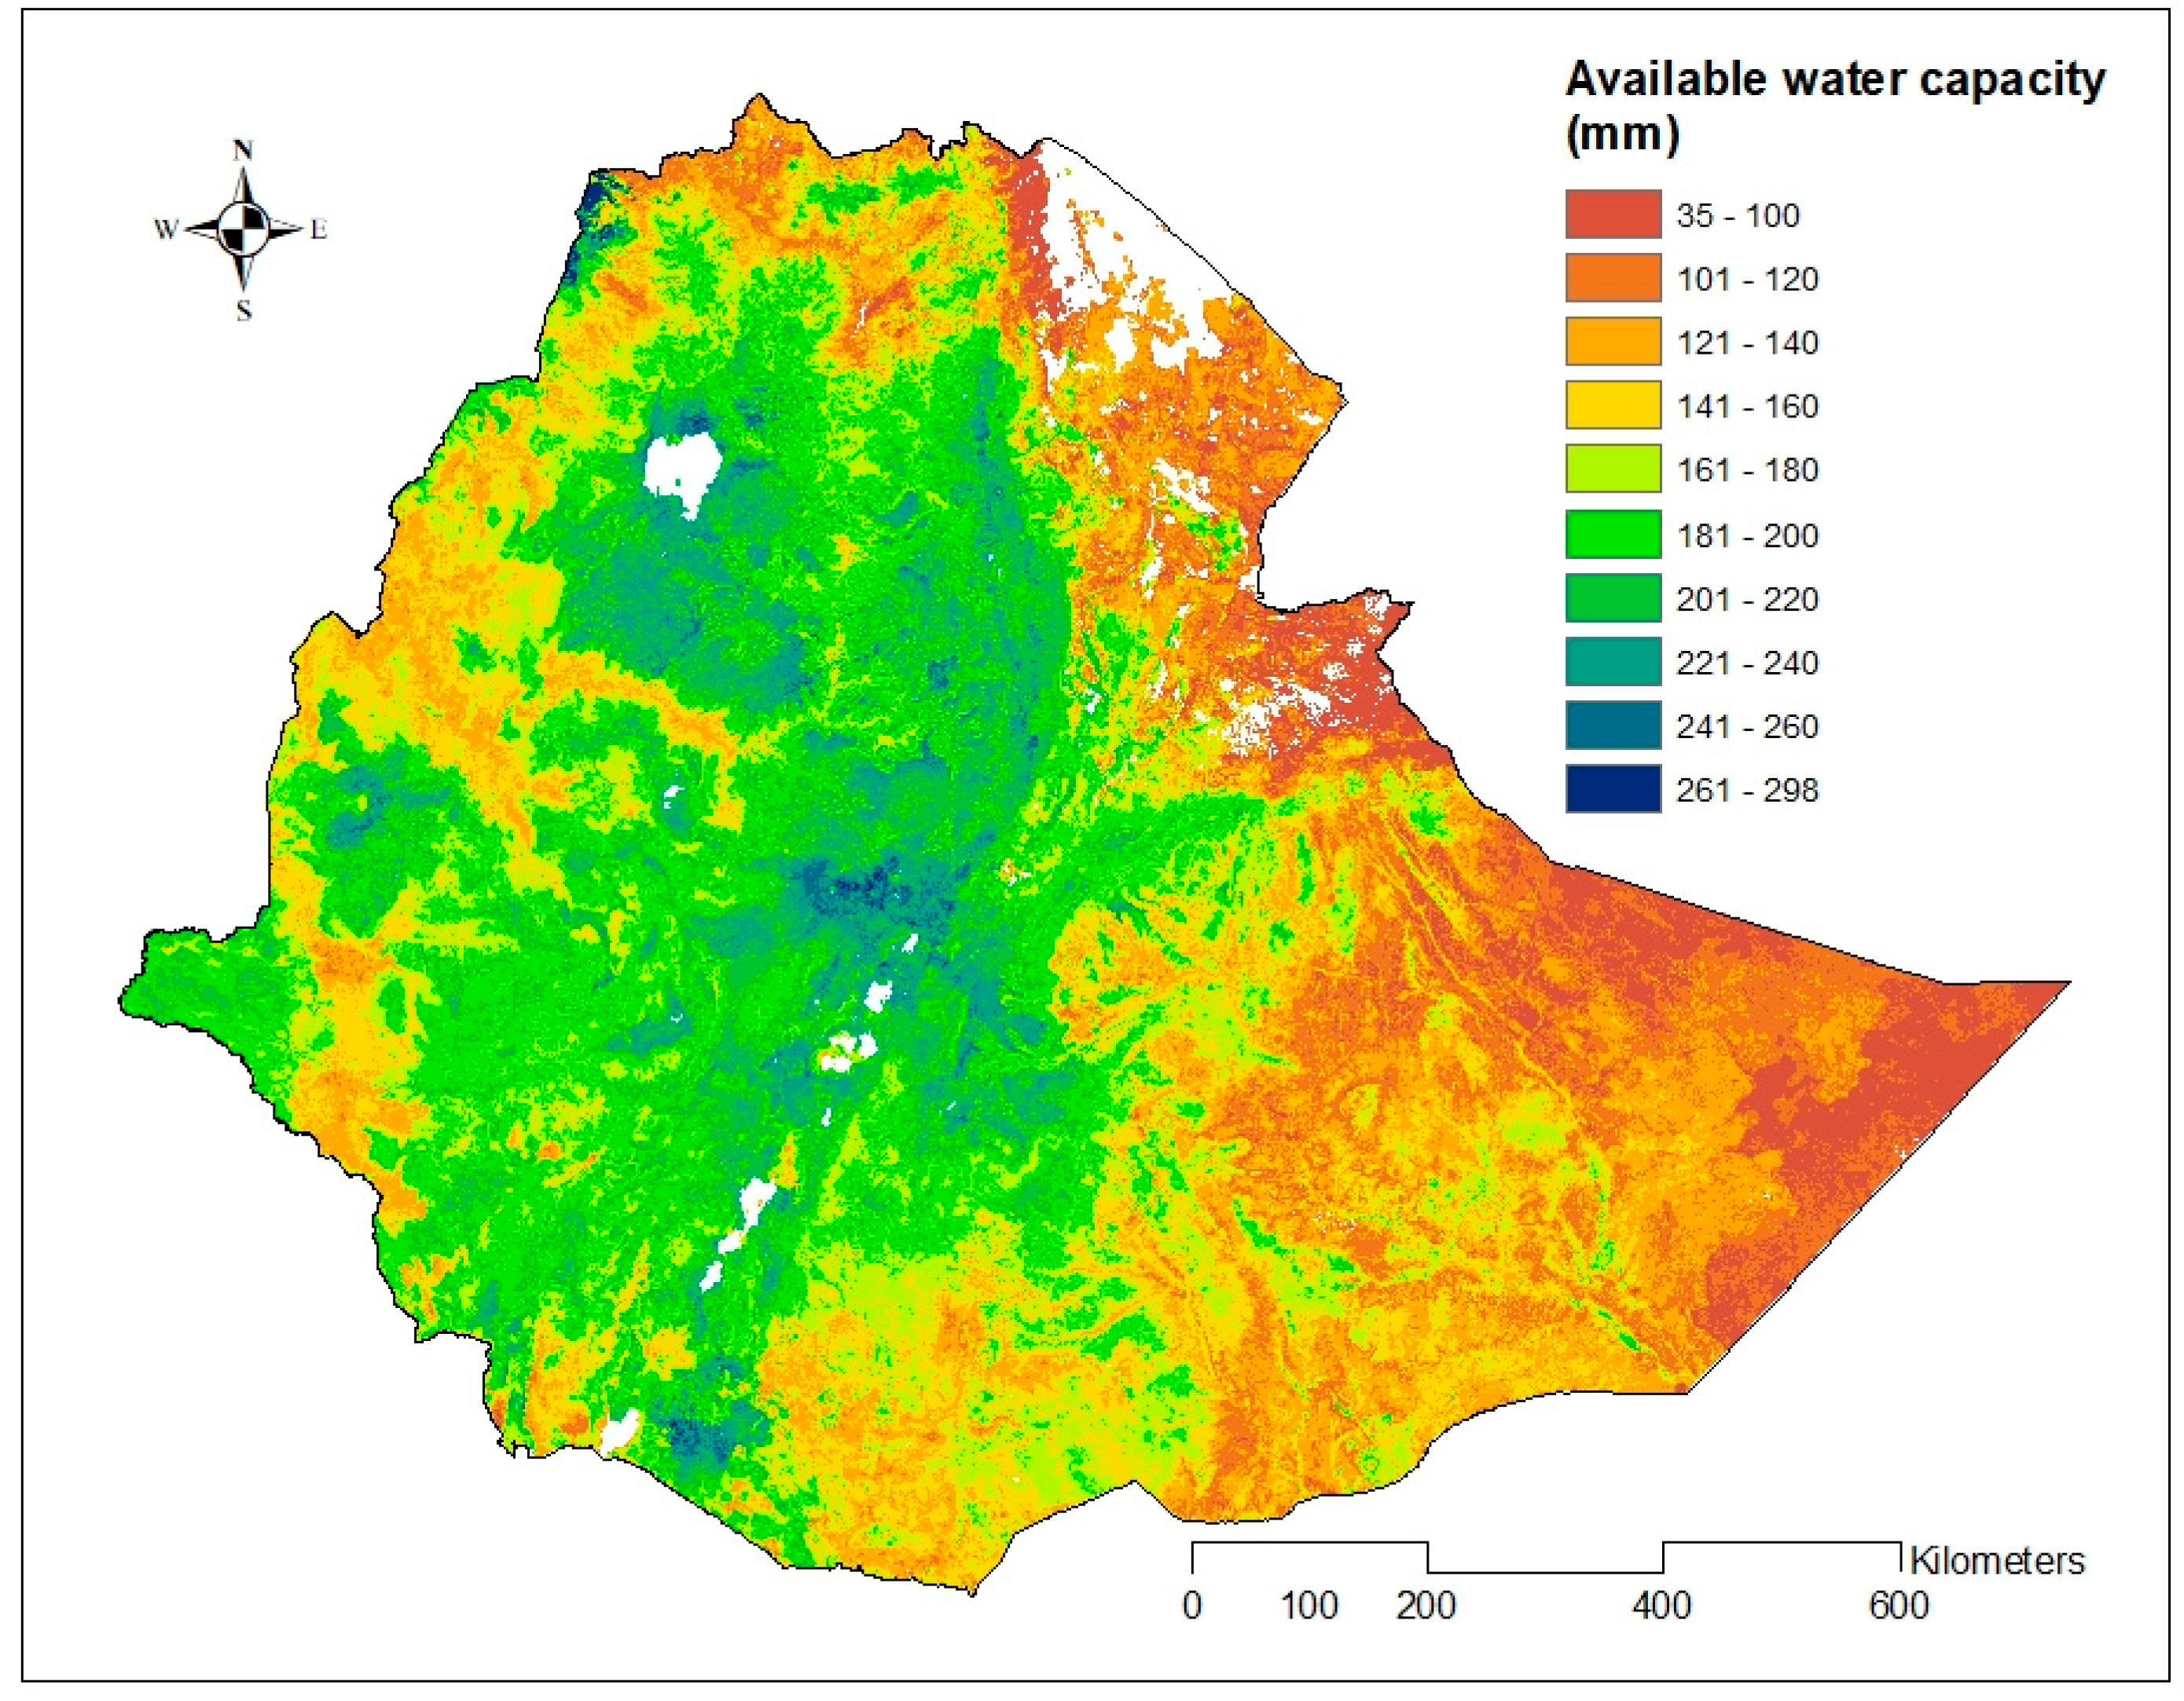
3.2. Derived Maps of Water Content at PWP, FC, and AWC

Table 4 lists the soil hydraulic attributes calculated for Ethiopia for the top surface layer (0–5 cm) based on the SoilGrids datasets. Figure 5 shows a map of the PWP, FC, and TWC. This map would support hydrological, ecological, agricultural or other environmental modeling at the national or watershed scale. Many hydrological, agricultural and ecological models have AWC, θFC, or θPWP as input variables, such as Soil and Water Assessment Tool (SWAT) [45]. Thus, spatially explicit predictions of the AWC at high resolution are relevant for upscaling simulation models at the national scale. A spatially explicit map of plant available water content has the potential to assist researchers and policymakers in working toward various United Nations Sustainable Development Goals. These goals include ensuring food security, promoting sustainable agriculture, mitigating climate change, and managing water resources in a sustainable manner. By providing detailed information on water availability for plants, such maps can aid in developing strategies and policies to address these global challenges.

3.3. Time Series Soil Moisture Data

The comparison between SMAP soil moisture estimates and ground measurements shows seasonal differences (Figure 6). Figure 6 shows that there is a wet bias in the SMAP product, particularly in the wet season when soil moisture values are at their highest. Soil moisture maps from the SPL3SMP_E products, derived from AM and PM satellite overpasses during the dry season months of October–May, have been validated by comparing them with ground-based soil moisture measurements. During the dry season from October to May, the SPL3SMP_E morning (AM) overpass data agree better with the in situ observations, as indicated by lower ubRMSE (0.0626 m3/m3), RMSE (0.1508 m3/m3), and bias (0.1370 m3/m3) values compared to the full 12-month SPL3SMP_E morning (AM) overpass data (Figure 3c,d). This suggests the SPL3SMP_E soil moisture estimates perform better in the dry season (Table 3). The ubRMSE of 0.0519 m3/m3 for the SPL3SMP_E evening (PM) overpass data during October–May is lower than the ubRMSE of the SPL3SMP_E morning (AM) overpass data for the same period. This indicates that the soil moisture variability is better represented in the nighttime (PM overpass) retrievals compared to the daytime (AM overpass) retrievals over the dry season (Figure 3c,d). When comparing in situ measurements with the ASCAT-derived soil moisture product (ASCAT SWI 12.5 km), the agreement is better in the dry season versus the wet season, as illustrated in Figure (xy). The validation results indicate that ASCAT-derived soil moisture products have higher accuracy compared to ground measurements during dry seasons than in wet seasons. ASCAT shows better agreement with in situ data under dry conditions. This finding is consistent with the results reported by Rötzer et al. (2014), who also found that ASCAT had better performance in dry periods relative to wet periods. However, the new ASCAT_PTF_SM product, generated by combining ASCAT data with local pedotransfer functions (PTFs), demonstrated consistently good performance in both dry and wet seasons (Figure 6). The low RMSE (0.0455 m3/m3) and ubRMSE (0.0398 m3/m3) indicate the ASCAT_PTF_SM predictions are quite close to true values, on average. Local PTFs connect satellite soil moisture to soil properties, enhancing applications in agriculture, hydrology, etc. ASCAT provides actual soil moisture status, while PTFs relate it to soil characteristics. We assumed combining ASCAT data with locally derived PTFs would provide complementary abilities with lower errors. Overall, the ASCAT_PTF_SM product showed robust accuracy across seasons, unlike unadjusted ASCAT data.

4. Discussion

4.1. Analysis of Performance of SMAP Product

It was found that the performance of the SPL3SMP_E soil moisture products did not achieve the standard SMAP accuracy of the ubRMSE value of 0.04 m3/m3 for areas with sparse to moderate vegetation cover. This result correlated very well with the SMAP validation result obtained elsewhere [46,47]. The accuracy of soil moisture measurements from the SMAP instrument is affected by several factors. These include the presence of a heterogeneous mix of land cover types and undulating mountain regions with high slope gradients within a SMAP measurement footprint. For example, of the total area within a SMAP measurement footprint (9 km2) of the study area, approximately 79% was cropland, 14% was grassland, 4% was woody vegetation, and 3% was bare land. The main crop grown in the region is maize. The estimated SM error over farmland was mainly attributed to spatial and temporal change in the surface roughness and vertical heterogeneity due to height of corn. Farming activities and rainfall cause temporal change in the surface roughness of farmland in smallholder agricultural areas within one growing season; for example, surface roughness increases due to sowing and decreases due to rainfall. The original SMAP soil moisture algorithms made the assumption that surface roughness was constant, which introduced some uncertainty into the soil moisture estimates [48,49]. According to Nadeem et al. [46], the values of ubRMSE for SPL3SMP E AM and PM overpasses on farmland were 0.052 m3/m3 and 0.057 m3/m3, respectively. Zheng et al. [48] obtained the ubRMSE value of 0.06 cm3/cm3 for the ascending SMAP SM over corn field.
The presence of a heterogeneous mix of land cover types is another factor that affects the accuracy of SM products. The SM retrievals contain more uncertainty in the woodland area as compared to the farmland. According to Nadeem et al. [46] the values of ubRMSE on woodland for SPL3SMP E AM and PM soil moisture estimates were 0.059 m3/m3 and 0.065 m3/m3, respectively. The vegetation canopies can interfere with the satellite’s ability to accurately measure the soil surface temperature. Areas with a heterogeneous mix of land cover types tend to have lower surface temperatures that are underestimated. The landscape heterogeneity makes it hard to accurately estimate the emissivity of the ground surface below. In effect, the algorithm thinks the surface is wetter than reality because the lower emissivity makes it seem like more radiation is being emitted from the moist surface. Therefore, low biased emissivity leads to overestimation of soil moisture content.
The deviation between the observed soil moisture and the SPL3SMP_E product is very large, especially during wet season, June to September (Figure 6). The primary reason for this behavior is the increased influence of vegetation and roughness on the brightness temperature in wet soil conditions [9]. Vegetation and roughness can introduce noise when extracting soil moisture data, which affects the accuracy of the algorithm, particularly in wet soil conditions. Other, similar studies elsewhere have also shown that the error in soil moisture estimates from microwave data increases under very wet soil conditions [50,51]. Overall, the results show the need for improvements in the algorithm for soil moisture retrieval from SPL3SMP_E in this study area. Topography and complex terrain can affect the estimation of surface temperature and soil moisture from satellite microwave sensors in several ways [52,53]. Slope and aspect changes can modify the apparent emissivity that the sensor sees due to changes in viewing angle relative to features on the ground. This can lead to misestimation of emissivity. Approximately 21% of the footprint area in the soil moisture measurement area (9 km2) had a slope of less than 5%, 64% had a slope between 5–15%, and 15% had a slope greater than 15%. This indicates that the dominant part of the study area is not flat. Variations in slope and orientation relative to the sensor’s look angle can impact the measured brightness temperature, with fore slopes appearing warmer and backslopes cooler. This can skew the interpretation of surface temperature if terrain effects are not corrected.
Errors in estimating surface temperature represent another critical source of uncertainty in the SMAP soil moisture product. The surface temperature data used in SMAP retrieval are obtained from the NASA Goddard Earth Observing System Version 5 (GEOS-5) model, and inaccuracies in these modeled surface temperatures can significantly degrade the accuracy of SMAP soil moisture estimates, as highlighted in previous studies [54,55,56].
The SPL3SMP_E datasets have a positive bias that leads to a wet bias in all seasons. This wet bias is especially noticeable during the rainy season, indicating substantial variability in soil moisture. The SPL3SMP_E soil moisture estimates were overestimated with a bias of 0.1700 m3/m3 for PM orbits and bias of 0.2094 m3/m3 for the AM orbits relative to the in situ SM over the period from 22 August 2017 to 22 September 2018. The SPL3SMP_E product for PM orbit shows relatively good performance based on RMSE and bias. The comparable metrics for AM and PM retrievals indicates that PM observations could be more valuable for soil moisture retrieval. AM overpasses have traditionally been preferred for soil moisture retrieval since the temperature contrast between vegetation and soil is typically smaller than later in the day. However, the similarity in metrics suggests PM observations may be just as useful [30]. Further refinement in future updates of the product is expected to reduce the performance gap between AM and PM soil moisture estimates.

4.2. Analysis of Performance of ASCAT SWI 12.5 km and ASCAT_PTF SM

Validation studies evaluating the accuracy of ASCAT-derived soil moisture products have yielded variable results [56,57,58]. In a study by Albergel et al. [57], ASCAT soil moisture products were validated against in situ measurements from over 200 stations across Africa, Australia, Europe and the United States. The results showed moderately good performance, with a correlation coefficient of 0.55, a bias of 0.056 m3/m3, and RMSE of 0.247 m3/m3 between the ASCAT and ground-based soil moisture. In a study by Rötzer et al. [58] focused on western Germany, it was found that the ASCAT-derived soil moisture exhibited higher temporal variability compared to reference ground data. However, despite the greater variability, the ASCAT soil moisture still demonstrated good correlation with the reference measurements over this region.
Figure 6 shows that the 10-day soil moisture maps resulting from the integration of satellite data with PTF work very well at predicting our observed soil moisture data, and this demonstrates that these products can be used as input for site-specific water management plans for residual soil moisture-based agriculture and irrigation management. Finer spatial resolution data (250 m) better capture the heterogeneity of SM over the landscape than coarser data (e.g., 9 and 12.5 km). Figure 6 shows that this discrepancy was pronounced during the wet season. The accuracy of retrieving relative soil moisture from ASCAT backscatter data using the change detection method developed by Wagner et al. [29] can be impacted by several factors. Sensor calibration errors, vegetation dynamics, assumptions of constant surface roughness, rainfall effects, model inaccuracies, and scale mismatches between satellite and ground data can all influence the soil moisture estimates. The change detection method assumes minimal variation in surface roughness over time, rather than accounting for potential roughness changes. Additionally, rainfall events create various effects like surface wetting, increased roughness, and puddling, which alter backscatter but are unrelated to actual subsurface soil moisture changes. This can lead to retrieval errors. For example, heavy rain just before satellite overpass can cause misleadingly low backscatter initially, incorrectly indicating a soil moisture increase. Intense rainfall can also saturate the top soil layer, reducing backscatter due to the wet surface rather than true soil moisture change at depth. Complex or rugged topography can substantially amplify the azimuthal noise in the backscattered radar energy measured by the sensor. This increase in noisy signal returns arising from the terrain is associated with greater uncertainty in soil moisture retrieval.
Improved ways for retrieving soil moisture data have been developed from merging satellite observations with PTFs, which have greatly contributed to our understanding of hydrological characteristics and agricultural water management. By utilizing the enhanced soil moisture data, for example, water-related risk assessment in poorly gauged specific areas can be performed more accurately [11]. Moreover, the availability of high-resolution soil moisture data can enhance the reliability of hydrological models, which are being increasingly utilized for agricultural water management.
It is vital for future research to validate these findings by comparing them with the observed soil moisture data obtained from well-distributed representative soil moisture networks. It has been recognized that there is a lack of in situ stations for soil moisture in Africa, which has implications for the validation of remote-sensed products [59]. Although validation of satellite soil moisture product is difficult in a data-scarce environment such as Ethiopia, this study used measured soil moisture data from eight stations. To address the challenge of data scarcity for validation in the future, it is essential to establish a spatial network of permanent soil moisture stations at various depths representing different land cover conditions. Such a network would enable a more accurate validation and detailed analysis of the satellite-derived soil moisture products. Ultimately, this information could be utilized to optimize the application and effectiveness of soil moisture retrieval products from satellite data in Ethiopia.

5. Summary and Conclusions

This study utilized available in situ time series of soil moisture data to perform an extensive validation for three soil moisture retrieval products using microwave satellite data for Ethiopia, a region that has not previously been analyzed in detail.
There is an urgent need to improve agricultural drought monitoring for food security in sub-Sahara Africa, given the high inter-annual rainfall variability and dependence on rain-fed agriculture. Remotely sensed soil moisture products have the potential to contribute to this need. However, as a prerequisite, the quality of such datasets must firstly be appraised. This study utilized two remotely sensed datasets, ASCAT SWI 10-daily 12.5 km and SMAP SPL3SMP_E 9 km. There are a limited number of stations for validating remotely sensed soil moisture products in Africa. Here, we performed a comparison against in situ data collected from a field campaign within northern Ethiopia. Based on relative metrics, the ASCAT product performed best; the SMAP product had a large wet bias. Several factors influence the accuracy of soil moisture retrievals from the SMAP and ASCAT, including the presence of mixed land cover types and varied topography across the study region.
Additionally, a new, integrated high-resolution SM dataset (ASCAT_PTF_SM) was generated using the ASCAT SWI in combination with a PTF, developed using local soil data, and a global soil property database. The combination of the ASCAT SWI and PTF improved the accuracy of the SM data; for example, the ubRMSE was reduced from 0.0771 to 0.0398 m3/m3. Technological progress has enabled the production of gridded soil data at increasingly higher spatial resolutions, from 1 km × 1 km down to 250 m × 250 m grids. The availability of such fine-resolution soil data facilitates developing enhanced pedotransfer functions (PTFs). With better PTFs, the integration of these functions to improve hydrological estimates such as soil moisture can be strengthened. As spatially explicit soil information becomes available at finer scales, this supports creating more localized and accurate PTFs. Leveraging these high-resolution PTFs to merge with remote sensing data can enhance soil moisture estimation and should be an area of focus moving forward. The proliferation of higher-resolution soil data provides new opportunities to refine PTFs and their integration, for strengthened estimation of key hydrological variables.
We conclude that the ASCAT dataset, combined with the PTF, demonstrates much promise for the operational monitoring of soil moisture. However, there is a need for more in situ field measurements to validate the ASCAT data over the full range of geophysical settings within Ethiopia.

Author Contributions

Conceptualization, E.T.; methodology, E.T.; software, E.T.; validation, E.T., T.K. and B.D.M.; formal analysis, E.T.; investigation, E.T.; resources, G.T.A.; data curation, E.T.; writing—original draft preparation, E.T.; writing—review and editing, T.K., G.O. and G.T.A.; visualization, E.T. and G.T.A.; supervision, G.O.; project administration, T.K.; funding acquisition, G.O. and G.T.A. All authors have read and agreed to the published version of the manuscript.

Funding

This work was supported by the Water Security and Sustainable Development Hub funded by the UK Research and Innovation’s Global Challenges Research Fund (GCRF) [grant number: ES/S008179/1].

Data Availability Statement

Data are available from the first author on reasonable request.

Acknowledgments

The authors wish to thank all editors and reviewers for their outstanding work and contribution to the manuscript.

Conflicts of Interest

The authors declare that they have no known competing financial interests or personal relationships that could have appeared to influence the work reported in this paper.

References

  1. Seneviratne, S.I.; Corti, T.; Davin, E.L.; Hirschi, M.; Jaeger, E.B.; Lehner, I.; Orlowsky, B.; Teuling, A.J. Investigating soil moisture–climate interactions in a changing climate: A review. Earth-Sci. Rev. 2010, 99, 125–161. [Google Scholar] [CrossRef]
  2. Mahmood, R.; Littell, A.; Hubbard, K.G.; You, J. Observed data-based assessment of relationships among soil moisture at various depths, precipitation, and temperature. Appl. Geogr. 2012, 34, 255–264. [Google Scholar] [CrossRef]
  3. Wang, X.; Yang, H.; Li, X.; Chen, L.; Tang, C.; Liu, T.; Tong, X. Responses of sensible and latent heat fluxes to soil moisture changes: Temporal stability analysis across different land surface types on the Tibetan Plateau. Atmosphere 2020, 11, 945. [Google Scholar]
  4. Mezentsev, V.S.; Abrakhimova, Z.F.; Ollesch, G. Influence of Soil Moisture Content on the Rainfall Redistribution into Surface Runoff and Infiltration. Water 2021, 13, 2737. [Google Scholar]
  5. Dorigo, W.A.; Wagner, W.; Hohensinn, R.; Hahn, S.; Paulik, C.; Xaver, A.; Gruber, A.; Drusch, M.; Mecklenburg, S.; van Oevelen, P.; et al. The International Soil Moisture Network: A data hosting facility for global in situ soil moisture measurements. Hydrol. Earth Syst. Sci. 2011, 15, 1675–1698. [Google Scholar] [CrossRef]
  6. Liu, H.; Yang, H.; Wang, Y.; Jia, Z.; Li, S.; Zhang, J. Improved modeling of the responses of ecosystem productivity to soil moisture in a temperate grassland. Sci. Total Environ. 2022, 815, 152932. [Google Scholar]
  7. Joshi, C.; Mohanty, B.P. Physical controls of near-surface soil moisture across varying spatial scales in an agricultural landscape during SMEX02. Water Resour. Res. 2010, 46, W12503. [Google Scholar] [CrossRef]
  8. Ulaby, F.T.; Dubois, P.C.; van Zyl, J. Radar mapping of surface soil moisture. J. Hydrol. 1996, 184, 57–84. [Google Scholar] [CrossRef]
  9. Njoku, E.G.; Jackson, T.J.; Lakshmi, V.; Chan, T.K.; Nghiem, S.V. Soil moisture retrieval from AMSR-E. IEEE Trans. Geosci. Remote Sens. 2003, 41, 215–229. [Google Scholar] [CrossRef]
  10. Kerr, Y.H.; Waldteufel, P.; Wigneron, J.P.; Delwart, S.; Cabot, F.; Boutin, J.; Escorihuela, M.J.; Font, J.; Reul, N.; Gruhier, C.; et al. The SMOS mission: New tool for monitoring key elements ofthe global water cycle. Proc. IEEE 2010, 98, 666–687. [Google Scholar] [CrossRef]
  11. Kim, S.; Zhang, R.; Pham, H.; Sharma, A. A review of satellite-derived soil moisture and its usage for flood estimation. Remote Sens. Earth Syst. Sci. 2019, 2, 225–246. [Google Scholar] [CrossRef]
  12. Lawston, P.M.; Santanello, J.A.; Kumar, S.V. Irrigation signals detected from SMAP soil moisture retrievals. Geophys. Res. Lett. 2017, 44, 11860–11867. [Google Scholar] [CrossRef]
  13. Peng, J.; Albergel, C.; Balenzano, A.; Brocca, L.; Cartus, O.; Cosh, M.H.; Crow, W.T.; Dabrowska-Zielinska, K.; Dadson, S.; Davidson, M.W.; et al. A roadmap for high-resolution satellite soil moisture applications–confronting product characteristics with user requirements. Remote Sens. Environ. 2021, 252, 112162. [Google Scholar] [CrossRef]
  14. Peng, J.; Loew, A.; Merlin, O.; Verhoest, N.E.C. A review of spatial downscaling of satellite remotely sensed soil moisture. Rev. Geophys. 2017, 55, 341–366. [Google Scholar] [CrossRef]
  15. Sabaghy, S.; Walker, J.P.; Renzullo, L.J.; Akbar, R.; Chan, S.; Chaubell, J.; Das, N.; Dunbar, R.S.; Entekhabi, D.; Gevaert, A.; et al. Comprehensive analysis of alternative downscaled soil moisture products. Remote Sens. Environ. 2020, 239, 1115856. [Google Scholar] [CrossRef]
  16. Fang, B.; Lakshmi, V.; Cosh, M.H.; Hain, C. Very high spatial resolution downscaled SMAP radiometer soil moisture in the CONUS using VIIRS/MODIS data. IEEE J. Sel. Top. Appl. Earth Obs. Remote Sens. 2021, 14, 4946–4965. [Google Scholar] [CrossRef]
  17. Xu, L.; Abbaszadeh, P.; Moradkhani, H.; Chen, N.; Zhang, X. Continental drought monitoring using satellite soil moisture, data assimilation and an integrated drought index. Remote Sens. Environ. 2020, 250, 112028. [Google Scholar] [CrossRef]
  18. Leng, P.; Li, Z.-L.; Liao, Q.-Y.; Geng, Y.-J.; Yan, Q.-Y.; Zhang, X.; Shang, G.-F. Enhanced Surface Soil Moisture Retrieval at High Spatial Resolution from the Integration of Satellite Observations and Soil Pedotransfer Functions. IEEE Trans. Geosci. Remote Sens. 2022, 60, 4513711. [Google Scholar] [CrossRef]
  19. Montzka, C.; Rötzer, K.; Bogena, H.R.; Sanchez, N.; Vereecken, H. A New Soil Moisture Downscaling Approach for SMAP, SMOS, and ASCAT by Predicting Sub-Grid Variability. Remote Sens. 2018, 10, 427. [Google Scholar] [CrossRef]
  20. Elsenbeer, H. Pedotransfer Functions in Hydrology. J. Hydrol. 2001, 251, 121–122. [Google Scholar] [CrossRef]
  21. Van Looy, K.; Bouma, J.; Herbst, M.; Koestel, J.; Minasny, B.; Mishra, U.; Montzka, C.; Nemes, A.; Pachepsky, Y.A.; Pa-darian, J.; et al. Pedotransfer Functions in Earth System Science: Challenges and Perspectives. Rev. Geophys. 2017, 55, 1199–1256. [Google Scholar] [CrossRef]
  22. Hodnett, M.G.; Tomasella, J. Marked Differences between van Genuchten Soil Water-Retention Parameters for Temperate and Tropical Soils: A New Water-Retention Pedo-Transfer Functions Developed for Tropical Soils. Geoderma 2002, 108, 155–180. [Google Scholar] [CrossRef]
  23. Tomasella, J.; Hodnett, M. Pedotransfer functions for tropical soils. Dev. Soil Sci. 2004, 30, 415–429. [Google Scholar] [CrossRef]
  24. Minasny, B.; Hartemink, A.E. Predicting soil properties in the tropics. Earth Sci. Rev. 2011, 106, 52–62. [Google Scholar] [CrossRef]
  25. Teferi, E. Soil Hydrological Impacts and Climatic Controls of Land Use and Land Cover Changes in the Upper Blue Nile (Abay) Basin. Ph.D. Thesis, Delft University of Technology and UNESCO-IHE, Delft, The Netherlands, 2015; pp. 142–166. [Google Scholar]
  26. Belete, B.; Melesse, A.M.; Seleshi, Y. GIS-based hydrological zones and soil geo-database of Ethiopia. Catena 2013, 104, 21–31. [Google Scholar]
  27. Colliander, A.; Jackson, T.J.; Bindlish, R.; Chan, S.; Das, N.; Kim, S.B.; Cosh, M.H.; Dunbar, R.S.; Dang, L.; Pashaian, L.; et al. Validation of SMAP surface soil moisture products with core validation sites. Remote Sens. Environ. 2017, 191, 215–231. [Google Scholar] [CrossRef]
  28. Xu, Y.; Liu, C.; Wang, L.; Zou, L. Exploring the Spatial Autocorrelation in Soil Moisture Networks: Analysis of the Bias from Upscaling the Texas Soil Observation Network (TxSON). Water 2023, 15, 87. [Google Scholar] [CrossRef]
  29. Wagner, W.; Lemoine, G.; Rott, H. A method for estimating soil moisture from ERS scatterometer and soil data. Remote Sens. Environ. 1999, 70, 191–207. [Google Scholar] [CrossRef]
  30. O’Neill, P.E.; Chan, S.; Njoku, E.G.; Jackson, T.; Bindlish, R.; Chaubell, J. SMAP Enhanced L3 Radiometer Global Daily 9 km EASE-Grid Soil Moisture; Version 4; Indicate subset used; NASA National Snow and Ice Data Center Distributed Active Archive Center: Boulder, CO, USA, 2020. [Google Scholar] [CrossRef]
  31. Xu, X. Evaluation of SMAP Level 2, 3, and 4 Soil Moisture Datasets over the Great Lakes Region. Remote Sens. 2020, 12, 3785. [Google Scholar] [CrossRef]
  32. Hengl, T.; Heuvelink, G.B.; Kempen, B.; Leenaars, J.G.; Walsh, M.G.; Shepherd, K.D.; Sila, A.; MacMillan, R.A.; Mendes de Jesus, J.; Tamene, L.; et al. Mapping soil properties of Africa at 250 m resolution: Random forests significantly improve current predictions. PLoS ONE 2015, 10, e0125814. [Google Scholar] [CrossRef]
  33. Van Genuchten, M.T. A closed-form equation for predicting the hydraulic conductivity of unsaturated soils. Soil Sci. Soc. Am. J. 1980, 44, 892–898. [Google Scholar] [CrossRef]
  34. Van Genuchten, M.V.; Leij, F.J.; Yates, S.R. The RETC Code for Quantifying the Hydraulic Functions of Unsatu-Rated Soils; U.S. Environmental Protection Agency: Ada, OK, USA, 1991.
  35. Albergel, C.; Rüdiger, C.; Pellarin, T.; Calvet, J.C.; Fritz, N.; Froissard, F.; Suquia, D.; Petitpa, A.; Piguet, B.; Martin, E. From near-surface to root-zone soil moisture using an exponential filter: An assessment of the method based on in-situ observations and model simulations. Hydrol. Earth Syst. Sci. 2008, 12, 1323–1337. [Google Scholar] [CrossRef]
  36. Thapliyal, P.K.; Pal, P.K.; Narayanan, M.S.; Srinivasan, J. Development of a time series–based methodology for estimation of large-area soil wetness over India using IRS-P4 microwave radiometer data. J. Appl. Meteorol. 2005, 44, 127–143. [Google Scholar] [CrossRef]
  37. Chaurasia, S.; Thapliyal, P.K.; Pal, P.K. Application of a time-series-based methodology for soil moisture estimation from AMSR-E observations over India. IEEE Geosci. Remote Sens. Lett. 2012, 9, 818–821. [Google Scholar] [CrossRef]
  38. Stoffelen, A. Toward the true near-surface wind speed: Error modeling and calibration using triple collocation. J. Geophys. Res. Ocean. 1998, 103, 7755–7766. [Google Scholar] [CrossRef]
  39. Miralles, D.G.; Crow, W.T.; Cosh, M.H. Estimating Spatial Sampling Errors in Coarse-Scale Soil Moisture Estimates Derived from Point-Scale Observations. J. Hydrometeorol. 2010, 11, 1423–1429. [Google Scholar] [CrossRef]
  40. Draper, C.; Reichle, R.; de Jeu, R.; Naeimi, V.; Parinussa, R.; Wagner, W. Estimating Root Mean Square Errors in Remotely Sensed Soil Moisture over Continental Scale Domains. Remote Sens. Environ. 2013, 137, 288–298. [Google Scholar] [CrossRef]
  41. Xu, L.; Chen, N.; Zhang, X.; Moradkhani, H.; Zhang, C.; Hu, C. In-Situ and Triple-Collocation Based Evaluations of Eight Global Root Zone Soil Moisture Products. Remote Sens. Environ. 2021, 254, 112248. [Google Scholar] [CrossRef]
  42. McColl, K.A.; Vogelzang, J.; Konings, A.G.; Entekhabi, D.; Piles, M.; Stoffelen, A. Extended triple collocation: Estimating errors and correlation coefficients with respect to an unknown target. Geophys. Res. Lett. 2014, 41, 6229–6236. [Google Scholar] [CrossRef]
  43. Scipal, K.; Dorigo, W.; de Jeu, R. Triple Collocation—A New Tool to Determine the Error Structure of Global Soil Moisture Products. In Proceedings of the 2010 IEEE International Geoscience and Remote Sensing Symposium, Honolulu, HI, USA, 25–30 July 2010; pp. 4426–4429. [Google Scholar] [CrossRef]
  44. Zwieback, S.; Scipal, K.; Dorigo, W.; Wagner, W. Structural and statistical properties of the collocation technique for error characterization. Nonlinear Process. Geophys. 2012, 19, 69–80. [Google Scholar] [CrossRef]
  45. Arnold, J.G.; Fohrer, N. SWAT2000: Current capabilities and research opportunities in applied watershed modelling. Hydrol. Process. 2005, 19, 563–572. [Google Scholar] [CrossRef]
  46. Nadeem, A.A.; Zha, Y.; Shi, L.; Ran, G.; Ali, S.; Jahangir, Z.; Afzal, M.M.; Awais, M. Multi-Scale Assessment of SMAP Level 3 and Level 4 Soil Moisture Products over the Soil Moisture Network within the ShanDian River (SMN-SDR) Basin, China. Remote Sens. 2022, 14, 982. [Google Scholar] [CrossRef]
  47. Ray, R.L.; Fares, A.; He, Y.; Temimi, M. Evaluation and Inter-Comparison of Satellite Soil Moisture Products Using In Situ Observations over Texas, U.S. Water 2017, 9, 372. [Google Scholar] [CrossRef]
  48. Zheng, X.; Feng, Z.; Xu, H.; Sun, Y.; Bai, Y.; Li, B.; Li, L.; Zhao, X.; Zhang, R.; Jiang, T.; et al. Performance of Four Passive Microwave Soil Moisture Products in Maize Cultivation Areas of Northeast China. IEEE J. Sel. Top. Appl. Earth Obs. Remote Sens. 2020, 13, 2451–2460. [Google Scholar] [CrossRef]
  49. O’Neill, P.E.; Chan, S.; Njoku, E.G.; Jackson, T.; Bindlish, R. SMAP Enhanced L3 Radiometer Global Daily 9 km EASE-Grid Soil Moisture; Version 3; NASA National Snow and Ice Data Center Distributed Active Archive Center: Boulder, CO, USA, 2019. [Google Scholar]
  50. Paloscia, S.; Pettinato, S.; Santi, E.; Notarnicola, C.; Pasolli, L.; Reppucci, A. Soil moisture mapping using Sentinel-1 images: Algorithm and preliminary validation. Remote Sens. Environ. 2013, 134, 234–248. [Google Scholar] [CrossRef]
  51. Gruhier, C.; Rosnay, P.D.; Hasenauer, S.; Holmes, T.; Jeu, R.D.; Kerr, Y.; Mougin, E.; Njoku, E.; Timouk, F.; Wagner, W.; et al. Soil moisture active and passive microwave products: Intercomparison and evaluation over a Sahelian site. Hydrol. Earth Syst. Sci. 2010, 14, 141–156. [Google Scholar] [CrossRef]
  52. Ulaby, F.T.; Long, D.F. Microwave Radar and Radiometric Remote Sensing; University of Michigan Press: Ann Arbor, MI, USA, 2014; pp. 1–1116. [Google Scholar]
  53. Mishra, A.; Vu, T.; Veettil, A.V.; Entekhabi, D. Drought monitoring with soil moisture active passive (SMAP) measurements. J. Hydrol. 2017, 552, 620–632. [Google Scholar] [CrossRef]
  54. Cui, C.; Xu, J.; Zeng, J.; Chen, K.S.; Bai, X.; Lu, H.; Chen, Q.; Zhao, T. Soil Moisture Mapping from Satellites: An Intercomparison of SMAP, SMOS, FY3B, AMSR2, and ESA CCI over Two Dense Network Regions at Different Spatial Scales. Remote Sens. 2018, 10, 33. [Google Scholar] [CrossRef]
  55. Mira, M.; Valor, E.; Boluda, R.; Caselles, V.; Coll, C. Influence of soil water content on the thermal infrared emissivity of bare soils: Implication for land surface temperature determination. J. Geophys. Res. Earth Surf. 2007, 112, F04003. [Google Scholar] [CrossRef]
  56. Bartalis, Z.; Wagner, W.; Naeimi, V.; Hasenauer, S.; Scipal, K.; Bonekamp, H.; Figa, J.; Anderson, C. Initial Soil Moisture Retrievals from the METOP-A Advanced Scatterometer (ASCAT). Geophys. Res. Lett. 2007, 34, L20401. [Google Scholar] [CrossRef]
  57. Albergel, C.; de Rosnay, P.; Gruhier, C.; Muñoz-Sabater, J.; Hasenauer, S.; Isaksen, L.; Kerr, Y.; Wagner, W. Evaluation of Remotely Sensed and Modelled Soil Moisture Products Using Global Ground-Based In Situ Observations. Remote Sens. Environ. 2012, 118, 215–226. [Google Scholar] [CrossRef]
  58. Rötzer, K.; Montzka, C.; Bogena, H.; Wagner, W.; Kerr, Y.H.; Kidd, R.; Vereecken, H. Catchment Scale Validation of SMOS and ASCAT Soil Moisture Products Using Hydrological Modeling and Temporal Stability Analysis. J. Hydrol. 2014, 519, 934–946. [Google Scholar] [CrossRef]
  59. Mousa, B.G.; Shu, H. Spatial Evaluation and Assimilation of SMAP, SMOS, and ASCAT Satellite Soil Moisture Products Over Africa Using Statistical Techniques. Earth Space Sci. 2020, 7, e2019EA000841. [Google Scholar] [CrossRef]
Figure 1. Location map of the study area with in situ observation sites. To determine the representative influence of each ground measurement site, Thiessen polygons were constructed around the soil moisture stations. The area of each Thiessen polygon was used as a weight for the corresponding station when aggregating the point-scale data to the satellite footprint scale. The Thiessen polygons displayed on the map were created using ArcGIS. The numbers 1 to 8 in the Thiessen polygon indicate observation sites (see also Table 1).
Water 15 03396 g001
Figure 2. Flow chart for deriving Soil moisture map (dekadal) derived by integrating ASCAT SWI and PTF (ASCAT_PTF_SM).
Water 15 03396 g002
Figure 3. Performance evaluation results: (a) comparison between in situ observed soil moisture and SPL3SMP_E AM for all 12 months, (b) in situ observed soil moisture and SPL3SMP_E PM for all 12 months, (c) comparison between in situ observed soil moisture and SPL3SMP_E AM during October–May (dry season), (d) comparison between in situ observed soil moisture and SPL3SMP_E PM during October–May (dry season).
Water 15 03396 g003
Figure 4. Performance evaluation statistics for the comparison of the in-situ measurements and ASCAT SWI 12.5 km (left), ASCAT_PTF_SM 250 m (right).
Water 15 03396 g004
Figure 5. Map of available water capacity for the top 100 cm depth by taking into account water content at −33 kPa and water content at −1500 kPa.
Water 15 03396 g005
Figure 6. Temporal pattern of the in situ-observed soil moisture (m3/m3) data in comparison with SPL3SMP_E AM and PM estimates (top) and ASCAT SWI 12.5 km and ASCAT_PTF_SM 250 m (bottom).
Water 15 03396 g006
Table 1. Biophysical characteristics of in situ soil moisture observation sites.
SitesLand UseSlope (%)Elevation (m)Soil Texture
Site # 1Degraded hillslope17%2032Sandy loam
Site # 2Degraded hillslope17%2025Loam
Site # 3Cultivated land52002Clay loam
Site # 4Cultivated land102013Clay loam
Site # 5Cultivated land152001Loam
Site # 6Cultivated land51978Clay
Site # 7Cultivated land102013Clay
Site # 8Cultivated land151965Sandy clay loam
Table 2. Parameters used in the PTFs of Teferi [25] and selected optimal regression models.
ParametersPTFs
θs (cm3 cm−3)0.976 − 0.497 × BD − 0.0043 × OC−1 + 3.04 × Cl−1 + 0.00059 × CEC × BD + 0.001 × Cl × BD − 0.135 × CEC−1
α* (cm−1)−3.29 − 0.727 × Ln (Sa) − 0.227 × pH × BD – 0.0153 × CEC × BD + 0.003 × Sa × Cl + 0.0008 × Si × Cl
n* −1.46 + 0.011 × CEC – 0.019 × Sa × BD + 5.56 × 10⁻⁴ Sa × Si – 3.02 × 10⁻⁴ × Si × Cl
α*= ln(α), n* = ln(n − 1).
Table 3. Performance evaluation results.
Soil Moisture RetrievalsubRMSE
(m3/m3)
RMSE
(m3/m3)
Bias
(m3/m3)
rn
SPL3SMP_E AM (12 months)0.10640.23480.20940.91193
SPL3SMP_E PM (12 months)0.10640.20050.17000.90156
SPL3SMP_E AM (Oct–May)0.06260.15080.1370.82116
SPL3SMP_E PM (Oct–May)0.05190.11010.09710.8890
ASCAT SWI 12.5 km (12 months)0.07710.13150.10650.8740
ASCAT_PTF_SM (12 months)0.03980.04550.02220.7540
Table 4. Derived soil hydraulic attributes based on local PTFs of Teferi [23].
NoSoil Hydraulic AttributeSymbolUnitFile Name
1Saturated water content of MvG θ s cm3 cm−3WC_SAT
2Water content at −20 kPa θ 20 cm3 cm−3WC_FC1
3Water content at −33 kPa θ 33 cm3 cm−3WC_FC2
4Water content at −1500 kPa θ 1500 cm3 cm−3WC_PWP
5The inverse of the air-entry value of MvGαcm−1ALPHA
6The shape parameter of MvGn-N
7Available Water Content 1AWC1cm3 cm−3AWC1
8Available Water Content 2AWC2cm3 cm−3AWC1
Disclaimer/Publisher’s Note: The statements, opinions and data contained in all publications are solely those of the individual author(s) and contributor(s) and not of MDPI and/or the editor(s). MDPI and/or the editor(s) disclaim responsibility for any injury to people or property resulting from any ideas, methods, instructions or products referred to in the content.

