Article

Environmental Assessment of Soil and Groundwater Pollution by BTEX Leaching in Valencia Region (Spain)

by
Javier Rodrigo-Ilarri
*,
María-Elena Rodrigo-Clavero
,
José E. Capilla
and
Luis Romero-Ballesteros
Instituto de Ingeniería del Agua y del Medio Ambiente (IIAMA), Universitat Politècnica de València (UPV), Camino de Vera s/n, 46022 Valencia, Spain
*
Author to whom correspondence should be addressed.
Water 2023, 15(18), 3279; https://doi.org/10.3390/w15183279
Submission received: 15 July 2023 / Revised: 13 September 2023 / Accepted: 14 September 2023 / Published: 16 September 2023
(This article belongs to the Special Issue Fate and Transport of Pollutants in Soil and Groundwater)

Abstract

:
The impact of hydrocarbon spills in the unsaturated zone is a significant environmental concern, particularly in locations where contamination arises from leaks in underground fuel storage tanks (USTs). This paper presents the outcomes achieved through the utilization of VLEACH, a finite-difference numerical model, to assess the concentrations of organic contaminants in the solid, liquid, and gas phases within the vadose zone. Additionally, it evaluates the mass transfer of pollutants to the aquifer as part of an environmental assessment for the placement of a forthcoming service station. The study encompasses an analysis of 18 scenarios under realistic conditions based on actual field data. These scenarios were constructed, taking into account various factors, including the nature of the leak (one-time or permanent), the depth of the phreatic level, and the soil conditions and properties. The results highlight the potential environmental consequences of a permanent leak as compared to those resulting from a specific accident. The findings further emphasize the substantial influence of soil moisture on transport phenomena within the vadose zone. Variations in soil moisture significantly alter hydraulic conductivity, impact magnitudes, transport velocities, and even the predominant transport mechanism. Consequently, precise delineation of soil moisture becomes a crucial parameter in such simulations. Additionally, it has been observed that each component of BTEX (benzene, toluene, ethylbenzene, and xylene) experiences varying transport velocities through the vadose zone. Benzene, having a greater propensity to concentrate in the liquid and gas phases, exhibits the swiftest movement through the vadose zone. The detection of benzene in aquifers can serve as an indicator of the potential future arrival of the remaining BTEX compounds.

1. Introduction and Objectives

Groundwater has become one of the main resources for the supply of drinking water [1,2,3]. However, its quality has decreased due to pollution, caused mainly by industrialization [4,5], which continuously produces large amounts of organic and inorganic pollutants [6,7,8]. Recent research is focused on the chemical characterization of groundwater using numerical models [9,10,11,12,13,14,15]. However, most of this research is related to the effects of inorganic substances on groundwater quality [16,17,18].
A group of aromatic organic chemical compounds composed of benzene, toluene, ethylbenzene, and xylene is collectively known are BTEX. These compounds are commonly found in gasoline and make up a significant portion of its soluble fraction [19,20]. BTEX contamination in groundwater has garnered significant attention due to its toxicity and carcinogenic properties, which pose substantial risks to human health [21,22,23,24]. One of the primary sources of subsoil and groundwater contamination is the accidental release of petroleum-derived fuels from storage tanks or transport pipelines [19,25]. When such leaks or spills involve a sufficient quantity of fuel, they can migrate downward through the unsaturated zone and eventually reach the groundwater [26].
In Spain, the Royal Decree 9/2005 of 14 January (R.D. 9/2005) outlines the list of potentially soil-contaminating activities and provides criteria and standards for the declaration of contaminated soils. This legislative document holds paramount importance in addressing soil contamination issues in Spain [27]. R.D. 9/2005 delineates the list of potentially contaminating activities for soils and specifies the conditions under which soil is considered contaminated. It establishes generic reference levels based on two distinct factors: human health and ecosystems.
The purpose of this study is to conduct an environmental assessment to evaluate the impact on soil and groundwater quality. This assessment takes into account various scenarios related to potential leaks from underground storage tanks (USTs) at a newly established service station. To achieve this, we utilized the Vadose Zone Leaching Model (VLEACH) [28], a one-dimensional mathematical model. VLEACH is an environmental modeling tool developed by the United States Environmental Protection Agency (USEPA) to assess the potential leaching of contaminants from the vadose zone into groundwater. VLEACH is an essential tool for evaluating the transport and fate of pollutants, such as pesticides and other organic substances, in the subsurface environment. It accounts for factors, like soil properties, climate conditions, and contaminant characteristics, to estimate the risk of groundwater contamination. This model helps quantify the concentrations of BTEX organic pollutants within the unsaturated zone.
The key objective of this study was to demonstrate the model’s application as a supportive tool in the examination of soil contamination following current Spanish regulations. We employed the model to assess contamination within the unsaturated zone and to determine the total mass of contaminants that may migrate into the underlying aquifer.

2. Materials and Methods

2.1. Main Properties of BTEX as Soil and Groundwater Pollutants

As per R.D. 9/2005, BTEX compounds are classified as toxic and hazardous substances, and they are explicitly included in the list of elements subject to analysis [27]. Given that the four constituents comprising BTEX form a significant portion of the soluble fraction of gasoline, the investigation of environmental issues associated with gasoline inherently involves the examination of BTEX.
Benzene, toluene, ethylbenzene, and xylene primarily exist in liquid, gaseous, aqueous, and nonaqueous (NAPL) phases during their migration and transformation within subsurface environments, such as soil and water [29,30]. The intricate spatial and temporal variations in BTEX concentrations are strongly influenced by their physicochemical properties, source characteristics, and environmental conditions [31].
The assessment of the quantity of pollutants retained in each of the soil phases relies on the determination of partition coefficients, which specify the concentration or amount of a particular substance when it is present in a mixture of phases, whether in the solid, liquid, gas, or NAPL phase [32]. The commonly used partition coefficients are the distribution coefficient (Kd), the vapor pressure coefficient (VP), the solubility (Sol), and the Henry’s constant (KH).
If the effect of pollutant adsorption in the finer fraction of the soil is neglected [33], the Kd coefficient can be estimated from Koc, the organic carbon partition coefficient [mL/g], and foc, the organic content fraction of the soil (Kd = Koc·foc). These partition coefficients are related to the octanol–water partition coefficient, Kow, which can be experimentally estimated in the laboratory for each pollutant [34].
Table 1 shows the values of the molecular weights (MWs) and the different partition coefficients for the BTEX compounds [35]. The solubility (Sol) and vapor pressure (VP) values were obtained at 20 °C and the octanol–water coefficient values at 25 °C.

2.2. The VLEACH Model

The VLEACH model was employed to simulate the behavior of BTEX in the unsaturated zone. VLEACH is a straightforward model designed to simulate the one-dimensional vertical transport of organic pollutant contamination in the vadose zone. Importantly, it does not require the calibration of an excessive number of parameters. It utilizes a finite-difference scheme to solve the transport equation. VLEACH simplifies vertical transport in the following manner: for the liquid phase, it models only the advective transport mechanism, while for the gas phase, it models both advective and diffusion mechanisms. In terms of spatial discretization, the model employs vertical polygons, which are further divided into cells. It is essential to note that, within each polygon, all conditions are considered homogeneous, except for the concentration of contaminants, which can vary from one cell to another. Initially, the model calculates the mass balance of contaminants in each of the three phases [28].
Advective transport in the liquid phase relies on factors such as infiltration and the volumetric water content within the soil, whereas diffusion governs the transport of the gas phase through concentration gradients across cells. Mass balance calculations are periodically recalibrated following transport calculations, conducted at each time step and within individual polygons, simulated independently. Upon conclusion of the simulation period, results are consolidated for each polygon, facilitating the determination of the degree of contamination within the vadose zone, quantification of migration toward the water table, and assessment of the amount of contaminants transitioning to vapor and dispersing into the atmosphere.
VLEACH divides the pollutant mass into three phases: gaseous, liquid, and solid, characterizing them throughout space (z) and time (t), evaluating the corresponding Cl, Cs, and Cg values. The calculations begin by considering that the entire mass of the pollutant is dissolved in the liquid phase (Equation (1)) [28]:
C 1 z , 0 = M ( z , 0 ) ρ b θ
where C 1 z , 0 is the initial concentration of the pollutant in the liquid phase (g/mL), M ( z , 0 ) is the initial mass of the pollutant per unit mass of soil (gpollutant/gsoil), θ is the volumetric water content (%) (Vwater/Vtotal), and ρ b is the soil bulk density (g/cm3).
Equation (2) is the one-dimensional transport equation considered in the model [28]:
C 1 t = q θ C 1 z
The variation of the gas phase pollutant concentration with time is obtained using Fick’s second law (Equation (3)) [28]:
C g t = D * 2 C g z 2
where C g is the concentration of the pollutant in the gas phase (g/mL), D * is the effective diffusion coefficient of the pollutant in the gas phase, only in the air-filled pores (m2/day). The effective diffusion coefficient is obtained from Equation (4) [28]:
D * = D a i r ( θ ) 7 / 3 2
For the resolution of Equation (3), Equation (5) was used to estimate the gaseous diffusion in the porous medium [36]:
D e = D a i r ( θ ) 10 / 3 2
D e is the diffusion coefficient of the gas throughout the porous medium, and D a i r is the gas diffusion coefficient in free air. The relationship between the effective diffusion coefficient and the gaseous diffusion coefficient in the porous medium is shown in Equation (6) [28]:
D e = θ D *
The model calculates the total mass of contaminant per unit volume of soil M T z , t using Equation (7) [28]:
M T z , t = θ C 1 + θ C g + ρ b C s
and the concentrations in each phase as a function of the total mass, the Henry constant ( K H ), and the distribution coefficient ( K d ), which relates the concentration of the pollutant in the solid phase and in the liquid phase. As said above, the K d coefficient can be estimated from K o c , the organic carbon partition coefficient (mL/g), and f o c , the organic content fraction of the soil (Equation (8)) [28]:
K d = K o c · f o c
Therefore, the concentrations of contaminants in the gas, liquid and solid phases were obtained using Equations (9)–(11) [28]:
C s ( z , t ) = K d M T ( z , t ) [ θ + θ K H + K d ρ b ]
C l ( z , t ) = M T ( z , t ) [ θ + θ K H + K d ρ b ]
C g ( z , t ) = K H M T ( z , t ) [ θ + θ K H + K d ρ b ]
Using a one-dimensional model, such as VLEACH, to simulate BTEX transport through soils has several limitations:
  • Oversimplification of spatial variability: One-dimensional models assume that the soil properties and contaminant distribution are uniform in the vertical direction, which may not accurately represent real conditions. In reality, soils can have significant horizontal variability in properties and preferential flow paths can exist, which a 1D model cannot capture.
  • Neglects lateral movement: One-dimensional models focus solely on vertical transport and neglect lateral movement of contaminants. BTEX compounds can migrate horizontally due to factors, like groundwater flow, fractures, or variations in soil structure, which are not considered in a 1D model.
  • Simplified representation of heterogeneity: Soils are inherently heterogeneous, and the transport of BTEX compounds can be influenced by factors like soil texture, organic matter content, and hydraulic conductivity. A 1D model may oversimplify these properties.
  • Lack of biological and chemical reactions: Real-world scenarios may involve biological degradation and chemical reactions that can affect the fate and transport of BTEX compounds. One-dimensional models often do not account for these processes, potentially leading to inaccurate assessments of contaminant behavior.
  • Insufficient consideration of vadose zone dynamics: BTEX transport in the vadose zone is influenced by factors, like evaporation, infiltration, and unsaturated flow dynamics, which can be challenging to adequately represent in a 1D model.
However, as said above, VLEACH allows simulating the one-dimensional vertical transport of contamination by organic pollutants in the vadose zone, without requiring the calibration of an excessive number of parameters. This fact makes these types of one-dimensional models ideal for use precisely in the phase of environmental assessment prior to the final authorization of the site where the potentially contaminating activity will take place.

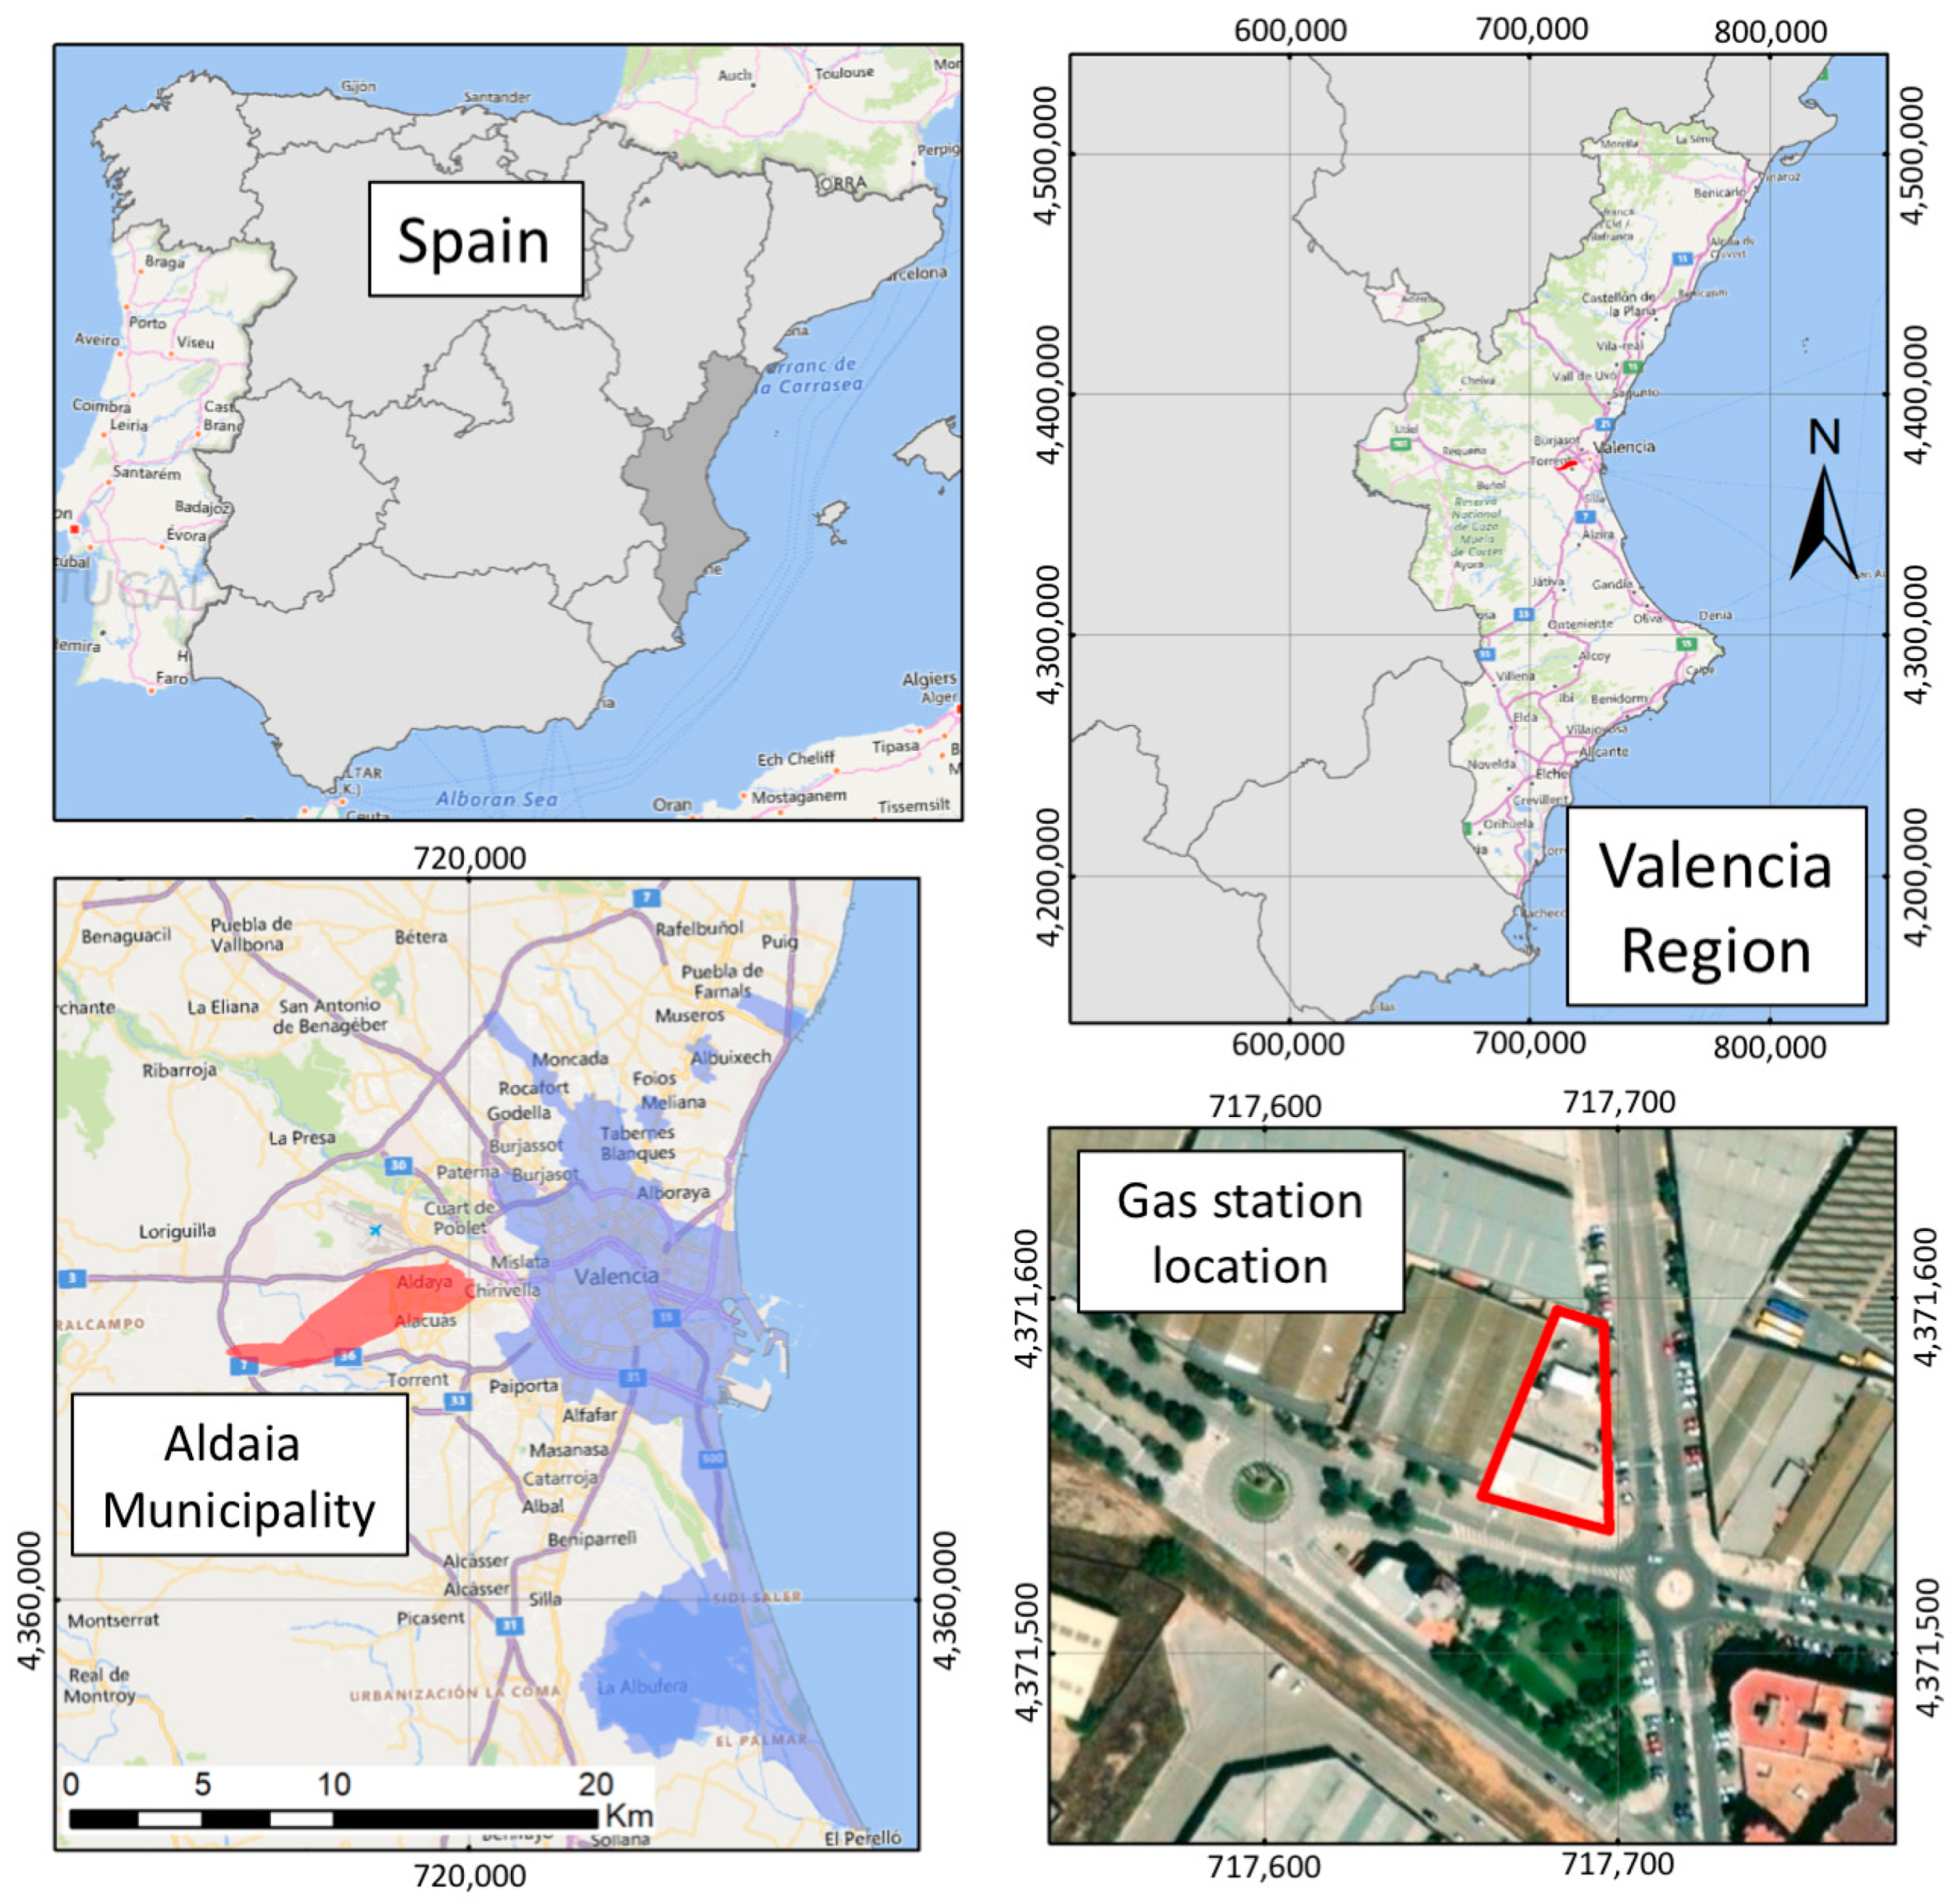
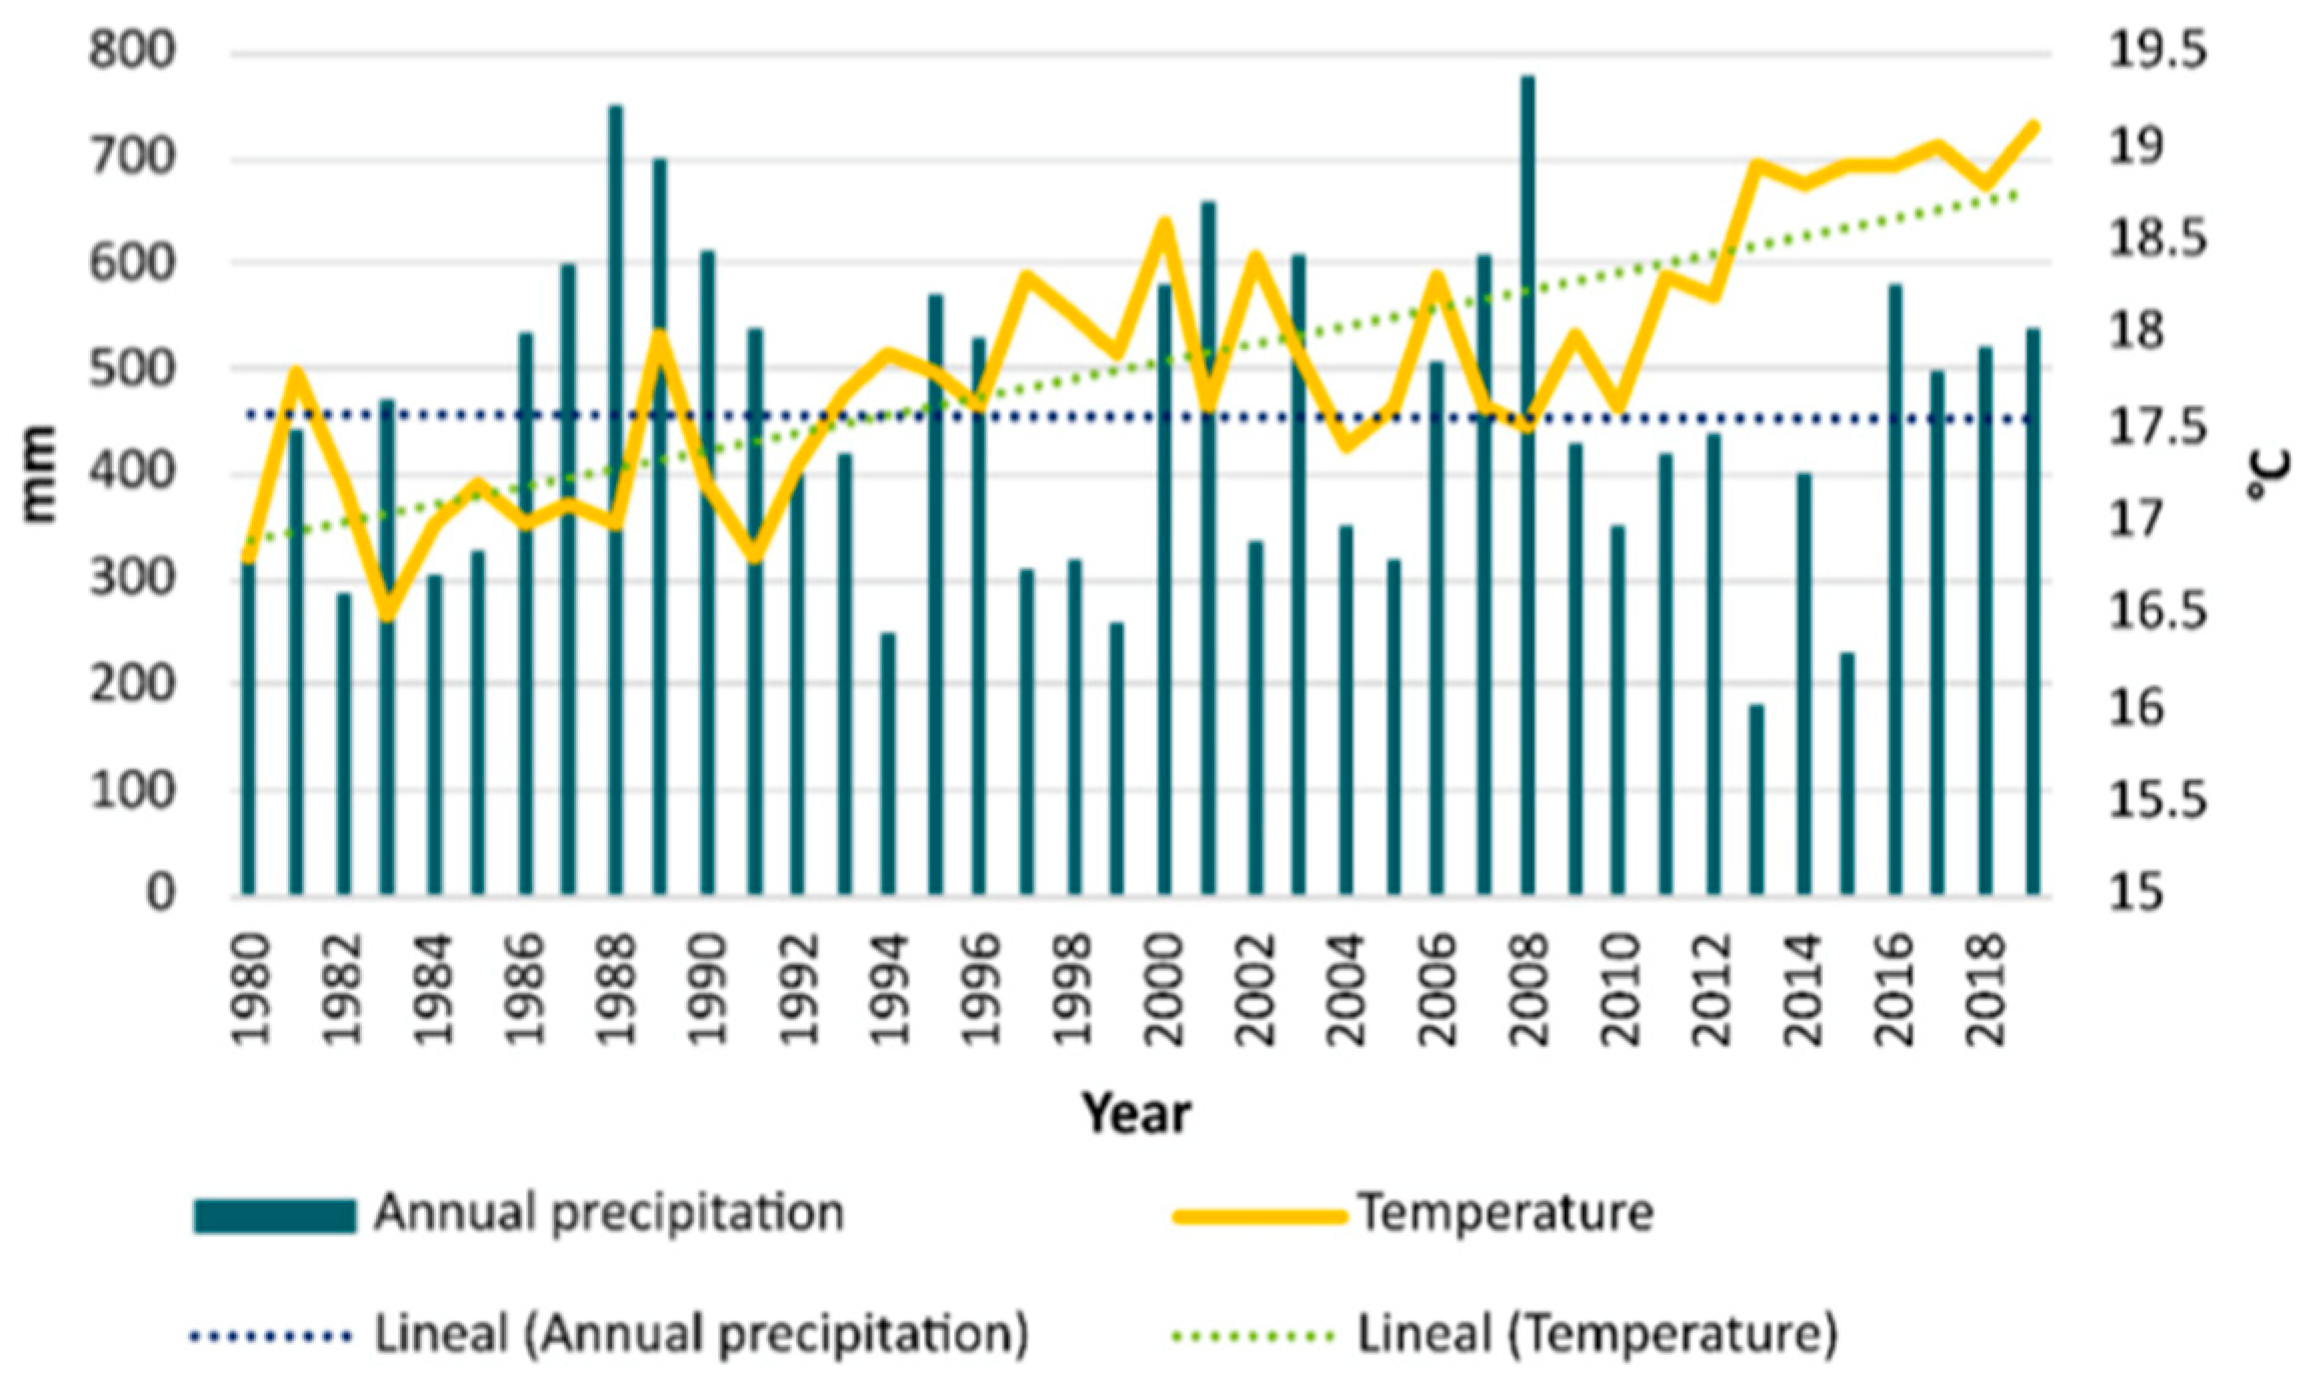
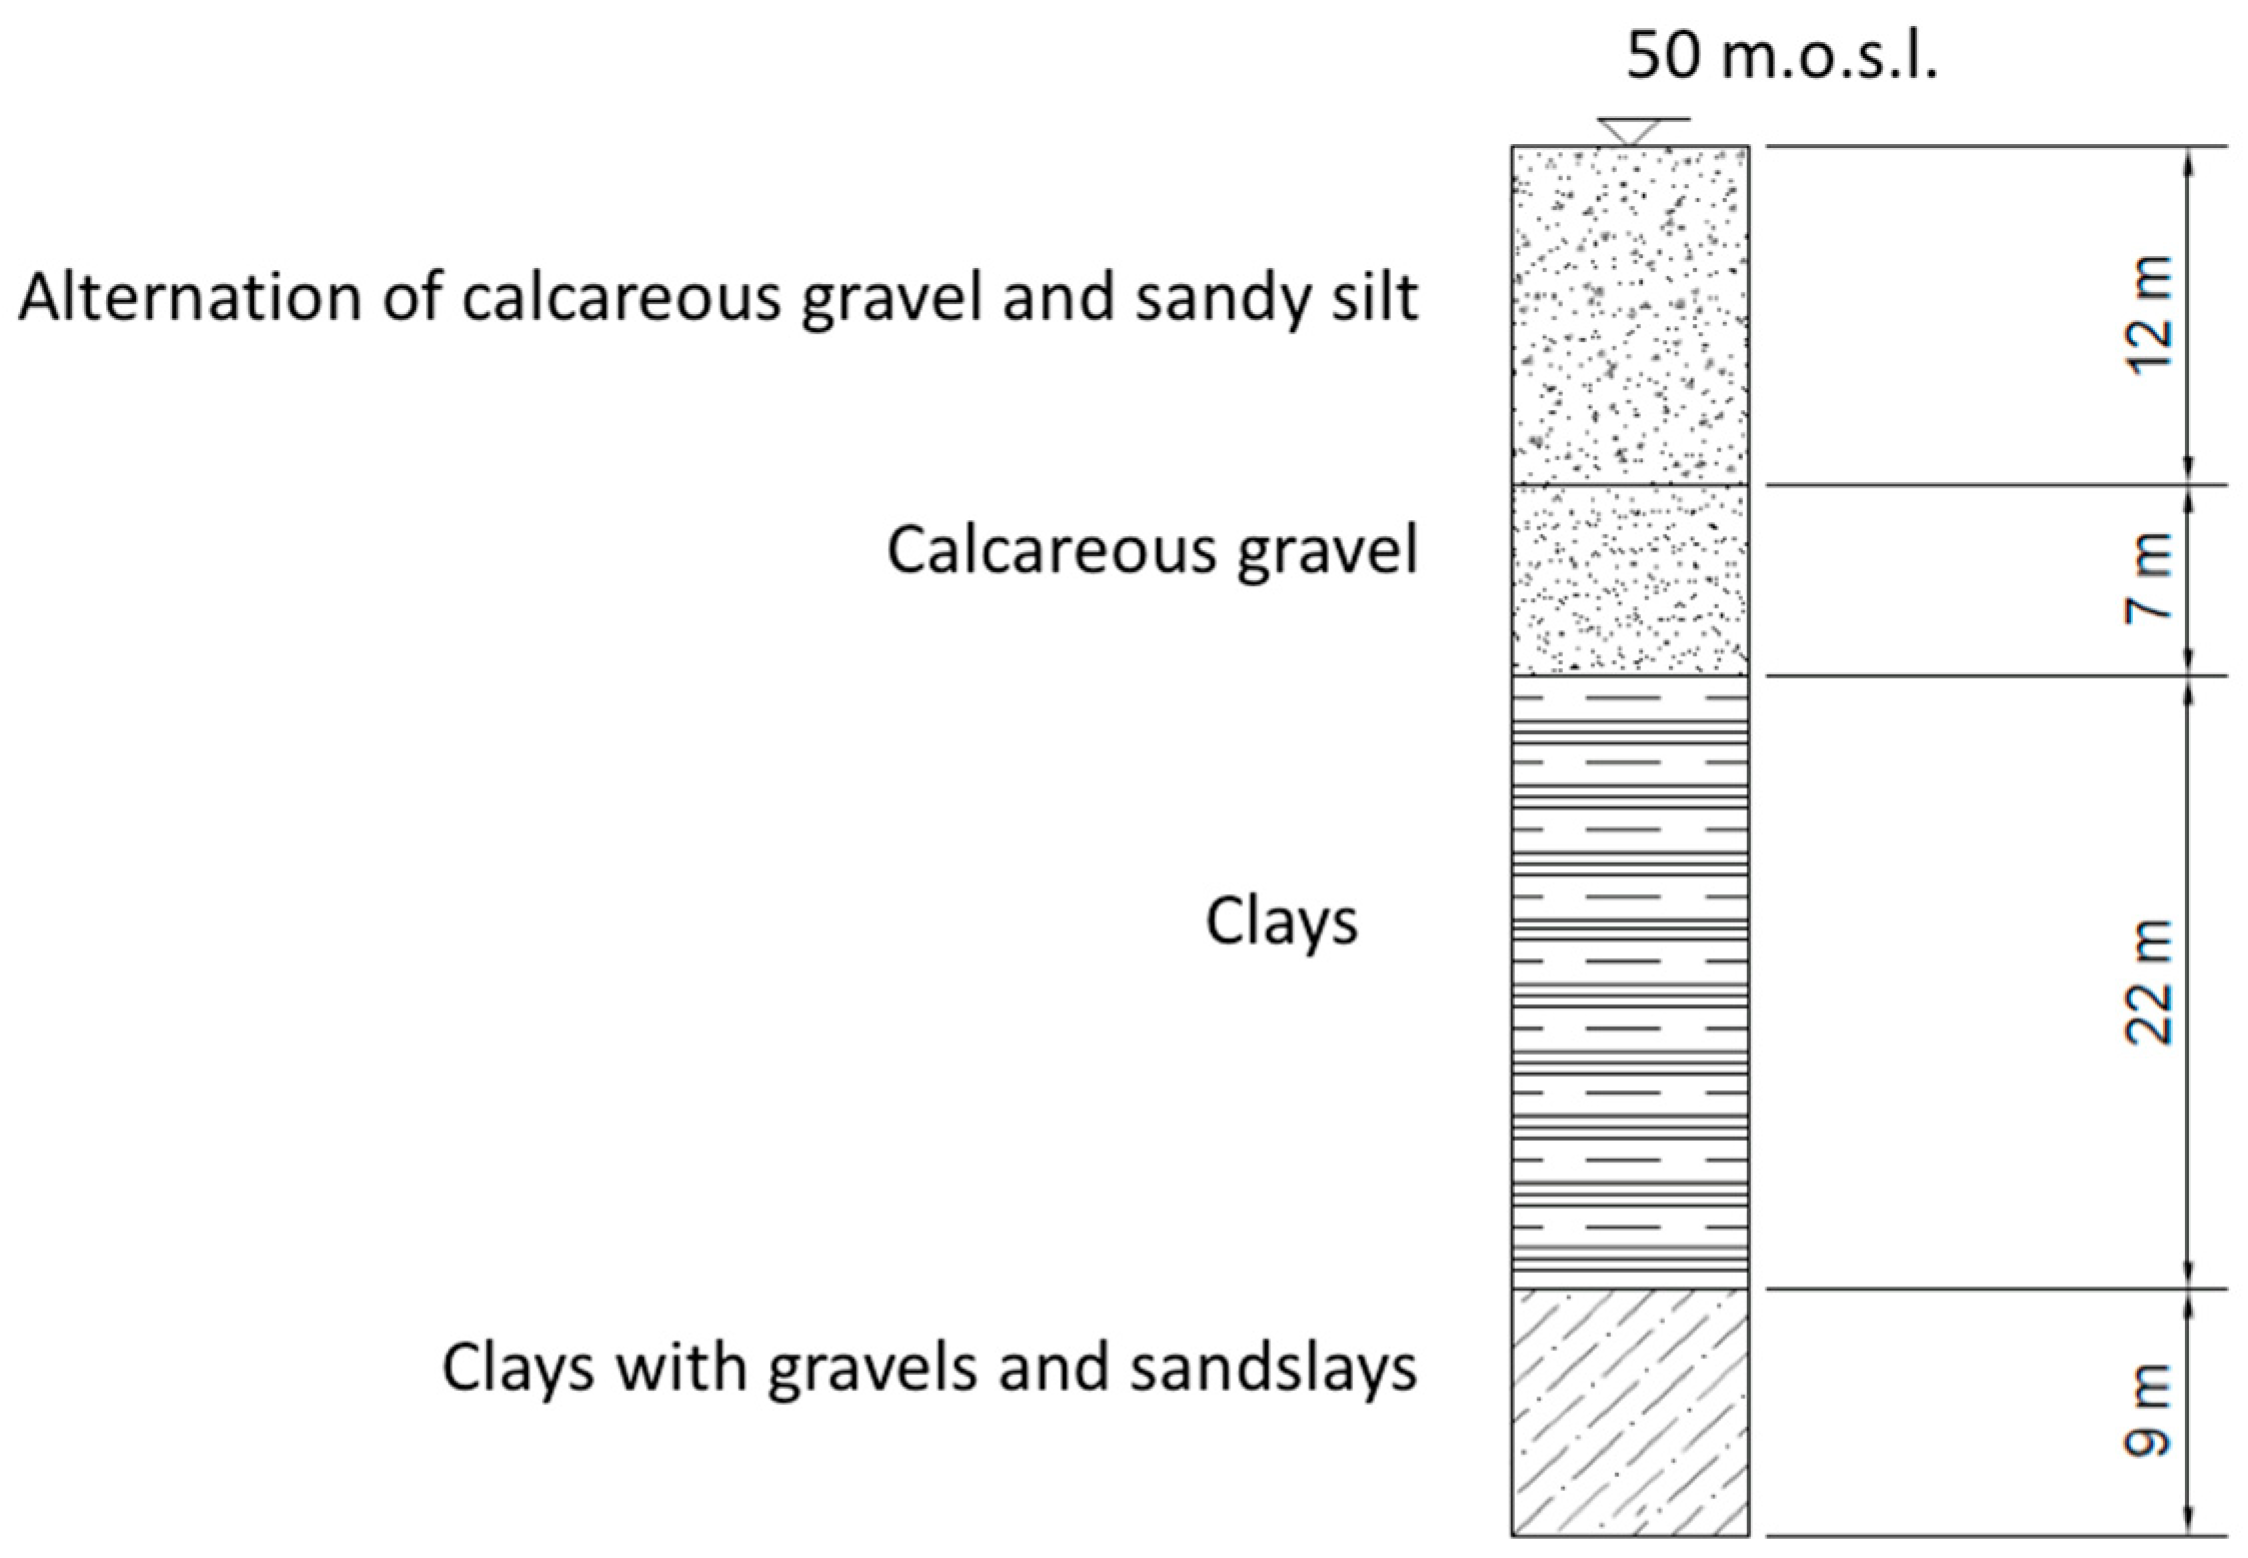
3. Description of the Study Area and Data Collection

In this study, we conducted modeling to assess the potential leakage of BTEX compounds from an underground storage tank at a forthcoming service station. This service station is situated in the municipality of Aldaia, near Valencia City in Spain (see Figure 1). Our analysis focused on understanding the transport of contaminants within the unsaturated soil zone, with a separate evaluation of the mass of contaminants transferred to both the unsaturated and saturated zones.
The study area is located inside the municipality of Aldaia (centered at coordinates ETRS89 UTM X = 717,675, Y = 4,371,550), in the Valencia region at the eastern part of the Iberian Peninsula. This region has a semiarid Mediterranean climate, which has favored the establishment of a prosperous agricultural economy. In the area, the average yearly temperature is 18 °C and the average annual rainfall is 443 mm/year (Figure 2).
The municipality of Aldaia is situated on sedimentary materials from the Upper Quaternary period. In the study area, a range of materials can be identified, including conglomerate, gravel, sand, sandstone, silt, and clay. The phreatic level of the upper aquifer in the Plana de Valencia North typically lies at a depth exceeding 30 m. The lithological profile was determined based on prior investigations conducted by both the Geological and Mining Institute of Spain [38] and the Ministry of Agriculture, Fisheries, and Food [39].
Because VLEACH permits the utilization of only one material to simulate the entire soil profile, the approach involved employing equivalent dry bulk densities, porosities, and organic matter content when dealing with multiple strata in the simulation. These parameters were estimated relative to the thickness of each respective stratum. A summary of the lithological information is provided in Figure 3.
For modeling purposes, two types of soil (A and B) were defined, depending on the properties of the lithology of the strata. The values of the relevant parameters for both soil types are shown in Table 2.
As field test results for soil samples are unavailable and only the description of the lithological column is accessible, saturated hydraulic conductivity values were selected based on Fetter’s recommendations [40]: (i) sandy silt (K = 10−4 cm/s); (ii) clays (K = 10−7 cm/s); and (iii) gravels (K = 10−1 cm/s).

4. Definition of Scenarios and Model Development

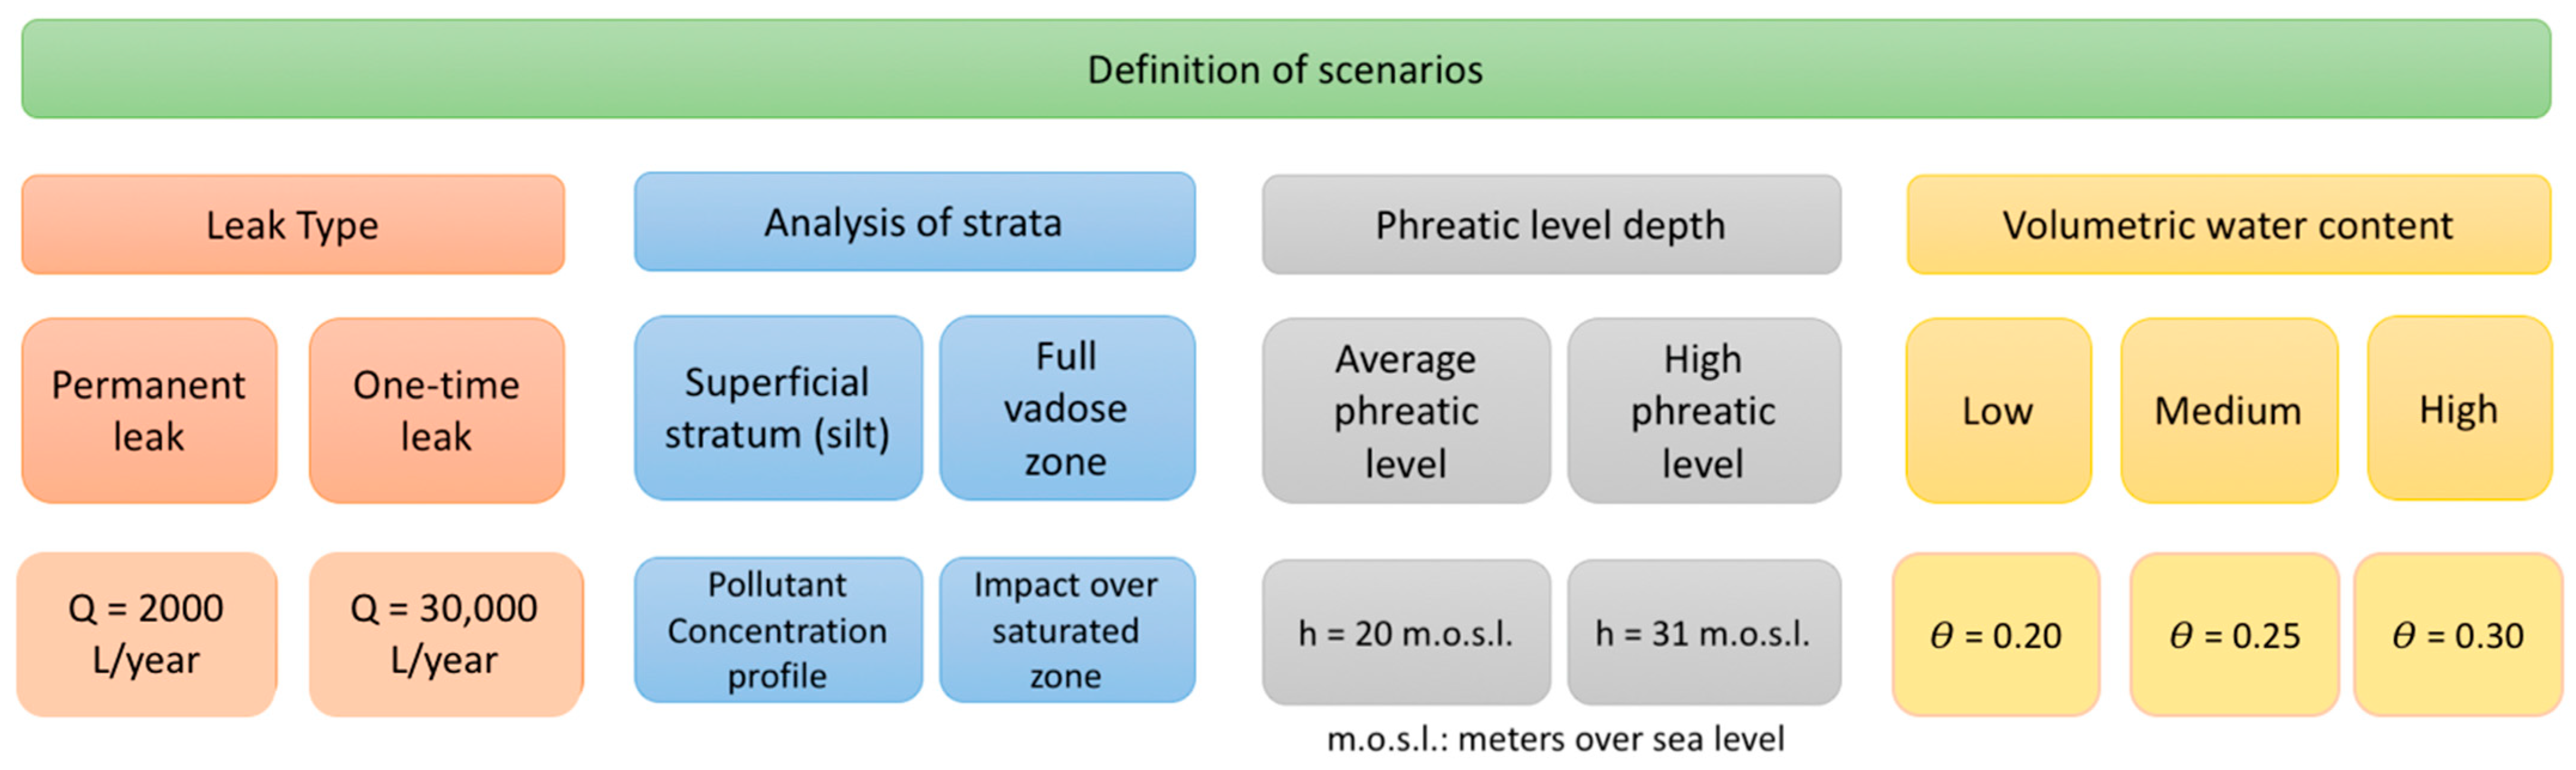
4.1. Definition of Scenarios

The simulation commenced at the level of the underground tank, presumed to be positioned 3.5 m beneath the ground surface. The assessment of potential soil contamination scenarios was conducted with consideration of the following analytical criteria, as depicted in Figure 4:
  • Existence of a permanent or a one-time BTEX leak;
  • Analysis of the most superficial layer of the soil (silt) or of the entire vadose zone;
  • Location of the water table: average observed level or abnormally high level;
  • Volumetric water content in the unsaturated zone.
Figure 4. Properties of the different simulation scenarios.
Water 15 03279 g004
By combining these various criteria, a total of 18 simulation scenarios were examined, as detailed in Table 3. It is important to note that distinct results were obtained based on the stratum being analyzed. Scenarios focusing solely on the first silt layer were valuable for characterizing contaminant concentrations in the soil. Meanwhile, scenarios encompassing the entire vadose zone were employed to characterize contamination that reached the aquifer.

4.2. Determination of the Model Parameters for Every Simulation Scenario

The estimation of the unsaturated hydraulic conductivity K(θ) was carried out according to Equation (12), formulated by van Genuchten [41]:
K θ = K s S e   [ 1 1 S e m m ] 2
where K s is the saturated hydraulic conductivity, m is the van Genuchten parameter of each soil, and S e is the effective saturation value, which can be obtained following Equation (13):
S e = θ θ r θ s θ r
where θ is the volumetric water content, θ r is the minimum volumetric water content for a specific soil type, and θ s is the volumetric water content in saturated conditions.
This formulation was implemented individually for each stratum. The parameter m was defined differently for various soil types, as per [42]. Nonetheless, there was a lack of information regarding this parameter for gravel. Consequently, the estimation of unsaturated hydraulic conductivity using this formulation was restricted to the surface layer.
To determine the unsaturated hydraulic conductivities, calculations were performed using different moisture content values established for the sandy silt stratum. Specifically, a value of 0.42 was selected for the van Genuchten parameter m, which falls within the midpoint of the range estimated in [42]. The minimum volumetric water content was set at 0.065, and the saturated volumetric water content coincided with the porosity, equating to 0.435.
For simulations encompassing multiple soil strata, an equivalent saturated vertical hydraulic conductivity was initially computed. The obtained results are presented in Table 4.
Leusch and Bartkow [43] compiled percentage ranges by volume for each of the BTEX components in gasoline. The values utilized in the simulations are presented in Table 5, with consideration given to compliance with the current fuel legislation in Spain, as outlined in Royal Decree 61/2006, which establishes specifications for gasoline, diesel, fuel oil, and liquefied petroleum gases, and regulates the use of specific biofuels and sulfur content in maritime fuels [44]. Table 5 also encompasses the parameters employed in the simulations for each pollutant, drawing from [28] and the Pubchem chemical database [45].
The volume of water from precipitation was taken into account separately for each of the three scenarios related to soil moisture. The annual precipitation in the study area amounted to 443 mm/year, and the total area occupied by the gas station was 923 m2. The rain and infiltration scenarios were defined with a 10% loss factored in for rainwater management, wastewater collection, and vehicle wash water at the facility, as detailed in Table 6.
The service station, for which the environmental risks associated with soil contamination were assessed, is designed to incorporate a concrete slab that will serve as a waterproof barrier to protect the underlying soil. Additionally, the station will feature a car wash facility as an auxiliary component. Fuel storage for sale at this station will be facilitated through underground tanks.
For modeling purposes, a single tank was considered to store gasoline. The storage capacity of this tank was 30,000 L. The tank had a cylindrical shape with a horizontal orientation, featuring a diameter of 2.5 m and a length of 7.17 m, as depicted in Figure 5, illustrating a schematic cross-section of the underground storage tank (UST) with the dimensions employed in the modeling process.
With these dimensions in mind, the simulation area for the contamination discharged from the tank covered 100 m2. The simulation model started at the bottom of the tank, positioned 3.5 m below the ground surface. It is important to note that VLEACH only allows for simulating a pollutant leak on the surface of the defined model.
The existence of an underground drainage network responsible for channeling precipitation runoff away from the station into the sewer was also considered. Drainage networks typically experience certain losses, which, in this scenario, were assumed to be 10%. Moreover, it was considered that 20% of these losses originated from the area surrounding the underground storage tank. Consequently, the primary sources of water directed into the drainage network encompassed rainfall runoff and the aforementioned car wash.
In the permanent leak scenario, potential joint failures and minor spills occurring during tank filling activities were taken into account. An annual leak of 2000 L of fuel was assumed.
The volume of each pollutant recharged annually, along with the concentration of each pollutant as a function of annual rainfall, is presented in Table 7.
Across all 18 scenarios, the simulation was conducted over 50 years, employing a time step of 1 year and encompassing a simulation area of 100 m2.
Table 8 provides an overview of the parameter values shared among all the simulation scenarios:
  • Hpolygon (height of the simulated polygon);
  • ρ b (soil bulk density);
  • ϕ (porosity);
  • θ (water content);
  • foc (organic carbon fraction);
  • K (saturated permeability).
Depending on the scenario type, whether it was a permanent leak or a one-time leak, the calculation of pollutant concentrations in the recharge and the determination of volumetric water content in the soil were performed differently. For permanent leak scenarios, the concentration of pollutants in the recharge was utilized, and it was contingent on the specific BTEX component analyzed as well as the total amount of water infiltrating into the soil. In these scenarios, it was assumed that 2000 L of gasoline was lost annually, with contaminants being deposited on the ground. This quantity was mixed with the infiltrating water, thereby reducing the concentration of the pollutants. In the case of one-time leak scenarios, the investigation examined the impact of a catastrophic tank rupture, resulting in the sudden release of the entire 30,000 L of gasoline it contains. Consequently, the total quantity of the pollutants discharged were directly proportional to the BTEX content in the gasoline. Table 9 presents the specific parameter values for each of the four pollutants, which were dependent on the values of Crecharge (concentration in the recharge) and Csoil (concentration in the soil) for each simulation scenario.

5. Results and Discussion

5.1. Permanent Leak Scenarios

Below are the results obtained for the permanent leak scenario within the top 12 m of soil, specifically in the superficial layer (silt). In the following figures, the red vertical line signifies the maximum concentration limit for each BTEX in industrial soil, as stipulated by R.D. 9/2005 [27]. Figure 6 illustrates the concentrations of BTEX in the solid phase for three possible volumetric water contents (θ) and, consequently, for three corresponding conductivities (K).
In the case of benzene (Figure 6a), for low values of θ, a very slow progress of contamination can be seen. After 50 years from the beginning of the leak, the MCL established by the R.D. 9/2005 is only exceeded in the first 2 m under the tank. For toluene (Figure 6b), the results are very similar to those presented by benzene. For low θ values, contamination is concentrated in two meters during the first 50 years; for medium values of θ, the full contamination of the first stratum occurs at t = 50 years; in the most unfavorable case, 10 years after the beginning of the leak, the first layer is totally contaminated. In the case of ethylbenzene (Figure 6c), when considering low θ values, it is noteworthy that the maximum concentration limit (MCL) specified by R.D. 9/2005 is only slightly exceeded 50 years after the commencement of the leak. For scenarios with medium θ values, after 50 years of simulation, the MCL is exceeded only within the first 4 m below the tank. However, with high θ values, the entire silt layer becomes contaminated by ethylbenzene within the first 25 years of simulation. Regarding xylene (Figure 6d), its solid phase concentrations exhibit significant elevation near the fuel source. Nevertheless, the times and depths at which the MCL values are surpassed are akin to those observed for benzene and toluene. For scenarios with low θ values, during the initial 50 years, concentrations exceeding the MCL values are only found within the first 2 m below the surface. In the case of medium θ values, after 50 years of simulation, contamination persists within the first layer down to approximately −11 m. Lastly, with high θ values, the entire initial stratum fails to meet the requirements established by R.D. 9/2005 after 10 years of continuous leakage.
Figure 7a displays the benzene concentration values in the liquid phase for a permanent leak scenario. The red vertical line corresponds to the maximum admissible concentration of benzene in water for human consumption according to the USEPA [46]. It is evident that, across various scenarios with differing moisture and conductivity values, the concentrations of benzene in the liquid phase substantially exceed the USEPA standards. For toluene (Figure 7b), concentrations in the liquid phase do not surpass USEPA standards throughout the profile up to the 50-year mark when low θ values were considered. Under typical conditions (medium θ values), concentrations in the liquid phase within the first stratum exceed the USEPA limits 10 years after the commencement of the leak. In cases with high θ values, the entire liquid phase of the surface layer becomes contaminated rapidly, taking less than 5 years to do so. The results for ethylbenzene and xylene closely mirror those for toluene, with slightly longer timeframes required to contaminate the entire stratum.
Figure 8a illustrates the concentrations of benzene in the gas phase within the first stratum. Except for the scenario with low θ values during the initial years, concentrations in all other simulated scenarios and times were significantly higher than the limits recommended by the US Occupational Safety and Health Administration (OSHA), denoted by the dashed horizontal red line [47]. This trend was also observed for the remaining BTEX compounds. As an illustration, Figure 8b showcases the results obtained for toluene within the same scenario.
Figure 9 provides insight into the evolution of the mass of BTEX compounds reaching the aquifer each year under different groundwater conditions:
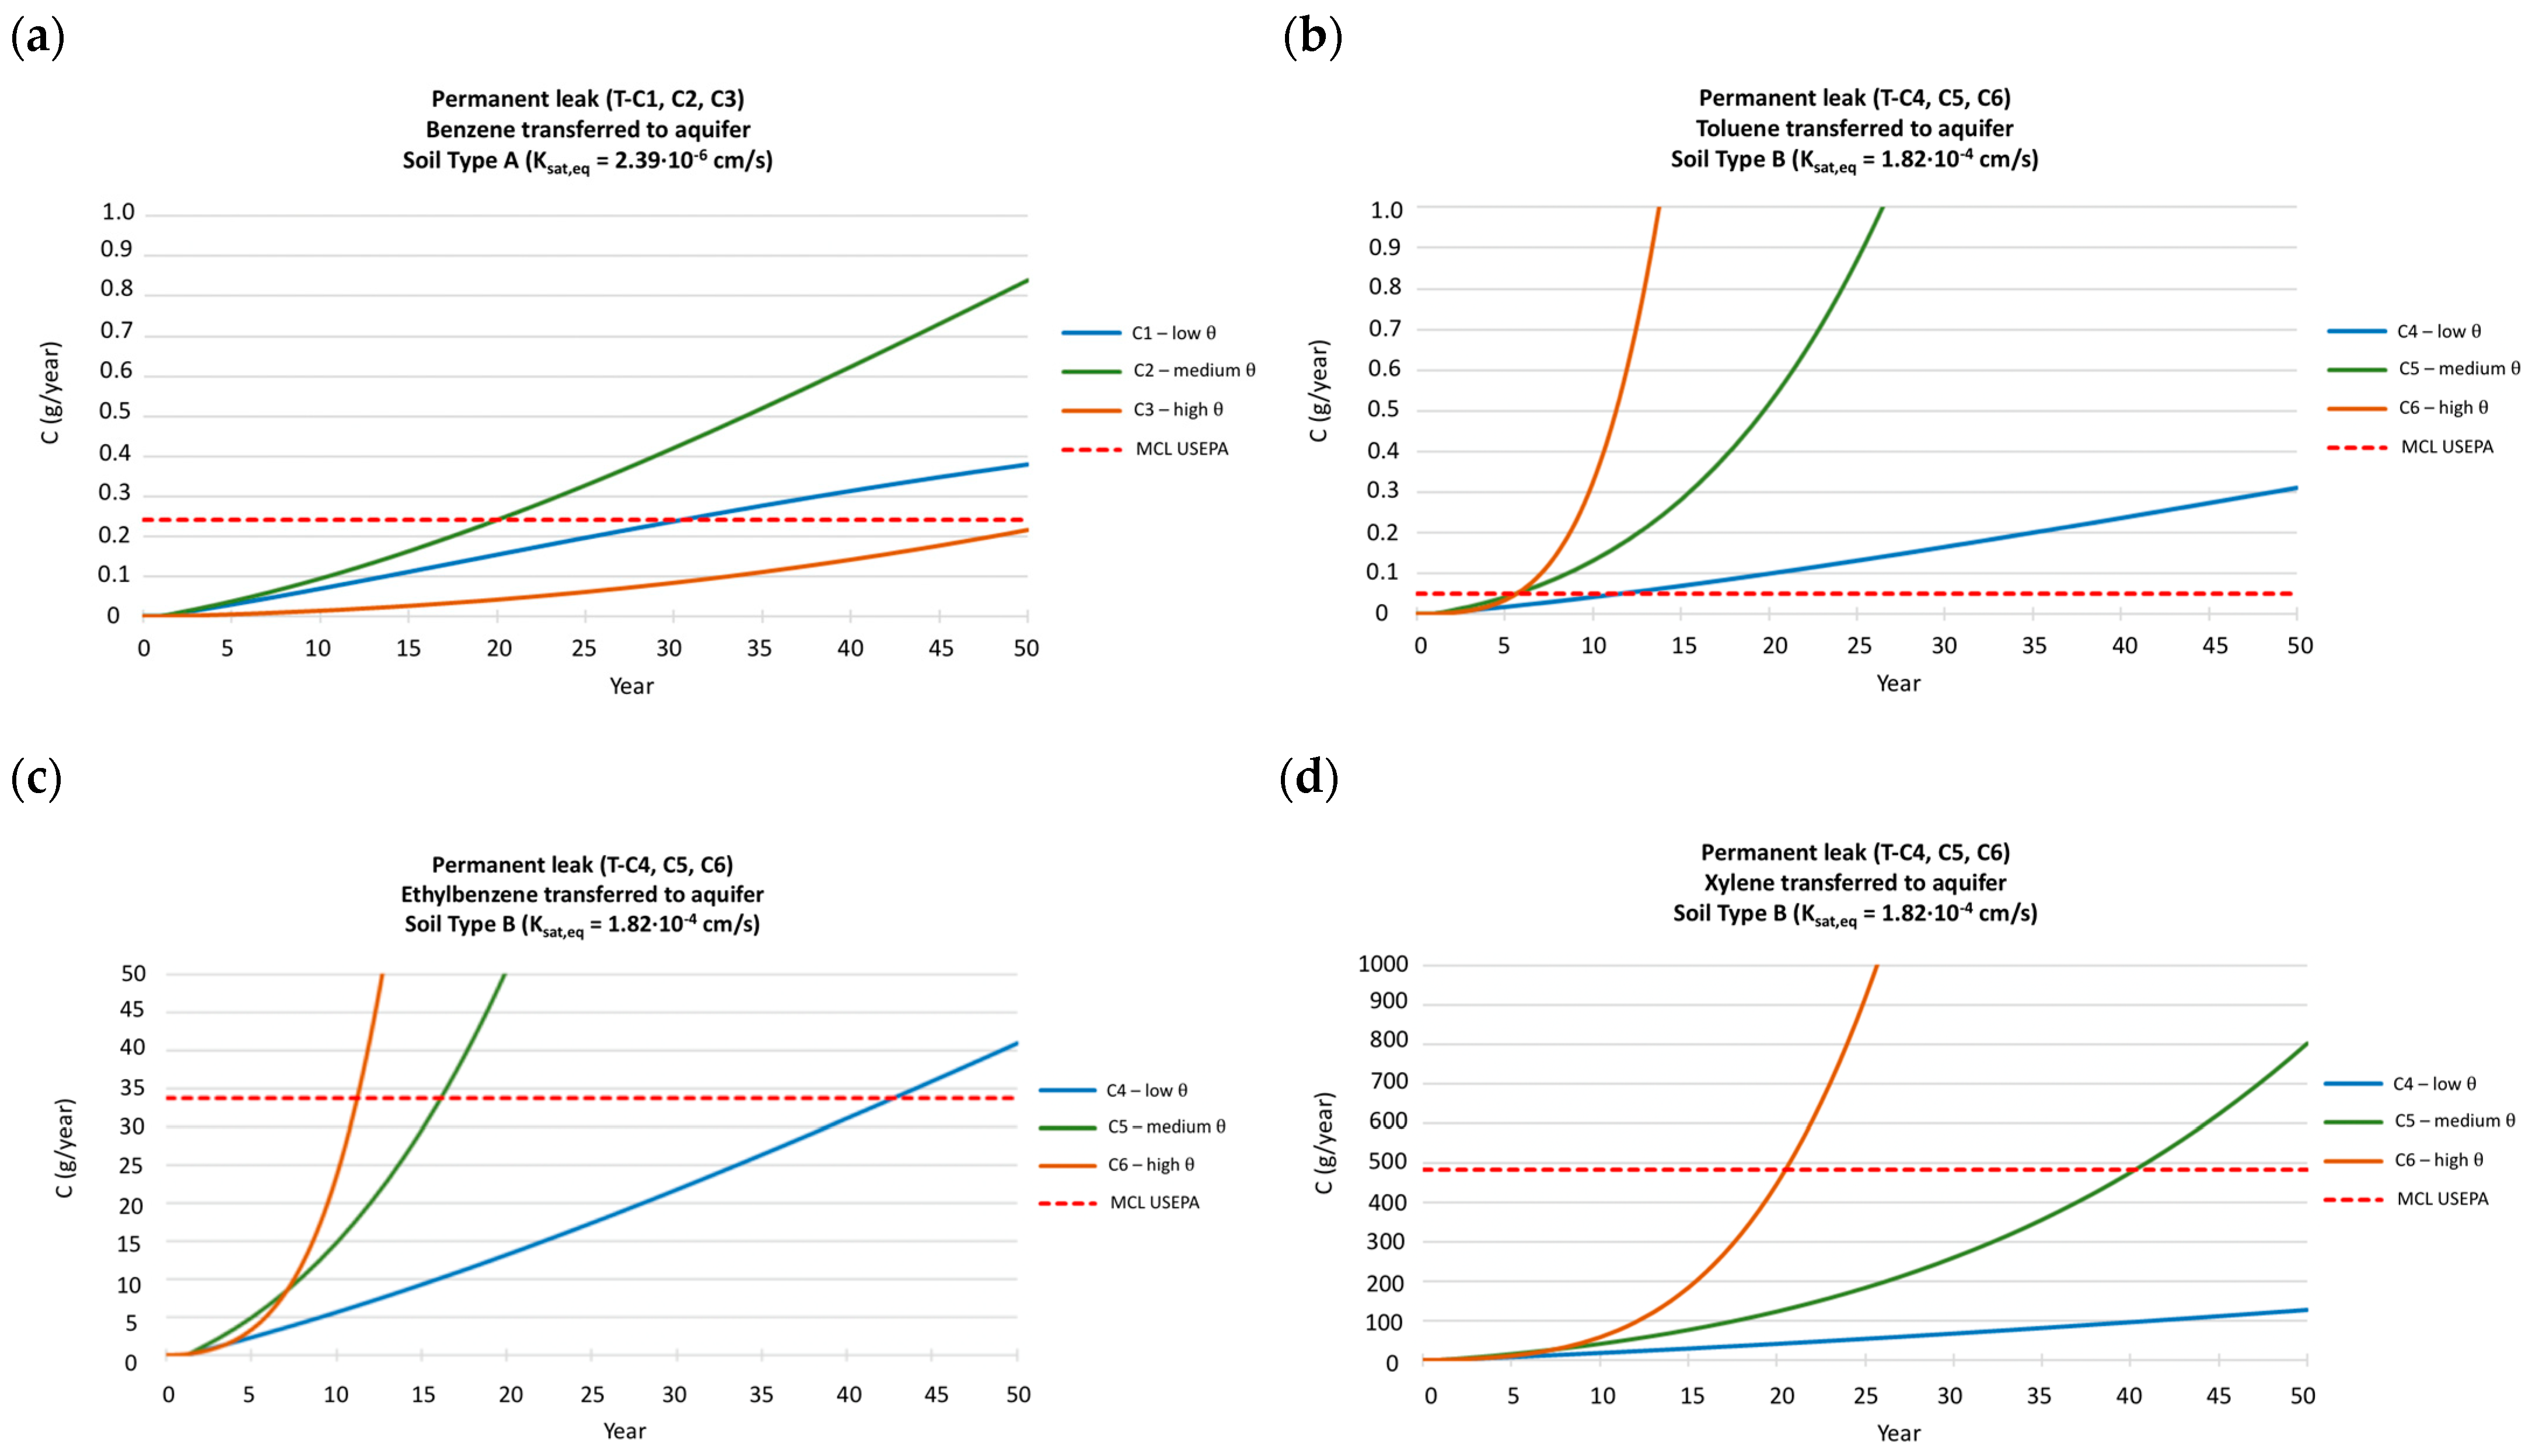
  • When the water table is situated at a medium position (Figure 9a), with the phreatic level in the third stratum from the surface, minimal gasoline contamination reaches the aquifer. The contaminants must traverse the silt, gravel, and a substantial portion of the clay stratum, characterized by very low conductivity. Consequently, the mass of contaminants reaching the aquifer is nearly negligible.
  • In the scenario with a higher water table, located 11 m above its typical position and positioned at the boundary between the gravel and clay strata (Figure 9b), the impact on the aquifer is significantly more pronounced. The equivalent hydraulic conductivities are higher, and pollutants have a shorter vadose zone to traverse before reaching the aquifer. Advective transport becomes dominant, particularly under medium and high θ conditions.
Regarding toluene, after 5–10 years from the start of the leak, levels in the aquifer surpass the maximum standards set by the USEPA. After 50 years, up to 40 kg/year of toluene may reach the aquifer. Under normal conditions, this mass flux is estimated to be approximately 5 kg/year.
The impact of ethylbenzene on the aquifer (Figure 9c) is more moderate compared to benzene and toluene. Depending on humidity and hydraulic conductivity conditions, the aquifer is considered contaminated by ethylbenzene after a more extended period. Under various θ values, the MCL limit is exceeded after 40, 15, and 10 years. In typical conditions, a mass flux of 0.5 kg/year of ethylbenzene into the aquifer is expected after 50 years, whereas under unfavorable conditions, this value could reach 4 kg/year.
Figure 9d presents the results obtained for xylene under the same scenarios. Xylene concentrations in the aquifer surpass USEPA limits only after longer durations compared to other contaminants. For medium and high θ values, the MCL is exceeded after 40 and 20 years, respectively. Under low humidity conditions, these limits are not exceeded within the first 50 years. In the most unfavorable conditions, over 8 kg/year of xylene could potentially reach the aquifer.

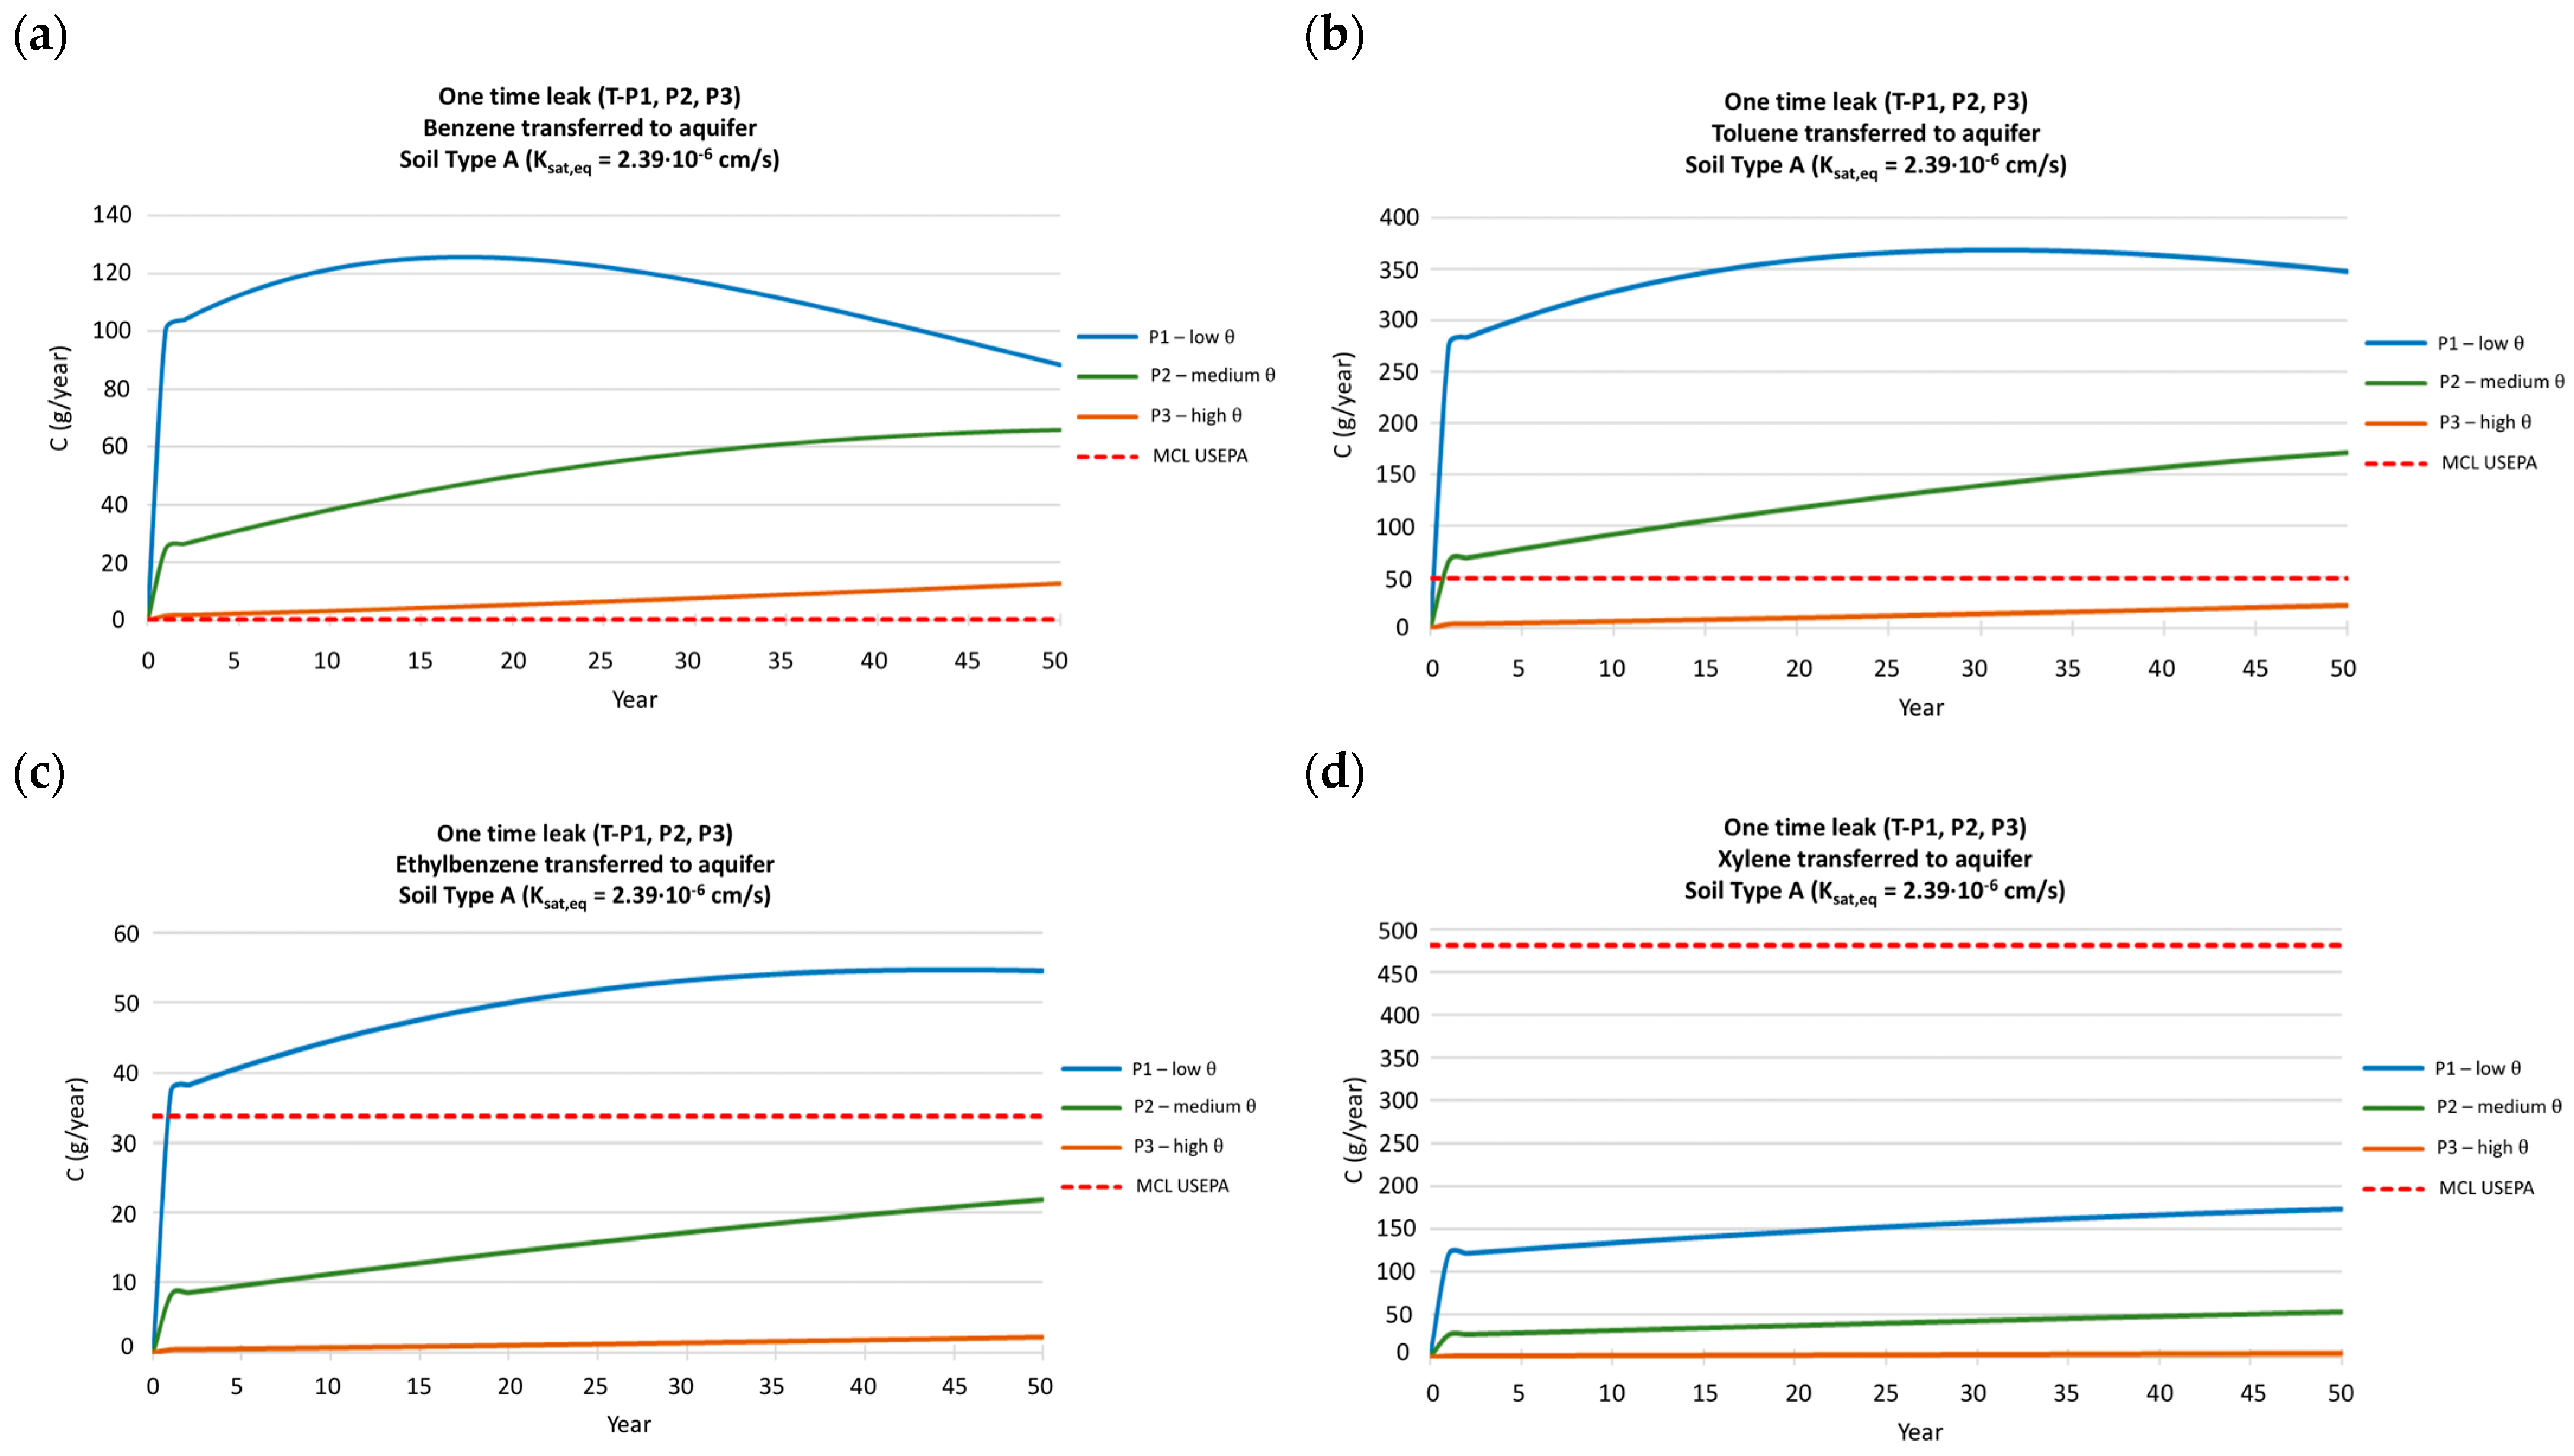
5.2. One-Time Leak Scenarios

Figure 10 illustrates the concentration of each contaminant within the first 12 m of depth in the event of an accident involving the underground tank, resulting in the release of 30,000 L of gasoline into the soil.
The results reveal that the concentration profiles exhibit diverse temporal variations, contingent upon moisture levels and associated unsaturated hydraulic conductivity values. In the case of moderate moisture levels, at t = 10 years, benzene contamination extends throughout the entire stratum (Figure 10a), emphasizing the necessity for prompt soil remediation. The profiles for toluene, concerning moisture and conductivity values, closely resemble those observed for benzene (Figure 10b).
For ethylbenzene (Figure 10c), concentrations in the soil exceed the maximum contaminant levels (MCLs) in a manner akin to benzene and toluene, albeit with slight distinctions. Under low θ conditions, only the initial 2 m beneath the tank remain contaminated within the first 50 years. With medium θ values, the first stratum does not become entirely contaminated. The MCL values are surpassed in a band extending up to 5 m in depth, which varies over time. With high θ values, complete contamination of the initial stratum is not observed either. Only after 25 years are MCL values surpassed at the bottom of the stratum. By t = 50 years, the surface layer is no longer contaminated.
The results suggest that in the case of a specific one-time leak, there would be a temporary window to take action and eliminate ethylbenzene under any combination of conductivity and humidity conditions before it reaches the more permeable second layer.
In the case of xylene (Figure 10d), extremely high concentrations in the solid phase are observed near the surface, reaching levels two orders of magnitude greater than the MCL values specified by R.D. 9/2005. With low θ values, contamination does not penetrate beyond 8 m in depth within 50 years. Under medium moisture levels and associated hydraulic conductivity values, complete contamination of the first layer is not expected after 50 years, with the last two meters of this layer remaining uncontaminated even after 25 years. In scenarios featuring high θ values, there is a brief timeframe (less than 10 years) before the first 12 m of soil depth become contaminated.
Figure 11 depicts the mass of contaminant transported to the aquifer under the assumption that the water table is situated at a medium level within the clay layer.
For benzene (Figure 11a), the annual mass reaching the aquifer exceeds the maximum contaminant level (MCL) defined by the USEPA across all three humidity scenarios and their corresponding hydraulic conductivity values. In the case of toluene (Figure 11b), the annual mass reaching the aquifer surpasses the USEPA-established MCL for low and medium θ values. Ethylbenzene (Figure 11c) similarly exceeds the USEPA MCL annually, even under low θ conditions. However, in the event of a specific accident, with the water table at its medium position, the quantity of xylene reaching the aquifer across all three considered scenarios would be lower than the USEPA-established MCL for human consumption of this water (Figure 11d).

6. Conclusions

In this study, a comprehensive simulation of BTEX contamination in soil and groundwater resulting from both permanent and one-time leaks from underground storage tanks (USTs) was conducted using a one-dimensional numerical model. A total of 18 scenarios were thoroughly analyzed, incorporating real field data to represent the most realistic conditions.
The VLEACH model was employed to quantify BTEX concentrations in the solid, liquid, and gas phases and to assess mass transfer to the aquifer. The results consider the model’s inherent characteristics: (i) It operates with one-dimensional vertical transport; (ii) It does not account for in situ degradation of contaminants (which may be significant for organic compounds like BTEX); (iii) It employs a linear isotherm for contaminant distribution among phases; (iv) It does not consider variations in temperature or density; (v) It assumes soil homogeneity, neglecting soil heterogeneities; (vi) It does not incorporate variations in soil moisture over time; (vii) Dispersion in the liquid phase is not considered.
The model necessitates input values for at least 15 parameters to conduct simulations, some of which may pose challenges in terms of calibration. Table 10 provides a summary of these model parameters and characterizes the associated uncertainty for each, drawing on the insights gained from preceding work. It should be noted that certain parameters were particularly challenging to estimate due to their substantial variation with depth and time or due to measurement limitations.
Throughout the modeling process, several noteworthy challenges emerged, in addition to those already mentioned regarding parameter estimation. These difficulties include:
  • Lack of public information: There is a scarcity of publicly available data on the chemical composition of BTEX in gasoline sold in Spain. Estimations for the concentrations of these organic compounds in gasoline have had to rely on studies conducted in other countries, with inherent uncertainties. Gasoline composition can vary significantly depending on its source, further contributing to this uncertainty.
  • Legal limitations: While there are legal limits for BTEX concentrations in the solid phase of soil, such limits do not exist for the liquid and gas phases within the vadose zone. This legal gap has posed challenges in interpreting model results for these phases.
After analyzing the potential consequences of continuous leaks and specific tank accidents on the environment, the following conclusions can be drawn:
(i) In the case of a continuous leak from an underground storage tank (UST), there is a longer window of opportunity to take action and prevent complete soil contamination and its migration to the aquifer. However, such leaks often go unnoticed due to a lack of monitoring of the soil around tanks. Failure to detect and address leaks can result in more unfavorable long-term consequences than a one-time accident involving a large hydrocarbon spill.
(ii) In the event of a tank rupture and a one-time accident, the time available for remediation is limited, but conditions may not be saturated, offering a chance to prevent full soil contamination and minimize the impact on the aquifer. Swift remediation actions are imperative; otherwise, both soil and aquifer may suffer extensive contamination in the short to medium term.
The results underscore the significant influence of soil moisture on transport phenomena within the vadose zone. Variations in soil moisture have profound effects on hydraulic conductivity and impact magnitude, transport speed, and the dominant transport mechanism. It is a pivotal parameter that should be well defined in simulations of this nature.
Furthermore, it was observed that each BTEX component exhibits different transport velocities through the vadose zone. Benzene, with a greater affinity for concentration in the liquid and gas phases, is the fastest to move through the vadose zone. Detecting benzene in aquifers may serve as an indicator of the eventual arrival of the other BTEX compounds.

Author Contributions

Conceptualization, J.R.-I. and J.E.C.; methodology, J.R.-I. and L.R.-B.; software, L.R.-B.; validation, J.R.-I. and M.-E.R.-C.; formal analysis, J.R.-I. and M.-E.R.-C.; investigation, J.R.-I. and L.R.-B.; resources, J.R.-I. and M.-E.R.-C.; data curation, J.R.-I. and L.R.-B.; writing—original draft preparation, J.R.-I. and M.-E.R.-C.; writing—review and editing, J.R.-I. and M.-E.R.-C.; visualization, J.R.-I. and L.R.-B.; supervision, J.R.-I. and J.E.C.; project administration, J.R.-I.; funding acquisition, J.R.-I., J.E.C. and M.-E.R.-C. All authors have read and agreed to the published version of the manuscript.

Funding

This research received no external funding.

Data Availability Statement

Data used in this study were provided by the Municipality of Aldaia (Valencia).

Conflicts of Interest

The authors declare no conflict of interest.

References

  1. Wang, B.; Zhang, Y.; Gao, C.; Du, X.; Qu, T. Developing novel persulfate pellets to remediate BTEXs-contaminated groundwater. J. Water Process. Eng. 2023, 52, 103505. [Google Scholar] [CrossRef]
  2. Zao, B.; Huang, F.; Zhang, C.; Huang, G.; Xue, Q.; Liu, F. Pollution characteristics of aromatic hydrocarbons in the groundwater of China. J. Contam. Hydrol. 2020, 233, 103676. [Google Scholar] [CrossRef] [PubMed]
  3. da Silva, J.C.O.; Solano, A.M.S.; Barbosa Segundo, I.D.; dos Santos, E.V.; Martínez-Huitle, C.A.; da Silva, D.R. Achieving Sustainable Development Goal 6 Electrochemical-Based Solution for Treating Groundwater Polluted by Fuel Station. Water 2022, 14, 2911. [Google Scholar] [CrossRef]
  4. Arias-Estévez, M.; López-Periago, E.; Martínez-Carballo, E.; Simal-Gándara, J.; Mejuto, J.-C.; García-Río, L. The mobility and degradation of pesticides in soils and the pollution of groundwater resources. Agric. Ecosyst. Environ. 2008, 123, 247–260. [Google Scholar] [CrossRef]
  5. Wang, B.; Gao, C.; Li, X.; Zhang, Y.; Qu, T.; Du, X.; Zheng, J. Remediation of groundwater pollution by in situ reactive zone: A review. Process Saf. Environ. Prot. 2022, 138, 858–871. [Google Scholar] [CrossRef]
  6. Chen, L.; Liu, Y.; Liu, F.; Jin, S. Treatment of co-mingled benzene, toluene and TCE in groundwater. J. Hazard. Mater. 2014, 275, 116–120. [Google Scholar] [CrossRef]
  7. McGregor, R.; Maziarz, A. The in situ treatment of Basic Violet 16 synthetic dye in groundwater. Remediat. J. 2021, 31, 27–34. [Google Scholar] [CrossRef]
  8. Do Rego, E.C.P.; Netto, A.D.P. PAHs and BTEX in groundwater of gasoline stations from Rio de Janeiro City, Brazil. Bull. Environ. Contam. Toxicol. 2007, 79, 660–664. [Google Scholar] [CrossRef]
  9. Ruidas, D.; Pal, S.C.; Islam, A.R.M.T.; Saha, A. Characterization of groundwater potential zones in water-scarce hardrock regions using data driven model. Environ. Earth Sci. 2021, 80, 809. [Google Scholar] [CrossRef]
  10. Ruidas, D.; Pal, S.C.; Towfiqul Islam, A.R.M.; Saha, A. Hydrogeochemical Evaluation of Groundwater Aquifers and Associated Health Hazard Risk Mapping Using Ensemble Data Driven Model in a Water Scares Plateau Region of Eastern India. Expo. Health 2023, 15, 113–131. [Google Scholar] [CrossRef]
  11. Jaydhar, A.K.; Pal, S.C.; Saha, A.; Islam, A.R.; Ruidas, D. Hydrogeochemical evaluation and corresponding health risk from elevated arsenic and fluoride contamination in recurrent coastal multi-aquifers of eastern India. J. Clean. Prod. 2022, 369, 133150. [Google Scholar] [CrossRef]
  12. Pal, S.C.; Ruidas, D.; Saha, A.; Islam, A.R.; Chowdhuri, I. Application of novel data-mining technique based nitrate concentration susceptibility prediction approach for coastal aquifers in India. J. Clean. Prod. 2022, 346, 131205. [Google Scholar] [CrossRef]
  13. Ruidas, D.; Pal, S.C.; Saha, A.; Chowdhuri, I.; Shit, M. Hydrogeochemical characterization based water resources vulnerability assessment in India’s first Ramsar site of Chilka lake. Mar. Pollut. Bull. 2022, 184, 114107. [Google Scholar] [CrossRef] [PubMed]
  14. Ruidas, D.; Pal, S.C.; Saha, A.; Chowdhuri, I.; Saha, A.; Biswas, T.; Islam, A.R.T.; Shit, M. Hydrogeochemical evaluation for human health risk assessment from contamination of coastal groundwater aquifers of Indo-Bangladesh Ramsar site. J. Clean. Prod. 2023, 399, 136647. [Google Scholar] [CrossRef]
  15. Biswas, T.; Pal, S.C.; Saha, A.; Ruidas, D.; Islam, A.R.M.; Shit, M. Hydro-chemical assessment of groundwater pollutant and corresponding health risk in the Ganges delta, Indo-Bangladesh region. J. Clean. Prod. 2022, 382, 135229. [Google Scholar] [CrossRef]
  16. Khan, M.Y.A.; ElKashouty, M.; Abdellattif, A.; Egbueri, J.C.; Taha, A.I.; Al Deep, M.; Shaaban, F. Influence of natural and anthropogenic factors on the hydrogeology and hydrogeochemistry of Wadi Itwad Aquifer, Saudi Arabia: Assessment using multivariate statistics and PMWIN simulation. Ecol. Indic. 2023, 151, 110287. [Google Scholar] [CrossRef]
  17. Khan, M.Y.A.; ElKashouty, M.; Khan, N.; Subyani, A.M.; Tian, F. Spatio-temporal evaluation of trace element contamination using multivariate statistical techniques and health risk assessment in groundwater, Khulais, Saudi Arabia. Appl. Water Sci. 2023, 13, 123. [Google Scholar] [CrossRef]
  18. Khan Mohd, Y.A.; El Kashouty, M.; Gusti, W.; Kumar, A.; Subyani, A.M.; Alshehri, A. Geo-Temporal Signatures of Physicochemical and Heavy Metals Pollution in Groundwater of Khulais Region—Makkah Province, Saudi Arabia. Front. Environ. Sci. 2022, 9, 800517. [Google Scholar] [CrossRef]
  19. Yu, B.; Yuan, Z.; Yu, Z.; Xue-song, F. BTEX in the environment: An update on sources, fate, distribution, pretreatment, analysis, and removal techniques. Chem. Eng. J. 2022, 435, 134825. [Google Scholar] [CrossRef]
  20. Miri, S.; Espejel-Pérez, J.A.; Kaur Brar, S.; Rouissi, T.; Martel, R. Sustainable production and co-immobilization of cold-active enzymes from Pseudomonas sp. for BTEX biodegradation. Environ. Pollut. 2021, 285, 117678. [Google Scholar] [CrossRef]
  21. Bustillo-Lecompte, C.F.; Kakar, D.; Mehrvar, M. Photochemical treatment of benzene, toluene, ethylbenzene, and xylenes (BTEX) in aqueous solutions using advanced oxidation processes: Towards a cleaner production in the petroleum refining and petrochemical industries. J. Clean. Prod. 2018, 186, 609–617. [Google Scholar] [CrossRef]
  22. Stefanakis, A.I. The Fate of MTBE and BTEX in Constructed Wetlands. Appl. Sci. 2020, 10, 127. [Google Scholar] [CrossRef]
  23. Wu, C.-C.; Blount, J.R.; Haimbaugh, A.; Heldman, S.; Shields, J.N.; Baker, T.R. Evaluating Phenotypic and Transcriptomic Responses Induced by Low-Level VOCs in Zebrafish: Benzene as an Example. Toxics 2022, 10, 351. [Google Scholar] [CrossRef]
  24. Dehghani, M.; Mohammadpour, A.; Abbasi, A.; Rostami, I.; Gharehchahi, E.; Derakhshan, Z.; Ferrante, M.; Oliveri Conti, G. Health risks of inhalation exposure to BTEX in a municipal wastewater treatment plant in Middle East city: Shiraz, Iran. Environ. Res. 2022, 204, 112155. [Google Scholar] [CrossRef] [PubMed]
  25. Teramoto, E.H.; Chang, H.K. A Screening Model to Predict Entrapped LNAPL Depletion. Water 2020, 12, 334. [Google Scholar] [CrossRef]
  26. Lee, K.Y. Phase partitioning modeling of ethanol, isopropanol, and methanol with BTEX compounds in water. Environ. Pollut. 2008, 154, 320–329. [Google Scholar] [CrossRef]
  27. Ministerio de la Presidencia, Gobierno de España. Real Decreto 9/2005, de 14 de Enero, Por el Que se Establece la Relación de Actividades Potencialmente Contaminantes del Suelo y los Criterios y Estándares Para la Declaración de Suelos Contaminados. Available online: https://www.boe.es/eli/es/rd/2005/01/14/9 (accessed on 1 July 2023).
  28. Ravi, V.; Johnson, J.A. VLEACH. A One-Dimensional Finite Difference Vadose Zone Leaching Model; Version 2.2a; U. S. Environmental Protection Agency: Washington, DC, UDA, 1997. Available online: https://www.epa.gov/water-research/vleach-one-dimensional-finite-difference-vadose-zone-leaching-model-version-22a (accessed on 1 July 2023).
  29. Cavelan, A.; Colfier, F.; Colombano, S.; Davarzani, H.; Deparis, J.; Faure, P. A critical review of the influence of groundwater level fluctuations and temperature on LNAPL contaminations in the context of climate change. Sci. Total Environ. 2022, 806, 150412. [Google Scholar] [CrossRef]
  30. Yang, Y.; Zheng, J.; Li, J.; Huan, H.; Zhao, X.; Lv, N.; Ma, Y.; Zhang, H. Modeling BTEX Multiphase Partitioning with Soil Vapor Extraction under Groundwater Table Fluctuation Using the TMVOC Model. Water 2023, 15, 2477. [Google Scholar] [CrossRef]
  31. Civan, M.Y.; Elbir, T.; Seyfioglu, R.; Kuntasal, Ö.O.; Bayram, A.; Doğan, G.; Yurdakul, S.; Andiç, Ö.; Müezzinoğlu, A.; Sofuoglu, S.C.; et al. Spatial and temporal variations in atmospheric VOCs, NO2, SO2, and O3 concentrations at a heavily industrialized region in Western Turkey, and assessment of the carcinogenic risk lev7els of benzene. Atmos. Environ. 2015, 103, 102–113. [Google Scholar] [CrossRef]
  32. Šoštarić, A.; Stojić, A.; Stanišić Stojić, S.; Gržetić, I. Quantification and mechanisms of BTEX distribution between aqueous and gaseous phase in a dynamic system. Chemosphere 2016, 144, 721–727. [Google Scholar] [CrossRef]
  33. Brusseau, M.L.; Rao, P.S.C.; Gillham, R.W. Sorption Nonideality During Organic Contaminant Transport in Porous Media. Crit. Rev. Environ. Sci. Technol. 1989, 19, 33–99. [Google Scholar] [CrossRef]
  34. Banerjee, S.; Yalkowsky, S.H.; Valvani, C. Water solubility and octanol/water partition coefficients of organics. Limitations of the solubility-partition coefficient correlation. Environ. Sci. Technol. 1980, 14, 1227–1229. [Google Scholar] [CrossRef]
  35. Lyman, W.J.; Reehl, W.F.; Rosenblatt, D.H. Handbook of Chemical Property Estimation Methods; American Chemical Society: Washington, DC, USA, 1990. [Google Scholar] [CrossRef]
  36. Millington, R.J. Gas diffusion in porous media. Science 1959, 130, 100–102. [Google Scholar] [CrossRef] [PubMed]
  37. Pérez-Indoval, R.; Rodrigo-Ilarri, J.; Cassiraga, E.; Rodrigo-Clavero, M.-E. PWC-based evaluation of groundwater pesticide pollution in the Júcar River Basin. Sci. Total Environ. 2022, 847, 157386. [Google Scholar] [CrossRef] [PubMed]
  38. Instituto Geológico y Minero de España (IGME). Sistema de Información Documental. Available online: http://info.igme.es/ConsultaSID/index.asp (accessed on 12 December 2022).
  39. Ministerio de Agricultura, Pesca y Alimentación. Gobierno de España. Sistema de Información de Recursos Subterráneos. Available online: https://sig.mapama.gob.es/redes-seguimiento/?herramienta=Sondeos (accessed on 12 December 2022).
  40. Fetter, C.W. Applied Hydrogeology; Prentice Hall: Hoboken, NJ, USA, 2001. [Google Scholar]
  41. van Genuchten, M.T. A closed-form equation for predicting the hydraulic conductivity of unsaturated soils. Soil Sci. Soc. Am. J. 1980, 44, 892–898. [Google Scholar] [CrossRef]
  42. Ghanbarian-Alavijeh, B.; Liaghat, A.; Huang, G.H.; van Genuchten, M.T. Estimation of the van Genuchten Soil Water Retention Properties from Soil Textural Data. Pedosphere 2010, 20, 456–465. [Google Scholar] [CrossRef]
  43. Leusch, F.; Bartkow, M. A Short Primer on Benzene, Toluene, Ethylbenzene and Xylenes (BTEX) in the Environment and in Hydraulic Fracturing Fluids; Smart Water Research Center: Southport, Australia, 2010; pp. 1–8. Available online: https://www.ehp.qld.gov.au/management/coal-seam-gas/pdf/btex-report.pdf (accessed on 1 July 2023).
  44. Ministerio de Industria, Turismo y Comercio, Gobierno de España. Real Decreto 61/2006, de 31 de enero, por el que se Determinan las Especificaciones de Qasolinas, Gasóleos, Fuelóleos y Gases Licuados del Petróleo y se Regula el uso de Determinados Biocarburantes. Available online: https://www.boe.es/eli/es/rd/2006/01/31/61/con (accessed on 1 July 2023).
  45. Kim, S.; Thiessen, P.A.; Bolton, E.E.; Chen, J.; Fu, G.; Gindulyte, A.; Han, L.; He, J.; He, S.; Shoemaker, B.A.; et al. Pubchem Substance and Compound databases. Nucleic Acids Res. 2016, 44, D1202–D1213. [Google Scholar] [CrossRef]
  46. United States Environmental Protection Agency. National Primary Drinking Water Regulations. Available online: https://www.epa.gov/ground-water-and-drinking-water/national-primary-drinking-water-regulations (accessed on 4 March 2023).
  47. Occupational Safety and Health Administration (OSHA). Occupational Exposure Limits. Available online: https://www.osha.gov/ (accessed on 4 March 2023).
Figure 1. Location of the study area: Aldaia municipality in Valencia region (Spain).
Water 15 03279 g001
Figure 2. Evolution of precipitation and temperature in Valencia region [37].
Water 15 03279 g002
Figure 3. Lithology and thickness of each stratum.
Water 15 03279 g003
Figure 5. Schematic cross-section and dimensions of the UST considered in the modeling process.
Water 15 03279 g005
Figure 6. Permanent leak. BTEX concentration in the solid phase. (a) Benzene, (b) Toluene, (c) Ethylbenzene and (d) Xylene.
Water 15 03279 g006
Figure 7. Permanent leak. Concentrations in the liquid phase of (a) Benzene and (b) Toluene.
Water 15 03279 g007
Figure 8. Permanent leak. Concentrations in the gas phase of (a) Benzene and (b) Toluene.
Water 15 03279 g008
Figure 9. Permanent leak. BTEX mass transferred to the aquifer for different phreatic levels. (a) Benzene, (b) Toluene, (c) Ethylbenzene and (d) Xylene.
Water 15 03279 g009
Figure 10. One-time leak. BTEX concentration in the solid phase. (a) Benzene, (b) Toluene, (c) Ethylbenzene and (d) Xylene.
Water 15 03279 g010
Figure 11. One-time leak. BTEX mass transferred to the aquifer for a medium phreatic level. (a) Benzene, (b) Toluene, (c) Ethylbenzene and (d) Xylene.
Water 15 03279 g011
Table 1. Values of partition coefficients and log Kow for BTEX compounds.
BTEXMW
(g/mol)
Sol
(mL/L)
VP
(atm)
log Kow
Benzene78.1117800.1252.13
Toluene92.145150.0372.69
Ethylbenzene106.171520.01253.10
Xylene106.171750.00873.12
Table 2. Equivalent dry density ( ρ ), porosity (ϕ), and organic matter content (foc) for the two soil types.
SoilStrata ρ (g/cm3)ϕ (%)foc (%)
ASandy silt + Gravel + Clay (up to average water table)1.4660.4190.518
BSandy silt + Gravel (up to extraordinary water table)1.6130.3740.615
Table 3. Definition of scenarios.
CodeAnalysis of StrataLeak TypePhreatic Level DepthVolumetric
Water Content
Permeability Associated with Water Content
L-C1SuperficialPermanentAverageLowLow
L-C2SuperficialPermanentAverageMediumMedium
L-C3SuperficialPermanentAverageHighHigh
L-P1SuperficialOne-timeAverageLowLow
L-P2SuperficialOne-timeAverageMediumMedium
L-P3SuperficialOne-timeAverageHighHigh
T-C1FullPermanentAverageLowLow
T-C2FullPermanentAverageMediumMedium
T-C3FullPermanentAverageHighHigh
T-C4FullPermanentHighLowLow
T-C5FullPermanentHighMediumMedium
T-C6FullPermanentHighHighHigh
T-P1FullOne-timeAverageLowLow
T-P2FullOne-timeAverageMediumMedium
T-P3FullOne-timeAverageHighHigh
T-P4FullOne-timeHighLowLow
T-P5FullOne-timeHighMediumMedium
T-P6FullOne-timeHighHighHigh
Table 4. Saturated and unsaturated hydraulic conductivity (Ks) values for the two soil types.
SoilStrataKs
(cm/s)
Equivalent K(θ) (cm/s)
θ = 0.20 θ = 0.25 θ = 0.30
ASandy silt + Gravel + Clay (up to average water table)2.39 × 10−61.82 × 10−79.11 × 10−71.82 × 10−6
BSandy silt + Gravel (up to extraordinary water table)1.82 × 10−42.39 × 10−91.20 × 10−82.39 × 10−8
Table 5. BTEX parameters for mass transport modeling.
BTEX% Volume
in Gasoline
Koc
(mL/L)
KH
(-)
Solubility
(mg/L)
Dair
(m2/day)
Density at 20 °C (g/L)
Benzene1580.22117900.804876
Toluene51390.2695260.734867
Ethylbenzene12200.3211690.657866
Xylene73500.2441060.622861
Table 6. Precipitation and infiltration annual volumes.
Volumetric Water Content in SoilPrecipitation
(mm/Year)
Annual Precipitation Volume (L/Year)Annual Infiltration
Volume (L/Year)
0.20350323,05064,861
0.25450415,35066,707
0.30550507,65068,553
Table 7. Permanent leak scenarios. Concentrations of pollutants as a function of precipitation.
BTEXLeak Volume
(L/Year)
Concentration (mg/L)
Prec. = 350 mmPrec. = 450 mmPrec. = 550 mm
Benzene20262255248
Toluene100129712621229
Ethylbenzene20259252245
Xylene140180317541709
Table 8. Common parameter values for all the simulations.
ScenarioHpolygon
(m)
Blocks
(Unit)
ρ b
(g/cm3)
ϕ
(%)
θ
(%)
foc
(%)
K
(cm/s)
L-C18.5101.3350.4350.200.719.25 × 10−8
L-C28.5101.3350.4350.250.715.19 × 10−7
L-C38.5101.3350.4350.300.712.03 × 10−6
L-P18.5101.3350.4350.200.719.25 × 10−8
L-P28.5101.3350.4350.250.715.19 × 10−7
L-P38.5101.3350.4350.300.712.03 × 10−6
T-C126.5301.4660.4190.200.522.39 × 10−9
T-C226.5301.4660.4190.250.521.20 × 10−8
T-C326.5301.4660.4190.300.522.39 × 10−8
T-C415.5201.6130.3740.200.621.82 × 10−7
T-C515.5201.6130.3740.250.621.20 ×·10−8
T-C615.5201.6130.3740.300.622.39 × 10−8
T-P126.5301.4660.4190.200.522.39 × 10−9
T-P226.5301.4660.4190.250.521.20 × 10−8
T-P326.5301.4660.4190.300.522.39 × 10−8
T-P415.5201.6130.3740.200.621.82 × 10−7
T-P515.5201.6130.3740.250.621.20 × 10−8
T-P615.5201.6130.3740.300.622.39 × 10−8
Table 9. Specific parameter values for every simulation scenario.
ScenarioBenzeneTolueneEthylbenzeneXylene
Crecharge
(mg/L)
Csoil
(mg/L)
Crecharge
(mg/L)
Csoil
(mg/L)
Crecharge
(mg/L)
Csoil
(mg/L)
Crecharge
(mg/L)
Csoil
(mg/L)
L-C1262012970259018030
L-C2255012620252017540
L-C3248012290245017090
L-P102315011,46002289015,933
L-P202315011,46002289015,933
L-P302315011,46002289015,933
T-C1262012970259018030
T-C2255012620252017540
T-C3248012290245017090
T-C4262012970259018030
T-C5255012620252017540
T-C6248012290245017090
T-P102228011,02802203015,332
T-P202228011,02802203015,332
T-P302228011,02802203015,332
T-P402540012,56902511017,475
T-P502540012,56902511017,475
T-P602540012,56902511017,475
Table 10. Model parameters and uncertainty characterization.
ParameterUncertainty
Simulated areaLow
Thickness of the vadose zoneLow
Unsaturated hydraulic conductivityHigh
Apparent dry densityLow
Soil porosityLow
Volumetric water contentHigh
Organic content fractionHigh
Concentration of pollutants in infiltrated waterHigh
Initial concentration of pollutantsHigh
Upper boundary condition of vaporLow
Lower boundary condition of vaporHigh
Organic carbon partition coefficientLow
Henry’s constant of pollutantsLow
Solubility in water of pollutantsLow
Free-air diffusion coefficient of pollutantsLow
Disclaimer/Publisher’s Note: The statements, opinions and data contained in all publications are solely those of the individual author(s) and contributor(s) and not of MDPI and/or the editor(s). MDPI and/or the editor(s) disclaim responsibility for any injury to people or property resulting from any ideas, methods, instructions or products referred to in the content.

