Review

A Review of Non-Contact Water Level Measurement Based on Computer Vision and Radar Technology

State Key Laboratory of Water Resources Engineering and Management, Wuhan University, Wuhan 430072, China
*
Author to whom correspondence should be addressed.
Water 2023, 15(18), 3233; https://doi.org/10.3390/w15183233
Submission received: 10 August 2023 / Revised: 6 September 2023 / Accepted: 8 September 2023 / Published: 11 September 2023

Abstract

:
As pioneering non-contact water level measurement technologies, both computer vision and radar have effectively addressed challenges posed by traditional water level sensors in terms of maintenance cost, real-time responsiveness, and operational complexity. Moreover, they ensure high-precision measurements in appropriate conditions. These techniques can be seamlessly integrated into unmanned aerial vehicle (UAV) systems, significantly enhancing the spatiotemporal granularity of water level data. However, computer-vision-based water level measurement methods face the core problems of accurately identifying water level lines and elevation calculations, which can lead to measurement errors due to lighting variations and camera position offsets. Although deep learning has received much attention in improving the generation, the effectiveness of the models is limited by the diversity of the datasets. For the radar water level sensor, the hardware structure and signal processing algorithms have to be further improved. In the future, by constructing more comprehensive datasets, developing fast calibration algorithms, and implementing multi-sensor data fusion, it is expected that the robustness, accuracy, and computational efficiency of water level monitoring will be significantly improved, laying a solid foundation for further innovations and developments of hydrological monitoring.

1. Introduction

Water level measurement is an important component of hydrological monitoring and water resources management. Information such as runoff, water supply volumes and flood discharge is usually calculated based on water level measurement [1]. Water level data can also be used to validate and calibrate hydrological and hydrodynamic models, making hydrological forecasts more accurate, especially for predicting extreme hydrological events such as floods [2]. With the increasing climate extremes and changing weather patterns associated with global climate change, the frequency and severity of floods have significantly intensified. Flood warning systems rely upon access to relevant, timely and accurate hydrological data [3]. Thus, real-time and robust water level measurement systems are essential for flood warnings, disaster risk assessment and safety guarantee.
At present, water level measurement approaches can be divided into manual reading and automatic water level measurement. Manual reading depends on the observation of the water gauge by people, the real-time performance is poor and the subjective uncertainty and risk are greater in harsh environments such as high floods. Conventional automatic water level gauges are in contact with water or immersed in water, which can be divided into the float type and the pressure type according to the principle [4]. However, float-type gauges need to be installed in loggings and are expensive to construct. The accuracy of pressure-type gauges is easily affected by sand content and water temperature [5]. In addition, since the contact water level gauges need to be submerged in water, it is prone to be damaged under the action of sediment and floating objects, which increases the maintenance cost. Low-cost non-contact measurement techniques have been encouraged in contrast to traditional methods that may be limited by safety, timeliness and maintenance costs [6].
Non-contact water level measurement techniques include satellite-based methods, ultrasonic-based methods, image-based methods and radar-based methods. The ultrasonic-based method is based on the principle of ultrasonic ranging. Ultrasonic level sensors have not been routinely used because the accuracy of open-air ultrasonic systems, which are affected by air temperature gradients, does not meet the requirements of hydrological monitoring, and they are gradually being replaced by radar sensors with superior performance [7,8]. Satellite-based water level inversion methods are based on data obtained from optical sensors or satellite radar altimeters combined with digital elevation model (DEM) [9]. Water level measurement from optical remote sensing images are limited by image resolution, which shows only decimeter-level measurement accuracy [10]. The main principle of satellite radar altimeters is to send a pulse signal to the surface, and record the time from the launch to the reception of it, then calculate the water level combining the position of the satellite and the distance between it and the reflecting surface [11]. Satellite-based measurements are limited in terms of fixed-point monitoring and continue observations because of the orbital cycle of satellite movements [12]. Due to their large monitoring scale and infrequence, they are of limited use for basic real-time hydrological monitoring tasks.
The network video surveillance systems have been widely used in hydrological sites for river monitoring and flood management recently, which provide advantages for water level measurement based on video images [13]. The image-based water level measurement systems can provide site contextual information other than that used to measure water levels, which can be visually verified and interpreted by managers. A typical image-based approach is to manually observe the water gauge reading in the acquired image [14,15]. Although water level can be monitored at any time compared with the field observation, as long as the image collection and transmission is normal, manually reading water gauge images is still a time-consuming and labor-intensive method, which is not only inefficient, but also subjectively affects the observation accuracy, especially when the image quality is low, such as distortion, blur and so on.
As an essential field of artificial intelligence, a technique that can process images at the pixel level and derive useful information, called computer vision, is constantly advancing and increasingly useful for hydrology research [16]. Tasks in hydrology research utilizing computer vision algorithms include real-time hydrological monitoring [17], hydrological modeling [18] and flood inundation mapping [19], etc. With high-density, low-cost ground-based video networks, hydrological monitoring using computer vision algorithms becomes an attractive solution to enhance the spatial and temporal representation of existing monitoring instruments. The use of computer vision for hydrological monitoring including rainfall monitoring [20,21,22], water level monitoring [23,24] and surface flow velocity measurement [25,26,27] has become a popular paradigm. The computer visual-based paradigm for water level measurement presents challenges in two aspects: accurate water line detection and water level elevation calculation. In recent studies, convolutional neural networks (CNNs) have been used for water line detection, overcoming the generation issue of traditional image processing methods such as edge detection and color transformation [28]. The computer-vision-based methods for water level elevation calculation can be divided into water gauge readings recognition algorithms and photogrammetry approaches, depending on the necessity to identify water gauge information. A water gauge readings recognition algorithm is to obtain the water gauge readings by recognizing graduation lines and characters of gauge, which is similar to manually determine the gauge reading, based on a template-matching algorithms or pattern recognition algorithms [29]. This type of method has a high requirement on image quality, and is easily affected by factors such as the damage of the gauge, flare and insufficient illumination. A photogrammetric approach determines water levels by establishing the correlation between pixel coordinates and global coordinates, with a compensating mechanism for camera movement and camera tilt [30].
The basic principle of the radar-based method is the electromagnetic wave reflection range measurement. Radar level sensors are directed down to the river surface and their main task is to measure vertical distance between installation positions and water. Since radar sensors are non-imaging sensors, the accuracy is less affected by sunshine, fog, night and other meteorological conditions that affect visibility. Compared to the acoustic sensors, they have longer effective range and stronger anti-jamming ability because the propagation and attenuation of microwaves are less susceptible to the influence of air temperature and humidity than ultrasound [31]. They can realize all-weather continuous monitoring, and are widely used in hydrological monitoring and analysis of coast, port and river information [32,33,34,35,36]. The National Oceanic and Atmospheric Administration (NOAA) has transitioned the primary water level sensors in most tide stations in the National Water Level Observation Network (NWLON) from acoustic ranging systems to radar systems [37].
Unmanned Aerial Vehicles (UAVs) are emerging aircrafts that are increasingly being used for river observations [38]. UAVs have the characteristics of fast response and flexible maneuvering. They can quickly rise and fall in a short period of time and perform monitoring tasks in complex sites and small enclosed spaces [39]. They are suitable for water level monitoring in emergencies. The ground-based measurements lack sufficient spatial continuous data to comprehensively characterize the whole water region. However, the satellite data are only capable of monitoring large rivers due to their low spatial resolution, for example, the SWOT mission is only allowed to observe the water surface elevation of water bodies whose width exceeds 100 m [40]. UAVs equipped with sensor systems, which are usually camera or radar sensors, bridge the observational gap between remote sensing satellite and ground-image-based point measurements and enhances the spatial coverage of data acquisition. Their inherent flexibility allows for adjustments in flight altitude and trajectory based on specific monitoring requirements. When integrated with 3D reconstruction technology, UAVs can produce detailed water level distributions. Recent research substantiates the efficacy of UAV-based water level sensing systems, highlighting the potential for elucidating changes in the hydraulic roughness of rivers [41,42].
This paper summarizes the methods of water level measurement based on computer vision and radar technology in hydrological monitoring, evaluates the current application effects, and analyzes the potential challenges and possible development in the future. The remainder of this paper is organized as follows. Section 2 introduces computer-vision-based water level measurement techniques. The radar-based water level measurement method is then introduced in Section 3. Section 4 analyzes the advantages, current limitations and possible future works of each method.

2. Computer-Vision-Based Water Level Measurement

To alleviate the problems associated with manual and contact measurements, the computer-vision-based approaches rely on the automatic acquisition and analysis of water surface images. Images allow the capture of water surfaces without interruption to provide insight into the continuous change of water level. Computer vision can automatically acquire and understand the meaningful information in images, such as the scope of water surface area, water line, gauge characters, etc., to obtain faster recognition speed and more accurate and stable results than human in the water level measurement task.

2.1. Water Line Detection

The key of computer-vision-based water level measurement is water line detection. No matter what kind of approach, the estimation of actual water level is based on the position of water line in the image.
In order to improve search efficiency, the region of interest (ROI) is prior identified in an image such as Figure 1 [43]. The ROI is defined as a k-pixel buffer around the water gauge or the calibration points according to the image size and camera pose.

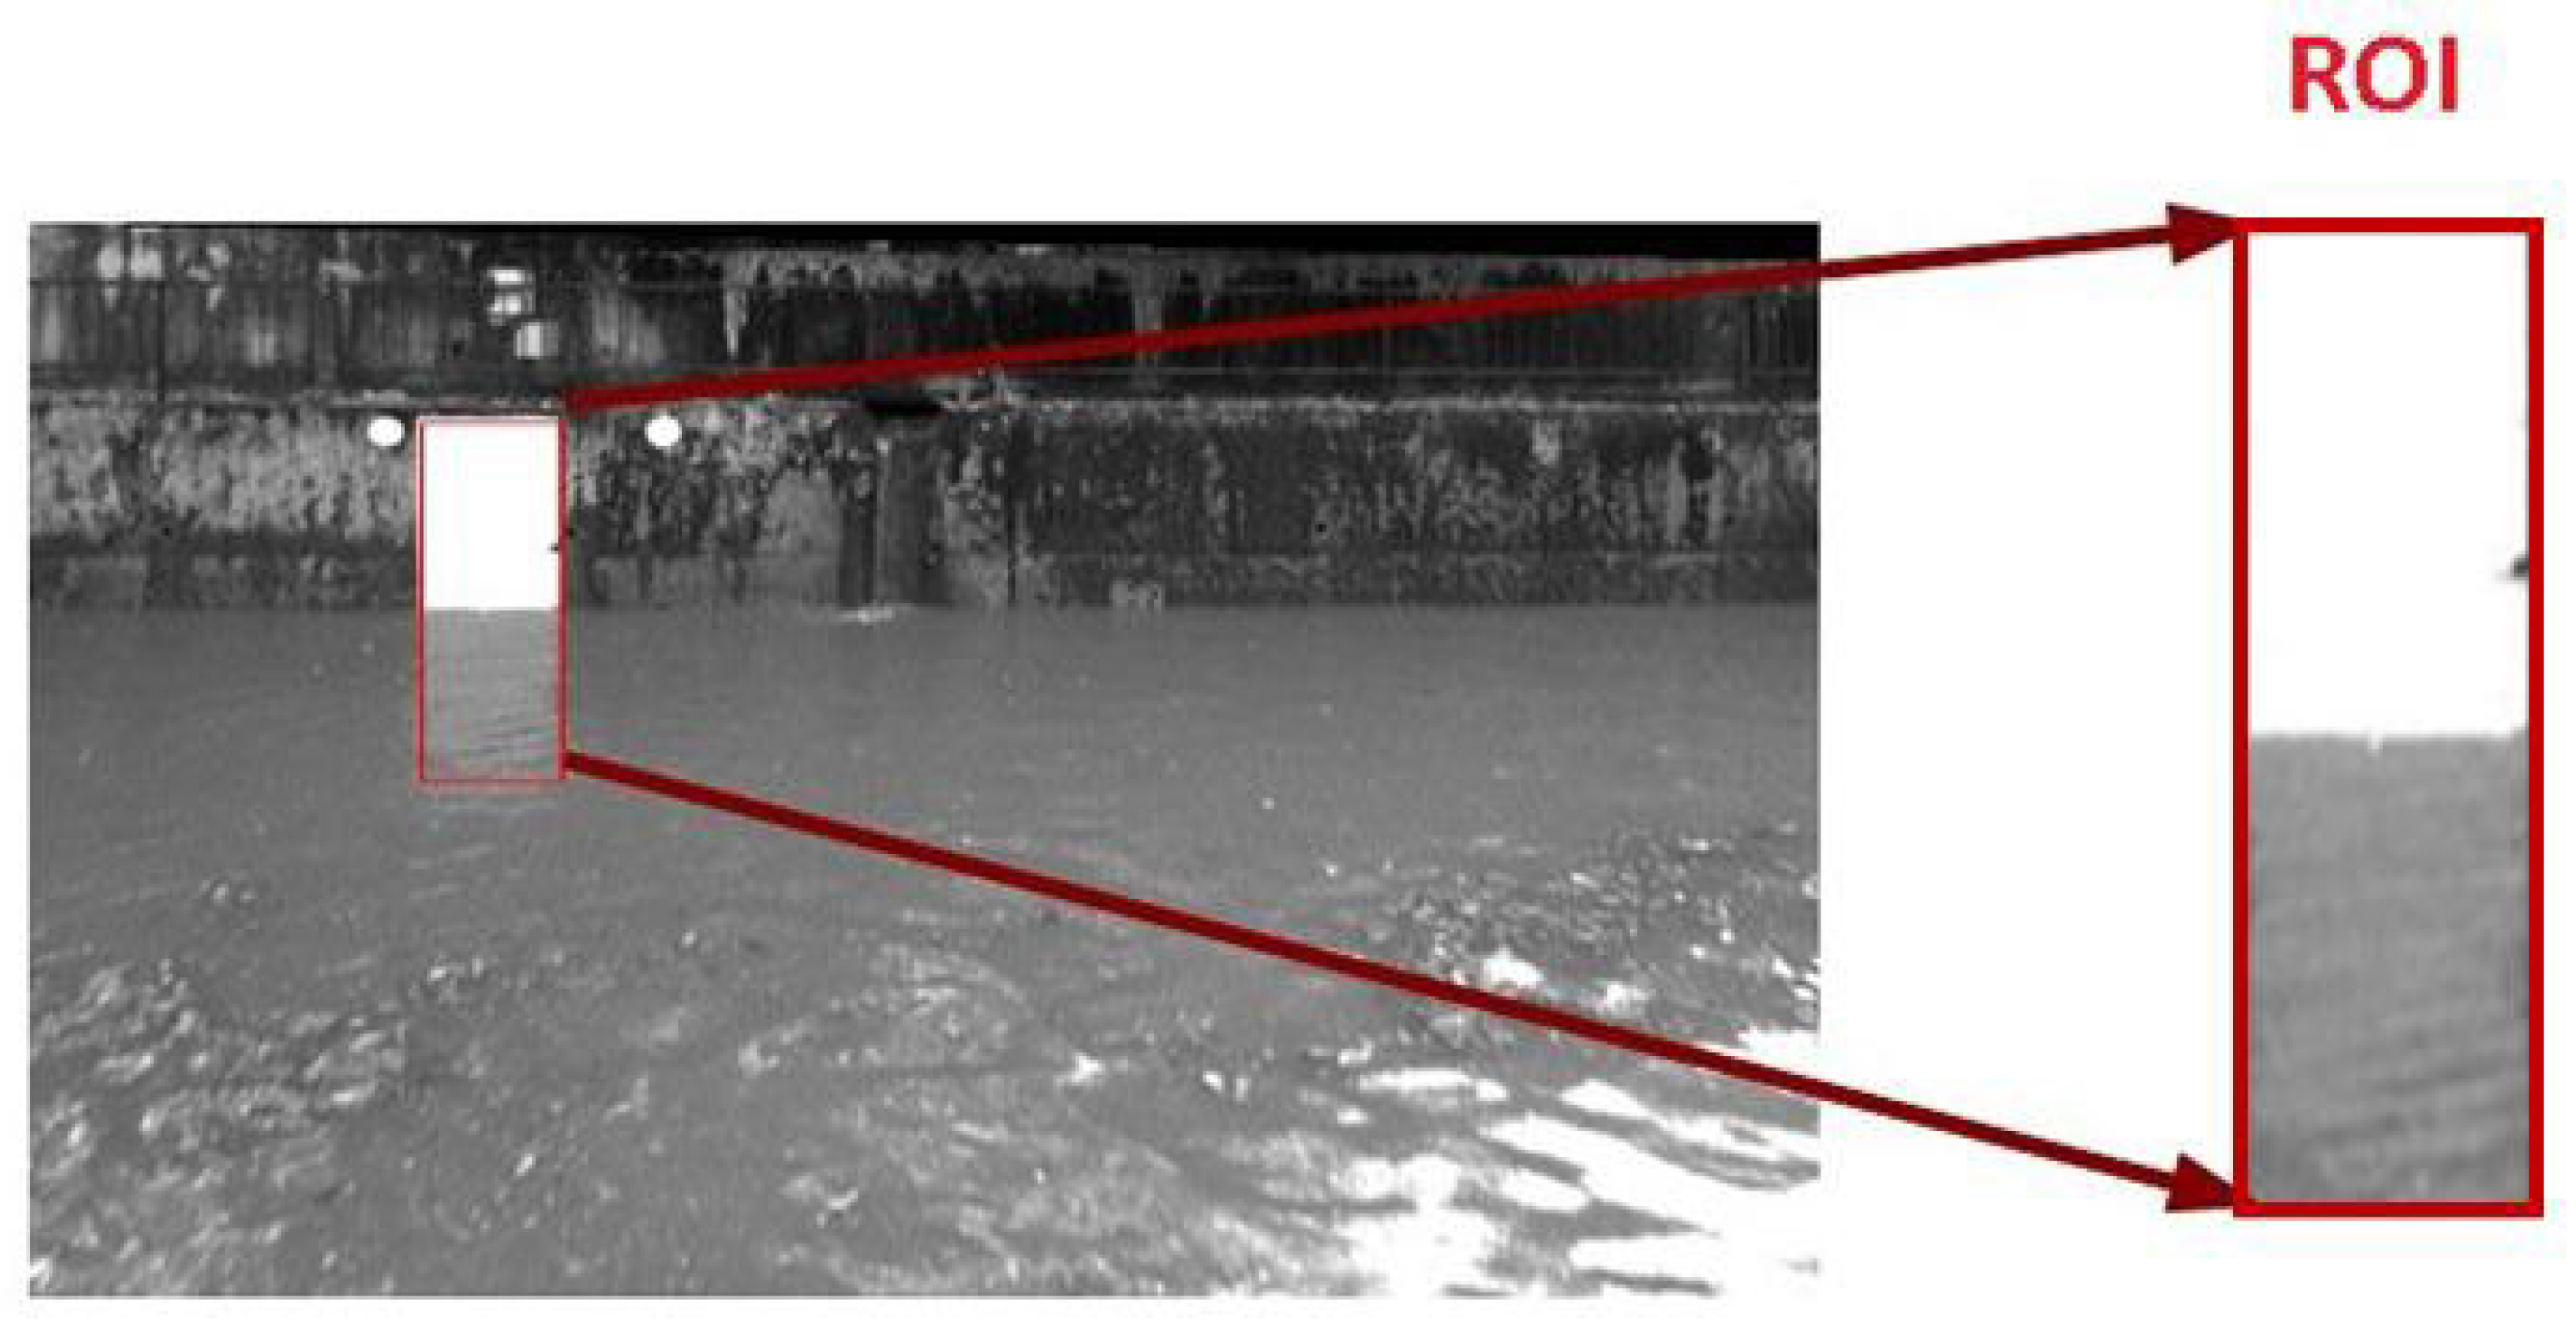
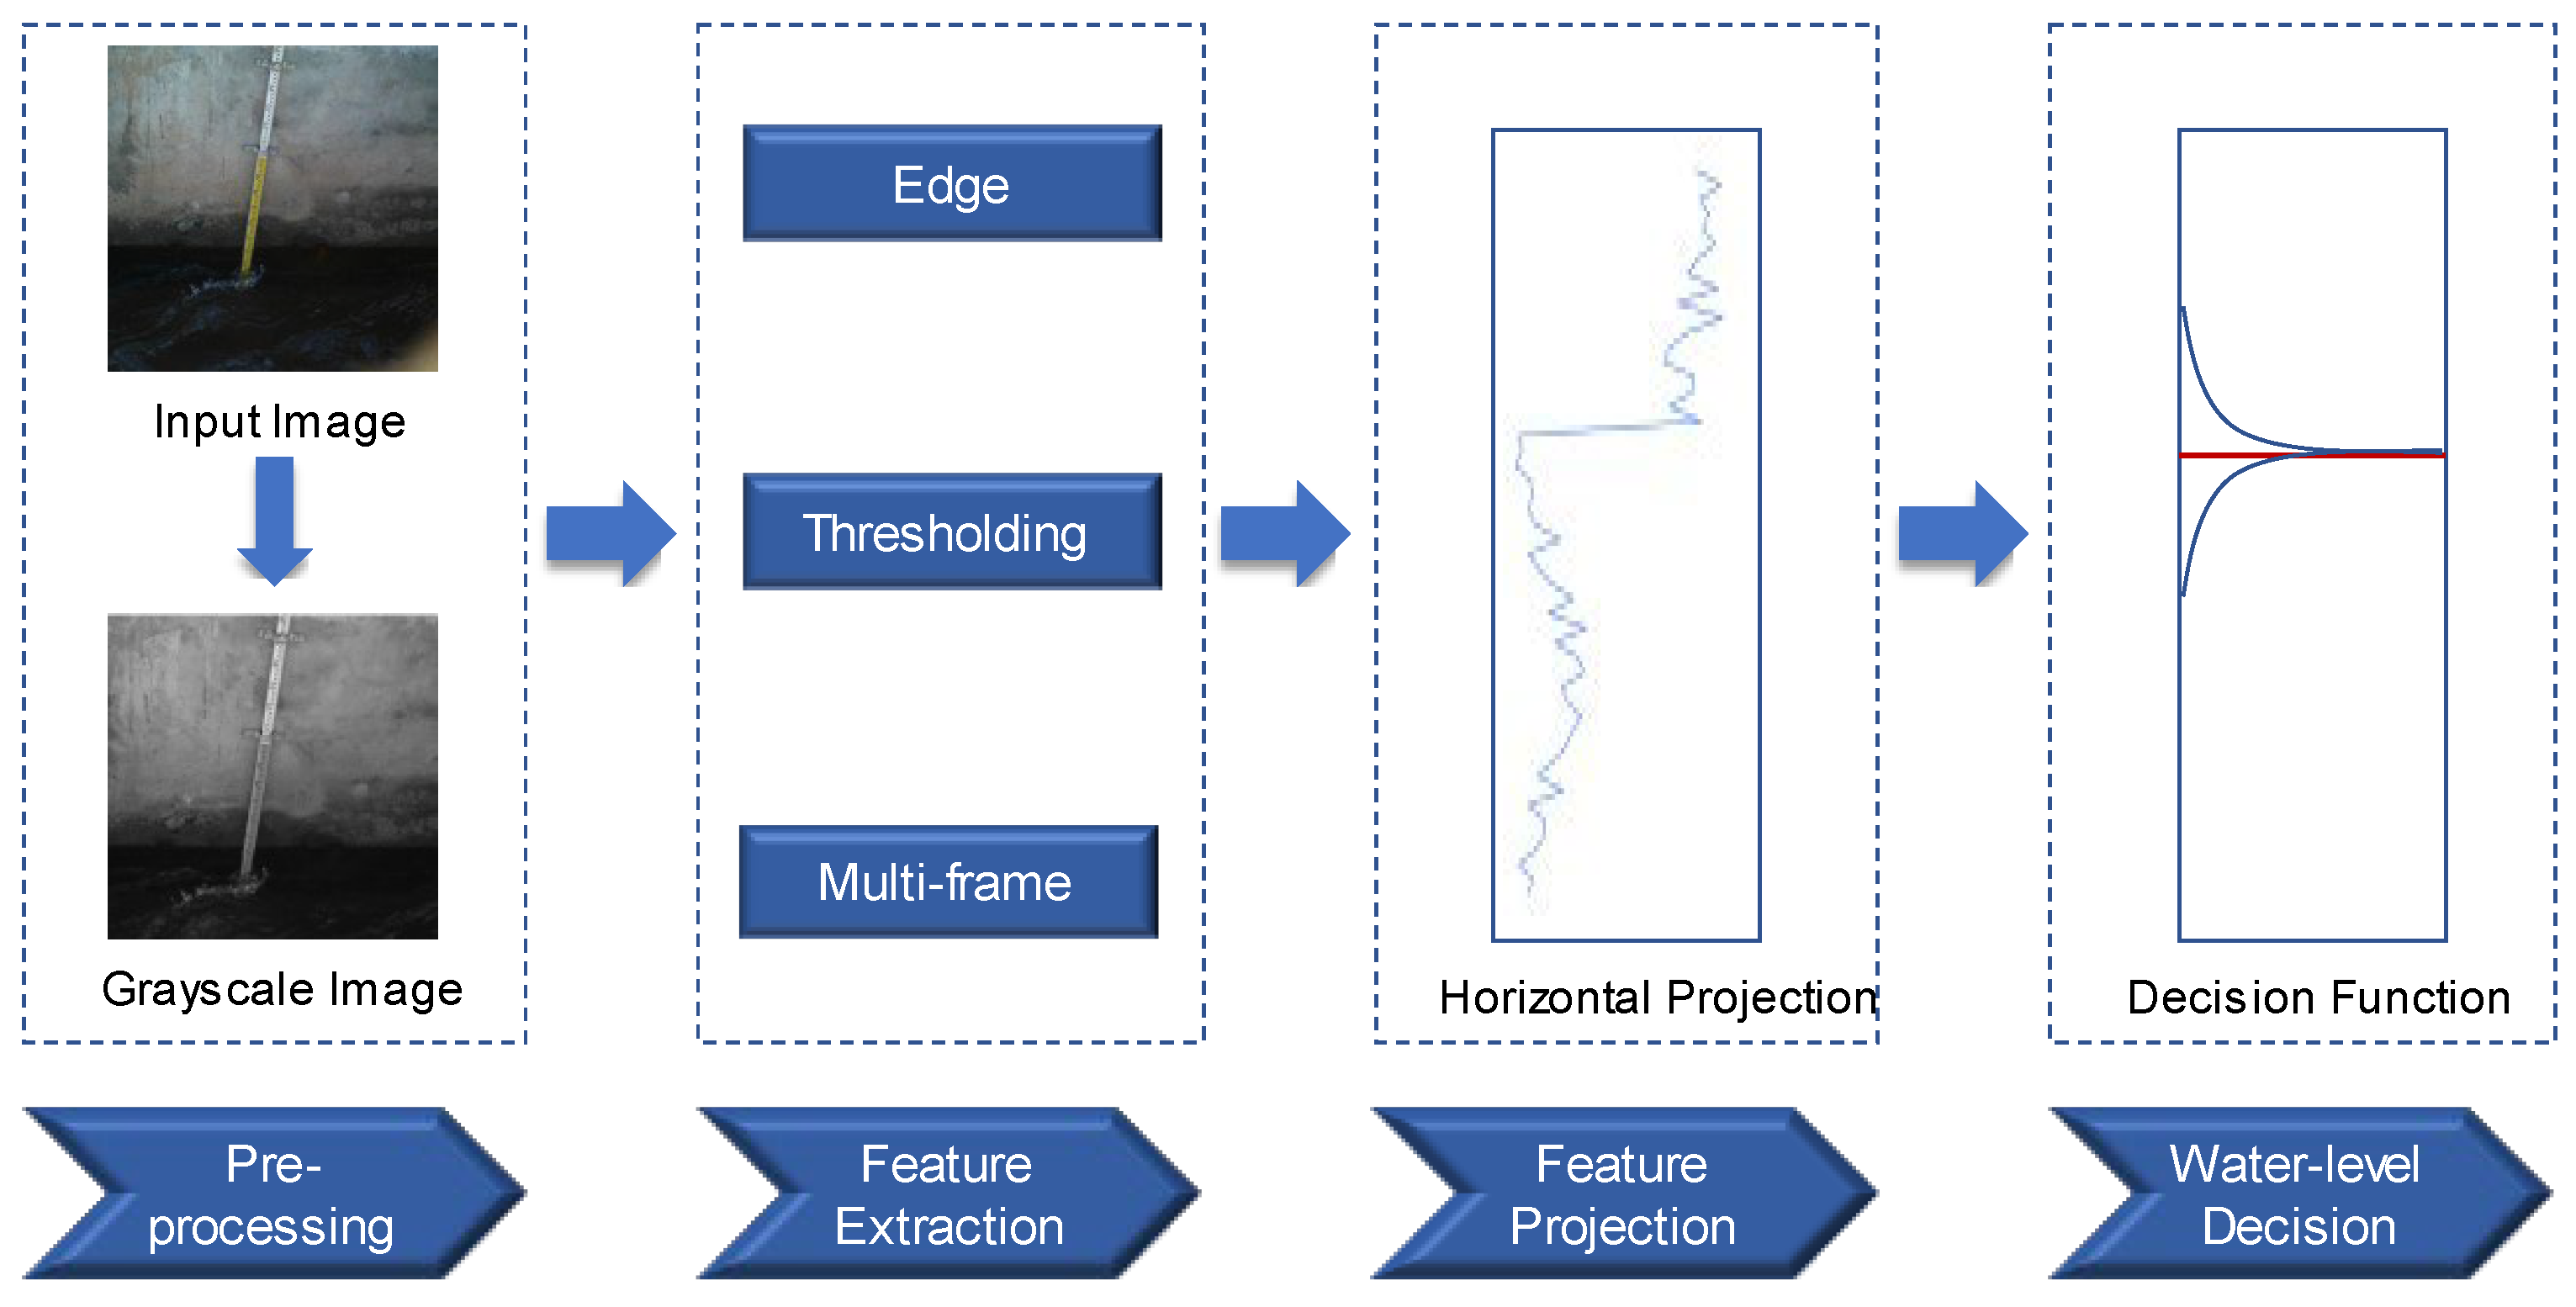
2.1.1. Horizontal Projection Methods

Horizontal projection methods are the most common image processing methods for water line detection of image containing water gauge. Normally, the sum of grayscale values of each row of pixels in the ROI constitutes the horizontal projection curve. The steps are shown in Figure 2: firstly, the image is preprocessed with grayscale processing and noise removal, then the features are extracted, and finally, the mutation point of the feature projection curve is the corresponding water line position. Feature extraction methods can be divided into three categories according to principle: edge detection method, thresholding method and multi-frame accumulation method.
Edge detection algorithms applied on images are based on the assumptions that discontinuities of the intensities of pixels of images are linked to the physical changes, e.g., material changes, surface orientation changes, etc. The water line marks the boundary between the water surface and land, and is a recognizable edge feature in an image. Udomsiri et al. [44] developed a computer-vision-based water level detection system using a horizontal edge detector and finite impulse response (FIR) filter to extract features in different lighting conditions. Shin et al. [45] used the Marr–Hildreth operator to detect the edge pixels of the ruler within ROI. However, the scale line and the water line often have similar edge features in the standard water gauge image, which makes it difficult to identify accurately. Zhang et al. [11] fused greyscale and edge features to determine the water line by coarse-to-fine detecting the position of the maximum mean difference (MMD) between the horizontal projections of the greyscale image and the edge image.
Thresholding methods use the difference between the grayscale distribution of water surface and gauge in an image to convert the image into a binary image by setting the threshold value to detect the water line. The selection of the threshold for binarization processing usually adopts a maximum inter-class variance algorithm (OTSU), which is an adaptive threshold method [46,47,48]. In field observation affected by random noise such as the flare of the water gauge or the reflection and shadow of the water surface, the grayscale distribution of the water gauge and the water surface is uneven, and it is difficult to distinguish the water line clearly. Xu et al. [49] transformed images from the RGB to the HSV, abstracted the hue component to replace grayscale image, and then rebuilt the images based on color spatial distribution information and the color priori information, considering the component map. Chen et al. [50] adopted the color space conversion of the HSV as well to enhance the contrast of the gauge to water surface. Cai et al. [51] used the k-means clustering algorithm to segment the scene in the RGB color space and the region growing algorithm to select the target water body from the segmented scene.
Multi-frame accumulation methods can be located the water line by accumulating the variation of multiple frames [52,53] because the change of water surface is more obvious than that of the water gauge in the case of flow and fluctuation. The cumulative histogram that emphasized the cumulative grayscale variation in the water surface in image sequence similar to feature projection curve has been proposed. However, whether the cumulative variation in the grayscale value and optical flow can be effectively distinguished depends on the degree of movement of the water. It is easy to identify the water line under the condition of fast velocity and the sharp fluctuation of the water surface.

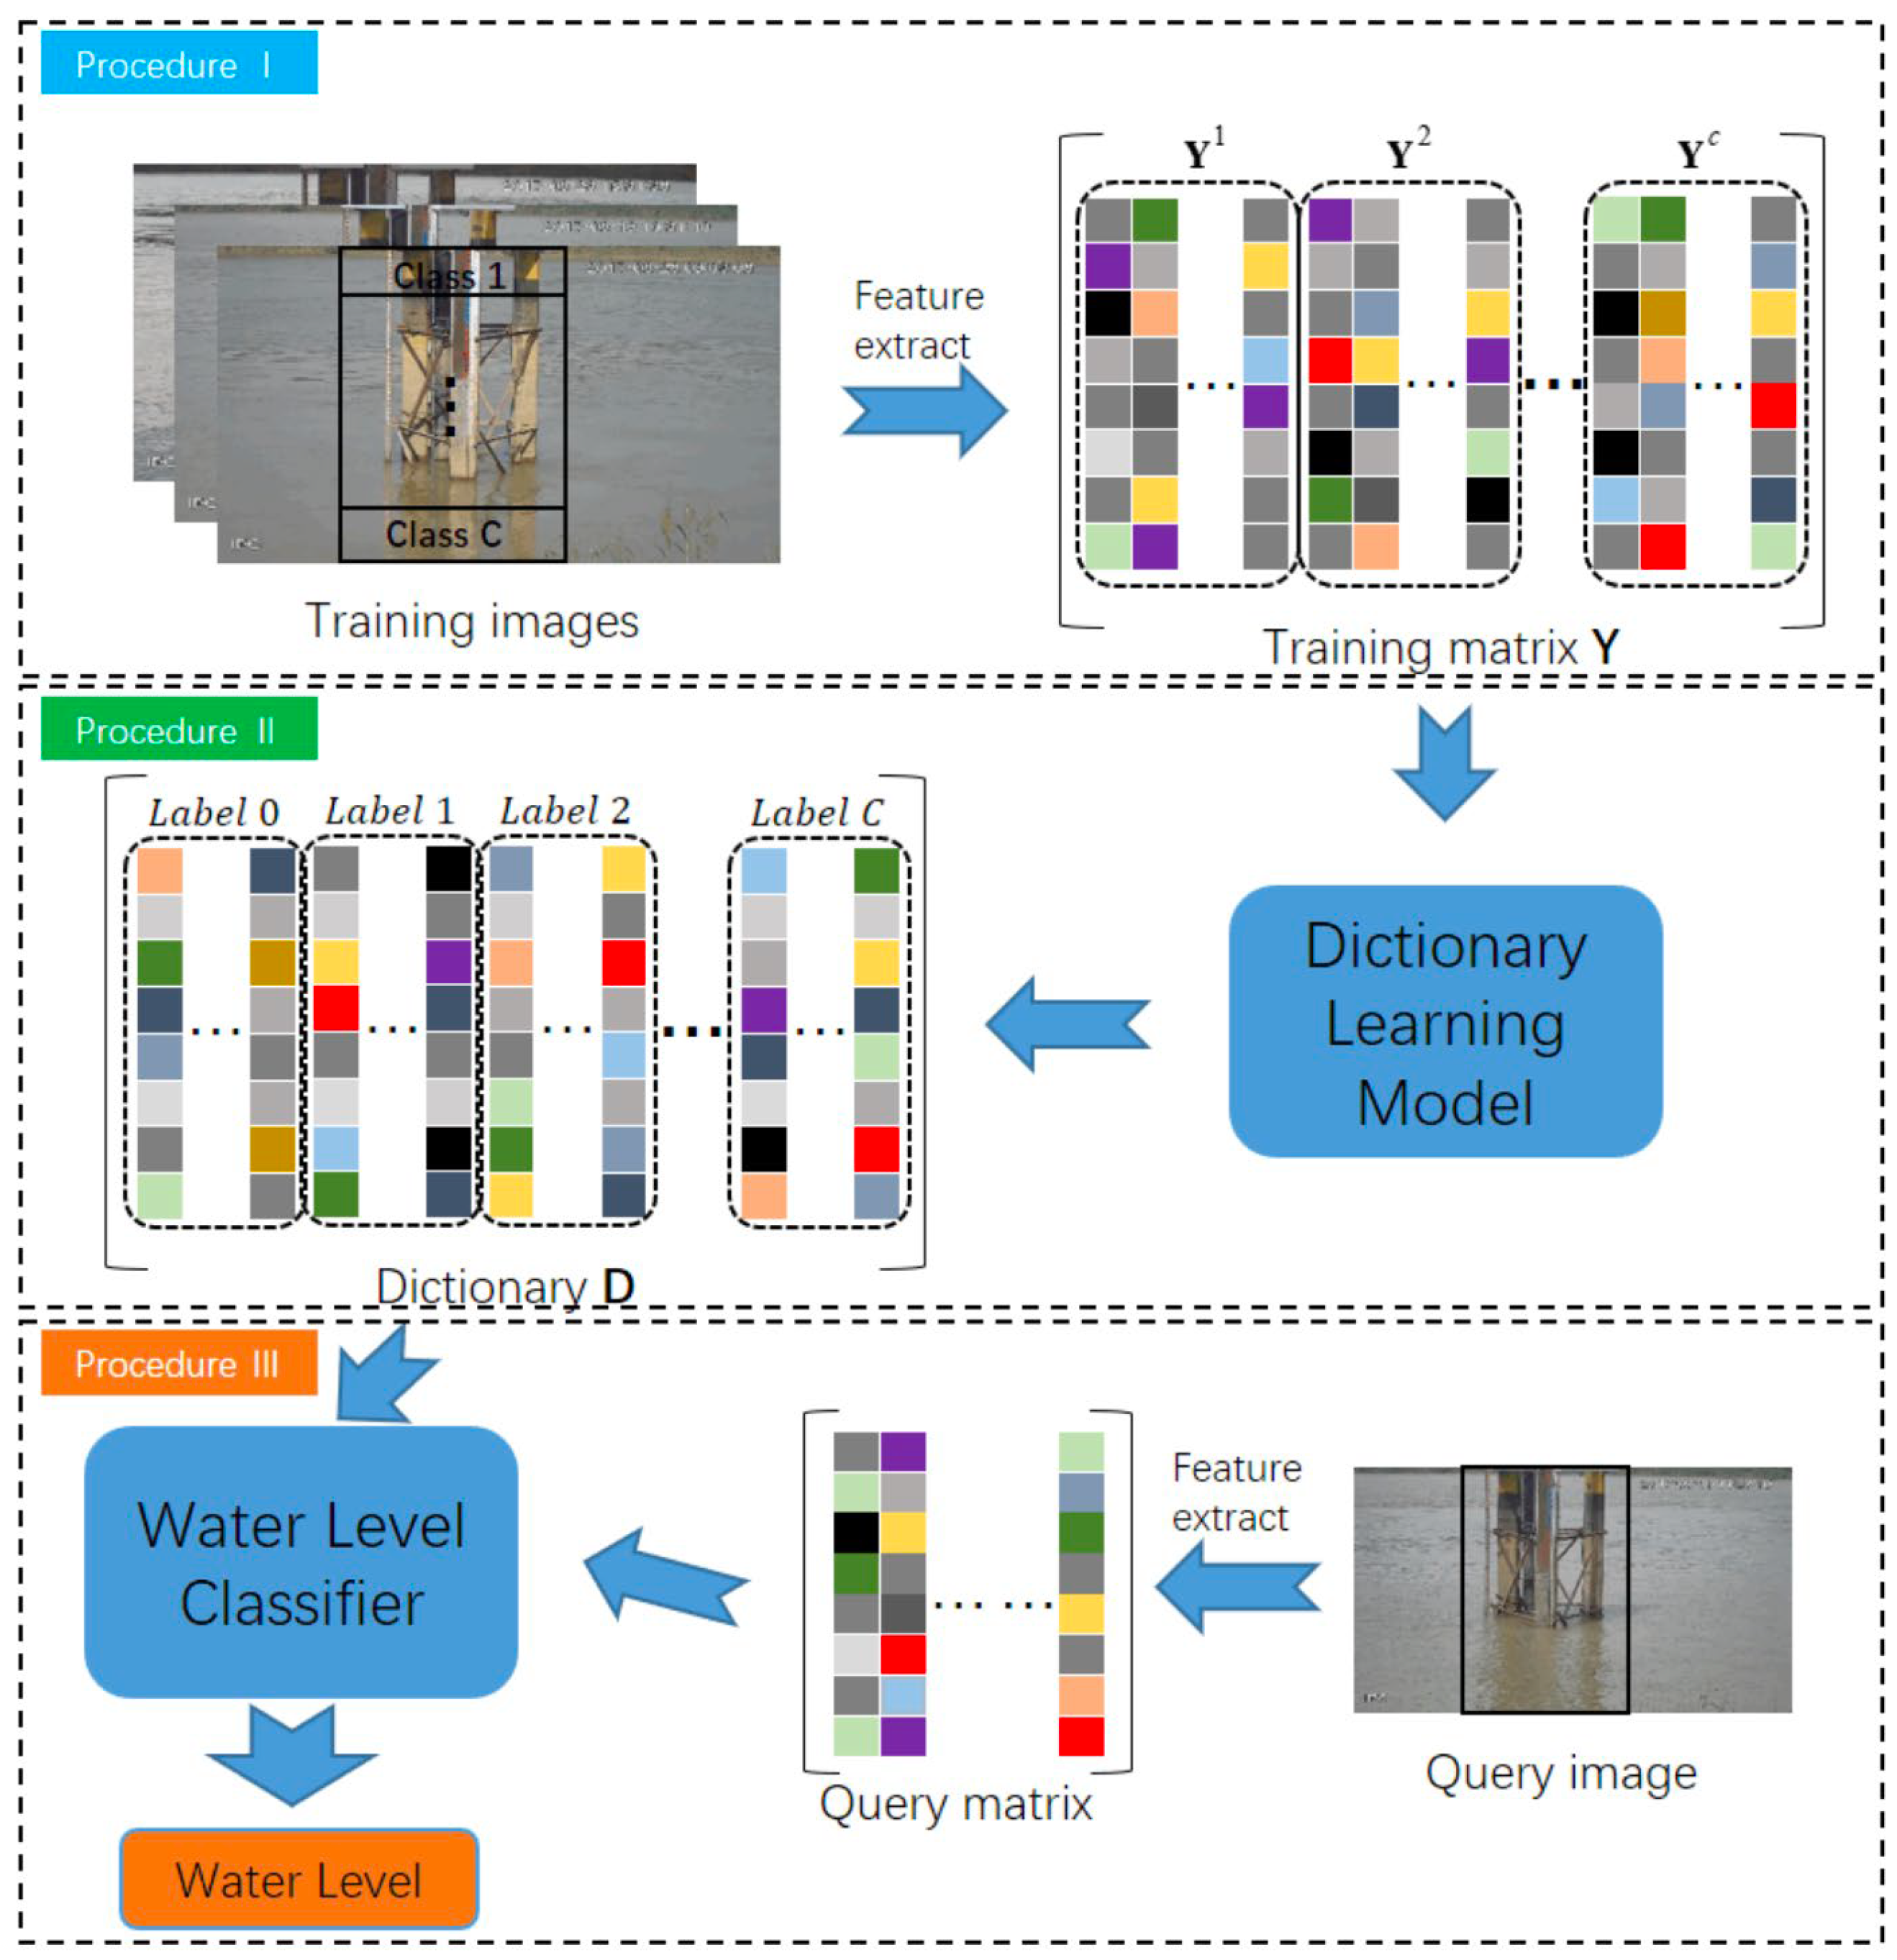
2.1.2. Dictionary Learning Methods

The horizontal projection technique relies on a solitary feature, such as grayscale or color, to differentiate the water gauge from the water surface. However, the extraction of a single, basic feature might not adequately capture the nuanced distinctions between water and non-water regions. This limitation poses challenges in accommodating the intricate and dynamic conditions encountered in field applications.
Dictionary learning method is a data-driven machine learning method to extract the most essential features for the target task contained in training samples. The main problem to be solved in dictionary learning can be expressed as Formula (1):
Y = D X
where Y is a matrix defined as [Y0, Y1,…, YC], in which every sub-matrix Yi is the ith class of images collection with a label. D is a dictionary that preserves the essential features of an image. X is a sparse representation, which represents the category information of image blocks in water line detection.
The solution of D is regarded as an optimization problem as Formula (2):
m i n i = 1 m y i D x i 2 2 + λ i = 1 m x i 1
Briefly, the method based on dictionary learning can be divided into three steps, as seen in Figure 3 [54]. Initially, the training images undergo conversion into a training matrix, denoted as Y, wherein each column corresponds to a specific training sample alongside its designated label. Subsequently, the training matrix Y is fed into the learning model for the acquisition of a dictionary D. Eventually, leveraging the acquired dictionary D, the water-related imagery can be subjected to classification, effectively discerning between gauge and water, thereby facilitating the detection of the water line.

2.1.3. Deep Learning Methods

Deep learning methods mainly train deep convolutional neural networks driven by plenty of various scenarios’ data [55]. Compared with dictionary learning, more generalized features of images can be extracted, thus improving the accuracy and robustness of water level measurement. Deep learning methods in water line detection involve object detection algorithms and semantic segmentation algorithms. The object detection algorithms identify the smallest rectangle box of the water gauge location and take the bottom of the rectangle box as the water line. Bai et al. [56] used an object detection network called SSD to locate the gauge area. Semantic segmentation algorithms can classify instances of the image at the pixel level and obtain a more precise location of the water line than object detection algorithms. In photogrammetric techniques where water gauges are absent, researchers employ semantic segmentation models. This approach allows the extraction of a more accurate water–land boundary as opposed to relying on an estimated straight demarcation. Liang et al. [57] developed a video object segment pipeline called WaterNet and built a dataset named “WaterDataset” of 2388 images and 20 videos with labeling. Jafari et al. [58] used the fully convolutional network for segmentation, which was verified during Hurricane Harvey. Xie et al. [59] used an improved SegFormer-UNet segmentation model to accurately segment the water body from a given image. However, semantic segmentation networks are often trained using supervised learning methods, which need the prior construction of a dataset. The limited scale of available datasets specifically designed for water body segmentation constrains the generalizability of these networks. Vandaele et al. [60] applied transfer learning methodology to semantic segmentation networks to migrate models to unfamiliar datasets and overcome the lack of available data. Zhang and Tong [61] adapted appearance-based data augmentation (ADA) and random extension in the direction (RED) to cover more environmental conditions.

2.2. Water Gauge Reading Recognition Approaches

Water gauge reading recognition approaches obtain the water gauge readings based on the image containing the water gauge, which is inspired by the manual observation of the gauge. When using the manual observation method, it is necessary to first find the water line and estimate water level according to the gauge scale remains above the water surface. The approach uses a computer instead of human eyes to calculate the water level by analyzing the scale bars and characters after locating the position of water line.
A typical approach is the template-matching algorithm, which searches and finds the location of the target image in the template image. The template image is usually partitioned from an orthographic water gauge which is the same as the gauge to be read, with known physical resolution and is not placed in water, meaning that the number of pixels between each scale bar is determined. The target image is the image block of the detected water line according to the captured gauge image, which is always a binary image. The actual water level can be calculated by locating the position of the detected water line region of the captured image in the template image. Shin et al. [45] evaluated the similarity of the water line region image and target feature mask and calculated the water level with polynomial interpolation. Similarly, Kim et al. [53] divided the template image into multiple uniform sub-regions and used template matching to determine which sub-region the detected water line was located in.
In the above studies, the water gauge images are usually captured at the orthographic angle, which does not take into account the perspective distortion caused by oblique shooting in the field observation scene, resulting in a large template matching error. Zhang et al. [29] combined the idea of template matching and photogrammetry to carry out distortion correction on the original image, so that the corrected image and the template image were in the unified coordinate system, meaning that the pixel position of the water line in the corrected image is consistent with that of the template image, without calculating the similarity between them.
Another approach is pattern recognition, which estimates the water level by identifying and counting characters and scale bars, based on the fact that the height of each character is determined in a standard two-color water gauge. Bruinink et al. [62] applied Gaussian Mixture Model segmentation followed by optical character recognition based on a random forest classifier and bar detection using shape moments to obtain the characters and tick marks. The method is simple and efficient, but it would be difficult to extract information in the situation of incomplete scale bars. Guo et al. [63] used sparse learning to recognize scale bars and characters, and performed well when some pixels were missing. Chen et al. [50] proposed a multi-template matching and sequence verification algorithm to achieve a high recognition rate of characters. By collecting characters from different angles to build a rich template library and considering the context information of characters, this method can effectively recognize incomplete characters. Furthermore, since CNNs perform well in object detection, especially in handwritten digit recognition, many convolutional neural network models have also been applied for gauging character location and recognition tasks, such as Yolov5s [64], FCOS [65] and CornerNet [66]. Fleury et al. [67] used the character recognition and counting method to make training set. Thereafter, the CNN was trained to estimate the water level end-to-end. Since all the water gauge image data used for training were captured at the Jirau Hydroelectric Plant located on the Madeira River, this method does not have generalization; that is to say, plenty of images need to be collected at new observation sites for retraining the model to adapt to local flow and gauge features.
The water gauge visibility in an image greatly affects the accuracy of the water gauge reading recognition approaches. Whether it is to identify characters of water gauge surface or to match the template image, it will be difficult to recognize the water level if the water gauge surface is damaged, shielded or reflective. As for the template-matching method, the application is limited because the type of water gauge may be different from the template image in practical application, such as a difference in width, material, bending degree and surface character characteristics.

2.3. Photogrammetric Approaches

The photogrammetric approaches obtain the geometrical information and three-dimensional coordinates according to the corresponding two-dimensional pixel coordinates in a photo.

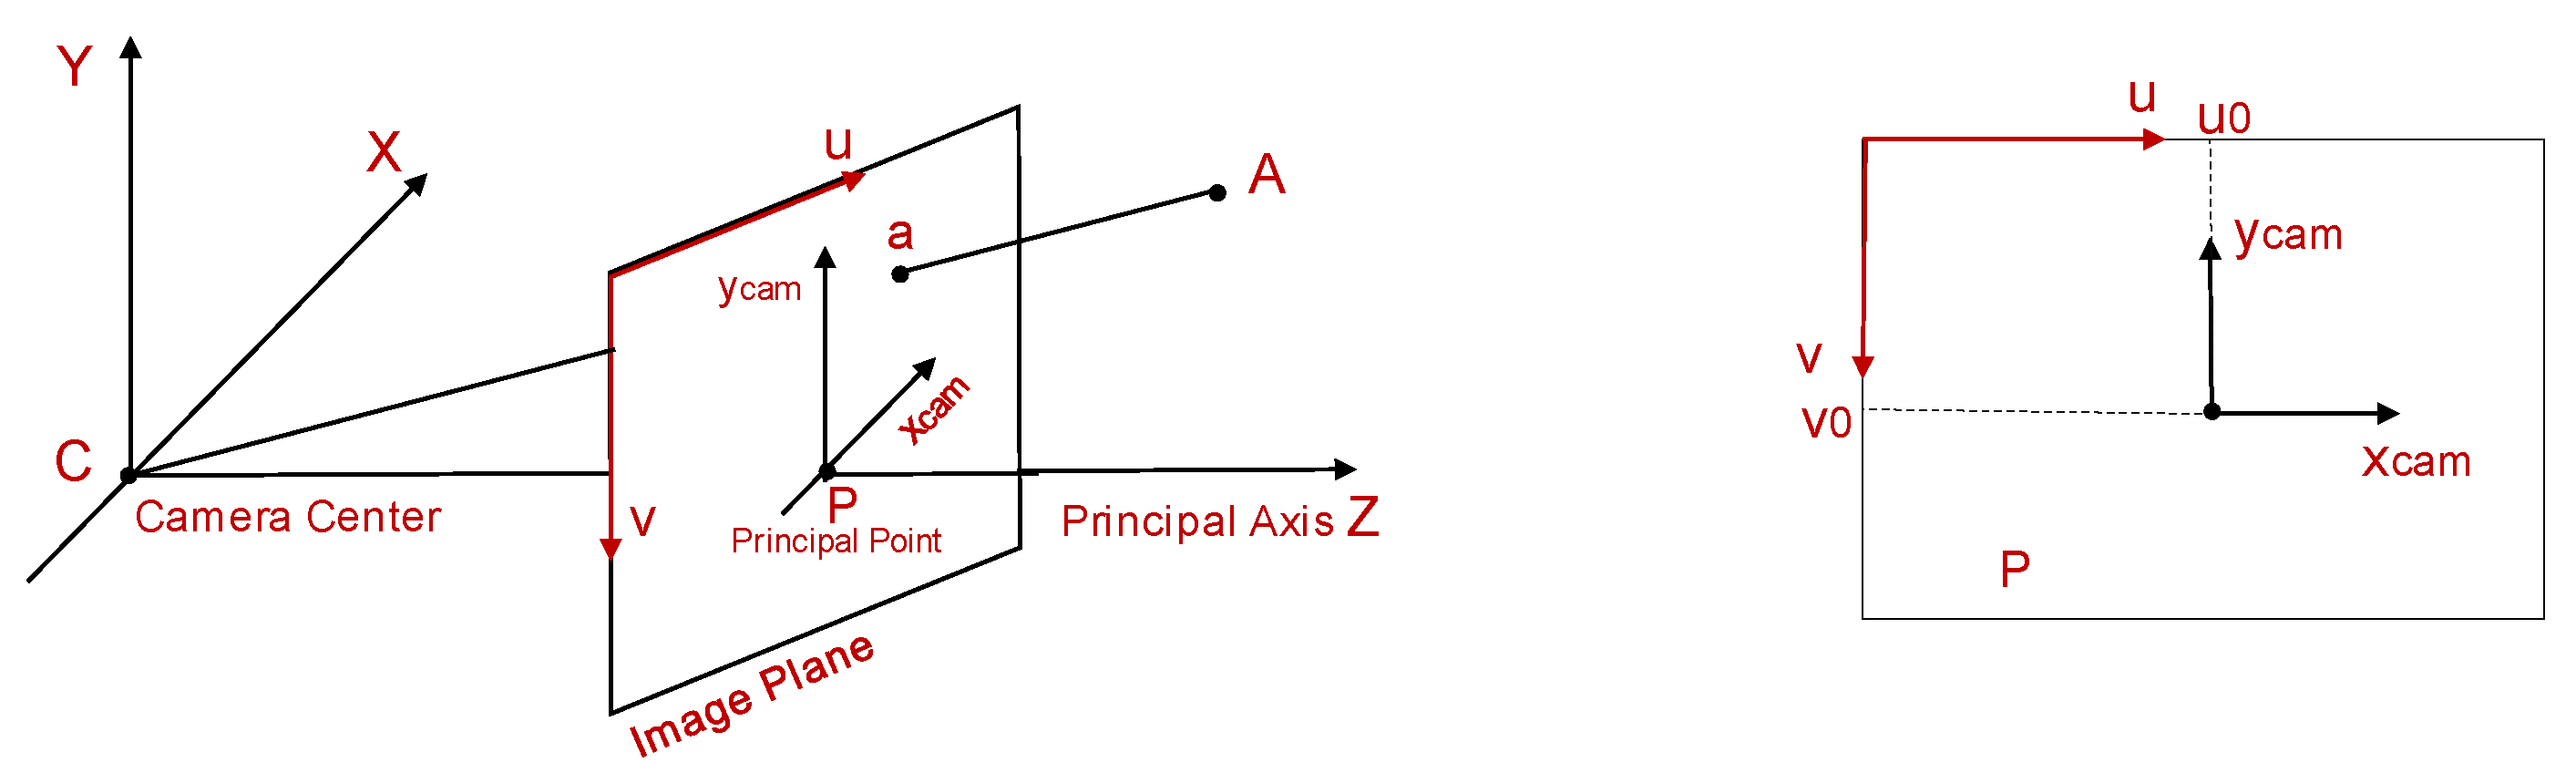
2.3.1. Pinhole Camera Model

The most widely used camera model is the pinhole camera model as Figure 4, which describes the process in an ideal state without the distortion that an object represented by a three-dimensional point (X, Y, Z) in the world coordinate system changes to the camera coordinate system by rigid transformation, and then further projective transforms to the corresponding pixel coordinates (u, v) in the image plane pixel coordinate system. The point with coordinates (X, Y, Z) in the world coordinate system is first projected to the corresponding point (Xc, Yc, Zc) in the camera coordinate system with the optical center as the origin through the rotation transformation described by the rotation matrix R3×3 and the translation transformation described by the offset vector t, which is shown as Formula (3).
X c Y c Z c = R X Y Z + t
Then, the point is projected from the camera coordinate system into the image plane coordinate system with the principal point on the optical axis as origin. The projection transformation can be described by the similar triangle relation expressed in Formula (4).
x = f X c Z c y = f Y c Z c
The image unit of the pixel coordinate system is the pixel point, which is the discrete expression of the image coordinate system adopting the geometric unit of measurement (mm). The pixel located in the image plane coordinate system is transformed to the pixel coordinate system whose origin is at the upper left corner, as shown in Formula (5), where dx and dy are pixel resolution(mm per pixel values) and (u0, v0) is the principal point’s pixel coordinate.
u = x d x + u 0 v = y d y + v 0
To sum up, the perspective projection relationship between a point in the world coordinate system and the pixel coordinate system without distortion is shown as Formula (6) [68]. [R|t] are the external parameters of the camera, fx, fy, s, cx and cy are the internal parameters and s reflects the skew of the image plane. The parameters of the projection model can be solved by selecting multiple ground control points and measuring their world coordinates and pixel coordinates, which is called camera calibration.
u v 1 = 1 Z c 1 d x s u 0 0 1 d y v 0 0 0 1 f 0 0 0 f 0 0 0 1   0 0 0 R t 0 T 1 X Y Z = f x s c x 0 f y c y 0 0 1 1 0 0 0 1 0 0 0 1   0 0 0 R t 0 T 1 X Y Z

2.3.2. Ground-Based Photogrammetric Approaches

The actual water level can be calculated according to the projection model after water line detection. The simplest method is to measure the actual distance between multiple points on a line of the captured image in advance. The elevation of each pixel point on the line can be calculated by linear interpolation, and the water level can be obtained based on the intersection of this line and the detected water line. Such processing oversimplifies the projection relationship between pixel distance and object distance, resulting in potential inaccuracies in the water level measurement.
In order to complete more accurate measurements, the world–pixel coordinate homography must be determined according to multiple ground control points (GCPs) with known world coordinates. Yu and Hann [69] used four points marked at the known positions of a bridge support column to decide the external variables. Gilmore et al. [70] developed a lab software called GaugeCam Remote Image Manager-Educational (GRIME) to measure the water level with an accuracy of ±3 mm under tightly controlled laboratory conditions based on calculating the transfer matrix between pixel and world coordinates using fiducial grid patterns. On this basis, Chapman et al. [71] released the user-friendly and open-source software GRIME2 for reliable field measurements. GRIME2 calibrates the camera using a target background containing eight bow-tie fiducials. Although this calibration scheme is good in terms of the accommodation of variability and accessibility, these benefits are offset by the need to rigidly place the target plane orthogonally to the water surface. In the above research, the optical axis of the camera was strictly perpendicular to the detection target plane without considering the strict geometric modeling of interior and exterior camera geometry, and the image distortion was ignored.
In actual field monitoring, lens distortion, caused by lens processing, and assembly and perspective distortion, caused by the camera’s optical axis tilt, always exist. In addition, strong winds can cause small camera motion, which results in change of the calibration parameters. To complete a stable and precise measurement, it is necessary to correct distortion and adapt to camera motion. Lin et al. [72] obtained the coefficient of the lens distortion and the internal parameters such as the focal length, the location of the principle point in the laboratory prior to installing the camera in the field, acquired the external parameters by solving the collinearity equations which is another representation of the pinhole camera model, and detected camera movement or rotation and adjusted the external parameters by matching the calibration points in sequential images. Similarly, in the research of Kuo and Tai [73], the internal parameters of the camera and its distortion coefficients were obtained in the laboratory for lens distortion correction, the inverse perspective mapping (IPM) rectified method was implemented to rectify the perspective distortion caused by the inclination angle between the camera’s optical axis and water gauge plane, and the normalized cross correlation (NCC) technology was used to adapt to the camera vibration. Azevedo and Bras [74] calculated the camera motion compensation based on template-matching methods.
The smartphones with inbuilt cameras, sensor systems for location, rotation assessment and high-performance processing units have been applied for field water level measurement. Elias et al. [75] developed a photogrammetric approach implemented on smartphone. The camera’s exterior orientation could be determined by a smartphone sensor system, including the global navigation satellite system (GNSS) receiver, accelerometer, gyroscope and magnetometer. The interior orientation was specified by the manufacturer. The algorithm constructed a synthetic 3D image representing the same global and local scene as the real camera-captured imagery. And, the world–pixel correspondence was established by using a feature-matching method for the real and the synthetic images. Eltner et al. [76] employed CNNs for water body segmentation and converted image information into metric water level values by intersecting the derived water surface contour with a 3D model reconstructed using Structure-from-Motion (SfM) photogrammetry.
However, the location of the ground-based camera system always remains fixed, taking into account the image resolution and monitoring accuracy requirements, it is suitable for narrow channel water level monitoring. Although the smartphones are movable, the range of their movement is limited by the operators’ activities. Taking pictures in inaccessible locations may present threat to the photographer, such as the flood and the steep bank.

2.3.3. UAV-Based Photogrammetric Approaches

UAVs have the advantages of flexibility, mobility and teleoperation so that they are suitable for water level measurement in complex field environment (e.g., wide-channel, high-speed flow) and short-term urgent water surface change process measurement (e.g., dammed lake) and other inaccessible locations for ground-based monitoring systems. Ridolfi and Manciola [77] used four GCPs on the upstream face of the dam as reference points for water level calculation by the drone in the Ridracoli reservoir and the mean error was around 0.05 m. Gao et al. [78] provided a UAV offset correction method. In the test carried out at a river section with about 160 m width, the artificial recognition data and UAV detection data had relatively good consistency.
Combined with high-spatial-resolution terrain data obtained using UAV photogrammetry, such as the point clouds, digital elevation models (DEMs) and digital surface models (DSMs), the water surface water level field can be observed so to extend point-basis measurement to area-basis estimation. The terrain data are always restituted by the SfM algorithm. The SfM algorithm has been applied with great success in various environmental applications, effectively reconstructing 3D scenes by autonomously matching corresponding points from multiple viewpoint images [79]. In combination with the appropriate number of GCPs, the ground sample distance (GMP) of the terrain model can reach the centimeter level with elevation error within a few centimeters. The water surface elevation based on the UAV terrain data could be estimated by extracting the elevation of the water–edge interface, the river centerline or the point clouds of the river polygon mask.
Pai et al. [80] identified the water–edge interface and extracted the elevation along the interface at 1.5 cm intervals from the DSM corresponding to an area of about 400 m along the river channel length and about 180 m width. Giulietti et al. [81] used images acquired by a UAV system to reconstruct dense point clouds of the Piave River and then applied the random sample consensus (RANSAC) method to retrieve the river surface plane. The water level could be estimated by the distance between a reference point with a known elevation and the free surface with a 0.98 R2_score. Lin et al. [82] integrated VGI-classified images with UAV-based DSMs using photogrammetry techniques to quantify flood water levels.
Compared with the ground-based observations, the use of UAVs is supposed to be more suitable for those cases which do not require a continuous data acquisition and high-accuracy measurement. Although UAVs do not allow for long-term observation periods, the UAV-based measurement is a valid alternative for scenarios where continuous measurement system cannot be installed due to topography or other factors and an excellent solution for studies of the small rivers overall state over a specific period.

3. Radar-Based Water Level Measurement

3.1. Principle of Radar Level Sensors

Radar-based water level measurement allows determining the range between the radar sensor and water surface by detecting the time delay of the transmitted radio wave and the reflected echo as follows:
R = c t 2
where R is the distance between the radar system and the target, c is the speed of light (3 × 10⁸ m/s), and t is the total time for the radar signal taking the round trip to the target. The water level can then be determined by subtracting the distance between the sensor and the water surface from the known elevation of the radar sensor. Compared with the camera systems, the radars are unaffected by low visibility (e.g., fog, rain, snow, and darkness).
The radar level sensors can be divided into pulsed-wave radar and frequency-modulated continuous wave (FMCW) radar according to the wave form of the transmitted signal.
The basic principle of a pulse radar is to transfer periodic short-duration pulse signals and receive echo signal only during the transmitting gap. The FMCW radar transmits a continuous wave signal that is modulated in frequency over time, and the difference of frequency between the transmitted and received signals is used to calculate the distance to the water surface. The transmitted and received chirp signal sequences are illustrated in Figure 5. The transmitted (Tx) signal is a linear frequency modulated wave, which sweeps across a bandwidth B = (fstop − fstart) within a time period of Tsweep. The received (Rx) signal is the echo of the Tx signal with a time delay of t. As formula (8) shows, the target distance R can be measured by the difference of the Tx and Rx signals, which is known as the intermediate frequency (IF) signal.
R = c f I F T s w e e p 2 B

3.2. Workflow of Radar Level Sensors

3.2.1. Subsubsection

Signal generation and transmission is the basis of radar-based measurement. The signal generator generates radio frequency (RF) signals according to the radar’s operating mode. After being amplified by the power amplifier, the signals are radiated into space by the antenna.
A pulse radar generates and emits short and high-power pulse signals. The theoretical measurement resolution δ of pulse radar is determined by the pulse width τ and the bandwidth B without modulation as follows:
δ = c τ 2 = c 2 B
The smaller the pulse width, the better the measurement resolution. In order to ensure the maximum range, the requirement for the pulse energy will also be increased. But the power of transmitted pulse cannot be increased indefinitely, and usually results in a smaller dynamic range and lower signal-to-noise ratio (SNR) of pulse radars. To address the dilemma between the maximum range and range resolution, the intra-pulse modulation scheme is employed at the transmitter. The commonly used modulation form is linear frequency modulation (LFM), which can enhance the resolution capability for a relatively long pulse width [83].
The signal generation in FMCW (Frequency Modulated Continuous Wave) radar is achieved through various components, including a local oscillator (LO), a voltage-controlled oscillator (VCO) and a mixer. The reference signal generated by the LO has stable and accurate frequency characteristics and is used for mixing with the VCO output signal. The VCO is a key component in FMCW radar systems and is responsible for generating the frequency-modulated continuous wave signal. By applying different voltages, the VCO’s output frequency can be adjusted. In practical applications, the VCO exhibits nonlinearity in the relationship between output frequency and input voltage. The nonlinearity of VCO can indeed affect detection of the IF signals and the accuracy of the measurement. The nonlinear effect can be reduced by adjusting the circuit parameters of VCO, adopting voltages compensation methods and optimizing temperature stability [84].

3.2.2. Signal Sampling

The purpose of sampling is to convert the received RF echo signal into a digital signal. The RF signal exhibits high-frequency and continuous characteristics, rendering it unsuitable for digital processing. For the subsequent signal processing and analysis, the discrete digital sampling of the received signal is necessary. Nyquist’s theorem states that in order to recover the information of a continuous signal from the discrete signal without distortion or aliasing, the sampling frequency fs must be no less than twice the maximum frequency (fmax) of the continuous signal spectrum. In RF signal processing, the inherent high-frequency characteristic of RF signals poses challenges for direct digital sampling, which requires extremely high sampling frequency. The Analogue to Digital Converter (ADC) sampling rate in a pulsed radar can be reduced without bandwidth reduction by adopting Compressed Sampling (CS) [85].
IF sampling is used to reduce the sampling frequency and alleviate the associated system complexities and costs. IF sampling is based on the IF signal, which is a mixed signal comprising the echo signal and the reference signal. For an FMCW radar, the sampling accuracy of the IF signal determines the accuracy of water level measurement. But, signal sampling as a sequence of real numbers results in image frequency, whose spectrum has the same magnitude and symmetrical frequency as the true signal, which may cause the aliasing phenomenon, where the original signal cannot be accurately reconstructed.
To reduce the image frequency, quadrature sampling is a common strategy to separate the signal into in-phase (I) and quadrature (Q) channels, and the amplitude and phase can be extracted [86]. Theoretically, the quadrature sampling filters out the image frequency. Nevertheless, due to the practical limitations of quadrature sampling, there may still be residual image frequency present. However, the remaining image frequency can be mitigated through signal processing techniques employed in the subsequent stage.

3.2.3. Signal Processing

The digital signal acquired from sampling can be processed with filtering, gain adjustment, spectrum analysis, etc., aiming to extract useful information and interpret the signal to obtain water level.
The filtering stage compensates for the noise and distortion of the sampled signal, including the removal of potential noise and the prominence of the target signal. For pulse radar, a common filtering operation is pulse compression. Pulse compression can be achieved by matching filters whose impulse response matches the shape of the radar’s transmitted signal. By convolving the echo signal with the matched filter, the pulse width of the echo signal can be compressed, and the resolution and SNR can be improved. Then, the water level can be calculated by detecting the peak time of the compressed pulse.
FMCW radar usually adopts a finite impulse response (FIR) filter, which is a linear time-invariant filter. By applying a set of window functions to the convolution operation of the input signal, such as rectangular window, Hanning window and Hamming window, etc., the frequency response adjustment and noise suppression are realized. The window function reduces the side flap level at the expense of increasing the target peak width, in other words, it reduces the effect of noise frequencies at the expense of range resolution [87]. Next, the signal after FIR filtering is usually operated by Fast Fourier transform (FFT) to convert the time domain signal into the frequency domain signal and display the energy distribution of the frequency components. By analyzing the FFT results, the peak frequency can be determined as the frequency of IF, and then the water level can be calculated.

4. Discussion

4.1. Advantages

Both approaches using computer vision and radar are propounded as potential solutions to overcome the shortcoming of contact water level sensors. Their non-contact nature gives them the common advantage of avoiding the wear and tear of the devices and degradation of the monitoring performance due to impacts from the water column, siltation, entanglement in debris., etc. They can provide highly accurate monitoring with uncertainties of only a few millimeters under the right conditions [88,89]. In addition to static monitoring on the banks, in recent years, the deployment of a camera or radar sensor on a UAV can provide a safe and flexible option to access hard-to-reach areas and offer a broad overview of water levels across vast regions. In addition to the common advantages mentioned above, each of the two approaches has unique advantages adapted to the requirements of different application scenarios.
The unique advantage of the computer-vision-based approaches is the visible data that allows the user to visually confirm water levels and identify patterns, trends or anomalies of the water body being observed, which can be crucial for certain applications (e.g., flood monitoring, dam and reservoir management or wetland assessment). Beyond water level measurement, the same system can be adapted for other visual monitoring tasks, such as rainfall measurement, water quality observation and damage detection. In terms of cost, computer vision monitoring systems are often less expensive than specialized radar systems. Radar sensors are more robust and less affected by environmental factors such as light conditions, fog or rain, enabling all-weather monitoring, while cameras capture blurred images in harsh environments. The chance of false readings due to visual obstructions, shadows or reflections is virtually eliminated with radar. Radar sensors provide resilient, reliable and consistent water level measurements in diverse conditions.

4.2. Limitations

4.2.1. Limitations of the Computer-Vision-Based Methods

Image quality: Image acquisition is the basis of the application of computer vision methods, and image quality is a key factor, which has an important impact on the stability and accuracy of the algorithms. Image visibility refers to the clarity and recognizability of objects or details in an image, which is affected by factors such as uneven illumination, haze and night time. Poor image visibility, such as reflection, shadow or occlusion of the area of interest, will affect subsequent water line recognition [90]. Resolution represents the smallest spatial interval that can be resolved in an image, and lower resolution can result in lost or blurred water level detail. The resolution decreases with increasing distance, also leading to less distinguishable GCPs in the images. Since photogrammetry is based on the monotropic relation between pixel and world coordinates, resolution is particularly important for the water level recognition of the photogrammetry approach.
Precision of the water line detection: Regardless of the approach used, water line detection is essential for water level elevation estimation. Water line detection based on traditional image processing methods often requires a series of complex processing processes, such as noise removal, gray-scale, image filtering and morphological operation to carry out the difference of spatial distribution of the features designed by people, such as the grayscale and color features. However, the features designed by hand may not be able to fully capture the complex semantic information in an image, which leads to the limited performance of water level estimation. Traditional methods usually only consider the relationship between local pixels, but ignore the global context information of pixels, which may lead to the inaccuracy of detection results, especially in the case of occlusion, complex background or blurred boundaries. Furthermore, because traditional methods rely on predefined rules, they tend to be unstable in the face of illumination changes, scale changes, attitude changes, etc. When migrating an existing model to a new scenario, traditional methods often require re-designing and tweaking, increasing the complexity to development. Deep learning technologies, such as CNNs and attention mechanisms, can automatically learn the feature representation and semantic information of the target region in an image to overcome the above problems and achieve better detection results. However, deep learning models usually require massive amounts of labeled training data to achieve good performance, and the construction of datasets is a challenging task. Existing studies constructed datasets specific to the study area, often comprising just a few thousand images. In contrast, datasets intended for broader tasks, such as COCO [91] and ADE20K [92], encompass over 15,000 images. Although the detection accuracy is good, the generalization of areas with different bank materials and flow conditions is poor, which limits the promotion of the algorithm.
Accuracy of the water level elevation calculation: calculating the water level elevation based on the extracted water line combined with the gauge information or pixel-world coordinate homography is a key step. The most important factor affecting the water gauge information identification method is the visibility of the gauge. When the surface of the gauge is reflective, obscured, distorted or broken, there is often a certain degree of information loss, which affects the extraction of useful information. Although photogrammetry approach reduces the requirement for gauge visibility, the complex calibration process and camera motion correction become the main factors limiting its application in different areas. In order to solve the collinear equations, it is necessary to deal with multiple calibration points in the field. This process has to be repeated for each application area, which increases the complexity of implementation. The motion of the camera will cause parallax and distortion, which will affect the accuracy of water level measurement. In order to solve this problem, camera motion correction is necessary. This process requires accurate motion tracking and correlation calculations, increasing the demand for computing resources.
The measurement of water level elevation field based on UAV orthophotos depends on the precision of DSMs. Although the elevation construction accuracy of DSMs on solid surfaces can reach the centimeter level, the water surface in terrain model cannot be represented correctly because of the lack of stable distinguishable key points for the SfM algorithm due to transparency, flow and aquatic vegetation [93]. In general, the DSMs created by the SfM algorithm represent the elevation below the actual water surface. Although the water level estimation according to the boundary between water surface and shore, known as the water line, can avoid the influence of water surface construction error in a terrain model, this method is only applicable when the slope is smooth and there is no vegetation shielding where the boundary line is easy to detect.

4.2.2. Limitations of the Radar-Based Methods

Limitations of the radar system: Radar sensors are usually positioned on nearby structures, such as bridges and poles. However, measurements are susceptible to significant errors caused by the vibrations transmitted from these supporting structures. Secondly, radar sensors should ideally be installed perpendicular to the water surface so as to minimize signal attenuation and distortion. Offsetting the installation angle may result in an uneven projection of the radar beam on the water surface, and signal reflection and reception may be affected, thus increasing measurement uncertainty. In addition, the relatively wide beamwidth restricts the measurement range. Finally, due to the inherent nature of FM components, the nonlinearity of FM signals will interfere with the detection of IF signals. Although precision components such as bias phase-locked loops or correction algorithms can be used to deal with nonlinearities, the cost of the system and complexity of the algorithm are only suitable for micromachining applications rather than field hydrological monitoring. Upgrades to the hardware configuration (i.e., transmission power, antenna design) based on the desired measurement resolution and range are required.
Problems of the radar signal processing methods: When FFT is performed on a signal with finite time domain, it is equivalent to the periodic extension of the signal, thus forming a periodic sidelobe in the spectrum [94]. This is manifested by the appearance of additional components in the spectrum, making some frequency energy in the original signal appear offset or blurred in the spectrum. The window function can reduce the sidelobe flap level, but at the cost of resolution reduction. Spectrum refinement methods such as zero padding, ZoomFFT and chirp z transform (CZT) can be used in conjunction with FFT at the expense of computational complexity.

4.3. Future Works

The following works are worth considering to improve the performance of computer-vision-based methods and radar sensors, broaden their applications and provide more reliable and efficient solutions for water level measurement.
Construction of water surface image dataset: The establishment of a large-scale water surface image dataset covering different scenes, lighting conditions and water characteristics can provide diverse data paradigms. The dataset may include gauges and other reference objects for scaling verification. Deep learning models can learn the feature expression of the water surface scene from this dataset and improve the generalization of different environments. The process of dataset construction composed of image collection and annotation demands significant effort and resources. Citizen science involves engaging the community in a collaborative effort to track, monitor and address common community issues. There are already a number of citizen science projects that use social media and mobile applications for hydrological data collection [95,96]. Incorporating citizen science into dataset construction can enrich the diversity and scalability, and achieves comprehensive data coverage cost-effectively. Another promising avenue is the use of synthetic or simulated data, wherein images are computer-generated or adapted, providing a controlled environment to create diverse scenarios and conditions without the need for physical data collection. Unsupervised domain adaptation and few-shot learning technique are also directions to be considered.
Fast calibration algorithms: Traditional camera calibration processes usually require specialized equipment and complex mathematical models. To simplify the calibration process and improve efficiency, the application of fast calibration methods can be explored. These methods utilize specific scene structures or image features matching to infer the camera’s intrinsic and extrinsic parameters, thereby establishing the relationship between pixels and real-world physical coordinates. This approach can reduce the complexity of calibration and equipment requirements, enhancing the practical usability of the system.
Multi-sensor fusion: The multi-sensor fusion method has obvious application advantages in water level measurement, which can compensate for the limitations of single monitoring platforms, improve their accuracy, expand their monitoring range, realize real-time monitoring and rapid response, and obtain diversified and complete data. Radar and vision sensors have different characteristics in water level measurement. Radar can measure the position of water surface by transmitting and receiving radio waves, and is not restricted by visibility. The computer vision method can extract water surface features by processing images which have high-spatial-resolution and rich visual information, and are more sensitive to light condition. By integrating information from radar and vision sensors, their complementarity can be fully exploited to improve the accuracy and reliability of water level measurement and surface recognition. Similarly, UAVs and ground-based cameras can observe target areas from different perspectives, providing more comprehensive and multi-angle information. By fusing these multi-view images, more accurate 3D reconstruction and water level estimation can be obtained. The UAVs can fly over the target areas and are flexible enough to cover the entire water body. Ground-based cameras, on the other hand, can provide a closer view of the target and more detailed image details in a relatively stable shooting environment. By fusing drone- and ground-based camera data, extensive area coverage and high-resolution image information can be obtained simultaneously.

5. Conclusions

The non-contact water level measurement techniques based on computer vision and radar technology have advanced significantly. Due to the progress of deep learning, photogrammetry technique and spectrum analysis methods, the accuracy of visual-based and radar-based methods can meet the monitoring requirements in some scenarios, and significantly improve the spatial and temporal density of water level data acquisition, showing great application potential in environmental monitoring and disaster management.
The presented systematic review highlights the principles and challenges of the computer vision methods and radars in the field of water level measurement. The use of computer vision techniques has evolved from traditional techniques towards deep learning based approaches; however, the availability of large-scale benchmark water surface datasets has been consistently found to be lacking. At the same time, photogrammetry methods have been further studied in recent years due to their high resolution, but the issues of complexity, portability of calibration and 3D reconstruction remain to be solved. The conflict of the resolution, accuracy and computational complexity of radar equipment spectral analysis algorithms also limits its application. Multi-view and multi-mode sensor fusion may be the ways in which non-contact water level measurement can be improved in the future.

Author Contributions

Conceptualization, H.C. and Z.W.; methodology, H.C. and Z.W.; formal analysis, H.C. and Z.W.; writing—original draft preparation, Z.W. and H.C.; writing—review and editing, Z.W., H.C., Y.H., K.H. and K.Y.; visualization, Z.W. and H.C.; supervision, H.C. All authors have read and agreed to the published version of the manuscript.

Funding

This research was funded by the National Key Research and Development Program of China, grant number 2022YFC3002701.

Data Availability Statement

No new data were created or analyzed in this study. Data sharing is not applicable to this article.

Conflicts of Interest

The authors declare no conflict of interest.

References

  1. Lin, F.; Yu, Z.; Jin, Q.; You, A. Semantic Segmentation and Scale Recognition–Based Water-Level Monitoring Algorithm. J. Coast. Res. 2020, 105, 185–189. [Google Scholar] [CrossRef]
  2. Lo, S.-W.; Wu, J.-H.; Lin, F.-P.; Hsu, C.-H. Visual Sensing for Urban Flood Monitoring. Sensors 2015, 15, 20006–20029. [Google Scholar] [CrossRef]
  3. Iqbal, U.; Perez, P.; Li, W.; Barthelemy, J. How computer vision can facilitate flood management: A systematic review. Int. J. Disaster Risk Reduct. 2021, 53, 102030. [Google Scholar] [CrossRef]
  4. Zheng, G.; Zong, H. High accuracy surface perceiving water level gauge with self calibration. In Proceedings of the 2009 International Conference on Mechatronics and Automation, Changchun, China, 9–12 August 2009; pp. 3680–3686. [Google Scholar] [CrossRef]
  5. Sweet, H.; Rosenthal, G.; Atwood, D. Water Level Monitoring—Achievable Accuracy and Precision. In Ground Water and Vadose Zone Monitoring; Nielsen, D., Johnson, A., Eds.; ASTM International: West Conshohocken, PA, USA, 1990; pp. 178–192. [Google Scholar] [CrossRef]
  6. Segovia-Cardozo, D.A.; Rodríguez-Sinobas, L.; Canales-Ide, F.; Zubelzu, S. Design and Field Implementation of a Low-Cost, Open-Hardware Platform for Hydrological Monitoring. Water 2021, 13, 3099. [Google Scholar] [CrossRef]
  7. Fulford, J.M.; Ester, L.W.; Heaton, J.W.; Committee on Irrigation and Drainage, P.U.S. Accuracy of Radar Water Level Measurements. In Proceedings of the USCID Fourth International Conference, Sacramento, CA, USA, 3–6 October 2007; Available online: https://mountainscholar.org/handle/10217/208297 (accessed on 8 July 2023).
  8. Pereira, T.S.R.; De Carvalho, T.P.; Mendes, T.A.; Formiga, K.T.M. Evaluation of Water Level in Flowing Channels Using Ultrasonic Sensors. Sustainability 2022, 14, 5512. [Google Scholar] [CrossRef]
  9. Alsdorf, D.E.; Rodríguez, E.; Lettenmaier, D.P. Measuring surface water from space. Rev. Geophys. 2007, 45, RG2002. [Google Scholar] [CrossRef]
  10. Brakenridge, G.R.; Nghiem, S.V.; Anderson, E.; Chien, S. Space-based measurement of river runoff. Eos Trans. Am. Geophys. Union 2005, 86, 185. [Google Scholar] [CrossRef]
  11. Zhang, Z.; Zhou, Y.; Liu, H.; Zhang, L.; Wang, H. Visual Measurement of Water Level under Complex Illumination Conditions. Sensors 2019, 19, 4141. [Google Scholar] [CrossRef]
  12. Scherer, D.; Schwatke, C.; Dettmering, D.; Seitz, F. ICESat-2 Based River Surface Slope and Its Impact on Water Level Time Series From Satellite Altimetry. Water Resour. Res. 2022, 58, e2022WR032842. [Google Scholar] [CrossRef]
  13. Kuo, L.-C.; Tai, C.-C. Automatic water-level measurement system for confined-space applications. Rev. Sci. Instrum. 2021, 92, 085001. [Google Scholar] [CrossRef]
  14. Royem, A.A.; Mui, C.K.; Fuka, D.R.; Walter, M.T.; Note, T. Affordable, Accurate Stream Stage Monitoring System. Trans. ASABE 2012, 55, 2237–2242. [Google Scholar] [CrossRef]
  15. Etter, S.; Strobl, B.; Meerveld, I.; Seibert, J. Quality and timing of crowd-based water level class observations. Hydrol. Process. 2020, 34, 4365–4378. [Google Scholar] [CrossRef]
  16. Iqbal, U.; Riaz, M.Z.B.; Barthelemy, J.; Perez, P.; Idrees, M.B. The last two decades of computer vision technologies in water resource management: A bibliometric analysis. Water Environ. J. 2023, 37, 373–389. [Google Scholar] [CrossRef]
  17. Tauro, F.; Olivieri, G.; Petroselli, A.; Porfiri, M.; Grimaldi, S. Flow monitoring with a camera: A case study on a flood event in the Tiber River. Env. Monit. Assess. 2016, 188, 118. [Google Scholar] [CrossRef] [PubMed]
  18. Jiang, S.; Zheng, Y.; Babovic, V.; Tian, Y.; Han, F. A computer vision-based approach to fusing spatiotemporal data for hydrological modeling. J. Hydrol. 2018, 567, 25–40. [Google Scholar] [CrossRef]
  19. Liu, X.; Sahli, H.; Meng, Y.; Huang, Q.; Lin, L. Flood Inundation Mapping from Optical Satellite Images Using Spatiotemporal Context Learning and Modest AdaBoost. Remote Sens. 2017, 9, 617. [Google Scholar] [CrossRef]
  20. Allamano, P.; Croci, A.; Laio, F. Toward the camera rain gauge. Water Resour. Res. 2015, 51, 1744–1757. [Google Scholar] [CrossRef]
  21. Jiang, S.; Babovic, V.; Zheng, Y.; Xiong, J. Advancing Opportunistic Sensing in Hydrology: A Novel Approach to Measuring Rainfall With Ordinary Surveillance Cameras. Water Resour. Res. 2019, 55, 3004–3027. [Google Scholar] [CrossRef]
  22. Yan, K.; Chen, H.; Hu, L.; Huang, K.; Huang, Y.; Wang, Z.; Liu, B.; Wang, J.; Guo, S. A review of video-based rainfall measurement methods. WIREs Water 2023, e1678. [Google Scholar] [CrossRef]
  23. Kuswidiyanto, L.W.; Nugroho, A.P.; Jati, A.W.; Wismoyo, G.W.; Murtiningrum; Arif, S.S. Automatic water level monitoring system based on computer vision technology for supporting the irrigation modernization. IOP Conf. Ser. Earth Environ. Sci. 2021, 686, 012055. [Google Scholar] [CrossRef]
  24. Kim, K.J.; Park, K.S.; Park, K.S.; Choi, S.K. Development of Automatic Water Level Measuring System Using Stereo Images. kogsis 2018, 26, 77–86. [Google Scholar] [CrossRef]
  25. Tauro, F. Particle tracers and image analysis for surface flow observations. WIREs Water 2016, 3, 25–39. [Google Scholar] [CrossRef]
  26. Perks, M.T.; Sasso, S.F.D.; Hauet, A.; Jamieson, E.; Le Coz, J.; Pearce, S.; Peña-Haro, S.; Pizarro, A.; Strelnikova, D.; Tauro, F.; et al. Towards harmonisation of image velocimetry techniques for river surface velocity observations. Earth Syst. Sci. Data 2020, 12, 1545–1559. [Google Scholar] [CrossRef]
  27. Huang, K.; Chen, H.; Xiang, T.; Lin, Y.; Liu, B.; Wang, J.; Liu, D.; Xu, C.-Y. A photogrammetry-based variational optimization method for river surface velocity measurement. J. Hydrol. 2022, 605, 127240. [Google Scholar] [CrossRef]
  28. Pan, J.; Yin, Y.; Xiong, J.; Luo, W.; Gui, G.; Sari, H. Deep Learning-Based Unmanned Surveillance Systems for Observing Water Levels. IEEE Access 2018, 6, 73561–73571. [Google Scholar] [CrossRef]
  29. Zhang, Z.; Zhou, Y.; Liu, H.; Gao, H. In-situ water level measurement using NIR-imaging video camera. Flow Meas. Instrum. 2019, 67, 95–106. [Google Scholar] [CrossRef]
  30. Birgand, F.; Chapman, K.; Hazra, A.; Gilmore, T.; Etheridge, R.; Staicu, A.-M. Field performance of the GaugeCam image-based water level measurement system. PLoS Water 2022, 1, e0000032. [Google Scholar] [CrossRef]
  31. Boon, J.D.; Heitsenrether, R.M.; Hensley, W.M. Multi-sensor evaluation of microwave water level measurement error. In Proceedings of the 2012 Oceans Hampton Roads, Hampton Roads, VA, USA, 14–19 October 2012; pp. 1–8. [Google Scholar] [CrossRef]
  32. Míguez, B.M.; Le Roy, R.; Wöppelmann, G. The Use of Radar Tide Gauges to Measure Variations in Sea Level along the French Coast. J. Coast. Res. 2008, 4, 61–68. [Google Scholar] [CrossRef]
  33. Stateczny, A.; Lubczonek, J. Radar sensors implementation in river information services in Poland. In Proceedings of the 2014 15th International Radar Symposium (IRS), Gdansk, Poland, 16–8 June 2014; pp. 1–5. [Google Scholar] [CrossRef]
  34. Cui, J.; Bachmayer, R.; deYoung, B.; Huang, W. Ocean Wave Measurement Using Short-Range K-Band Narrow Beam Continuous Wave Radar. Remote Sens. 2018, 10, 1242. [Google Scholar] [CrossRef]
  35. Fiorentino, L.A.; Heitsenrether, R.; Krug, W. Wave Measurements From Radar Tide Gauges. Front. Mar. Sci. 2019, 6, 586. [Google Scholar] [CrossRef]
  36. Ma, M.; Li, Y.; Jiang, X.; Huang, X. Hydrological Information Measurement Using an MM-Wave FMCW Radar. In Proceedings of the 2020 International Conference on Microwave and Millimeter Wave Technology (ICMMT), Shanghai, China, 20–23 September 2020; pp. 1–3. [Google Scholar] [CrossRef]
  37. Park, J.; Heitsenrether, R.; Sweet, W. Water Level and Wave Height Estimates at NOAA Tide Stations from Acoustic and Microwave Sensors. J. Atmos. Ocean. Technol. 2014, 31, 2294–2308. [Google Scholar] [CrossRef]
  38. Tauro, F.; Selker, J.; van de Giesen, N.; Abrate, T.; Uijlenhoet, R.; Porfiri, M.; Manfreda, S.; Caylor, K.; Moramarco, T.; Benveniste, J.; et al. Measurements and Observations in the XXI century (MOXXI): Innovation and multi-disciplinarity to sense the hydrological cycle. Hydrol. Sci. J. 2018, 63, 169–196. [Google Scholar] [CrossRef]
  39. Vélez-Nicolás, M.; García-López, S.; Barbero, L.; Ruiz-Ortiz, V.; Sánchez-Bellón, Á. Applications of Unmanned Aerial Systems (UASs) in Hydrology: A Review. Remote Sens. 2021, 13, 1359. [Google Scholar] [CrossRef]
  40. Altenau, E.H.; Pavelsky, T.M.; Moller, D.; Lion, C.; Pitcher, L.H.; Allen, G.H.; Bates, P.D.; Calmant, S.; Durand, M.; Smith, L.C. AirSWOT measurements of river water surface elevation and slope: Tanana River, AK. Geophys. Res. Lett. 2017, 44, 181–189. [Google Scholar] [CrossRef]
  41. Bandini, F.; Jakobsen, J.; Olesen, D.; Reyna-Gutierrez, J.A.; Bauer-Gottwein, P. Measuring water level in rivers and lakes from lightweight Unmanned Aerial Vehicles. J. Hydrol. 2017, 548, 237–250. [Google Scholar] [CrossRef]
  42. Jiang, L.; Bandini, F.; Smith, O.; Jensen, I.K.; Bauer-Gottwein, P. The Value of Distributed High-Resolution UAV-Borne Observations of Water Surface Elevation for River Management and Hydrodynamic Modeling. Remote Sens. 2020, 12, 1171. [Google Scholar] [CrossRef]
  43. Hies, T. Enhanced water-level detection by image processing. In Proceedings of the 10th International Conference on Hydroinformatics, Hamburg, Germany, 14–18 July 2012. [Google Scholar]
  44. Udomsiri, S.; Iwahashi, M.; Muramatsu, S. Functionally Layered Video Coding for Water Level Monitoring. IEICE Trans. Fundam. Electron. Commun. Comput. Sci. 2008, E91-A, 1006–1014. [Google Scholar] [CrossRef]
  45. Shin, I.; Kim, J.; Lee, S.-G. Development of an internet-based water-level monitoring and measuring system using CCD camera. In Proceedings of the International Workshop and Conference on Photonics and Nanotechnology, Pattaya, Thailand, 16–18 December 2007; p. 67944. [Google Scholar] [CrossRef]
  46. Noto, S.; Tauro, F.; Petroselli, A.; Apollonio, C.; Botter, G.; Grimaldi, S. Low-cost stage-camera system for continuous water-level monitoring in ephemeral streams. Hydrol. Sci. J. 2022, 67, 1439–1448. [Google Scholar] [CrossRef]
  47. Lin, F.; Chang, W.-Y.; Lee, L.-C.; Hsiao, H.-T.; Tsai, W.-F.; Lai, J.-S. Applications of Image Recognition for Real-Time Water Level and Surface Velocity. In Proceedings of the 2013 IEEE International Symposium on Multimedia, Anaheim, CA, USA, 9–11 December 2013; pp. 259–262. [Google Scholar] [CrossRef]
  48. Zhang, C.; Zhu, Y.; Huang, M.; Li, C. Development of Automatic Water Level Monitor for Reservoir Based on Image Recognition. J. Phys. Conf. Ser. 2019, 1176, 052032. [Google Scholar] [CrossRef]
  49. Xu, Z.; Feng, J.; Zhang, Z.; Duan, C. Water Level Estimation Based on Image of Staff Gauge in Smart City. In Proceedings of the 2018 IEEE SmartWorld Ubiquitous Intelligence & Computing, Advanced & Trusted Computing, Scalable Computing & Communications, Cloud & Big Data Computing, Internet of People and Smart City Innovation (SmartWorld/SCALCOM/UIC/ATC/CBDCom/IOP/SCI), Guangzhou, China, 8–12 October 2018; pp. 1341–1345. [Google Scholar] [CrossRef]
  50. Chen, G.; Bai, K.; Lin, Z.; Liao, X.; Liu, S.; Lin, Z.; Zhang, Q.; Jia, X. Method on water level ruler reading recognition based on image processing. Signal Image Video Process. 2021, 15, 33–41. [Google Scholar] [CrossRef]
  51. Cai, Z.; Sun, L.; An, B.; Zhong, X.; Yang, W.; Wang, Z.; Zhou, Y.; Zhan, F.; Wang, X. Automatic Monitoring Alarm Method of Dammed Lake Based on Hybrid Segmentation Algorithm. Sensors 2023, 23, 4714. [Google Scholar] [CrossRef] [PubMed]
  52. Park, S.; Lee, N.; Han, Y.; Hahn, H. The Water Level Detection Algorithm Using The Accumulated Histogram With Band Pass Filter. World Acad. Sci. Eng. Technol. Int. J. Comput. Inf. Eng. 2009, 3, 2151–2155. [Google Scholar] [CrossRef]
  53. Kim, J.; Han, Y.; Hahn, H. Embedded implementation of image-based water-level measurement system. IET Comput. Vis. 2011, 5, 125. [Google Scholar] [CrossRef]
  54. Pan, J.; Fan, Y.; Dong, H.; Fan, S.; Xiong, J.; Gui, G. Image-Based Detecting the Level of Water Using Dictionary Learning. In Communications Signal Processing, and Systems; Liang, Q., Liu, X., Na, Z., Wang, W., Mu, J., Zhang, B., Eds.; Springer: Singapore, 2020; Volume 516, pp. 20–27. [Google Scholar] [CrossRef]
  55. Muhammad, K.; Ahmad, J.; Baik, S.W. Early fire detection using convolutional neural networks during surveillance for effective disaster management. Neurocomputing 2018, 288, 30–42. [Google Scholar] [CrossRef]
  56. Bai, G.; Hou, J.; Zhang, Y.; Li, B.; Han, H.; Wang, T.; Hinkelmann, R.; Zhang, D.; Guo, L. An intelligent water level monitoring method based on SSD algorithm. Measurement 2021, 185, 110047. [Google Scholar] [CrossRef]
  57. Liang, Y.; Jafari, N.; Luo, X.; Chen, Q.; Cao, Y.; Li, X. WaterNet: An adaptive matching pipeline for segmenting water with volatile appearance. Comp. Vis. Media 2020, 6, 65–78. [Google Scholar] [CrossRef]
  58. Jafari, N.H.; Li, X.; Chen, Q.; Le, C.-Y.; Betzer, L.P.; Liang, Y. Real-time water level monitoring using live cameras and computer vision techniques. Comput. Geosci. 2021, 147, 104642. [Google Scholar] [CrossRef]
  59. Xie, Z.; Jin, J.; Wang, J.; Zhang, R.; Li, S. Application of Deep Learning Techniques in Water Level Measurement: Combining Improved SegFormer-UNet Model with Virtual Water Gauge. Appl. Sci. 2023, 13, 5614. [Google Scholar] [CrossRef]
  60. Vandaele, R.; Dance, S.L.; Ojha, V. Deep learning for automated river-level monitoring through river-camera images: An approach based on water segmentation and transfer learning. Hydrol. Earth Syst. Sci. 2021, 25, 4435–4453. [Google Scholar] [CrossRef]
  61. Zhang, D.; Tong, J. Robust water level measurement method based on computer vision. J. Hydrol. 2023, 620, 129456. [Google Scholar] [CrossRef]
  62. Bruinink, M.; Chandarr, A.; Rudinac, M.; van Overloop, P.-J.; Jonker, P. Portable, automatic water level estimation using mobile phone cameras’. In Proceedings of the 2015 14th IAPR International Conference on Machine Vision Applications (MVA), Tokyo, Japan, 18–22 May 2015; pp. 426–429. [Google Scholar] [CrossRef]
  63. Guo, S.; Zhang, Y.; Liu, Y. A Water-Level Measurement Method Using Sparse Representation. Aut. Control Comp. Sci. 2020, 54, 302–312. [Google Scholar] [CrossRef]
  64. Qiao, G.; Yang, M.; Wang, H. A Water Level Measurement Approach Based on YOLOv5s. Sensors 2022, 22, 3714. [Google Scholar] [CrossRef] [PubMed]
  65. Chen, C.; Fu, R.; Ai, X.; Huang, C.; Cong, L.; Li, X.; Jiang, J.; Pei, Q. An Integrated Method for River Water Level Recognition from Surveillance Images Using Convolution Neural Networks. Remote Sens. 2022, 14, 6023. [Google Scholar] [CrossRef]
  66. Qiu, R.; Cai, Z.; Chang, Z.; Liu, S.; Tu, G. A two-stage image process for water level recognition via dual-attention CornerNet and CTransformer. Vis. Comput. 2022, 39, 2933–2952. [Google Scholar] [CrossRef]
  67. De, O.G.R.; Nascimento, D.V.D.; Filho, A.R.G.; Ribeiro, F.D.S.L.; de Carvalho, R.V.; Coelho, C.J. Image-Based River Water Level Estimation for Redundancy Information Using Deep Neural Network. Energies 2020, 13, 6706. [Google Scholar] [CrossRef]
  68. Sturm, P. Pinhole Camera Model. In Computer Vision; Ikeuchi, K., Ed.; Springer: Boston, MA, USA, 2014; pp. 610–613. [Google Scholar] [CrossRef]
  69. Yu, J.; Hahn, H. Remote Detection and Monitoring of a Water Level Using Narrow Band Channel. J. Inf. Sci. Eng. 2010, 26, 71–82. [Google Scholar]
  70. Gilmore, T.E.; Birgand, F.; Chapman, K.W. Source and magnitude of error in an inexpensive image-based water level measurement system. J. Hydrol. 2013, 496, 178–186. [Google Scholar] [CrossRef]
  71. Chapman, K.W.; Gilmore, T.E.; Chapman, C.D.; Birgand, F.; Mittelstet, A.R.; Harner, M.J.; Mehrubeoglu, M.; Stranzl, J.E. Technical Note: Open-Source Software for Water-Level Measurement in Images With a Calibration Target. Water Resour. Res. 2022, 58, e2022WR033203. [Google Scholar] [CrossRef]
  72. Lin, Y.-T.; Lin, Y.-C.; Han, J.-Y. Automatic water-level detection using single-camera images with varied poses. Measurement 2018, 127, 167–174. [Google Scholar] [CrossRef]
  73. Kuo, L.-C.; Tai, C.-C. Robust Image-Based Water-Level Estimation Using Single-Camera Monitoring. IEEE Trans. Instrum. Meas. 2022, 71, 1–11. [Google Scholar] [CrossRef]
  74. Azevedo, J.A.; Brás, J.A. Measurement of Water Level in Urban Streams under Bad Weather Conditions. Sensors 2021, 21, 7157. [Google Scholar] [CrossRef] [PubMed]
  75. Elias, M.; Kehl, C.; Schneider, D. Photogrammetric water level determination using smartphone technology. Photogram. Rec. 2019, 34, 198–223. [Google Scholar] [CrossRef]
  76. Eltner, A.; Bressan, P.O.; Akiyama, T.; Gonçalves, W.N.; Junior, J.M. Using Deep Learning for Automatic Water Stage Measurements. Water Resour. Res. 2021, 57, e2020WR027608. [Google Scholar] [CrossRef]
  77. Ridolfi, E.; Manciola, P. Water Level Measurements from Drones: A Pilot Case Study at a Dam Site. Water 2018, 10, 297. [Google Scholar] [CrossRef]
  78. Gao, A.; Wu, S.; Wang, F.; Wu, X.; Xu, P.; Yu, L.; Zhu, S. A Newly Developed Unmanned Aerial Vehicle (UAV) Imagery Based Technology for Field Measurement of Water Level. Water 2019, 11, 124. [Google Scholar] [CrossRef]
  79. Xu, Z.; Wu, L.; Shen, Y.; Li, F.; Wang, Q.; Wang, R. Tridimensional Reconstruction Applied to Cultural Heritage with the Use of Camera-Equipped UAV and Terrestrial Laser Scanner. Remote Sens. 2014, 6, 10413–10434. [Google Scholar] [CrossRef]
  80. Pai, H.; Malenda, H.F.; Briggs, M.A.; Singha, K.; González-Pinzón, R.; Gooseff, M.N.; Tyler, S.W. Potential for Small Unmanned Aircraft Systems Applications for Identifying Groundwater-Surface Water Exchange in a Meandering River Reach. Geophys. Res. Lett. 2017, 44, 11868–11877. [Google Scholar] [CrossRef]
  81. Giulietti, N.; Allevi, G.; Castellini, P.; Garinei, A.; Martarelli, M. Rivers’ Water Level Assessment Using UAV Photogrammetry and RANSAC Method and the Analysis of Sensitivity to Uncertainty Sources. Sensors 2022, 22, 5319. [Google Scholar] [CrossRef]
  82. Lin, Y.-T.; Yang, M.-D.; Han, J.-Y.; Su, Y.-F.; Jang, J.-H. Quantifying Flood Water Levels Using Image-Based Volunteered Geographic Information. Remote Sens. 2020, 12, 706. [Google Scholar] [CrossRef]
  83. Nowak, M.J.; Zhang, Z.; LoMonte, L.; Wicks, M.; Wu, Z. Mixed-modulated linear frequency modulated radar-communications. IET Radar Sonar Navig. 2017, 11, 313–320. [Google Scholar] [CrossRef]
  84. Brennan, P.V.; Huang, Y.; Ash, M.; Chetty, K. Determination of Sweep Linearity Requirements in FMCW Radar Systems Based on Simple Voltage-Controlled Oscillator Sources. IEEE Trans. Aerosp. Electron. Syst. 2011, 47, 1594–1604. [Google Scholar] [CrossRef]
  85. Smith, G.E.; Diethe, T.; Hussain, Z.; Shawe-Taylor, J.; Hardoon, D.R. Compressed Sampling for pulse Doppler radar. In Proceedings of the 2010 IEEE Radar Conference, Washington DC, USA, 10–14 May 2010; pp. 887–892. [Google Scholar] [CrossRef]
  86. Tokieda, Y.; Sugawara, H.; Niimura, S.; Fujise, T. High Precision Waterlevel Gauge with an FMCW Radar Under Limited Bandwidth. In Proceedings of the European Radar Conference 2005. EURAD 2005, Paris, France, 6–7 October 2005; pp. 355–358. [Google Scholar] [CrossRef]
  87. Piotrowsky, L.; Jaeschke, T.; Kueppers, S.; Siska, J.; Pohl, N. Enabling High Accuracy Distance Measurements With FMCW Radar Sensors. IEEE Trans. Microw. Theory Technol. 2019, 67, 5360–5371. [Google Scholar] [CrossRef]
  88. Guan, S.; Bridge, J.A.; Davis, J.R.; Li, C. Compact Continuous Wave Radar for Water Level Monitoring. J. Atmos. Ocean. Technol. 2022, 39, 1245–1257. [Google Scholar] [CrossRef]
  89. Eltner, A.; Elias, M.; Sardemann, H.; Spieler, D. Automatic Image-Based Water Stage Measurement for Long-Term Observations in Ungauged Catchments. Water Resour. Res. 2018, 54, 10–362. [Google Scholar] [CrossRef]
  90. Liu, W.-C.; Chung, C.-K.; Huang, W.-C. Image-based recognition and processing system for monitoring water levels in an irrigation and drainage channel. Paddy Water Environ. 2023, 21, 417–431. [Google Scholar] [CrossRef]
  91. Lin, T.-Y.; Maire, M.; Belongie, S.; Bourdev, L.; Girshick, R.; Hays, J.; Perona, P.; Zitnick, C.L.; Dollár, P. Microsoft COCO: Common Objects in Context. In Computer Vision—ECCV 2014; Lecture Notes in Computer, Science; Fleet, D., Pajdla, T., Schiele, B., Tuytelaars, T., Eds.; Springer International Publishing: Cham, Switzerland, 2014; Volume 8693, pp. 740–755. [Google Scholar] [CrossRef]
  92. Zhou, B.; Zhao, H.; Puig, X.; Xiao, T.; Fidler, S.; Barriuso, A.; Torralba, A. Semantic Understanding of Scenes Through the ADE20K Dataset. Int. J. Comput. Vis. 2019, 127, 302–321. [Google Scholar] [CrossRef]
  93. Bandini, F.; Sunding, T.P.; Linde, J.; Smith, O.; Jensen, I.K.; Köppl, C.J.; Butts, M.; Bauer-Gottwein, P. Unmanned Aerial System (UAS) observations of water surface elevation in a small stream: Comparison of radar altimetry, LIDAR and photogrammetry techniques. Remote Sens. Environ. 2020, 237, 111487. [Google Scholar] [CrossRef]
  94. Bhutani, A.; Marahrens, S.; Gehringer, M.; Göttel, B.; Pauli, M.; Zwick, T. The Role of Millimeter-Waves in the Distance Measurement Accuracy of an FMCW Radar Sensor. Sensors 2019, 19, 3938. [Google Scholar] [CrossRef]
  95. Lowry, C.S.; Fienen, M.N. CrowdHydrology: Crowdsourcing Hydrologic Data and Engaging Citizen Scientists. Ground Water 2013, 51, 151–156. [Google Scholar] [CrossRef]
  96. Etter, S.; Strobl, B.; Seibert, J.; Meerveld, H.J.I. Value of Crowd-Based Water Level Class Observations for Hydrological Model Calibration. Water Resour. Res. 2020, 56, e2019WR026108. [Google Scholar] [CrossRef]
Figure 1. Region of interest.
Water 15 03233 g001
Figure 2. Diagram of the horizontal projection methods.
Water 15 03233 g002
Figure 3. Diagram of the dictionary learning method.
Water 15 03233 g003
Figure 4. Pinhole camera model.
Water 15 03233 g004
Figure 5. Frequency-modulated continuous wave (FMCW) radar principle.
Water 15 03233 g005
Disclaimer/Publisher’s Note: The statements, opinions and data contained in all publications are solely those of the individual author(s) and contributor(s) and not of MDPI and/or the editor(s). MDPI and/or the editor(s) disclaim responsibility for any injury to people or property resulting from any ideas, methods, instructions or products referred to in the content.

