Article

Groundwater Vulnerability to Nitrate Contamination from Fertilizers Using Modified DRASTIC Frameworks

1
Department of GIS/RS, Faculty of Natural resources and Environment, Science and Research Branch, Islamic Azad University, Tehran 14515775, Iran
2
Department of Water Engineering, College of Abouraihan, University of Tehran, Tehran 141556311, Iran
3
Faculty of New Sciences and Technologies, University of Tehran, Tehran 141556311, Iran
4
Division of Water Resources Engineering & Centre for Advanced Middle Eastern Studies, Lund University, SE-221 00 Lund, Sweden
*
Authors to whom correspondence should be addressed.
Water 2023, 15(17), 3134; https://doi.org/10.3390/w15173134
Submission received: 7 July 2023 / Revised: 21 August 2023 / Accepted: 29 August 2023 / Published: 31 August 2023

Abstract

:
Vulnerability maps of groundwater provide an efficient means of identifying environmental trends and prioritizing regions for prevention plans. The GIS-based DRASTIC method, however, does not consider the impact of contamination, so there is a need to modify it according to the specifics of the region and its contamination load. The aim of this study is to investigate a suitable DRASTIC modification for vulnerability assessment by changes in its rating and weighting systems. The goal is to explore and compare the impact of both objective and subjective weighting methods in the vulnerability assessment of a smaller aquifer situated beneath agricultural land. The frequency ratio (FR) method is used to adjust the DRASTIC index rates based on nitrate contamination as the main contamination from fertilizers extensively used in the study area. The DRASTIC parameters’ weights are determined using two objective and subjective methods, including Shannon entropy and single-parameter sensitivity analysis (SPSA), respectively. In total, five frameworks, including FR-DRASTIC, DRASTIC-Entropy, DRASTIC-SPSA, FR-SPSA, and FR-Entropy are developed and evaluated. We validate these proposed vulnerability indices based on the nitrate concentrations in 14 samples. The results show that the vulnerability map obtained from the FR-Entropy framework is superior, showing a 0.85 correlation with nitrate concentrations. Notably, Shannon entropy as an objective weighting method outperformed the subjective SPSA approach.

1. Introduction

Groundwater resources are increasingly over-exploited worldwide in the headlong pursuit of economic and social benefits [1]. It is essential to design definite strategies and guidelines for groundwater protection against contamination, particularly in areas where surface water is limited [2]. Protecting groundwater resources from being polluted is crucial due to the high remediation cost [3]. In this regard, groundwater vulnerability maps provide efficient tools for management and protection [4,5]. Several approaches exist to assess aquifer vulnerability, each considering the intrinsic properties of the aquifer, potential contamination sources, and available data. These methods can be grouped by vulnerability indices, which are dimensionless relative measures where higher values suggest greater susceptibility to contamination [6].
Groundwater vulnerability approaches are broadly divided into three categories, including process-based simulation, overlay and index-based, and statistical methods [7]. Among these, the GIS-based depth to water table, net recharge, aquifer media, soil media, topography, impact of vadose zone, hydraulic conductivity (DRASTIC) [8] approach is widely recognized. However, its standard rating and weighting system may not address the specific characteristics of an aquifer that are causing variation in the contamination exposure. To address this, several scholars have continued to improve the DRASTIC framework using a range of statistical and mathematical techniques [9,10,11,12,13]. These studies show that combining overlay and index-based methods with statistical approaches can successfully modify the vulnerability index. For example, in a recent study, Lakshminarayanan, Ramasamy [14] coupled the biogeography-based optimization (BBO) method with Shannon entropy (SE) and stepwise weight assessment ratio analysis (SWARA) to optimize the DRASTIC index. Their results show an improvement in the vulnerability assessment in an aquifer in south India. The flexibility of the DRASTIC method leads scholars to apply different types of modification to it. The modification strategies vary from adding other physical factors, such as land use, to the original parameters [15,16,17,18] to enhancing the DRASTIC rating and weighting systems [19,20,21,22]. In a comparative study, Kirlas, Karpouzos [18] incorporated their study area’s land use as a parameter of DRASTIC. In this way, they could consider the impact of nitrate contamination, as the water quality indicator in agricultural land, on the groundwater vulnerability assessment.
Weighting within DRASTIC can yield diverse results depending on the chosen approach [23]. Objective methods, like entropy, assign modified weights to key features that are vital for the vulnerability assessment process [24]. In recent decades, groundwater vulnerability studies have affirmed the effectiveness of such objective methods in assessing vulnerability [20,25,26,27,28]. While objective weighting methods assess the modified weights of only essential features in the vulnerability assessment process, subjective weighting methods provide modified weights to all features without considering their significance [24].
Many pollutants, such as nitrate from fertilizers, impact groundwater quality [29]. Since nitrate is water-soluble and highly mobile, it can be an indicator of groundwater quality in agricultural lands [30,31]. Many scholars have used nitrate as a groundwater quality indicator to investigate the risk of groundwater contamination from the soil surface. For example, Berhe Zenebe, Hussien [32] compared the DRASTIC and modified DRASTIC based on human activities and land use to assess groundwater vulnerability to contamination in the Elalla-Aynalem Catchment. They concluded that nitrate from fertilizers could expose the catchment to highly contaminated surface water. Javadi, Kardan Moghaddam [33] combined the DRASTIC and numerical SEAWAT model to simulate saltwater intrusion and proposed the DRASTICSea index to investigate the vulnerability of a coastal aquifer. They used TDS and nitrate samples as water quality indicators to evaluate the results.
Although the large aquifers encompassing a number of administrative regions play a vital role in potable water supplementation, small aquifers also have specific concerns. Typically, the data for small aquifers are limited, while the risk of their pollution is higher. Moreover, the hydrological and geohydrological characteristics of aquifers that encompass a small area are usually consistent. For example, it is less likely to observe dramatic changes in the topography of a small area. In this study, we focused on a small aquifer to investigate the impact of both objective and subjective weighting methods in the vulnerability assessment of a smaller aquifer situated beneath agricultural land. The City of Yasuj in the southwest of Iran has been experiencing an increase in population in recent years, followed by growth in industrial and agricultural activities. Yasuj aquifer, a vital source of potable water in the region, is exposed to more vulnerability by overexploitation. As a result, assessing groundwater vulnerability is an essential step for protecting the groundwater resources in the region. Regarding previous studies, data availability, and limitations, the DRASTIC framework was applied and improved by combining powerful statistical techniques considering the nitrate concentration for the first time in this region.
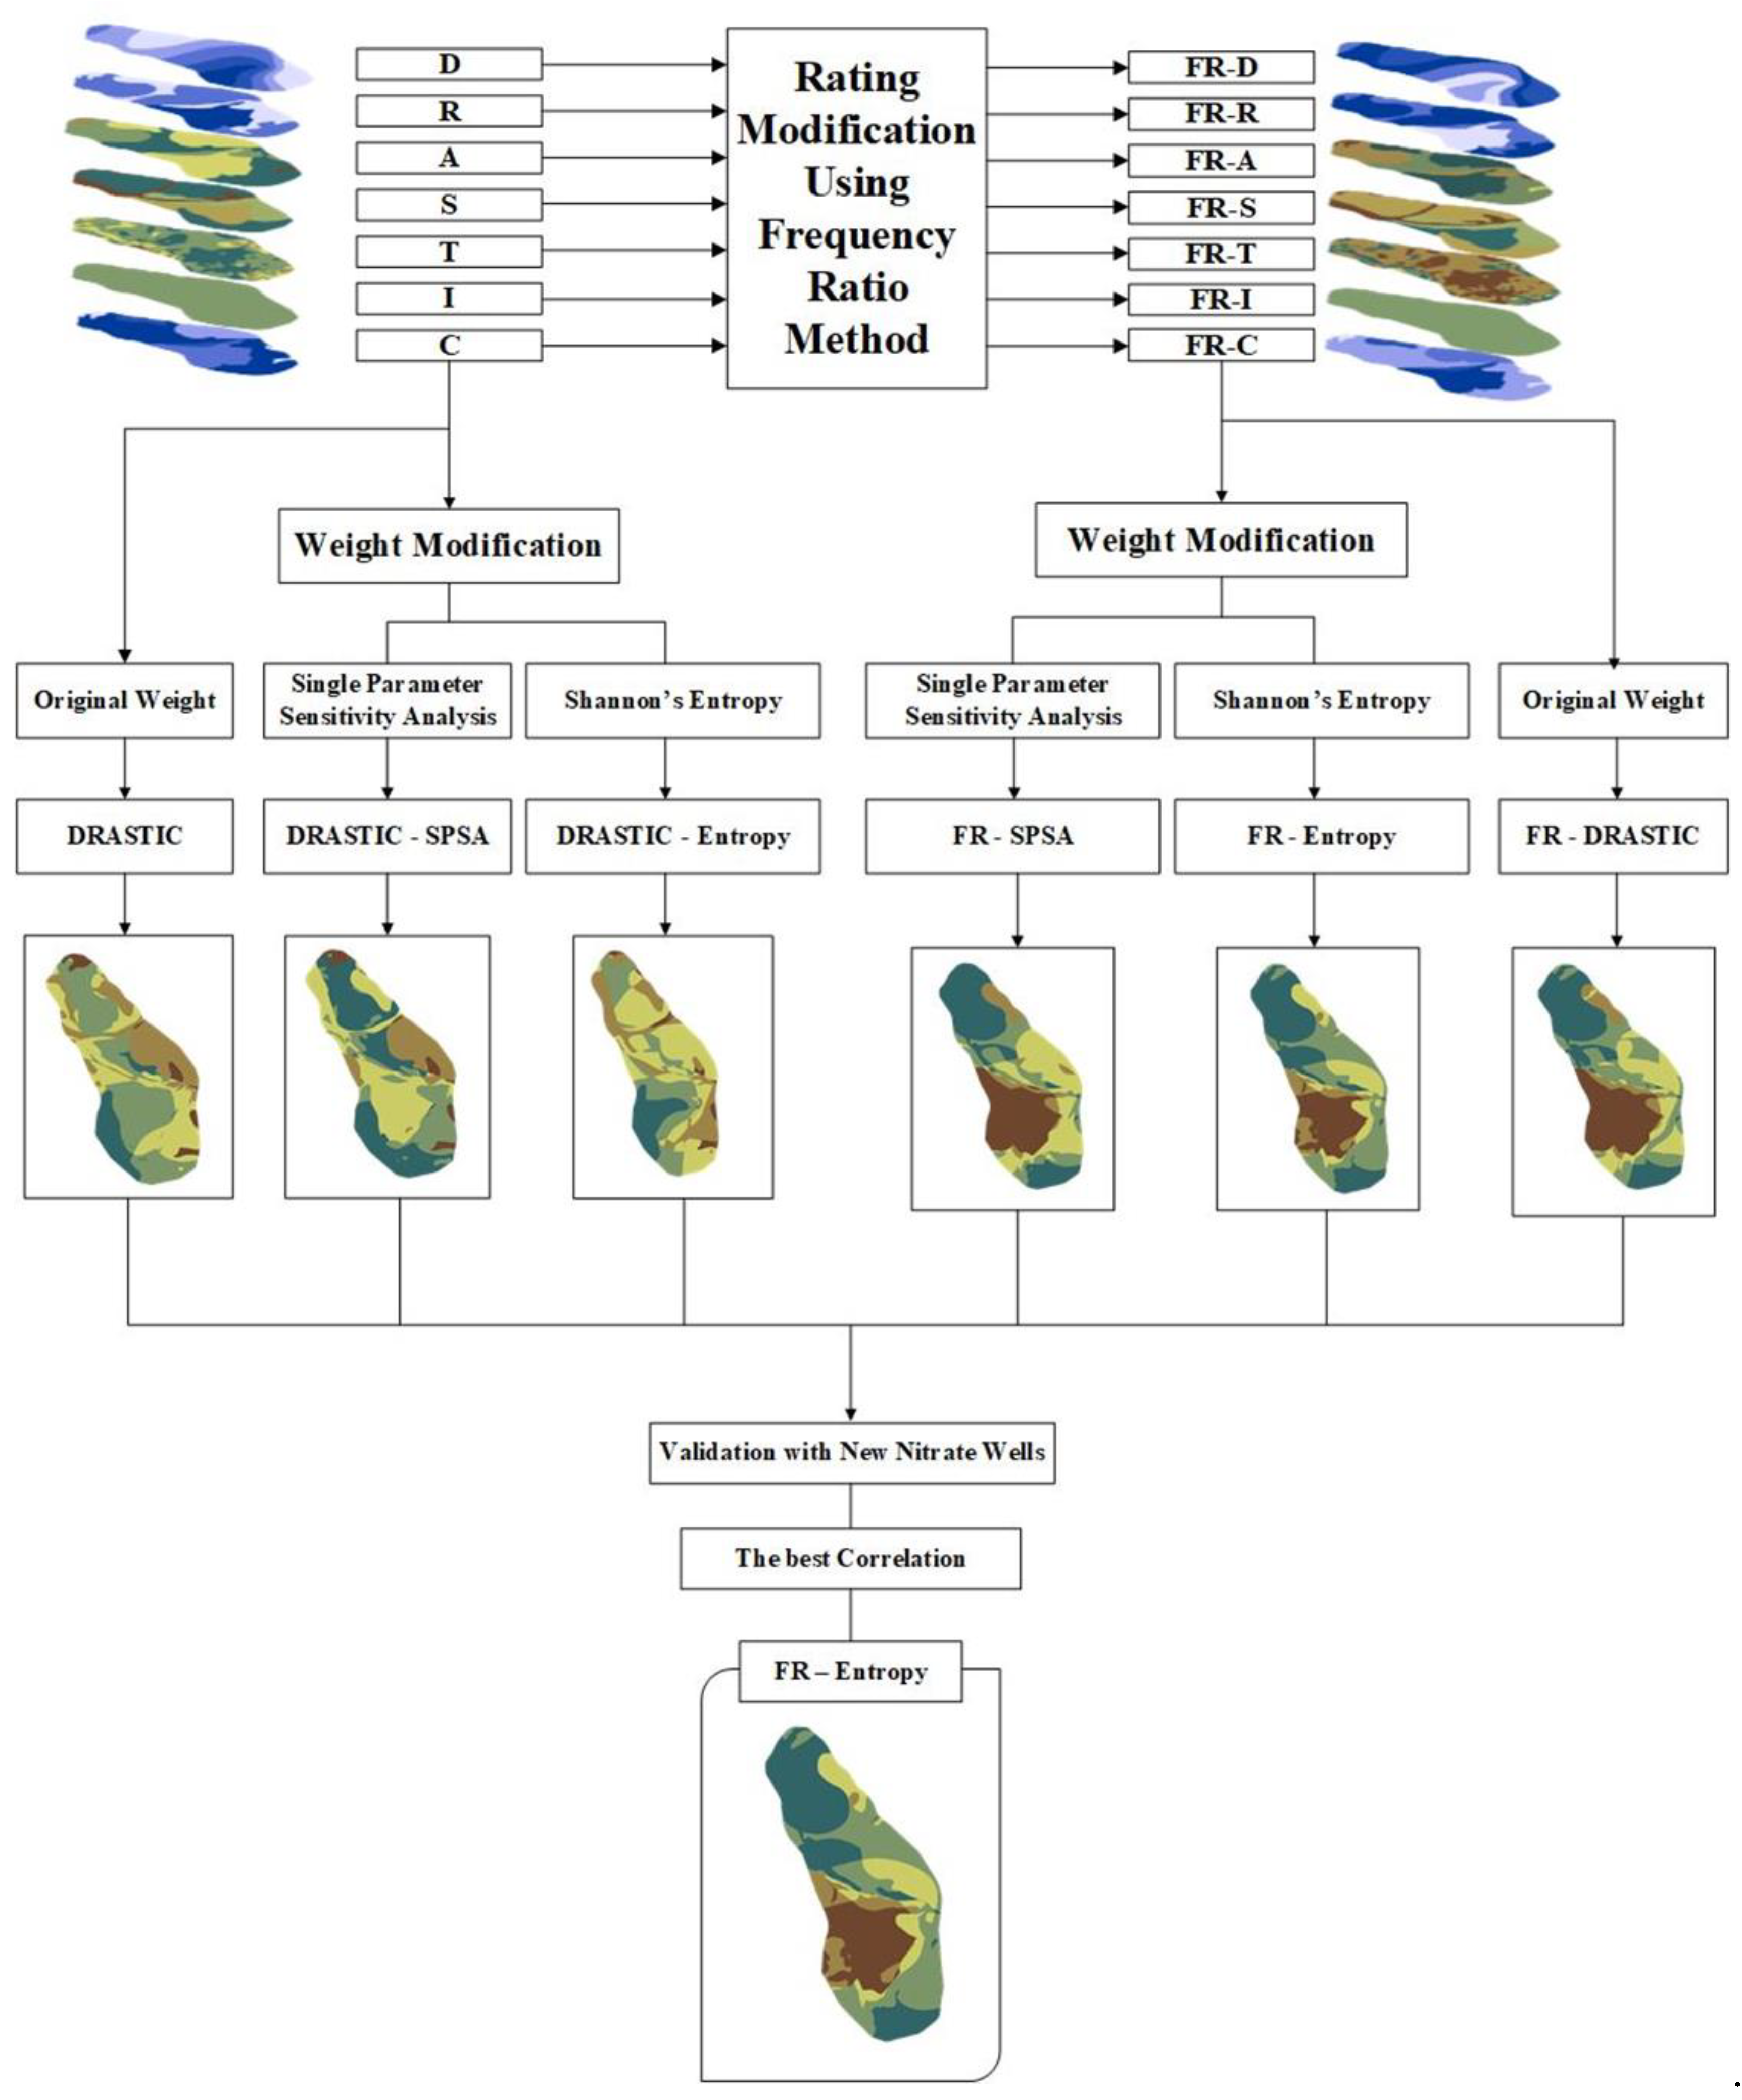
The application of ensemble approaches for model modification can deliver superior outcomes compared to single rating or weighting methods. In the present study, we merge frequency ratio (FR), entropy, and single-parameter sensitivity analysis (SPSA) to improve the performance of the original DRASTIC framework. The FR is employed to modify the DRASTIC rates as a probabilistic-based statistical model. Entropy and the SPSA are applied for weight modification to compare an objective and subjective method, respectively. We propose the innovation of using the FR-Entropy method as a hybrid technique to use both objective and ensemble benefits simultaneously. The entire methodology is detailed in Figure 1. The objectives of this study are: (1) to test hybrid methods for the determination of DRASTIC weights and rating scores, (2) to refine the vulnerability index for the study area using nitrate concentration data, and (3) to evaluate the contribution of the seven parameters of aquifer vulnerability through SPSA.

2. Materials and Methods

2.1. Study Area

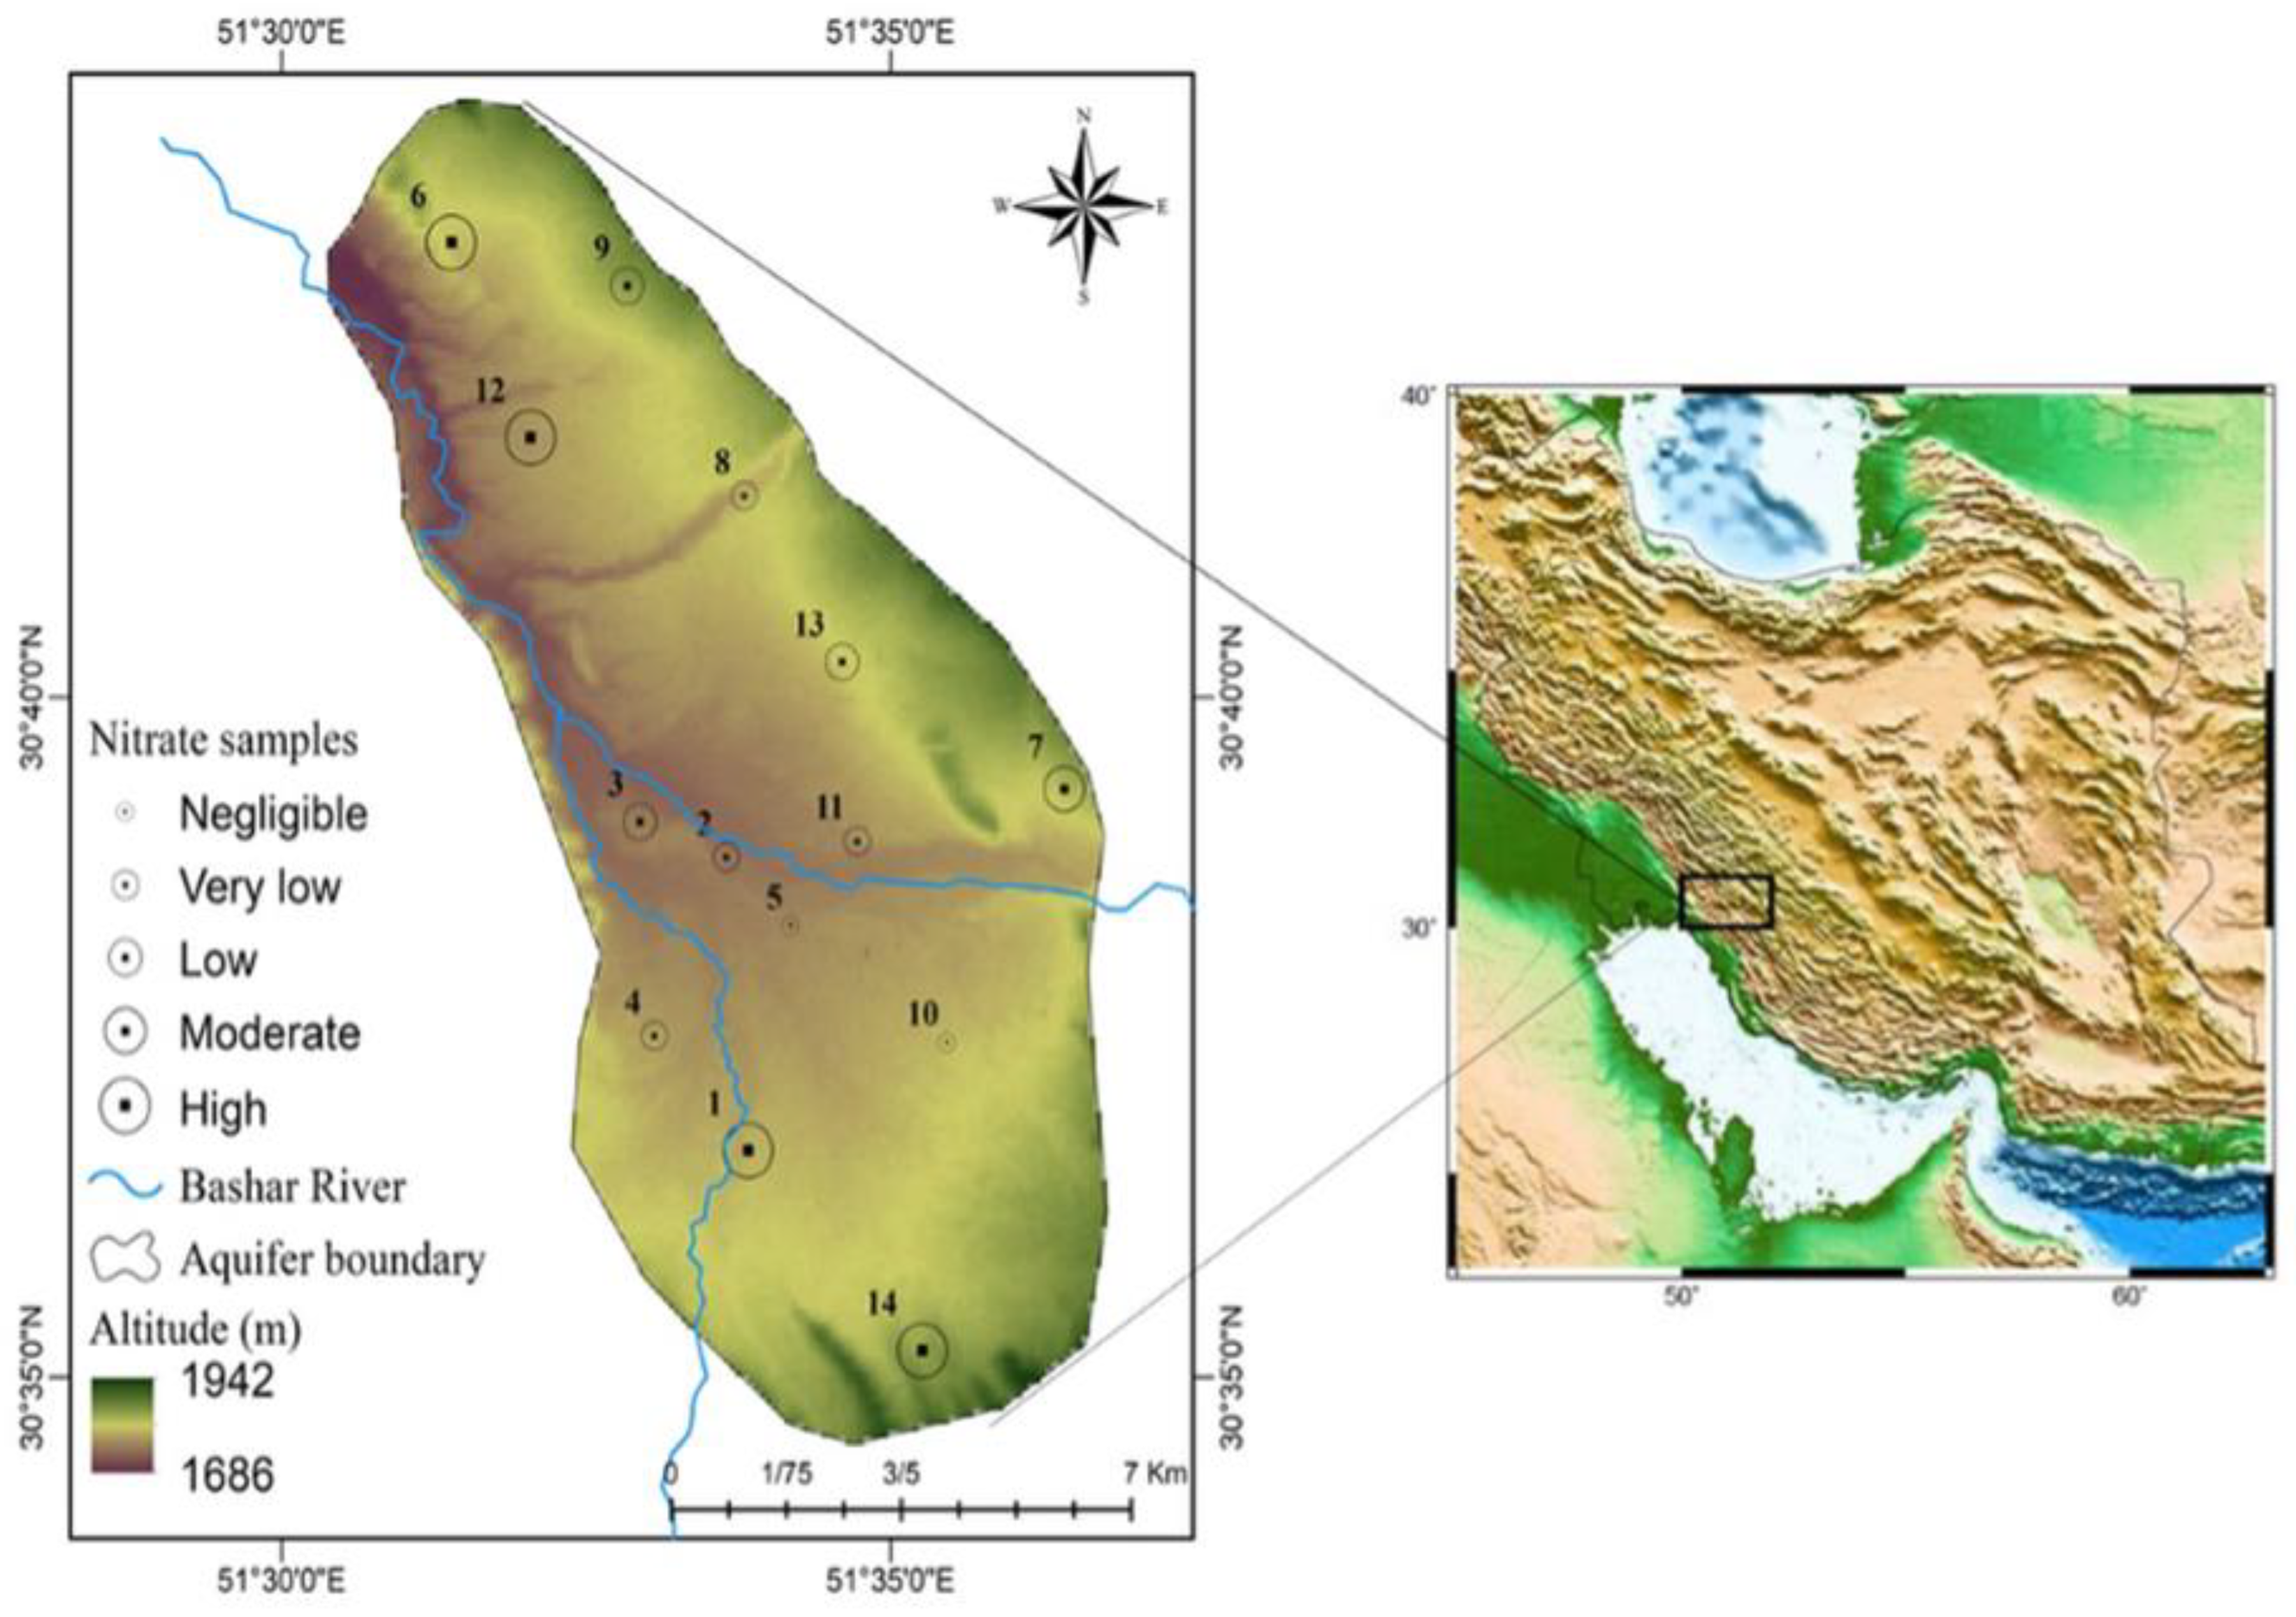
The Yasuj plain is situated in the southwest of Iran (Figure 2) approximately between latitude 30°35′ N to 30°45′ N and longitude 51°30′ E to 51°40′ E. While the Zagros Mountain range surrounds it, the topography of the Yasuj plain is gentle, with an average altitude of 1860 m above mean sea level. According to the Iran Meteorological Organization, the annual average temperature of the study area stands at 15.3 °C, and the total annual rainfall is estimated at 820 mm. The Yasuj aquifer, the most important aquifer of the region, covers an area of 92 k m 2 .
Due to the high humidity and moist winds, the study area receives rainfall well above the average rainfall of Iran (280 mm), which results in abundant surface runoff. The most important river in the study area, the Bashar River, is one of the main streams of the Karun River. Another river, the Abshar River, originates from the northeastern Yasuj and Dena Mountain and joins the Bashar River in the south of Yasuj. According to the Kohgiluyeh and Boyer Ahmad water organizations, there are 215 exploitation wells within the Yasuj aquifer. These wells are the main sources of the drinking water supply for the Yasuj area and suburban villages.
The study area has been shaped by orogenesis activity since the late third century, leading to a gradual reduction in the density of anticlines and synclines moving from the northwest to the southwest. This study area is largely covered with Calcareous formations and Quaternary sediments that took shape in the Cenozoic Era, or even earlier. In the Yasuj plain, the aquifer medium predominantly consists of massive sandstone and basalt. This particular composition in the main region increases the potential of nitrate infiltration, given its notable permeability.
The Yasuj aquifer is made up of massive sandstone, gravel and sand, and basalt. Basalt in the southern and western parts of the region has a fine-grain nature and low porosity. This can provide some protection to certain parts of the aquifer against potential contamination due to its limited permeability. In contrast, the northern part of the aquifer is composed of highly permeable gravel and sand, making it more vulnerable to pollutants entering the water table. Moreover, the soil map of the Yasuj plain shows that the northern, northeastern, and southwestern parts of the aquifer are covered by sandy soil with well-spaced pores. As a result, contamination can move freely toward lower layers. The other components of soil media (clay, clay loam, and loam) may slightly limit the permeability of the soil layer in specific areas. Finally, the vadose zone area, predominantly filled with sand and clay, indicates a substantial leaching potential. This, combined with a high recharge rate, greatly impacts the intrinsic vulnerability of the study area.
The land use and land cover maps of the study area display prominent farmland and forest regions. According to the satellite images, over 90% of the Yasuj plain is covered by farmlands, rangelands, or forests [34]. This extensive coverage of grassland and agricultural usage makes the plain more susceptible to increased fertilizer application and the potential for nitrate contamination.
The consistent rainfall, geohydrological characteristics, land cover, and topographical uniformity in the Yasuj plain make it suitable for agriculture. As a result, farming activities coupled with an extensive use of fertilizers have caused a noticeable increase in the nitrate concentration throughout the area.
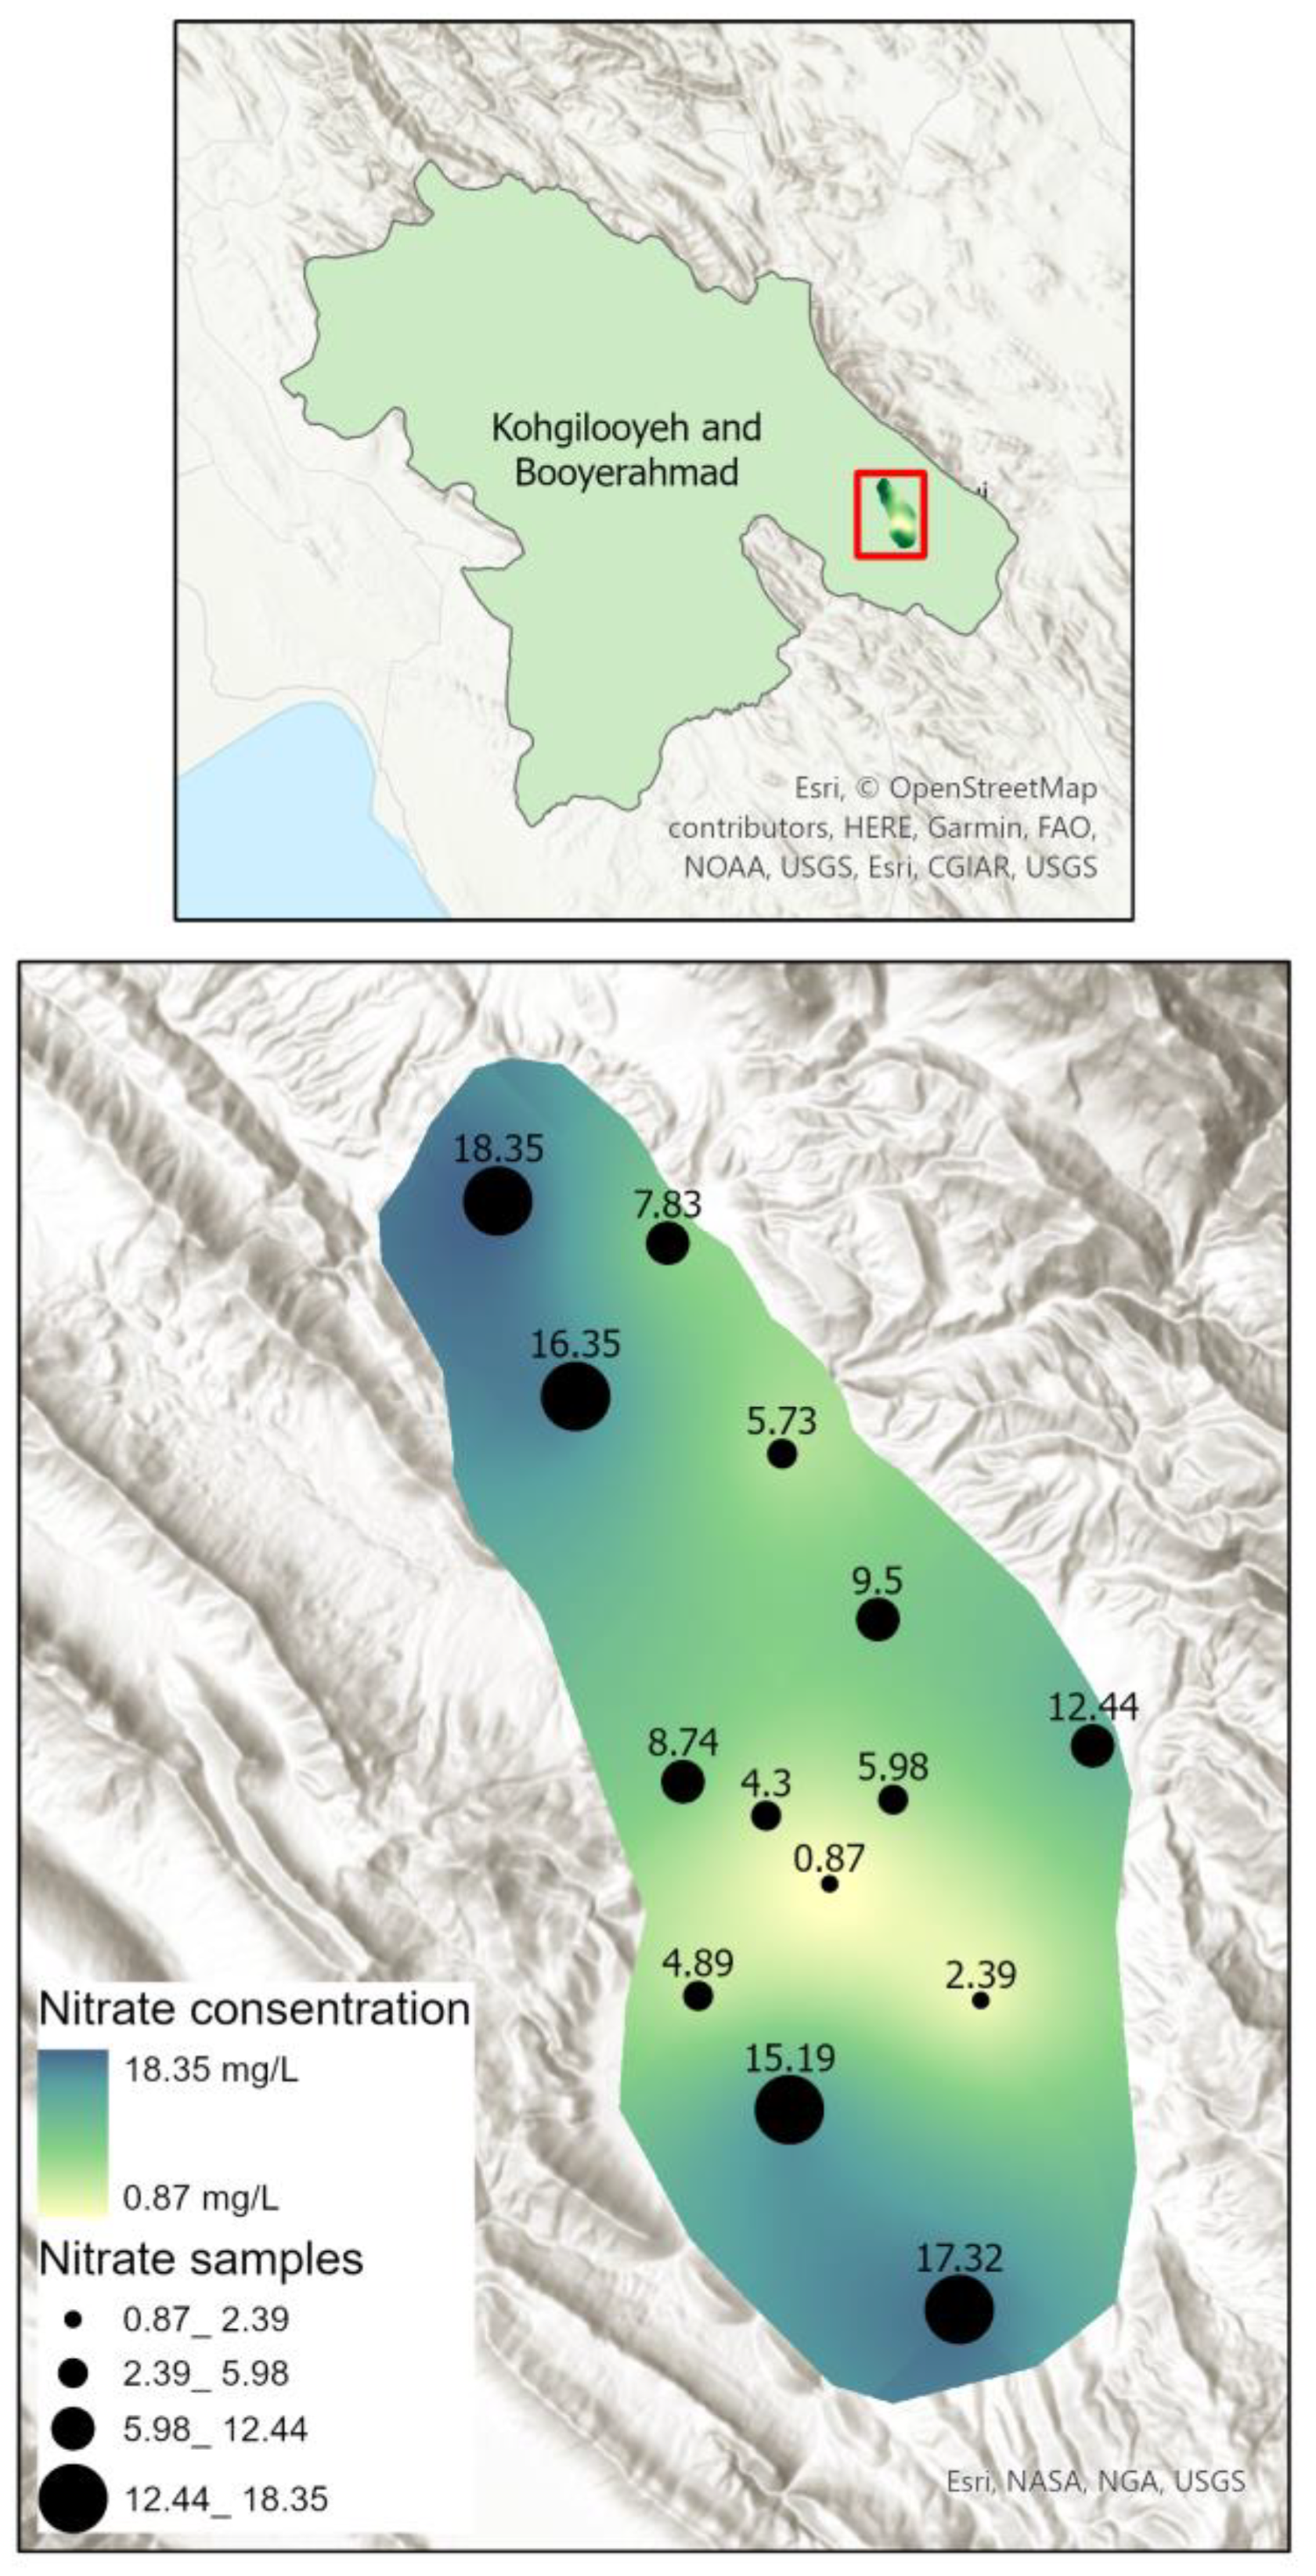
In this research, nitrate has been used as the primary contamination indicator in the study area. To produce the quality map distribution, nitrate concentration was collected from 14 wells. The water level of these wells is varied, ranging from 5 to 35 m. The wells in the southern and western parts of the study area are shallower, while the samples in the northern part are deeper. Each well underwent two rounds of nitrate sampling. The initial sampling was used for the modification process, and the second sampling served as the ground truth for validating the effectiveness of the vulnerability frameworks. Figure 3 shows the nitrate concentration in the study area, as determined by Kriging interpolation.
In the following sections, we explain the calculation of the DRASTIC index and the modification methods introduced in this case study. We employed the Frequency Ratio for rating modification and used Single Parameter Sensitivity Analysis as a subjective weighting method, in contrast to Entropy, which served as the objective method. Table 1 presents examples of both subjective and objective weighting methods found in groundwater vulnerability assessment studies from the past decade.

2.2. DRASTIC Index

The DRASTIC method offers an elegant framework typically applicable when hydrological and hydrogeological data are available. It uses seven hydrological and hydrogeological parameters that influence the groundwater movement and pollution transport: depth to groundwater (D), net recharge (R), aquifer media (A), soil media (S), topography (T), impact of vadose zone (I), and hydraulic conductivity (C) (Aller et al., 1987). These parameters are classified, rated from “1” to “10”, and weighted from “1” to “5” based on their impact on potential contamination. The DRASTIC index is determined by applying a linear combination of all factors as the following formula:
D I = D r D w + R r R w + A r A w + S r S w + T r T w + I r I w + C r C w
where DI is the DRASTIC index, D, R, A, S, T, I, and C are the seven parameters, and the subscripts “r” and “w” are related to the DRASTIC rates and weights, respectively.

2.3. DRASTIC Data Layers

The data pivotal for determining the hydrogeological parameters of the DRASTIC model are presented in Table 2. The corresponding layers to the seven DRASTIC parameters are structured in a raster GIS format.
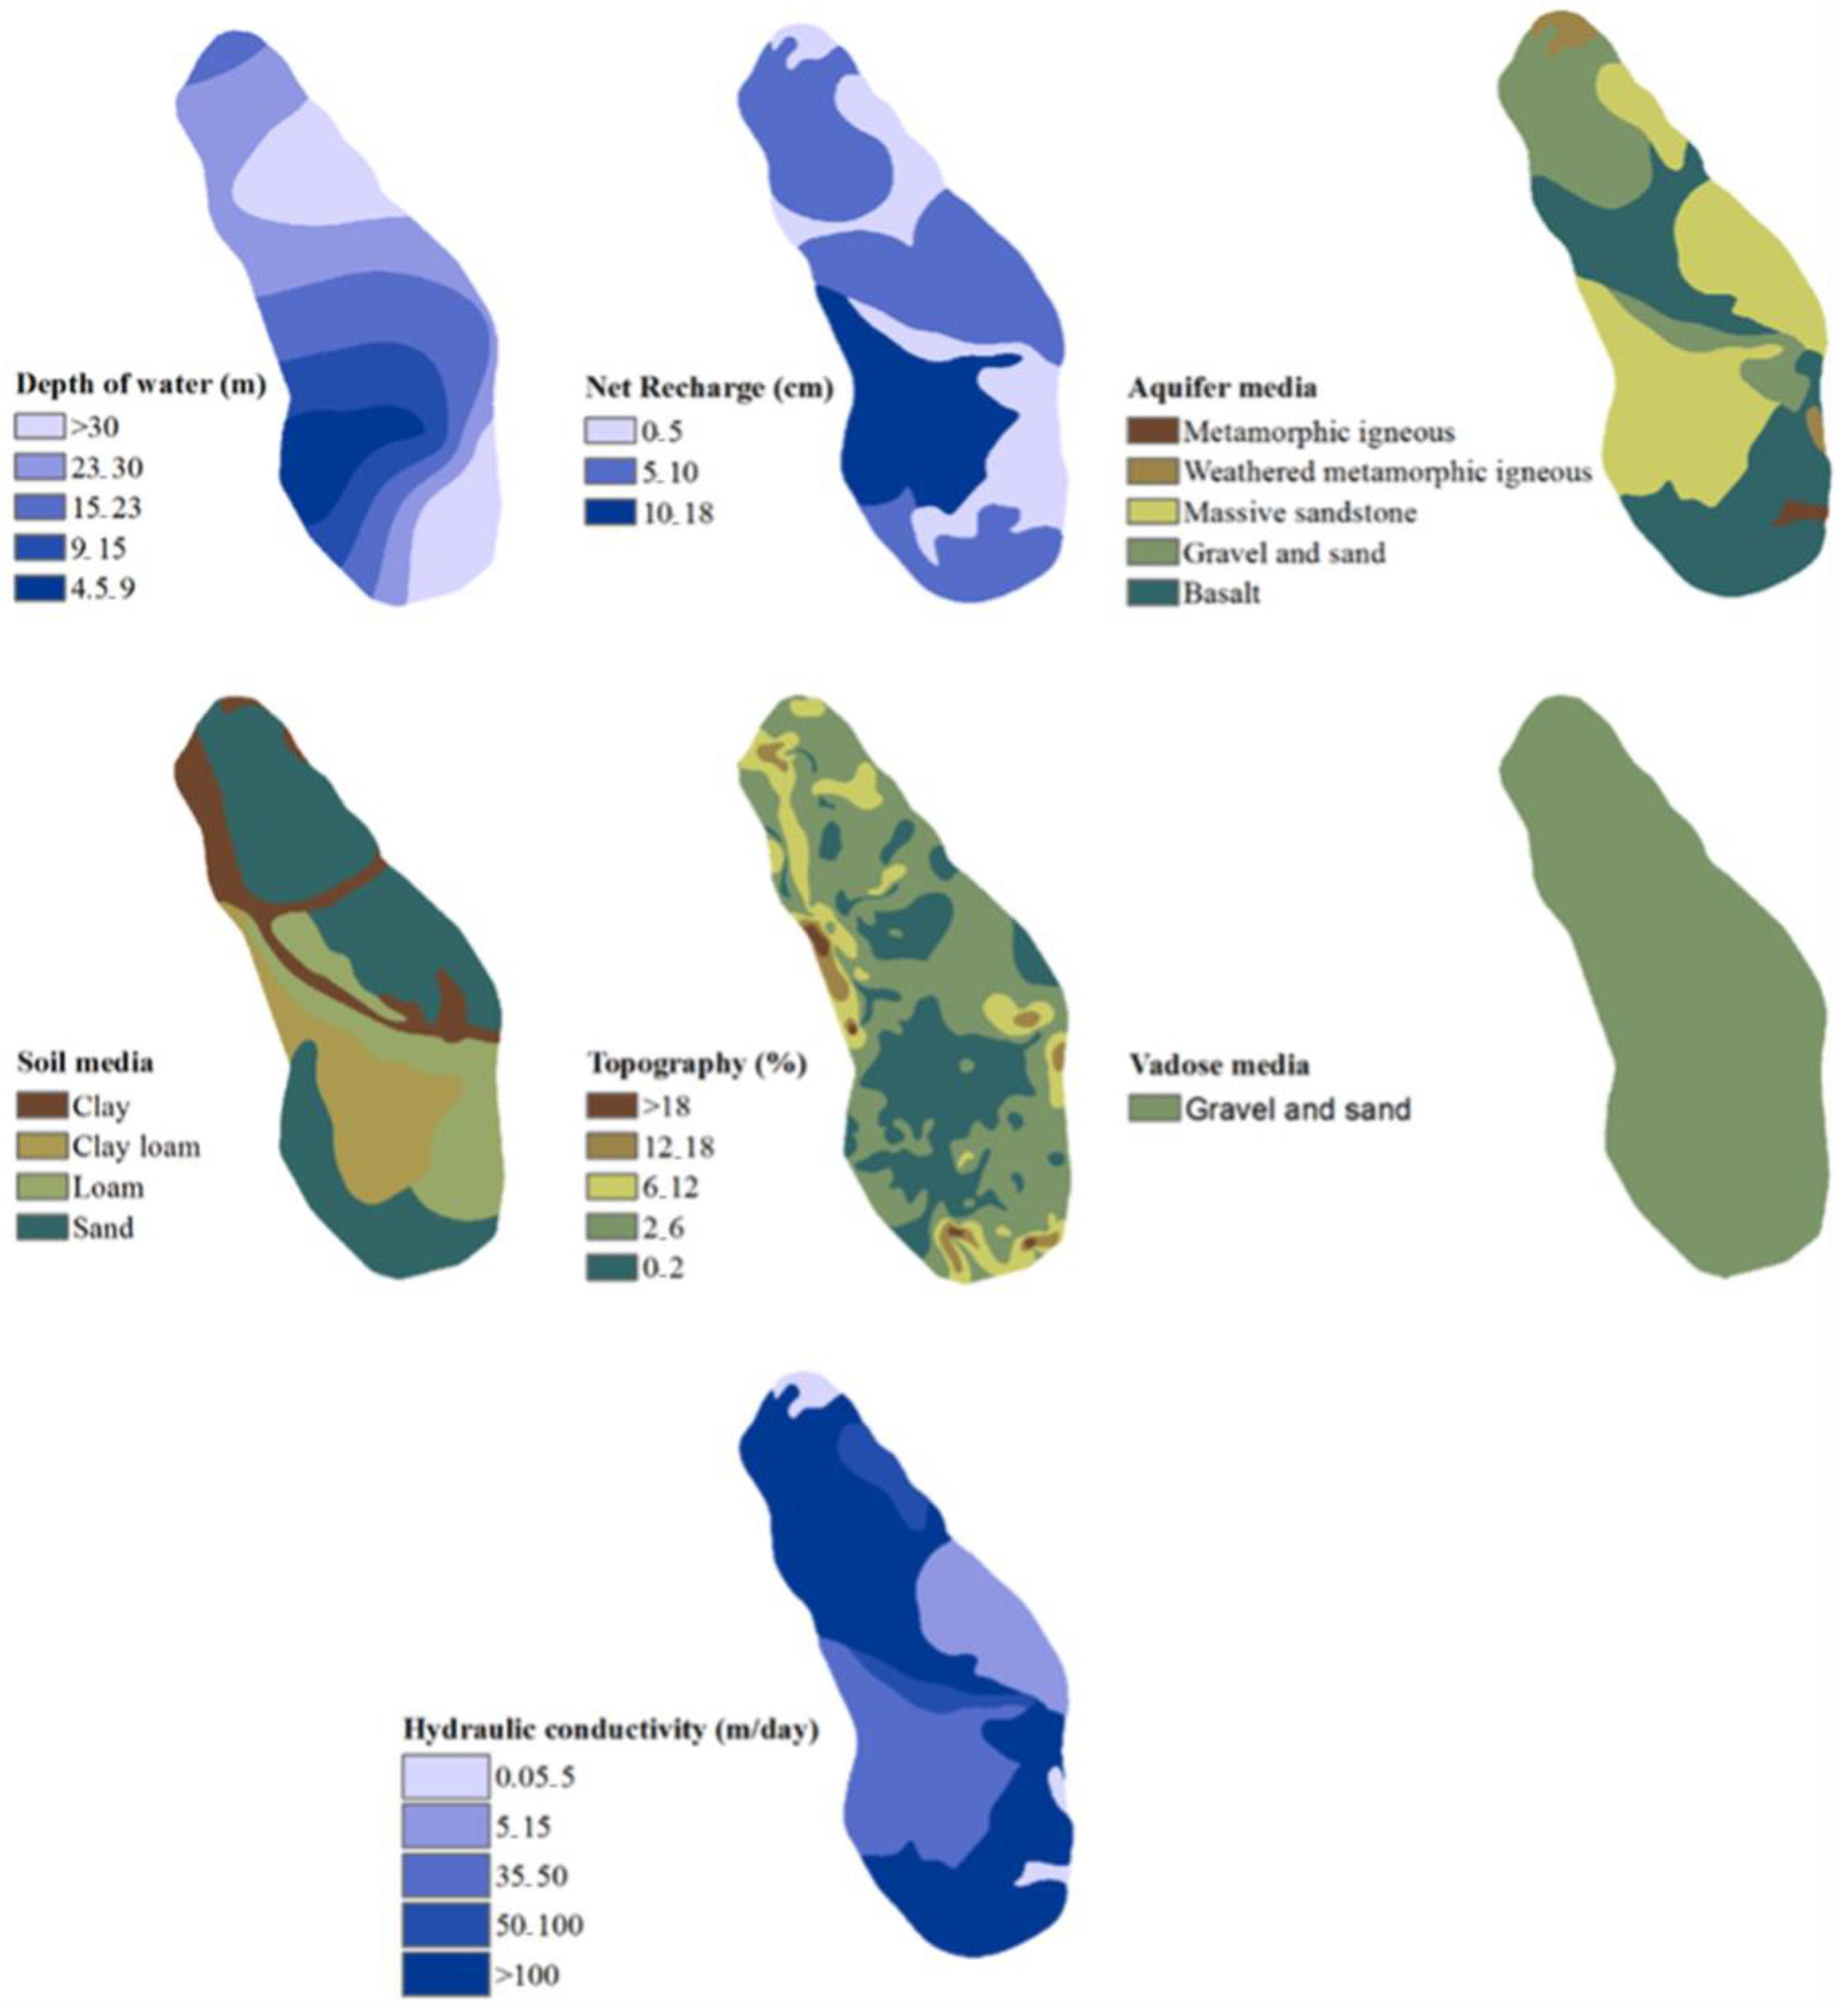
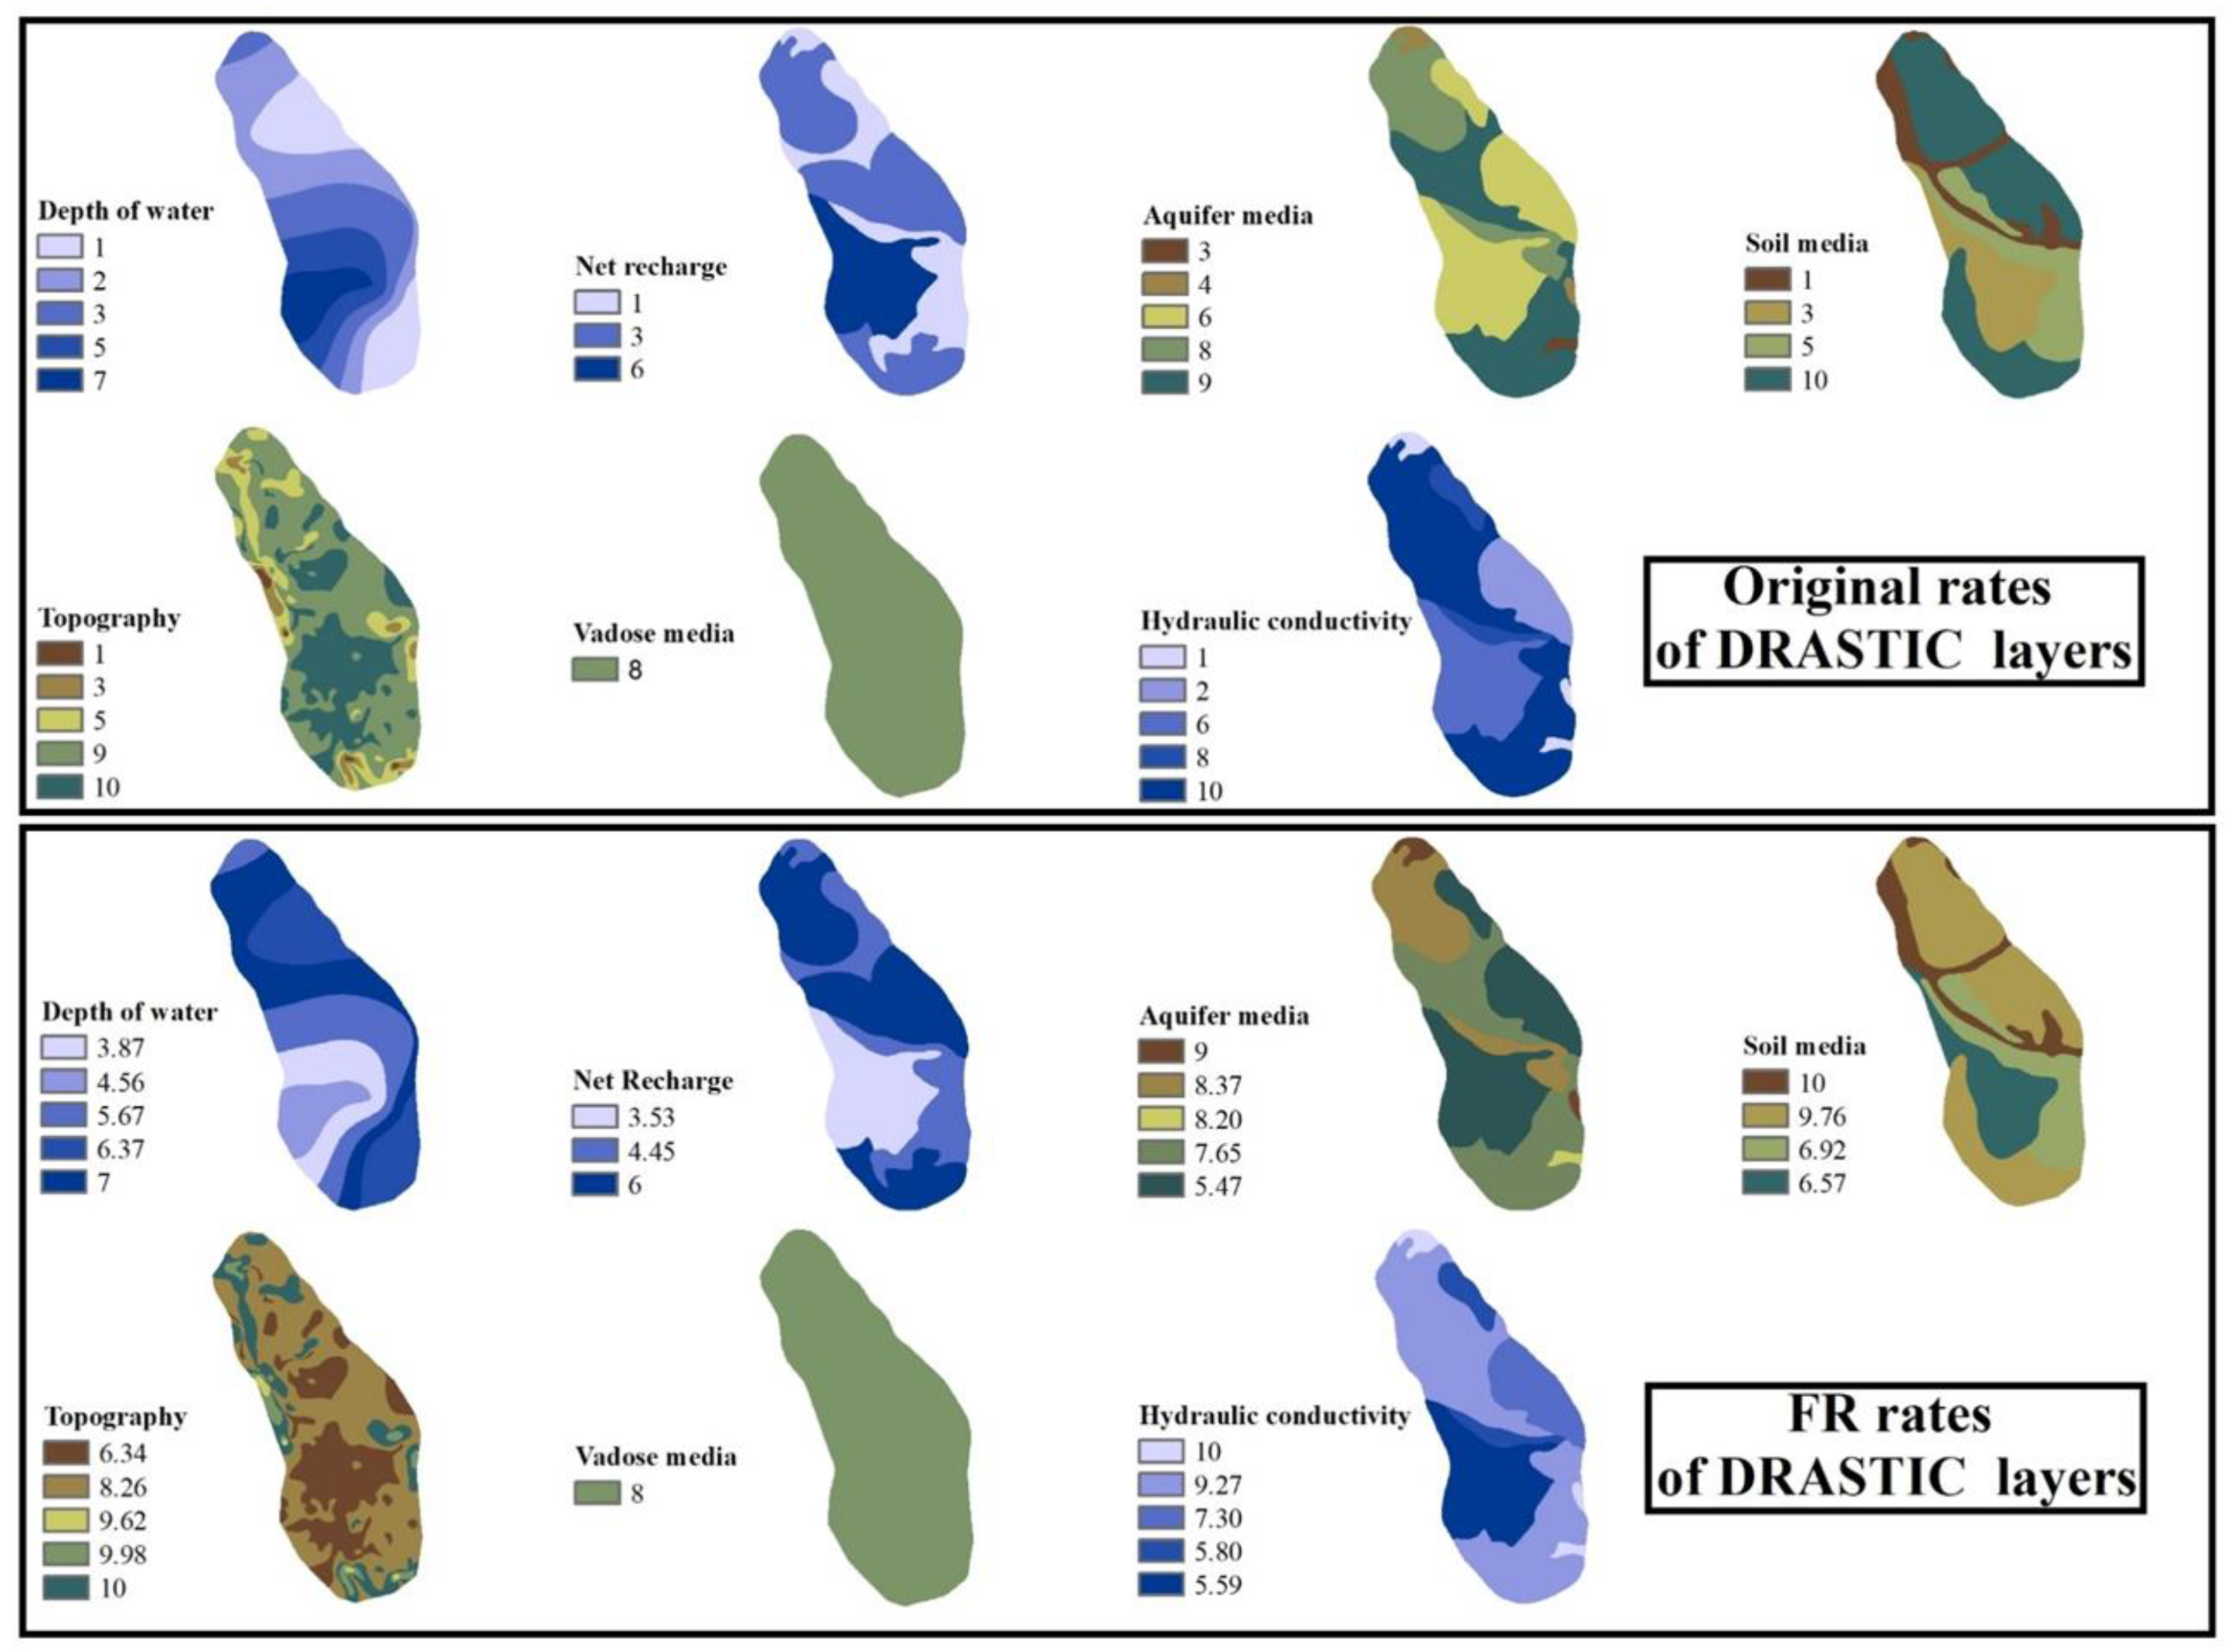
The classification of the seven DRASTIC layers in the study area is based on the work by Aller and Thornhill [8], as depicted in Figure 4. The depth to groundwater, representing the vertical distance between the ground surface and the water table, is categorized into five classes. The shallowest depth is 4.5 m, found in the southwest of the aquifer. Net recharge is derived from rainfall and runoff data, taking permeability and topography into account. This map has three classes, with the highest recharge rate in the aquifer’s west. Aquifer media consider factors like porosity, grain size, and permeability. The northern section of the aquifer primarily consists of gravel and sand, which have high permeability. Also, massive sandstone forms the main central part of the aquifer.
Soil greatly influences how contaminants move vertically within the vadose zone. As shown in Figure 4, the areas covered by permeable sand are in the northern, northeastern, and southern parts of the study area. The topography, which affects infiltration, is derived from the digital elevation model (DEM) and classified into five classes. The gentle slope increases the likelihood of pollutant infiltration, and as a consequence, raises the pollution potential. In the Yasuj aquifer, the vadose zone has a uniform nature predominantly made of gravel and sand. Hydraulic conductivity is a crucial factor in pollutant transport. In this study, the hydraulic conductivity distribution map was prepared and classified into five groups, as illustrated in Figure 4.

2.4. Frequency Ratio Method (FR)

The frequency ratio (FR) method gauges the probability of occurrence in a bivariate statistical attribute. It provides a straightforward geospatial assessment to understand the correlation between the nitrate samples and the hydrogeological factors involved in vulnerability estimation [37,38]. The FR model, thus, determines the correlation between the nitrate distribution and the seven DRASTIC parameters [39].
To calculate the FR, the area ratios of both when contamination occurs and when it does not should be determined for the class of each factor [40]. In the FR determination process, the nitrate concentration ratio of each DRASTIC parameter range was calculated, considering the total nitrate concentration observed in each class of each parameter from the interpolated nitrate samples compared to the total nitrate concentration across the study area. Additionally, the percentage covered by each parameter class was computed by dividing the count of each range by the total count of the study area. Finally, FRs for each factor range were deducted by dividing the nitrate concentration ratio by the previously calculated area ratio. The expression for the FR in each class of groundwater vulnerability factor is based on the following formula:
F R = A B C D = E F
where A is the area of a class for each DRASTIC factor; B is the total area of each factor; C is the total nitrate concentration occurrence in the class of each factor; D is the total of nitrate concentrations in the study area; E is the percentage of nitrates in the class of each factor; and F is the percentage area in the class of each factor. According to the FR definition, we can regard the value of one as an average. A value greater than one indicates a higher correlation between the corresponding factor and nitrate concentration, while a value lower than one refers to a weaker correlation [41].
The maximum value for each parameter from the original DRASTIC rates in the study area was assigned to the maximum FR to derive its adjusted rate. A proportion was applied for computing the adjusted rates of other ranges of the DRASTIC parameters based on the FR values and the maximum rate.

2.5. Entropy Method

A modified weighting scheme may reduce the effect of personal bias [42]. Shannon [43] introduced the concept of “entropy” to expound the hidden information within the data, which we utilized to investigate new patterns. The entropy principle can aid in optimization calculations [43]. In other words, entropy measures a system’s uncertainty. Lower entropy in the data indicates a lower unexpected outcome, while higher entropy points to greater data uncertainty [44,45]. By considering the seven factors in the study area, the entropy theory offers a more objective weighting system for the DRASTIC framework [46].
If the study area is divided into n pixels, and the DRASTIC parameters are taken as m, the membership matrix can be defined as ( p i j ) n × m . Therefore, the rate associated with the ith cell of the jth parameter can be presented in the given matrix format and normalized as follows:
f i j = p i j i = 1 n p i j i = 1 , , n . j = 1 , ,   m
This normalization adjusts for variation in the measurement units and scales. In the next step, the entropy value of factor j is represented as:
e j = 1 l n ( n ) j = 1 m f i j l n f i j
where e j is the entropy value of factor j, and 1 / l n ( n ) is the entropy constant. The entropy value of one indicates no impact of the factor, and thus, the weight of zero for the specific factor. Then, set d j = 1 e j as the degree of diversification. Thus, factor j degree of importance is defined as:
w j = d j j = 1 m d j
Finally, each factor’s weight regarding the original weight is estimated based on:
W j = λ j w j / j = 1 m λ j w j
where W j is the entropy weight of factor j, λ j is the original weight of factor j that 0 W j 1 and j = 1 m W j = 1 .

2.6. Single-Parameter Sensitivity Analysis Method (SPSA)

Sensitivity analysis explains how changes in the input parameter of an analytical model can influence its output. Napolitano and Fabbri [47] developed the single-parameter sensitivity analysis (SPSA) to quantify the effect of individual DRASTIC parameters on the vulnerability index. By comparing the “effective weight” to the “theoretical weight” of each parameter given by the DRASTIC model, SPSA identifies the most influential parameters [48,49].
The subjective weight of each parameter, using the SPSA method, is computed as:
W j = P r P w D I × 100
where W j stands for the effective weight of each parameter, P r represents its rating value, P w is its weight, and DI denotes the overall vulnerability index.

2.7. Validation

Nitrate is a well-known contaminant that threatens groundwater, particularly in agricultural regions, due to the use of fertilizers [50]. In the Yasuj plain, nitrate is used as a pollutant indicator of the groundwater under investigation because of widespread agricultural activities in the area. A second survey measured the nitrate concentration in 14 wells in this study to form a testing dataset.
The effectiveness of the vulnerability framework for the Yasuj aquifer was examined using Pearson’s correlation coefficient as a statistical method and grey relational analysis (GRA), which works based on geometrical relationships. GRA is particularly adept at handling small datasets without demanding specific distributions or inter-variable relationships [51]. It efficiently shows the correlation between vulnerabilities derived from suggested models and the observed nitrate level. The in-depth breakdown of the GRA calculation is described in reference [52].

3. Results

3.1. DRASTIC Map

The classifications of the seven parameters are shown in Table 3, detailing the relative rates and weights based on the Aller and Thornhill [8] methodology. Figure 5 shows the seven DRASTIC layers after reclassification using the original rating system. The depth map shows a gradual increase in the water table in the Yasuj plain from southwest to east. The highest rate score is associated with the southwest and north regions of the study area, with a water depth between 4.5 and 9 m. Notably, the southern portion of the Yasuj aquifer witnesses the highest net recharge with a rate of 6. This recharge rate arises from the presence of the river and the gentle slope of the area. Most parts of the study area have a gentle topography assigned by a DRASTIC rating of 9 and 10. These scores suggest a high risk of contamination transport into the aquifer. The vadose zone across the study area is formed by gravel and sand, with a rating score of 8. To determine the DRASTIC vulnerability index, the rates and weights of the seven factors were multiplied according to Equation (1). The resultant map, divided into five classes based on the Natural Break (Jerk) classification method [53,54], spans a range from very low to very high between 79 and 186, and is illustrated in Figure 6a. The figure indicates that the southwestern region of the study area exhibits the greatest vulnerability, with a value of 152 to 186. In contrast, regions with very low vulnerability are observed in the north and small areas in the southeast, marked by values ranging from 79 to 103.

3.2. FR-DRASTIC Map

The FR for each DRASTIC parameter’s range was obtained using Equation (2) regarding the nitrate distribution in the study area, as derived from the training samples. Table 3 shows the FR values and modified rates for each factor’s type or range within the study area. The modified DRASTIC layers based on the FR rating system are shown in Figure 5 compared to the generic DRASTIC layers. In the case of vadose media, the study area is characterized by a single class. Therefore, the FR obtained a value of 1, which is the average value, and a rating score of 8, which is the original DRASTIC rate for the present class of the parameter.
The vulnerability map of the Yasuj aquifer, derived from the FR-DRASTIC index, was obtained by a linear combination of the FR rates and DRASTIC weights for the seven parameters (Figure 6b). This vulnerability map is categorized into five classes from very low to very high, with the index value ranging from 126.6 to 181.9. The lowest vulnerability appears in the southwest, while the north and a small section of the south exhibit very high contamination vulnerability.

3.3. DRASTIC-Entropy Map

The weights were calibrated using the entropy method. Table 4 details the associated entropies of each of the parameters. According to the rule “higher entropy indicates higher uncertainty”, the impact of vadose media, which have the highest entropy, was excluded from the modification. This value was obtained for this parameter due to the aquifer media’s uniformity across the plain. The DRASTIC-Entropy index for assessing vulnerability to contamination was calculated by integrating a generic DRASTIC rating system and a modified weighting system from the entropy method.
Table 4 outlines the modified weights of each vulnerability index parameter. The DRASTIC values determined by the DRASTIC-Entropy method ranged between 1.4 and 7.6 and were classified into five classes, as illustrated in Figure 6c. Regions with very low and low vulnerability values were found along narrow bands in the northwest and southeast. The southwest area displayed a very high vulnerability using this method.

3.4. FR-Entropy Map

The first proposed hybrid method is based on the FR rating system paired with entropy weights. The modified rates of the DRASTIC index for each factor’s range were calculated according to Section 2.5. Similar to the FR-DRASTIC, the FR for the impact of vadose media layer settled at a value of 1 due to its uniformity through the Yasuj aquifer. Therefore, Factor I was entered into the vulnerability index calculation with its traditional DRASTIC rate, without modification. The entropies linked to the parameters were assessed regarding the FR rates associated with each factor’s range, as demonstrated in Table 3.
Every entropy value was deduced from new rating scores derived from the FR. Table 4 shows the updated entropies associated with the DRASTIC parameters. The impact of vadose media gained the highest entropy (value of 1), making it the most uncertain parameter in the study area. Due to its highest uncertainty, this parameter was excluded from the vulnerability assessment.
Figure 6e illustrates the vulnerability map obtained from the FR-Entropy framework. The vulnerability values ranged from 4.72 and 7.76, categorized into five classes.

3.5. DRASTIC-SPSA Map

Using the SPSA as a subjective approach, the weighting system of DRASTIC was modified, as shown in Table 5. The minimal effective weight of the topography factor confirms the marginal theoretical impact of the slope. In comparison to the theoretical weights assigned by the DRASTIC framework, the net recharge, aquifer media, effect of vadose media, and hydraulic conductivity all exhibited higher effective weights. The vulnerability index from the DRASTIC-SPSA method was calculated using generic DRASTIC rates and SPSA weights associated with each parameter. This index ranged from 96.4 to 196.2 and was classified into five classes, as shown in Figure 6d.

3.6. FR_SPSA Map

In the FR-SPSA method, DRASTIC rate modification was related to the FR framework elucidated in Section 2.5. Moreover, the effective weights of each factor were generated based on the SPSA. The effective weights of each parameter were calculated with the SPSA based on the modified FR rates listed in Table 6.
The vulnerability index was obtained by multiplying the modified rates from the FR and weights derived from the SPSA. The derived vulnerability index from the FR-SPSA framework varied from 133 to 187, as visualized in Figure 6f.

3.7. Validation

The various proposed vulnerability indices (FR-DRASTIC, DRASTIC-Entropy, DRASTIC-SPSA, FR-Entropy, and FR-SPSA) were validated against nitrate measurements in the study area. We used two methods to validate the correlation between the proposed vulnerability framework and the nitrate concentration as an indicator of water quality. Table 7 lists the Pearson correlations and the grey relational analysis (GRA) results for each vulnerability index. A stronger correlation signifies a more effective groundwater vulnerability assessment. Notably, the FR-Entropy framework improved the Pearson correlation value to 0.85 compared to FR-SPSA as a subjective method with a correlation of 0.78 between the vulnerability index and the nitrate concentration.
Moreover, while the modification of the generic DRASTIC rating system increased the GRA correlation between the vulnerability and water quality indicator, the hybrid modification further enhanced the vulnerability assessment. The FR-Entropy index with a GRA value of 0.70 emerged as the most reliable framework to asses the Yasuj aquifer’s vulnerability among the proposed methods in this study.

4. Discussion

The overlay and index method has been employed for groundwater vulnerability assessment since the late 1980s. Despite various modifications and improvements, the method is not universally applicable to all hydrogeological conditions [
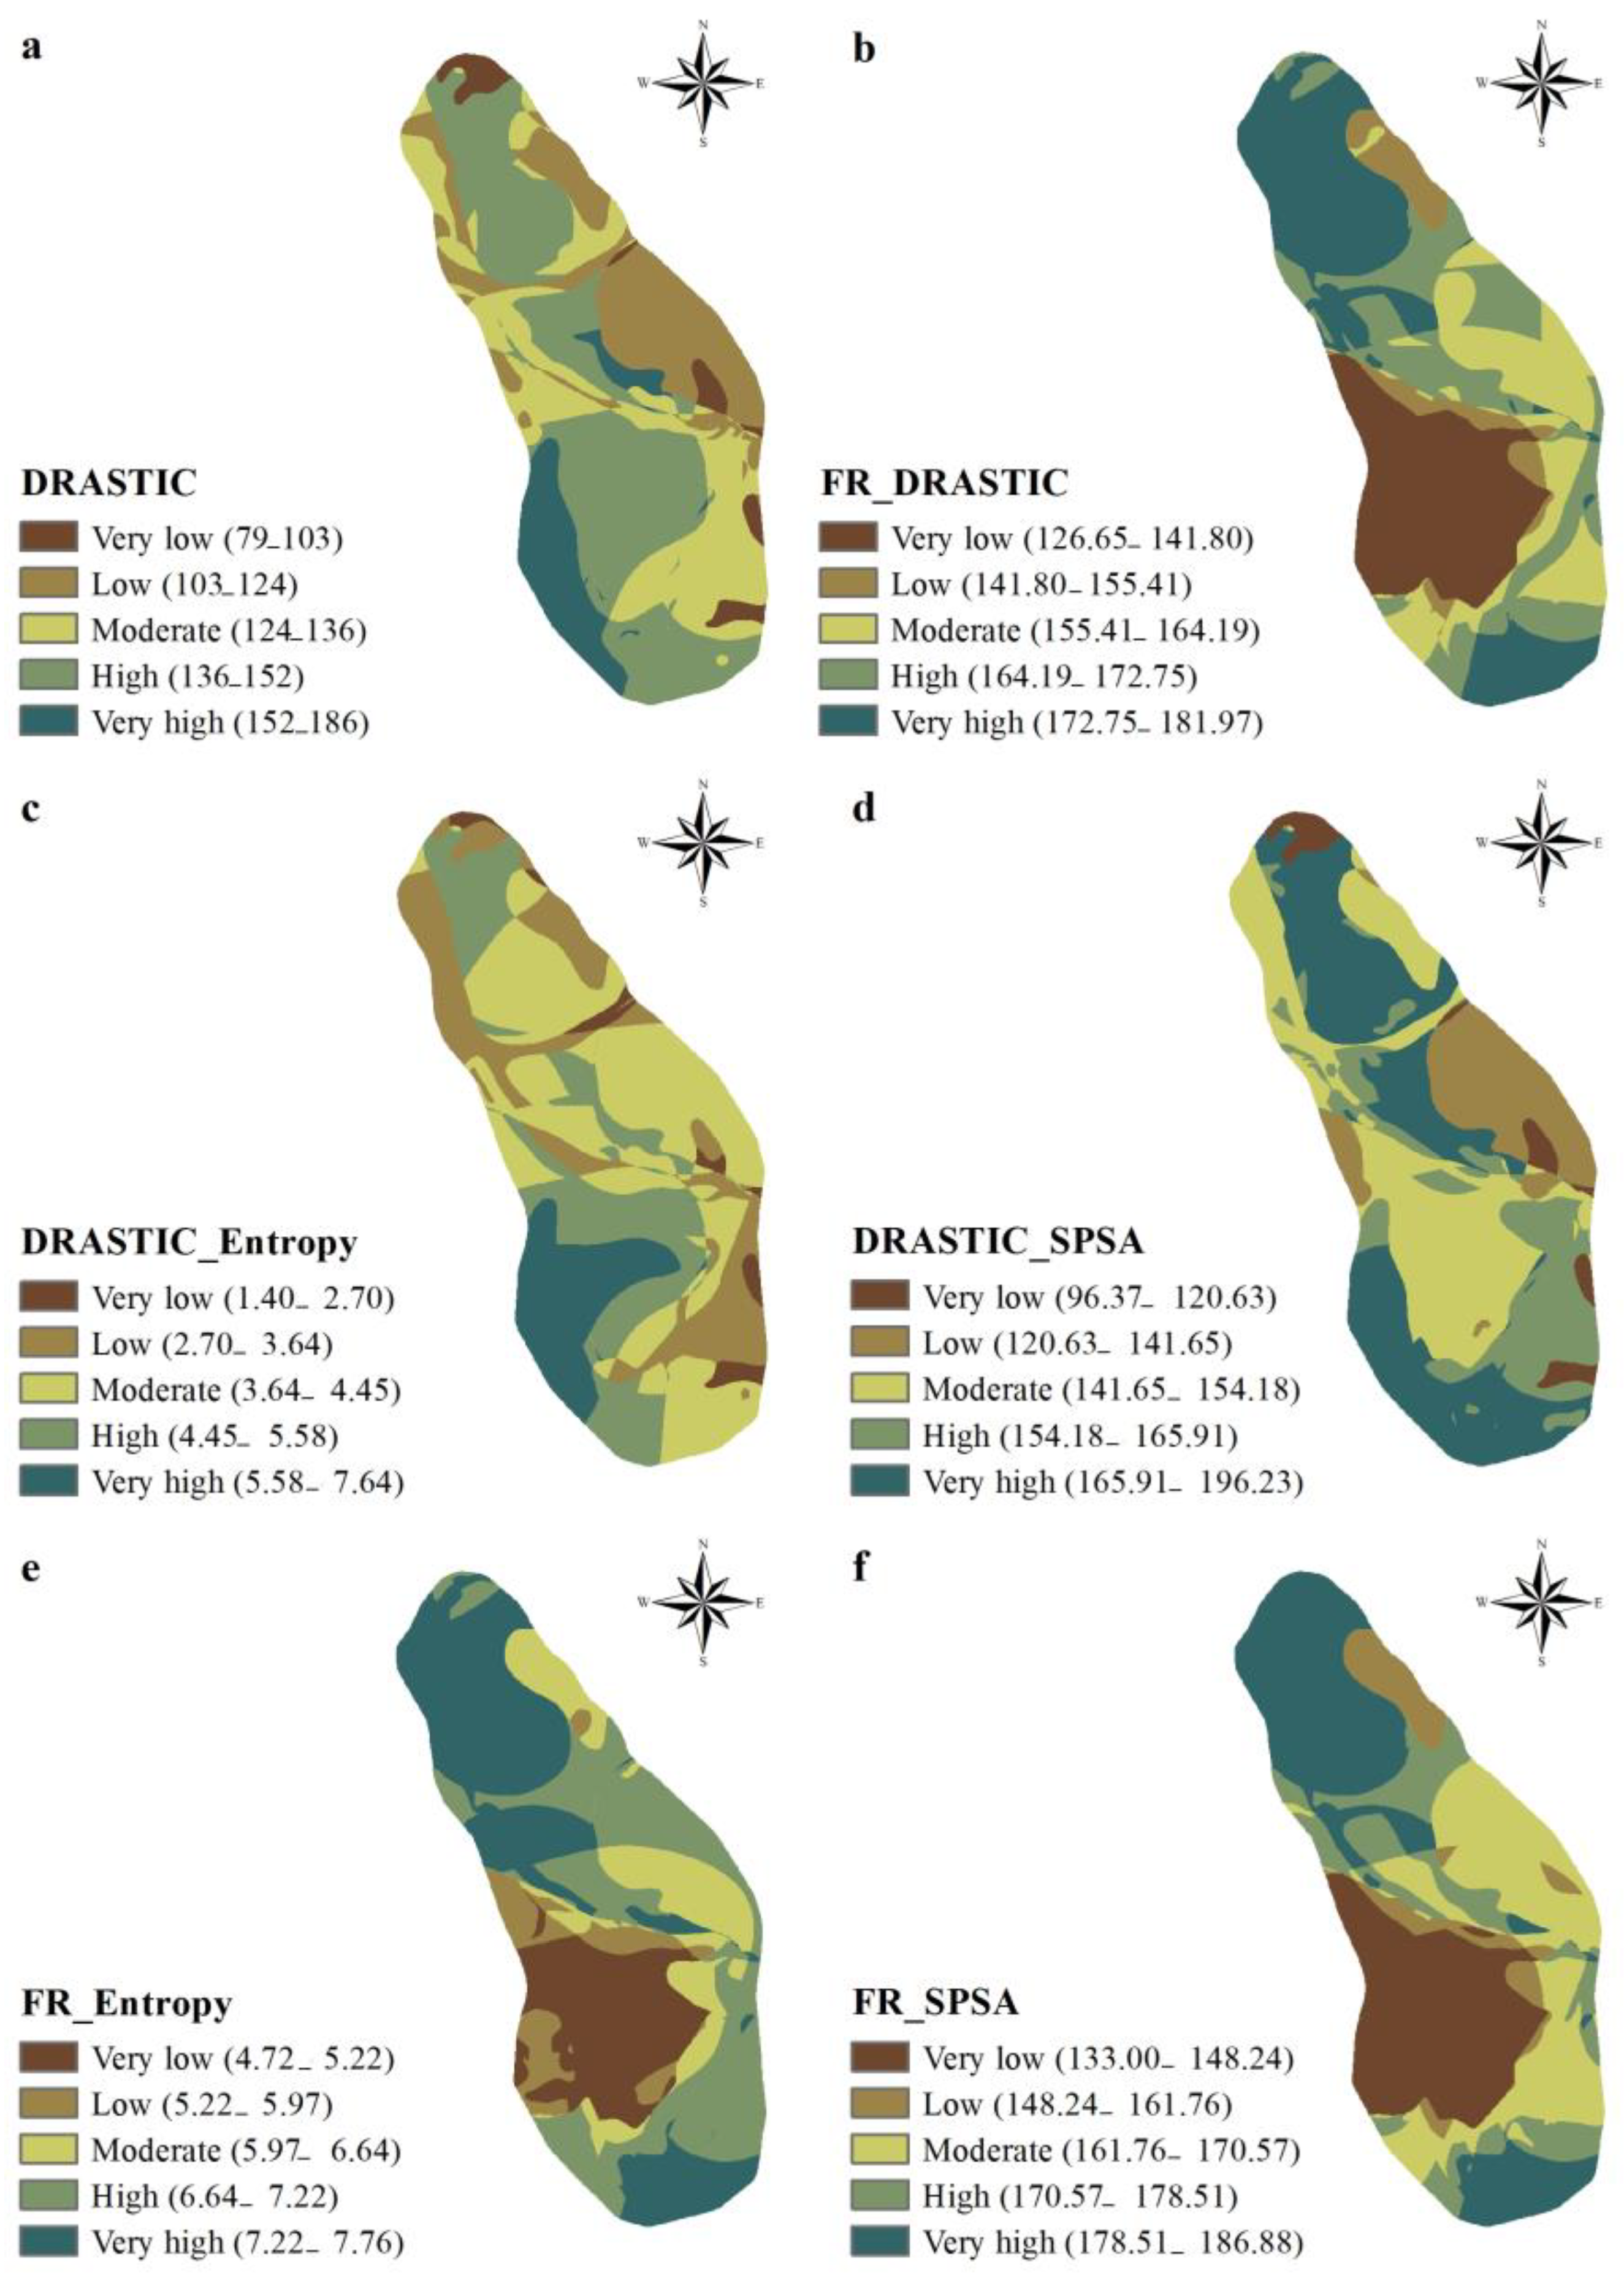
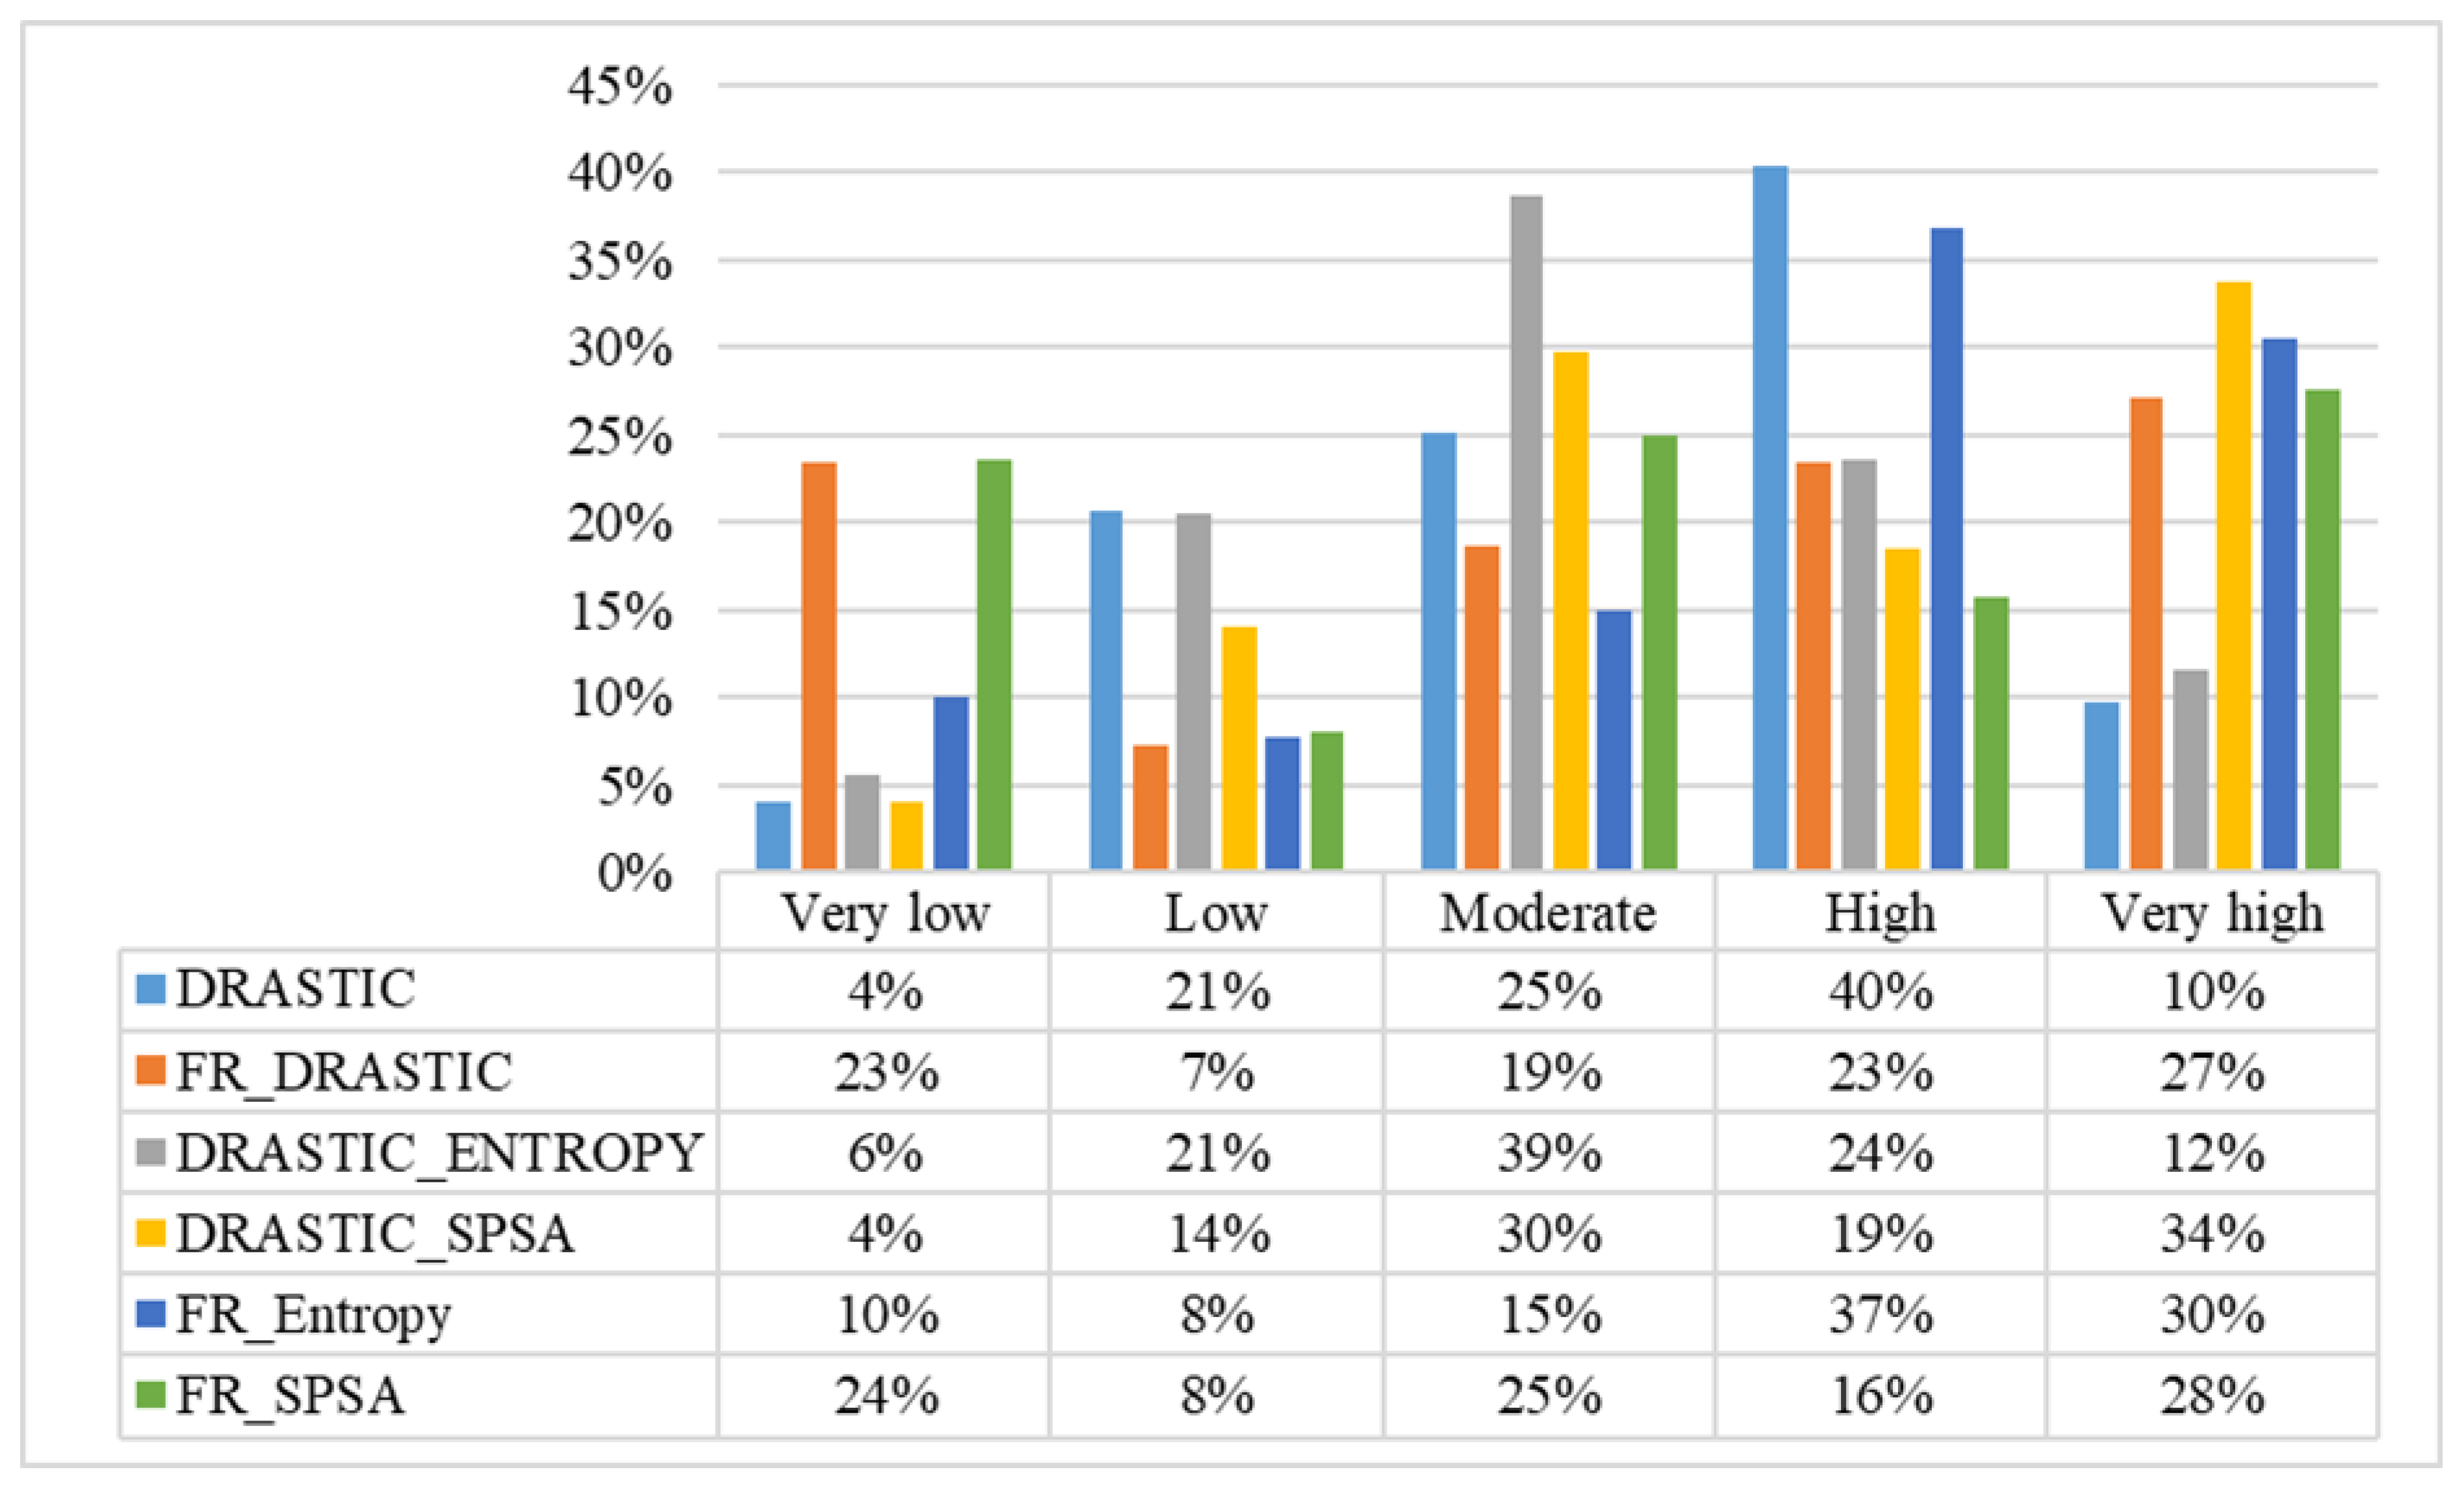
48]. As Figure 7 shows, the distribution of the vulnerability classes varies across the study area. The eastern region consistently shows low and moderate vulnerability with all modified methods. Figure 7 also displays the percentage distribution of the vulnerability classes across the presented frameworks. The vulnerability index calculated by the FR-Entropy method estimated a predominant part of the aquifer (37%) as highly vulnerable. This method also indicated that only 8% of the whole area falls into the “low” vulnerability bracket. From the FR-Entropy approach, the northwest, south, and north areas of the aquifer are in the region with “very high” potential for nitrate contamination. In contrast, the western region displays “very low” contamination vulnerability across the methods employing the FR rating system. This aligns with the observed concentrations and indicates the effectiveness of rate modification in the generic DRASTIC framework.
Previous research (e.g., [5,24,27]) suggests that not all seven original DRASTIC parameters equally influence groundwater vulnerability assessment. In the present study, the entropy weighting approach failed to identify the effect of the “impact of vadose media” parameter due to the uniform nature of the vadose zone throughout the region. As a consequence, this parameter was omitted from the calculation of the vulnerability index by the DRASTIC-Entropy and FR-Entropy methods. However, the vadose zone had a remarkable impact on the vulnerability assessment from the SPSA perspective (as seen in Table 5 and Table 6). The FR methodology is based on dividing the nitrate concentration ratio by the area ratio. When the unsaturated zone of the Yasuj aquifer consists of one seamless class, both the nitrate concentration and area have an average ratio of 1. In the case of parameter uniformity, the FR method was not able to assign a rate to a single-class parameter. The sensitivity analysis results, summarized in Table 6, emphasize the importance of the “impact of vadose media” as a pivotal factor. The unmodified “I” factor had an average effective weight of 25.4%, and thus, the highest weight was assigned to the “I” parameter among the seven factors of the DRASTIC framework. The “topography” parameter had an average effective weight of 5.0%, and sensitivity analysis indicated its minor effect on groundwater vulnerability assessment. Similarly, the lowest weight was calculated for the impact of the area’s topography by the entropy weighting method after the impact of vadose zone media.
Similar to our observations in this study, Sahoo, Sahoo [24] indicated that the uniformity of certain DRASTIC parameters may remove their contributions from the vulnerability assessment. In fact, removing some parameters from the vulnerability assessment process can improve the performance of the framework. The correlation results reveal that assigning weights to parameters using the entropy method provided a more reliable vulnerability index, even though the “I” factor was eliminated.
The comparison (Table 7) elucidates that the FR-Entropy method offered superior accuracy over other methods. These outcomes suggest that objective methodologies often surpass subjective methods in efficiency, similar to the findings from [12,27]. Additionally, the DRASTIC framework can be improved further by modifying the parameters’ rates based on the unique characteristics of the study area. A Pearson correlation value of 0.85 and a GRA value of 0.70 for the FR-Entropy method show the significance of using hybrid methods to improve the DRASTIC framework, as noted by [39].
Considering the study area’s agricultural status, it is important to recognize that the nitrate concentration over the plain might change over time. Further studies could benefit from collecting expansive data over time to assess, more comprehensively, nitrate contamination within the Yasuj plain. Moreover, the validity of the assessed vulnerability with the consideration of specific contaminants can be tested in other regions. Given the importance of groundwater, evaluating its potential contamination is essential for improving the conservation and protection of groundwater resources. This study proposes an efficient hybrid method to create a more reliable intrinsic vulnerability map, a necessary tool for monitoring potential groundwater contamination. Decision makers, environmental managers, and official planners can utilize these spatial approaches as a basis to produce sustainable policies, especially when it comes to potential groundwater contamination.
The present study focuses on examining the vulnerability assessment using overlay and index-based methods within a relatively small aquifer. In small aquifers, the homogeneity of geological characteristics of the study area (such as the uniformity of the vadose zone and topography in the present case study), can make traditional rating systems for the vulnerability parameters inefficient. The findings of this study reveal that contributing specific pollution to the groundwater vulnerability assessment using objective methods can reduce the generalization bias for smaller aquifers. This study underlines the critical need for further investigations in small aquifers with consistent characteristics to assess the influence of each DRASTIC parameter accurately.

5. Conclusions

To find an improved evaluation of the study area’s vulnerability, we suggest an enhanced DRASTIC framework. We compared this framework with five modified vulnerability indices, including FR-DRASTIC, DRASTIC-SPSA, DRASTIC-Entropy, FR-Entropy, and FR-SPSA. Validation revealed a noticeable improvement in the results based on the hybrid methods. Despite removing the “impact of vadose media” factor by the entropy method, SPSA showed a significant impact of this parameter on assessing the vulnerability index in the study area. However, the model performed better by calibration with an objective weighting method. The vulnerability maps indicate that the northwest, south, and north regions of the study area need more attention from decision makers and environmental planners to mitigate negative anthropogenic activities. Consequently, the groundwater quality in relatively highly vulnerable regions should be re-evaluated in an accurate way to control changing contaminant levels. This practice is vital to protect groundwater resources in the region intended for consumption. In areas with low and moderate vulnerability, land-use monitoring and strict rules on preventing loading pollution are essential. The highly vulnerable areas need urgent actions and policies to protect the groundwater resources from becoming contaminated.

Author Contributions

M.T.: conceptualization, material preparation, data collection, carrying out the results, and writing the first draft of the manuscript; A.N.: conceptualization, supervising, result interpretation, and editing of the manuscript; S.J.: conceptualization, results interpretation, and editing of the manuscript; H.Y.: conceptualization and result interpretation; R.B.: editing of the manuscript. All authors have read and agreed to the published version of the manuscript.

Funding

This research received no external funding.

Data Availability Statement

All data generated or analyzed during this study are confidential.

Acknowledgments

We acknowledge the support from the Strategic Research Area: The Middle East in the Contemporary World (MECW) at the Centre for Advanced Middle Eastern Studies, Lund University, Sweden.

Conflicts of Interest

The authors declare no conflict of interest.

References

  1. Van der Walt, I.J.; Jones, J.A.A.; Woo, M.-K. Introduction—Water Sustainability. Phys. Geogr. 2006, 27, 283–285. [Google Scholar] [CrossRef]
  2. Sinha, M.K.; Verma, M.K.; Ahmad, I.; Baier, K.; Jha, R.; Azzam, R. Assessment of groundwater vulnerability using modified DRASTIC model in Kharun Basin, Chhattisgarh, India. Arab. J. Geosci. 2016, 9, 98. [Google Scholar] [CrossRef]
  3. Sidibe, A.M.; Xueyu, L. Heavy metals and nitrate to validate groundwater sensibility assessment based on DRASTIC models and GIS: Case of the upper Niger and the Bani basin in Mali. J. Afr. Earth Sci. 2018, 147, 199–210. [Google Scholar] [CrossRef]
  4. Neshat, A.; Pradhan, B. Evaluation of groundwater vulnerability to pollution using DRASTIC framework and GIS. Arab. J. Geosci. 2017, 10, 501. [Google Scholar] [CrossRef]
  5. Kazakis, N.; Voudouris, K.S. Groundwater vulnerability and pollution risk assessment of porous aquifers to nitrate: Modifying the DRASTIC method using quantitative parameters. J. Hydrol. 2015, 525, 13–25. [Google Scholar] [CrossRef]
  6. Yang, J.; Tang, Z.; Jiao, T.; Muhammad, A.M. Combining AHP and genetic algorithms approaches to modify DRASTIC model to assess groundwater vulnerability: A case study from Jianghan Plain, China. Environ. Earth Sci. 2017, 76, 426. [Google Scholar] [CrossRef]
  7. Machiwal, D.; Jha, M.K.; Singh, V.P.; Mohan, C. Assessment and mapping of groundwater vulnerability to pollution: Current status and challenges. Earth Sci. Rev. 2018, 185, 901–927. [Google Scholar] [CrossRef]
  8. Aller, L.; Thornhill, J. DRASTIC: A Standardized System for Evaluating Ground Water Pollution Potential Using Hydrogeologic Settings; Robert, S., Ed.; Kerr Environmental Research Laboratory: Ada, OK, USA, 1987. [Google Scholar]
  9. Shrestha, A.; Luo, W. Assessment of Groundwater Nitrate Pollution Potential in Central Valley Aquifer Using Geodetector-Based Frequency Ratio (GFR) and Optimized-DRASTIC Methods. ISPRS Int. J. Geoinf. 2018, 7, 211. [Google Scholar] [CrossRef]
  10. Jaunat, J.; Garel, E.; Huneau, F.; Erostate, M.; Santoni, S.; Robert, S.; Fox, D.; Pasqualini, V. Combinations of geoenvironmental data underline coastal aquifer anthropogenic nitrate legacy through groundwater vulnerability mapping methods. Sci. Total. Environ. 2019, 658, 1390–1403. [Google Scholar] [CrossRef]
  11. Busico, G.; Kazakis, N.; Cuoco, E.; Colombani, N.; Tedesco, D.; Voudouris, K.; Mastrocicco, M. A novel hybrid method of specific vulnerability to anthropogenic pollution using multivariate statistical and regression analyses. Water Res. 2020, 171, 115386. [Google Scholar] [CrossRef] [PubMed]
  12. Torkashvand, M.; Neshat, A.; Javadi, S.; Yousefi, H. DRASTIC framework improvement using Stepwise Weight Assessment Ratio Analysis (SWARA) and combination of Genetic Algorithm and Entropy. Environ. Sci. Pollut. Res. 2021, 28, 46704–46724. [Google Scholar] [CrossRef] [PubMed]
  13. Saranya, T.; Saravanan, S. Assessment of groundwater vulnerability using analytical hierarchy process and evidential belief function with DRASTIC parameters, Cuddalore, India. Int. J. Environ. Sci. Technol. 2023, 20, 1837–1856. [Google Scholar] [CrossRef]
  14. Lakshminarayanan, B.; Ramasamy, S.; Anuthaman, S.N.; Karuppanan, S. New DRASTIC framework for groundwater vulnerability assessment: Bivariate and multi-criteria decision-making approach coupled with metaheuristic algorithm. Environ. Sci. Pollut. Res. 2022, 29, 4474–4496. [Google Scholar] [CrossRef]
  15. Saranya, T.; Saravanan, S. A comparative analysis on groundwater vulnerability models—Fuzzy DRASTIC and fuzzy DRASTIC-L. Environ. Sci. Pollut. Res. 2022, 29, 86005–86019. [Google Scholar] [CrossRef] [PubMed]
  16. Wu, H.; Chen, J.; Qian, H. A modified DRASTIC model for assessing contamination risk of groundwater in the northern suburb of Yinchuan, China. Environ. Earth Sci. 2016, 75, 483. [Google Scholar] [CrossRef]
  17. Kumar, A.; Krishna, A.P. Groundwater vulnerability and contamination risk assessment using GIS-based modified DRASTIC-LU model in hard rock aquifer system in India. Geocarto Int. 2020, 35, 1149–1178. [Google Scholar] [CrossRef]
  18. Kirlas, M.C.; Karpouzos, D.K.; Georgiou, P.E.; Theodossiou, N. A GIS-Based Comparative Groundwater Vulnerability Assessment Using Modified-DRASTIC, Modified-SINTACS and NV Index in a Porous Aquifer, Greece. Environments 2023, 10, 95. [Google Scholar] [CrossRef]
  19. Noori, R.; Ghahremanzadeh, H.; Kløve, B.; Adamowski, J.F.; Baghvand, A. Modified-DRASTIC, modified-SINTACS and SI methods for groundwater vulnerability assessment in the southern Tehran aquifer. J. Environ. Sci. Health Part A 2019, 54, 89–100. [Google Scholar] [CrossRef]
  20. Torkashvand, M.; Neshat, A.; Javadi, S.; Pradhan, B. New hybrid evolutionary algorithm for optimizing index-based groundwater vulnerability assessment method. J. Hydrol. 2021, 598, 126446. [Google Scholar] [CrossRef]
  21. Sarkar, M.; Pal, S.C. Application of DRASTIC and Modified DRASTIC Models for Modeling Groundwater Vulnerability of Malda District in West Bengal. J. Indian Soc. Remote Sens. 2021, 49, 1201–1219. [Google Scholar] [CrossRef]
  22. Nadiri, A.A.; Norouzi, H.; Khatibi, R.; Gharekhani, M. Groundwater DRASTIC vulnerability mapping by unsupervised and supervised techniques using a modelling strategy in two levels. J. Hydrol. 2019, 574, 744–759. [Google Scholar] [CrossRef]
  23. Pacheco, F.A.L.; Pires, L.M.G.R.; Santos, R.M.B.; Sanches Fernandes, L.F. Factor weighting in DRASTIC modeling. Sci. Total Environ. 2015, 505, 474–486. [Google Scholar] [CrossRef]
  24. Sahoo, M.; Sahoo, S.; Dhar, A.; Pradhan, B. Effectiveness evaluation of objective and subjective weighting methods for aquifer vulnerability assessment in urban context. J. Hydrol. 2016, 541, 1303–1315. [Google Scholar] [CrossRef]
  25. Siarkos, I.; Arfaoui, M.; Tzoraki, O.; Zammouri, M.; Hamzaoui-Azaza, F. Implementation and evaluation of different techniques to modify DRASTIC method for groundwater vulnerability assessment: A case study from Bouficha aquifer, Tunisia. Environ. Sci. Pollut. Res. 2023, 30, 89459–89478. [Google Scholar] [CrossRef]
  26. Liang, J.; Li, Z.; Yang, Q.; Lei, X.; Kang, A.; Li, S. Specific vulnerability assessment of nitrate in shallow groundwater with an improved DRSTIC-LE model. Ecotoxicol. Environ. Saf. 2019, 174, 649–657. [Google Scholar] [CrossRef]
  27. Khosravi, K.; Sartaj, M.; Tsai, F.T.-C.; Singh, V.P.; Kazakis, N.; Melesse, A.M.; Prakash, I.; Bui, D.T.; Pham, B.T. A comparison study of DRASTIC methods with various objective methods for groundwater vulnerability assessment. Sci. Total. Environ. 2018, 642, 1032–1049. [Google Scholar] [CrossRef]
  28. Hao, J.; Zhang, Y.; Jia, Y.; Wang, H.; Niu, C.; Gan, Y.; Gong, Y. Assessing groundwater vulnerability and its inconsistency with groundwater quality, based on a modified DRASTIC model: A case study in Chaoyang District of Beijing City. Arab. J. Geosci. 2017, 10, 144. [Google Scholar] [CrossRef]
  29. Nadiri, A.A.; Gharekhani, M.; Khatibi, R.; Sadeghfam, S.; Moghaddam, A.A. Groundwater vulnerability indices conditioned by Supervised Intelligence Committee Machine (SICM). Sci. Total. Environ. 2017, 574, 691–706. [Google Scholar] [CrossRef] [PubMed]
  30. Neshat, A.; Pradhan, B.; Pirasteh, S.; Shafri, H.Z.M. Estimating groundwater vulnerability to pollution using a modified DRASTIC model in the Kerman agricultural area, Iran. Environ. Earth Sci. 2014, 71, 3119–3131. [Google Scholar] [CrossRef]
  31. Iqbal, J.; Gorai, A.K.; Katpatal, Y.B.; Pathak, G. Development of GIS-based fuzzy pattern recognition model (modified DRASTIC model) for groundwater vulnerability to pollution assessment. Int. J. Environ. Sci. Technol. 2015, 12, 3161–3174. [Google Scholar] [CrossRef]
  32. Zenebe, G.B.; Hussien, A.; Girmay, A.; Hailu, G. Spatial analysis of groundwater vulnerability to contamination and human activity impact using a modified DRASTIC model in Elalla-Aynalem Catchment, Northern Ethiopia. Sustain. Water Resour. Manag. 2020, 6, 51. [Google Scholar] [CrossRef]
  33. Javadi, S.; Moghaddam, H.K.; Neshat, A. A new approach for vulnerability assessment of coastal aquifers using combined index. Geocarto Int. 2022, 37, 1681–1703. [Google Scholar] [CrossRef]
  34. Armin, M.; Majidian, M.; Kheybari, V.G. Land Use/Land Cover Change Detection and Prediction in the Yasouj City Suburbs in Kohgiluyeh Va Boyerahmad Province in Iran. Arid. Ecosyst. 2020, 10, 203–210. [Google Scholar] [CrossRef]
  35. Kadkhodaie, F.; Moghaddam, A.A.; Barzegar, R.; Gharekhani, M.; Kadkhodaie, A. Optimizing the DRASTIC vulnerability approach to overcome the subjectivity: A case study from Shabestar plain, Iran. Arab. J. Geosci. 2019, 12, 16. [Google Scholar] [CrossRef]
  36. Das, B.; Pal, S.C. Assessment of groundwater vulnerability to over-exploitation using MCDA, AHP, fuzzy logic and novel ensemble models: A case study of Goghat-I and II blocks of West Bengal, India. Environ. Earth Sci. 2020, 79, 104. [Google Scholar] [CrossRef]
  37. Bonham-Carter, G.F. Geographic information systems for geoscientists-modeling with GIS. Comput. Methods Geosci. 1994, 13, 398. [Google Scholar]
  38. Oh, H.-J.; Kim, Y.-S.; Choi, J.-K.; Park, E.; Lee, S. GIS mapping of regional probabilistic groundwater potential in the area of Pohang City, Korea. J. Hydrol. 2011, 399, 158–172. [Google Scholar] [CrossRef]
  39. Neshat, A.; Pradhan, B. An integrated DRASTIC model using frequency ratio and two new hybrid methods for groundwater vulnerability assessment. Nat. Hazards 2015, 76, 543–563. [Google Scholar] [CrossRef]
  40. Demir, G.; Aytekin, M.; Akgün, A.; İkizler, S.B.; Tatar, O. A comparison of landslide susceptibility mapping of the eastern part of the North Anatolian Fault Zone (Turkey) by likelihood-frequency ratio and analytic hierarchy process methods. Nat. Hazards 2013, 65, 1481–1506. [Google Scholar] [CrossRef]
  41. Pradhan, B.; Lee, S. Landslide susceptibility assessment and factor effect analysis: Backpropagation artificial neural networks and their comparison with frequency ratio and bivariate logistic regression modelling. Environ. Model. Softw. 2010, 25, 747–759. [Google Scholar] [CrossRef]
  42. Yu, C.; Zhang, B.; Yao, Y.; Meng, F.; Zheng, C. A field demonstration of the entropy-weighted fuzzy DRASTIC method for groundwater vulnerability assessment. Hydrol. Sci. J. 2012, 57, 1420–1432. [Google Scholar] [CrossRef]
  43. Shannon, C.E. A mathematical theory of communication. Bell Syst. Tech. J. 1948, 27, 379–423. [Google Scholar] [CrossRef]
  44. Li, G.-L.; Fu, Q.; Guoliang, L.; Qiang, F. Grey relational analysis model based on weighted entropy and its application. In Proceedings of the 2007 International Conference on Wireless Communications, Networking and Mobile Computing, Shanghai, China, 21–25 September 2007; IEEE: Piscataway, NJ, USA, 2007; pp. 5500–5503. [Google Scholar] [CrossRef]
  45. Chen, W.; Pourghasemi, H.R.; Kornejady, A.; Zhang, N. Landslide spatial modeling: Introducing new ensembles of ANN, MaxEnt, and SVM machine learning techniques. Geoderma 2017, 305, 314–327. [Google Scholar] [CrossRef]
  46. Zhao, J.; Ji, G.; Tian, Y.; Chen, Y.; Wang, Z. Environmental vulnerability assessment for mainland China based on entropy method. Ecol. Indic. 2018, 91, 410–422. [Google Scholar] [CrossRef]
  47. Napolitano, P.; Fabbri, A. Single-Parameter Sensitivity Analysis for Aquifer Vulnerability Assessment Using DRASTIC and SINTACS; IAHS Publications-Series of Proceedings and Reports-Intern Assoc Hydrological Sciences; IAHS Publications-Series of Proceedings and Reports-Intern Assoc Hydrological Sciences: Wuhan, China, 1996; Volume 235, pp. 559–566. [Google Scholar]
  48. Brindha, K.; Elango, L. Cross comparison of five popular groundwater pollution vulnerability index approaches. J. Hydrol. 2015, 524, 597–613. [Google Scholar] [CrossRef]
  49. Ouedraogo, I.; Defourny, P.; Vanclooster, M. Mapping the groundwater vulnerability for pollution at the pan African scale. Sci. Total. Environ. 2016, 544, 939–953. [Google Scholar] [CrossRef] [PubMed]
  50. Chen, S.-K.; Jang, C.-S.; Peng, Y.-H. Developing a probability-based model of aquifer vulnerability in an agricultural region. J. Hydrol. 2013, 486, 494–504. [Google Scholar] [CrossRef]
  51. Liu, J.; Zheng, H.; Zhang, Y.; Wei, H.; Liao, R. Grey Relational Analysis for Insulation Condition Assessment of Power Transformers Based Upon Conventional Dielectric Response Measurement. Energies 2017, 10, 1526. [Google Scholar] [CrossRef]
  52. Liu, S.; Forrest, J.Y.L. Grey Systems: Theory and Applications; Springer: Berlin/Heidelberg, Germany, 2010. [Google Scholar]
  53. Jenks, G.F. Optimal Data Classification for Choropleth Maps; Department of Geographiy, University of Kansas Occasional Paper: Kansas, MO, USA, 1977. [Google Scholar]
  54. Jenks, G.F.; Caspall, F.C. Error on choroplethic maps: Definition, measurement, reduction. Ann. Assoc. Am. Geogr. 1971, 61, 217–244. [Google Scholar] [CrossRef]
Figure 1. Flowchart of the proposed approach.
Water 15 03134 g001
Figure 2. Location of the study area and sampling points.
Water 15 03134 g002
Figure 3. Training samples and spatial distribution of nitrate concentration in the Yasuj aquifer.
Water 15 03134 g003
Figure 4. The distribution of each DRASTIC layer.
Water 15 03134 g004
Figure 5. Seven layers of the original and modified DRASTIC ratings using the FR approach.
Water 15 03134 g005
Figure 6. Groundwater vulnerability maps of Yasuj aquifer: (a) Generic DRASTIC, (b) FR-DRASTIC, (c) DRASTIC-Entropy, (d) DRASTIC-SPSA, (e) FR-Entropy, (f) FR-SPSA.
Water 15 03134 g006
Figure 7. The percentage of each vulnerability class.
Water 15 03134 g007
Table 1. Summary of subjective and objective weight modification methods used in DRASTIC.
ReferenceSubjective Weighting MethodsObjective Weighting Methods
Single-Parameter Sensitivity AnalysisFuzzyAnalytical
Hierarchy Process
EntropyGenetic AlgorithmWeights of Evidence
Sahoo, Sahoo [24]××××
Hao, Zhang [28]××××
Khosravi, Sartaj [27]×××××
Kadkhodaie, Asghari Moghaddam [35]×××××
Nadiri, Norouzi [22]××××
Noori, Ghahremanzadeh [19]×××××
Das and Pal [36]××××
Table 2. Sources of data used for parameter estimation in the DRASTIC method.
Data TypeSources
Hydrogeological dataMeteorological Organization of Kohgiluyeh
Geology mapGeological survey of IRAN
Soil mapSoil and Water Research Institute of Kohgiluyeh
TopographyWater Organization of Kohgiluyeh
Hydraulic conductivityWater Organization of Kohgiluyeh
Geological profileWater Organization of Kohgiluyeh
Groundwater balanceWater Organization of Kohgiluyeh
Sample wellsSurveyed in the study area using GPS technique
Table 3. Original rate/weights and modified rates for each DRASTIC layer based on the FR method.
ParameterRangeRateWeight% of Total Area (a)% of Nitrate (b)Frequency Ratio (b/a)Modified Rate
Groundwater depth (m)>301522.0724.051.096.37
23–30229.6635.491.207
15–23324.0123.300.975.68
9–15515.009.930.663.87
4.5–979.267.240.774.57
Net recharge (cm/year)0–51426.4623.470.894.45
5–10350.3760.211.206
10–18623.1716.320.703.53
Aquifer mediaMetamorphic igneous330.810.951.178.21
Weathered metamorphic igneous42.042.631.299
Massive sandstone639.4630.930.785.48
Gravel and sand822.0526.441.208.38
Basalt935.6439.041.107.65
Soil mediaClay1212.8914.871.1510
Clay loam317.9113.570.766.57
Loam519.4115.490.806.92
Sand1049.7956.071.139.77
Topography (Slope, %)>18110.630.761.209.63
12–1833.183.971.259.99
6–12513.5116.891.2510.00
2–6953.4555.201.038.27
0–21029.2323.190.796.35
Impact of vadose mediaGravel and sand851001001.008.00
Hydraulic conductivity (m/day)0.05–5132.853.581.2610.00
5–15212.7111.670.927.31
35–50622.9416.130.705.60
50–10086.975.080.735.80
>1001054.5263.541.179.28
Table 4. Modified weights of DRASTIC parameters based on the entropy method.
DRASTIC-EntropyFR-Entropy
ParametersEntropyModified WeightEntropyModified Weight
Depth of water0.9780.3920.99760.271
Net recharge0.9790.2880.99720.259
Aquifer media0.9970.0270.99790.146
Soil media0.9780.1520.99810.089
Topography0.9960.0140.99850.035
Impact of vadose media1.0000.0001.00000.000
Hydraulic conductivity0.9880.1280.99710.199
Table 5. Statistics of single-parameter sensitivity analysis (DRASTIC-SPSA).
ParametersTheoretical Weight (%)DRASTIC WeightModified WeightEffective Weight (%)
MinMaxMean
Depth of water21.7452.483.4728.4610.77
Net recharge17.3942.152.4119.679.36
Aquifer media13.0433.838.1123.0816.64
Soil media8.7022.261.4620.839.82
Topography4.3511.470.6911.496.39
Impact of vadose media21.7456.9523.1250.0030.21
Hydraulic conductivity13.0433.872.4425.4616.81
Table 6. Statistics of single-parameter sensitivity analysis (FR-SPSA).
ParametersTheoretical Weight (%)DRASTIC WeightModified WeightEffective Weight (%)
MinMaxMean
Depth of water21.7454.2011.8324.6718.26
Net recharge17.3942.878.7216.5712.47
Aquifer media13.0433.019.9517.9713.10
Soil media8.7022.507.6015.0310.86
Topography4.3511.163.567.205.04
Impact of vadose media21.7455.0021.9831.6925.43
Hydraulic conductivity13.0433.4110.9719.5814.84
Table 7. Pearson’s correlation coefficient and grey relational analysis results.
Vulnerability IndexPearson’s Correlation CoefficientGrey Relational Grade
Original DRASTIC0.220.48
DRASTIC-Entropy0.410.56
FR-DRASTIC0.740.61
DRASTIC_SPSA0.340.52
FR-SPSA0.780.63
FR-Entropy0.850.70
Disclaimer/Publisher’s Note: The statements, opinions and data contained in all publications are solely those of the individual author(s) and contributor(s) and not of MDPI and/or the editor(s). MDPI and/or the editor(s) disclaim responsibility for any injury to people or property resulting from any ideas, methods, instructions or products referred to in the content.

