1. Introduction
Climate change due to global warming leads to significant change in the rainfall pattern, as well as the increase of mean temperature. Higher rainfall intensity and localization are the typical patterns of rainfall under the climate change condition. In contrast, a longer drought period in a wider region is also expected [
1]. In the future, this ironic situation will become worse and worse [
2]. Simply put, water-related disasters are expected to increase, while the security and management of water resources is also becoming a very difficult task. These interesting phenomena are also fully explainable; in simple terms, the increase of mean temperature increases the capacity of water content in the atmosphere, but it is also true that rainfall occurrence by the cooling process can be more difficult. As a result, if it rains, more severe rainfall can occur, but the period without rain must be longer than that in the past [
3]. It is reported that the rainfall duration has shortened [
4] and localized [
5]. This changed rainfall pattern can increase the runoff in small and urban basins, but decrease the runoff in large basins, regardless of the increase of total rainfall amount.
Recently, droughts have become more frequent in Korea. The frequency of droughts in the 2010s is much higher than in previous decades. According to the National Drought Informational Portal (
https://www.drought.go.kr, accessed on 10 January 2023), the rainfall amount in the eastern part of the Korean Peninsula in 2012 was just 32% of the average level, and as a result, the dam water storage level was also recorded as lower than 30%. This drought was expanded the following year to the entire Korean Peninsula. The annual rainfall in the middle of the Korean Peninsula was about 50% of the average level, and for the entire Korean Peninsula, just 60%. Especially, in the Boryeong Dam basin located in the western part of the Korean Peninsula, the dam storage recorded a historic low of 18.9% in 2013. In the same year, the annual rainfall in the Han River basin was also the lowest in history and the second lowest in the Geum River basin [
6,
7]. Rather small droughts have also continued sporadically over the Korean Peninsula. The spring drought was severe in 2017 in the middle of the Korean Peninsula, and in the same year, the drought moved to the Kangwon Province in the eastern part of the Korean Peninsula. In 2022, both flood in the middle and drought in the southern parts of the Korean Peninsula occurred at the same time [
8,
9].
Decrease in the total runoff has also been observed in major river basins. As a result, drying streams and the invasion of vegetation into channels have been widely reported. Based on Lee et al. (2020) [
10], the minimum flow in a channel has decreased by about 10% since 1980. Lowered groundwater level, increased vegetation density, and increased evapotranspiration amount were the major reasons mentioned in the study. Kim and Kim (2019) [
11] also analyzed aerial photographs to evaluate the increase of vegetation area within river section, and reported that during the last 10 years, the vegetation area in Seom River, Chungmi Stream, and Naesung Stream has increased by 2 to 17 times. This change must be fundamentally due to global warming and related climate change.
As a countermeasure to this problem, cloud seeding is considered. This cloud seeding is especially important to alleviate the impact from drought. Cloud seeding is a method of artificially increasing rainfall [
12]. It can help to moisten the soil, vitalize the vegetation, and secure additional water resources [
13]. Seeding material is sprayed to enhance vapor condensation to make water droplets and to increase rainfall occurrence [
14]. Cloud seeding has been considered as a means of securing additional water resources in the 1950s and 1960s in several countries, like Thailand and Israel [
15,
16], and also in the 1990s in countries like the United States and Australia [
17,
18,
19]. In Korea, cloud seeding experiments started in 1963. During the droughts in the 1990s and 2000s, several experiments were also conducted as a possible countermeasure to drought [
20]. In the 2010s, cloud seeding research was expanded to include theoretical study, numerical modeling, field experiment with aircraft, and intensive ground observation for validation [
21]. In 2017, a new aircraft for cloud seeding was also introduced to support the practical application of weather modification techniques [
22].
The effect of cloud seeding has been proven in many countries. It must be dependent on the region of cloud seeding experiment, period, and applied techniques, but the overall increase of rainfall was reported to range 5−20%. In experiments in Wyoming, North Dakota, and California, an increase in rainfall of about 5−15% was reported [
18,
23,
24,
25,
26,
27]. In the regions of Adelaide, Tasmania, and New England in Australia, an increase in rainfall of about 5−30% was also reported [
28,
29,
30]. It was about 10−20% in Israel, about 20% in Jianxi Province, China, and about 27% in Karnataka, India [
27,
31,
32,
33]. Runoff increase due to cloud seeding was also evaluated by Yoo et al. (2022) [
13]. Their result was very positive that most of the increased rainfall contributed to increased runoff. This was mainly because the soil was already wet or saturated by the antecedent rainfall before the cloud seeding experiment. The optimal cloud seeding time was selected as the time when there was some antecedent rainfall, or when the soil moisture was very high. As a result, the loss of rainfall could be minimized in the rainfall–runoff analysis.
However, there are also many other issues like benefit–cost, environmental impact, societal responses, etc. [
12,
34]. More fundamentally, it is also true that the water use or water supply is a somewhat different issue from the increase of rainfall or runoff. This is because the water is generally collected by dam basins. The usefulness of secured water resources by cloud seeding can differ depending on the size of dam basin area and volume of the dam reservoir. It is also important to consider that the water resources in a dam reservoir are distributed by a given rule that differs widely dam-by-dam. A small dam with small dam basin area can be effective if the increased rainfall can be collected fully by the dam basin. If the spatial variability is high, a rather large dam basin area can be positive for cloud seeding. If the planned water supply is small, just a small increase of rainfall could be enough. Depending on these various characteristics of dam basin area, dam reservoir, dam operation, planned water supply, etc., the effectiveness of cloud seeding can vary widely.
This study aims to show that the effectiveness of cloud seeding is highly dependent on the dam and dam basin characteristics. This study selects three dam basins located in the western part of the Korean Peninsula to evaluate cloud seeding from the point of view of water supply. To achieve this study objective, the following three evaluations are carried out. First, the collection efficiency of increased rainfall in those three dam basins is compared. That is, how much rainfall can additionally be received is evaluated. Second, additional runoff volumes by cloud seeding are compared. Depending on the basin characteristics, like the soil, land use, and vegetation, the runoff volume can vary. In particular, if the evapotranspiration amount is large, the basin is disadvantageous for securing addition water resources. Finally, by considering the dam reservoir operation and planned water supply, the change in water supply is evaluated. Cloud seeding can be a huge contribution in one dam, but just small in other dams. The results derived in this study emphasize that cloud seeding should be planned to consider every possible aspect from collection to distribution of the additional water resources.
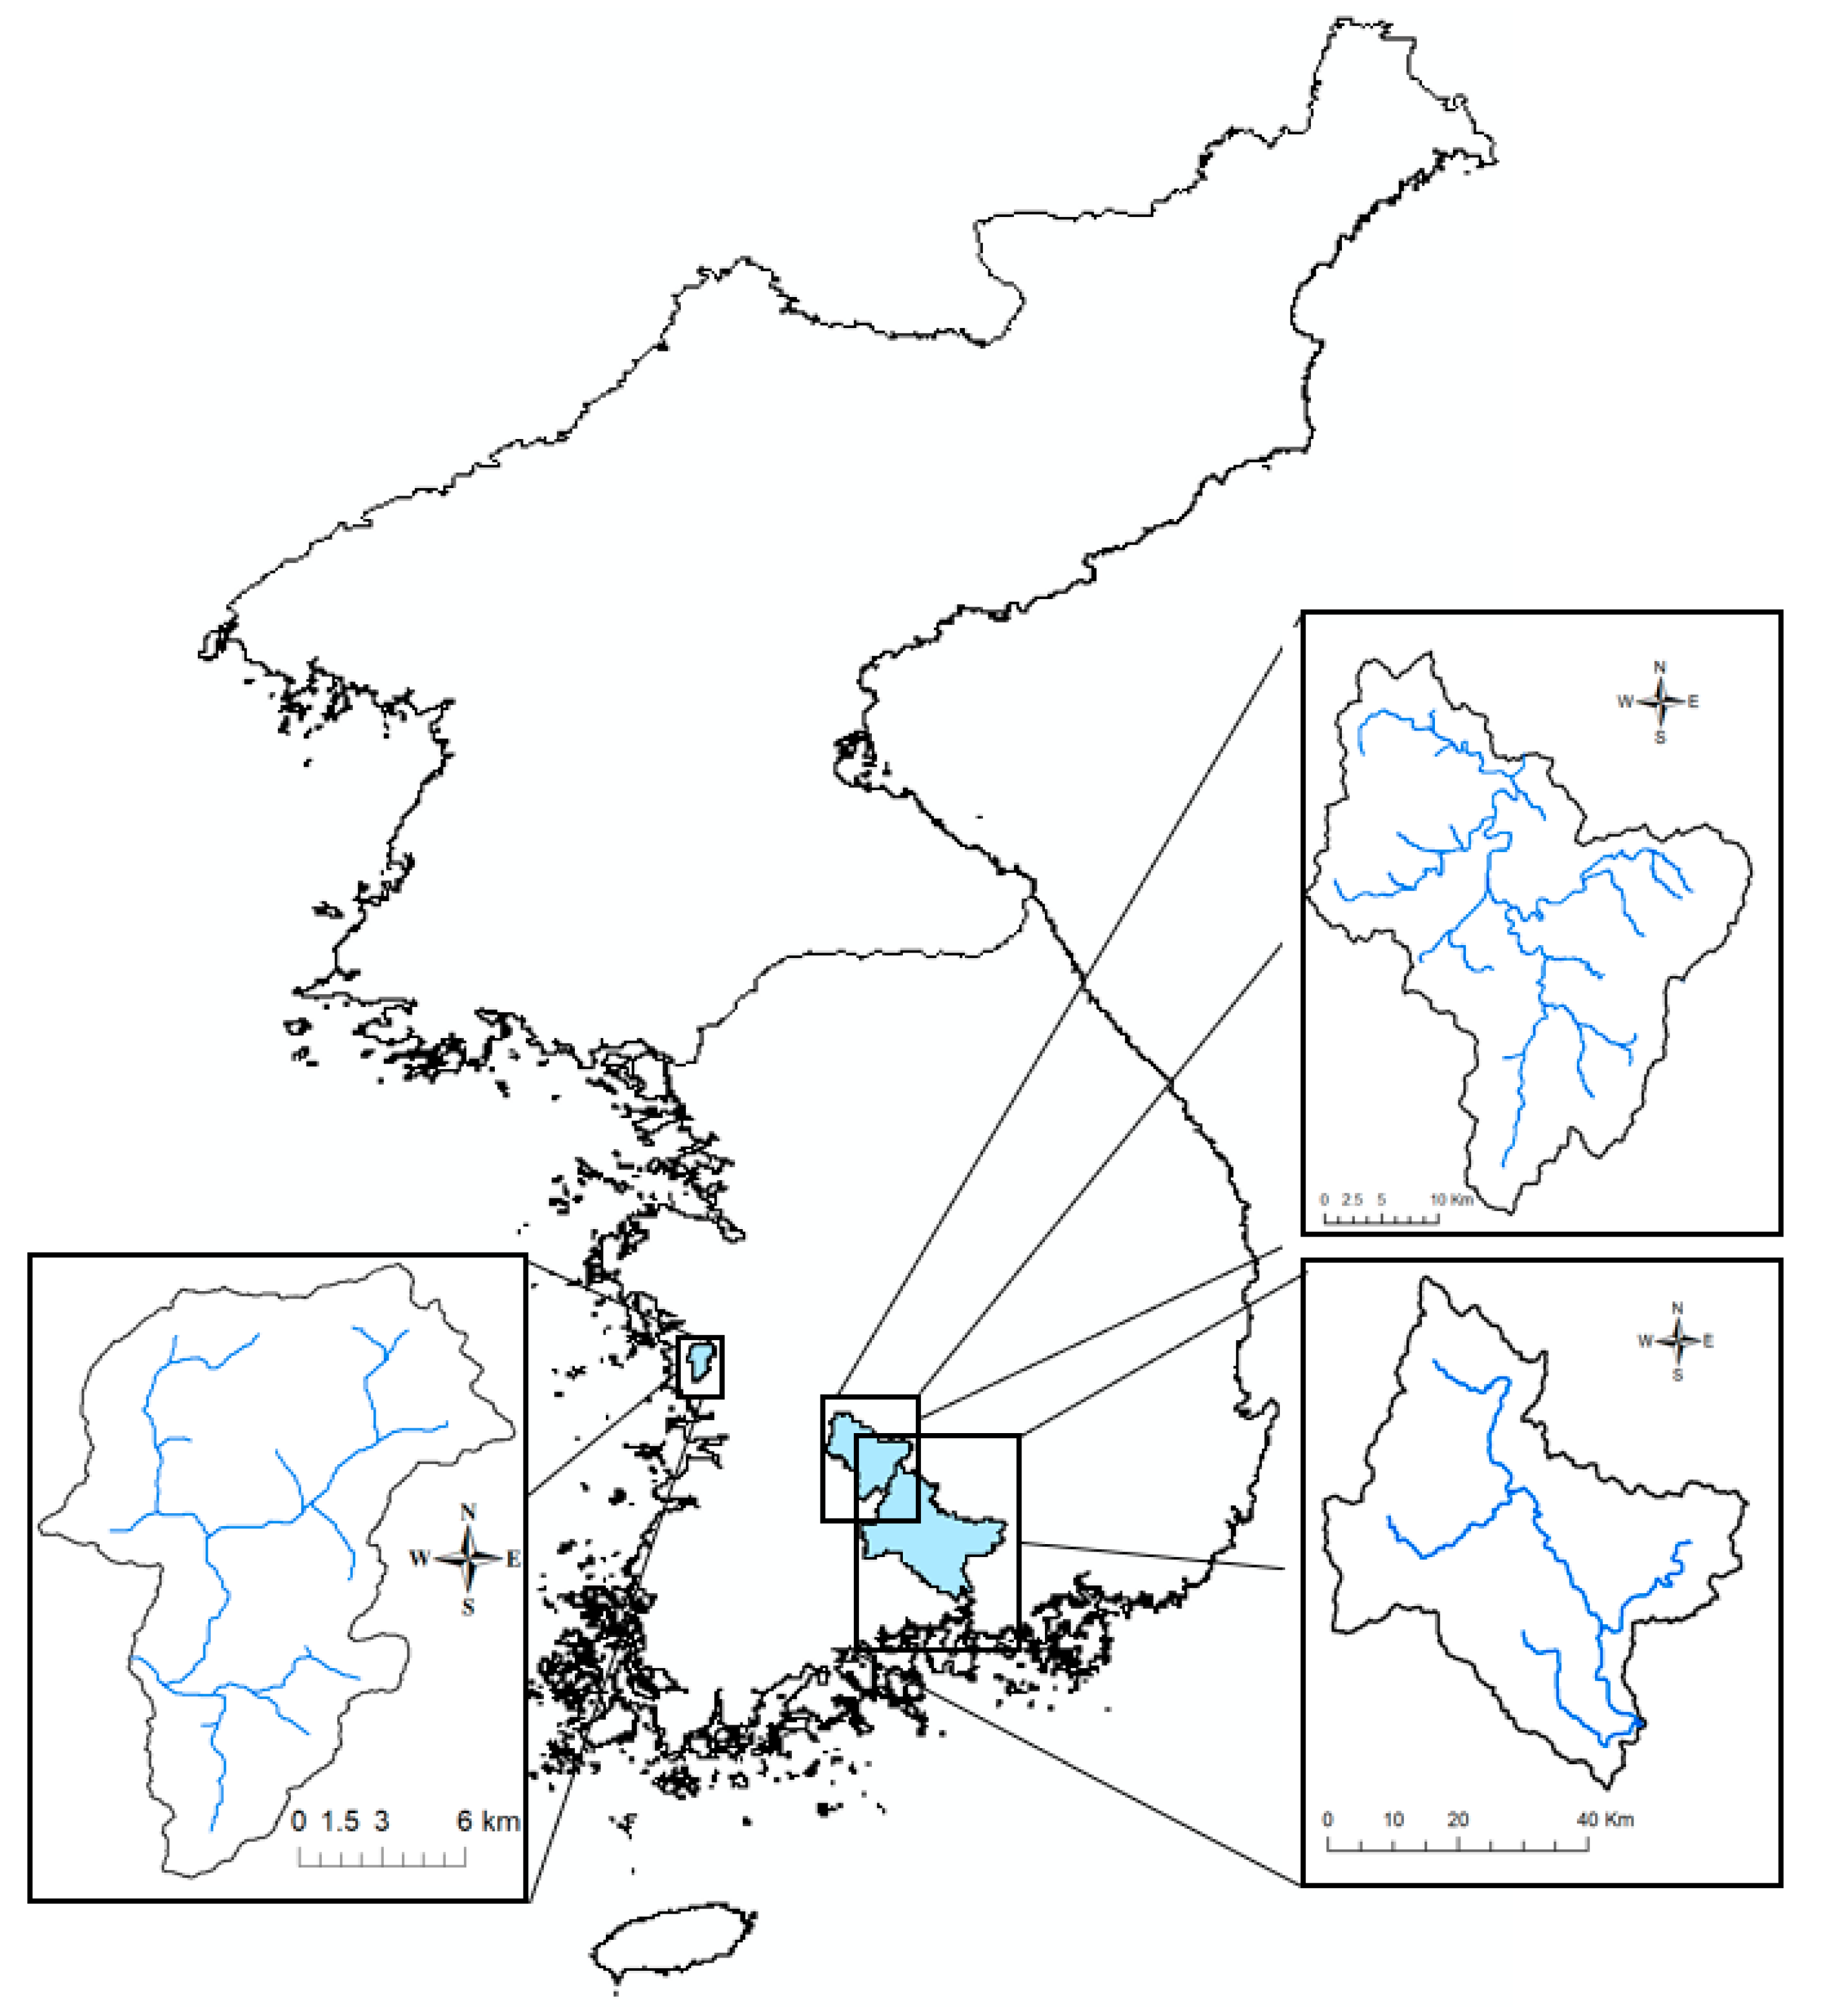
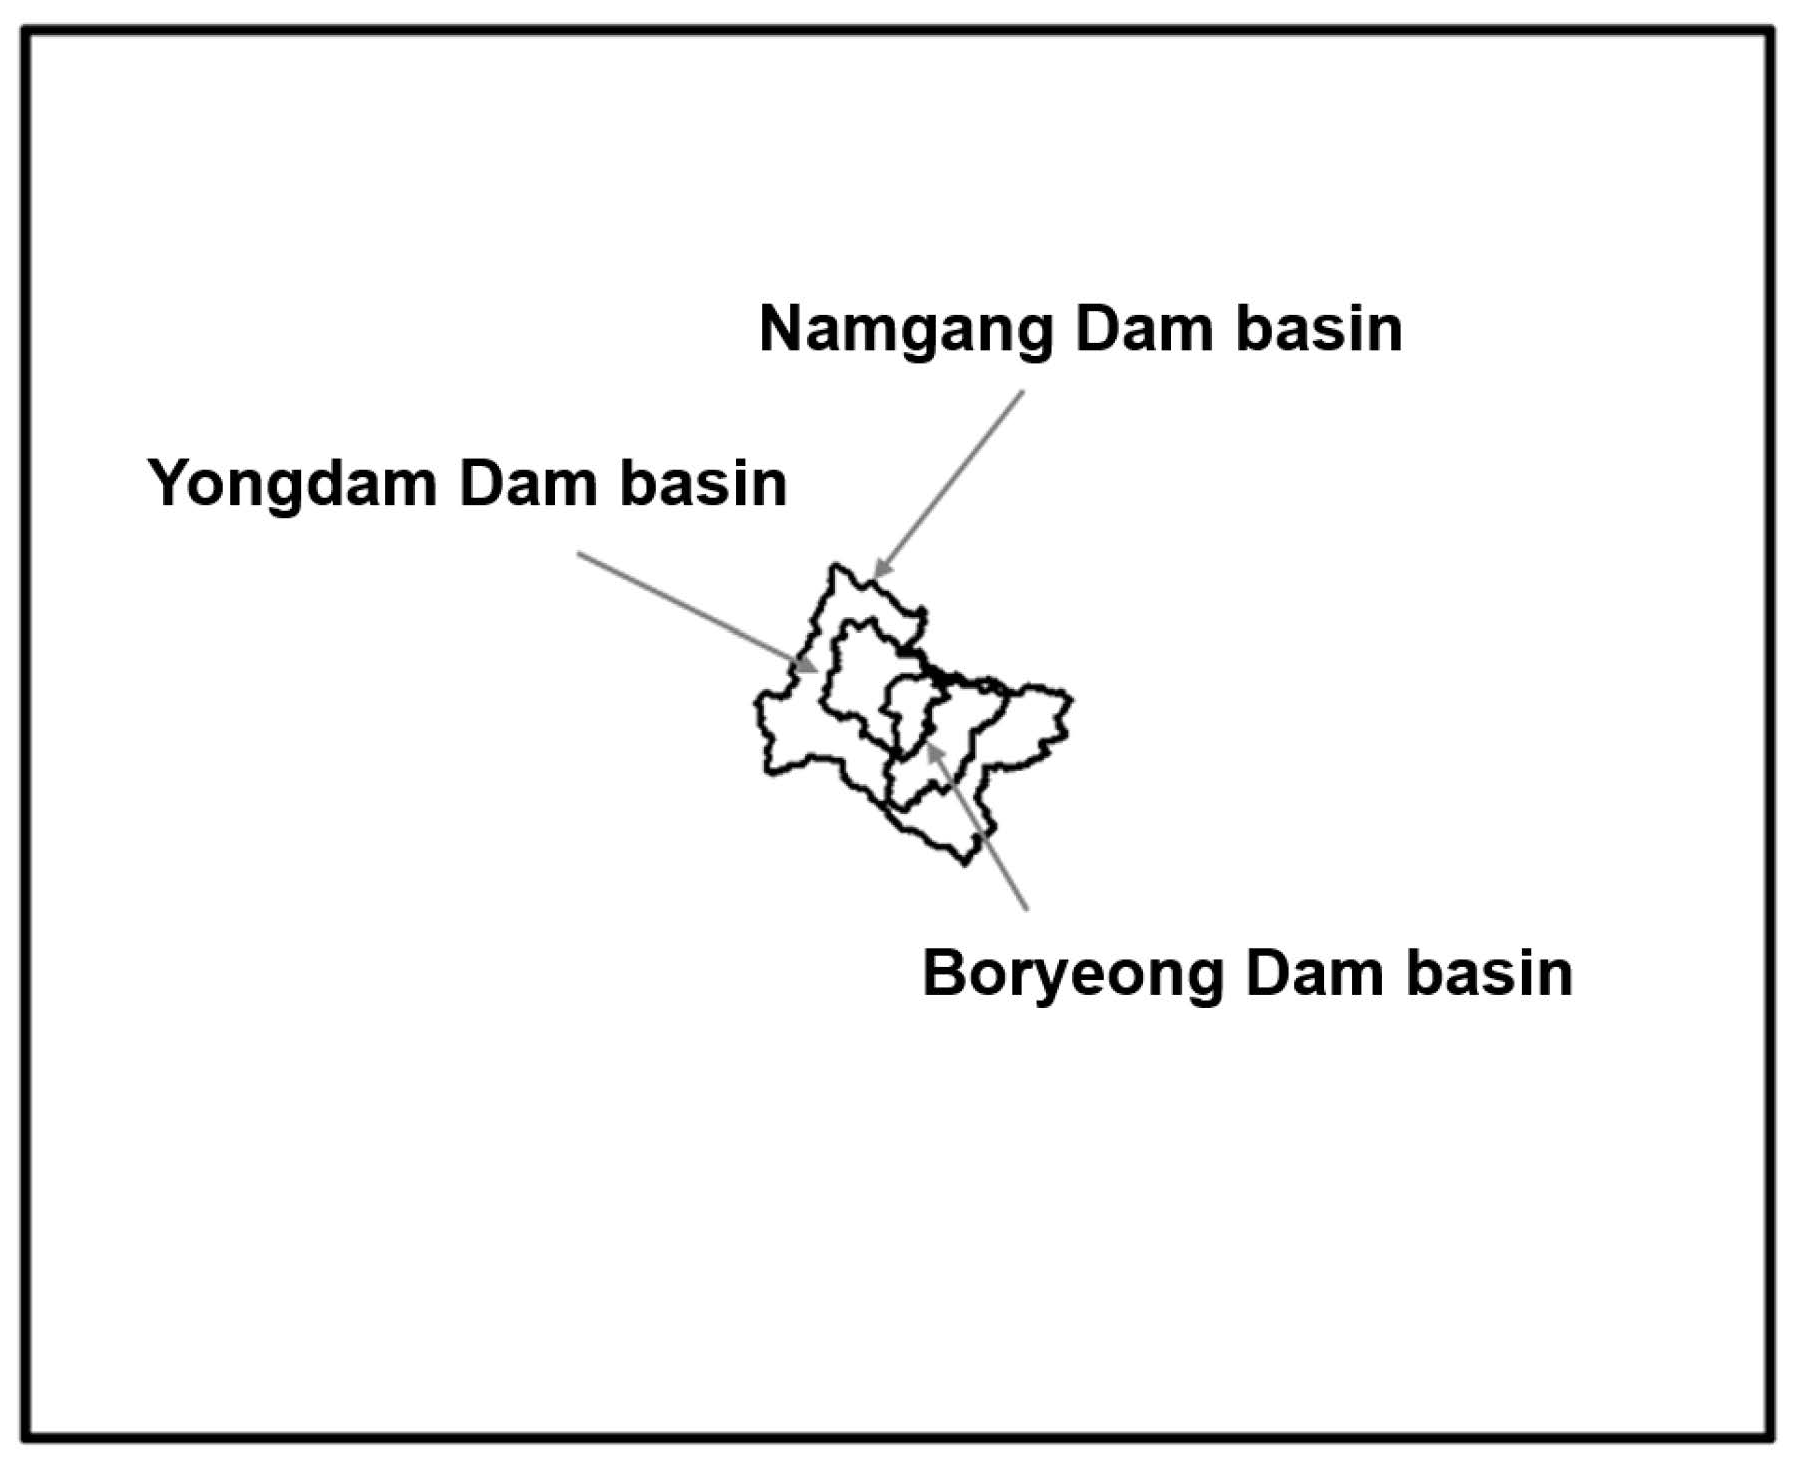
2. Three Dam Basins in Korea
Three dam basins located in the western part of the Korean Peninsula were considered in this study (
Figure 1). These are the Boryeong Dam, Yongdam Dam, and Namgang Dam basins. The Boryeong Dam basin is the most northerly of these three dam basins. Boryeong City is also located within the Boryeong Dam basin. The basin area of the Boryeong Dam is just 163.6 km
2, rather smaller than other multi-purpose dams in Korea. The water resources secured by Boryeong Dam are also small, thus making it vulnerable to drought. In particular, in 2015, the water reserve rate in the Boryeong Dam reservoir receded to an historic low level of just 18.9%. This water storage was far less than the 50% of a normal year [
35]. As a counter measure to the drought, an emergency waterway was introduced to supply water to this dam from the nearby Geum River. This waterway can cover about 50% of the water supply capacity from the Boryeong Dam [
36].
Yongdam Dam is located in the upstream part of the Geum River. Its basin area is 930.0 km
2, much larger than that of the Boryeong Dam basin. In the same year, 2015, the water storage of Yongdam Dam also receded to be just 25.4%, due to the small annual rainfall of 877.6 mm in the basin. This amount of rainfall was just 67.5% of the normal year’s rainfall of about 1300 mm [
37]. Namgang Dam is located on the Nam River, the largest tributary of the Nakdong River. Of the three dams, Namgang Dam is located in the southernmost part of the Korean Peninsula. The basin area of the Namgang Dam is 2285 km
2, which is very large, covering 9.6% of the entire Nakdong River basin. In particular, Namgang Dam basin is frequently affected by monsoons and typhoons, and its annual rainfall, a bit higher than 1400 mm, is also the highest of the three dam basins. However, in 2022, the rainfall amount until July 17 was recorded as just 325.4 mm (about 23% of the annual rainfall), then the water storage in the Namgang Dam receded to be just 21.9% [
38].
Figure 2 compares the daily rainfall time series for those three dam basins from 2018 to 2020. This figure shows that the overall patterns of rainfall are similar to each other. However, the annual rainfall amounts differ somewhat. Boryeong Dam basin in the northernmost location of the three dam basins shows the smallest annual rainfall, while Namgang Dam basin in the southernmost location shows the highest. The annual rainfall in Yongdam Dam basin lies between the two. However, in 2018 and 2019, the annual rainfall in Yongdam Dam basin was closer to that in Boryeong Dam basin, and in 2020 and 2021, it was closer to that in the Namgang Dam basin. In those four years, the annual rainfall in the Boryeong Dam basin was around 1000 mm, but was 1400 mm in the Yongdam Dam basin and 1600 mm in the Namgang Dam basin. In all three basins, the variation of annual rainfall was found to be very high, with standard deviations of 200 mm or more. Even though there was high variation of annual rainfall, their order was not reversed.
Figure 3 shows the overall characteristics of the three basins. Yongdam Dam basin is located in a high land area, but Boryeong Dam and Namgang Dam basins are located in low land areas near the sea. All three dam basins are mostly covered in forest, along with some farmland, paddy fields, and small urban areas. As most dam basins in Korea are strictly protected to secure clean water, it is not easy to develop an urban area within a dam basin. The soil composition in all three dam basins is also similar. The portion of loam (brownish brown in the figure) is much higher than that of sand (brown) or silt (light brown). Some rock area is also noticeable in the Yongdam Dam basin.
Table 1 summarizes the characteristics of those three dam basins and their land use. As can be seen in this table, the basin area is very different from each other. The Boryeong Dam basin is the smallest, and the Namgang Dam basin is the largest. However, other characteristics are similar. Their basin slopes and shape factor are similar. Also, their land use pattern is similar. About 80% of the dam basin is forest, and paddies and farms cover 15 to 20%. The percentage of urban land use is relatively small in a dam basin, as the urban development is strictly controlled to secure the clean water in Korea.
As mentioned in the previous paragraphs, the three dam basins are mostly covered by forest. Coniferous trees, like pitch pine (colored turquoise in the vegetation map of
Figure 3) and nut pine (greenish brown), are quite common, along with deciduous trees like oak (light green). It is also found that mixed forest (bright light green) is significant in the Boryeong Dam basin. These differences in the types of trees and their composition affect the evapotranspiration in each basin. In particular, in Boryeong Dam and Yongdam Dam basins, the portion of needle leaf trees, like pitch pine, nut pine, and larch, is higher than that in Namgang Dam basin [
39]. In fact, these three trees are known to have high transpiration rates [
40]. As a result, it can be expected that the evapotranspiration amounts in Boryeong Dam and Yongdam Dam basins must be higher than that in Namgang Dam basin.
Table 2 summarizes the specifications of each dam. First, Boryeong Dam was built to provide domestic and industrial water. The construction was started in 1991 and ended in 2000. As Boryeong Dam was built mostly for water supply, its flood control ability is small, with flood control capacity of just 10.0 × 10⁶ m
3 [
41]. Construction of Yongdam Dam was begun in 1990, and completed in 2001. The dam reservoir capacities of the Yongdam dam are known to be comparable to other multi-purpose dams in Korea, considering the basin area [
42,
43].
Namgang Dam has a long history. Construction of this dam was started in 1936, but was interrupted by the Second World War. Its construction was resumed in 1962 and ended in 1969. The size of this dam was increased by reinforcement work during the 10-year period of 1989−1999. However, the total storage capacity and effective storage capacity of the dam are still not large at just 309.2 and 299.7 × 10⁶ m
3, respectively. On the one hand, if considering the basin area, these capacities are particularly small. On the other hand, the planned annual water supply of Namgang Dam is rather high at 573.3 × 10⁶ m
3; also, the flood control capacity is high at 269.8 × 10⁶ m
3. To secure this flood control capacity, the flood water level is reduced by 5 m during the summer rainy season. This new flood water level during the flood season is called the restrictive water level in Korea [
44].
5. Contribution of Cloud Seeding to Securing Additional Water Resources
5.1. Rainfall–Runoff Analysis Using the PRMS Model
The rainfall–runoff model used in this study is the Precipitation Runoff Modeling System (PRMS) model. The PRMS model is a long-term runoff model developed by the United States Geological Survey (USGS) [
48]. With this model, it is possible to simulate various components of the hydrologic process, such as interception, infiltration, effective rainfall, direct runoff, subsurface runoff, and groundwater runoff.
Runoff simulation is performed by dividing a basin into hydrological response units (HRU), with each unit being an area with homogeneous topographic characteristics, such as slope, elevation, vegetation distribution, and soil type. By dividing the basin into HRUs, the hydrologic process for each sub-basin can be evaluated separately. The runoff simulation result for the entire basin is derived by combining the runoff simulation results performed by each HRU.
The major input data to the PRMS model include the meteorological data, like precipitation, maximum and minimum temperatures, solar radiation, and evaporation. Daily precipitation is corrected by the precipitation correction factor for each HRU, and the correction factor is determined by considering the characteristic of precipitation. In the case of the maximum and minimum temperature data, the spatially interpolated value is used according to the elevation difference between the weather station and the HRU. Solar radiation can be calculated directly from the model using information such as latitude, longitude, and temperature. Temperature and solar radiation are used to simulate processes such as evaporation, transpiration, sublimation, and snowmelt.
The three dam basins, the Boryeong Dam, Yongdam Dam, and Namgang Dam basins, considered in this study have different basin areas. Thus, sub-basin division was also performed differently by considering the basin area and channel network. In Korea, 250 km
2 is generally considered as the criteria for sub-basin division [
49]. First, due to its small size, the Boryeong Dam basin was considered as a single basin. The Yongdam Dam basin, with its basin area of 930.0 km
2, was divided into four sub-basins. Finally, the Namgang Dam basin, which has the largest basin area of 2285.0 km
2, was divided into a total of 10 sub-basins. Each sub-basin was assumed to represent each HRU in this study.
Parameters of the PRMS model are determined by analyzing the topographical, soil, land use, and vegetation data of the basin. The PRMS model contains two types of parameters: easy-to-estimate parameters (EEPs), and difficult-to-estimate parameters (DEPs). The EEPs are mostly related to interception, surface runoff, and the behavior of water within the soil. These are determined rather easily using the available basin characteristics. In contrast, the DEPs are related to evapotranspiration, surface runoff, behavior of water in soil, and behavior of groundwater. Generally, the DEPs are difficult to estimate directly using the available data. These parameters are generally determined empirically, or by applying the concept of optimization. For the initial values of these parameters, it is possible to use the suggested values by the PRMS model, or it is also possible to consider other parameters determined in other basins with similar basin characteristics.
In this study, the EEPs were determined directly with the available data of basin characteristics. Also, the initial estimates of DEPs were determined by considering existing study in Korea, the Hydrological Survey Report of Geum River Basin [
50]. The Rosenbrock technique was applied in the optimization procedure, which is a built-in method of the PRMS model. The dada observed in 2017 were used for parameter estimation, while the data collected from 2018 to 2019 were used for parameter validation.
Figure 8 compares the observed and simulated runoff by the PRMS model with the parameters having finally been determined. These results are also found in line with previous studies [
51]. Also,
Table 4 summarizes this comparison between simulated and observed runoff hydrographs.
As can be seen in
Table 4, the rainfall–runoff analysis for the three basins was conducted properly. In the case of Boryeong Dam basin, the observed and simulated mean runoffs are 3.6 and 3.5 m
3/s, respectively. The difference in other statistics was the same to be within 10%. Generally, less than 10% difference is proof of an acceptable simulation result [
46]. Even in the cases of the Yongdam Dam and Namgang Dam basins, the differences between the simulated and observed statistics were all found to be within 10%. However, the RMSEs for all three dam basins were still high at 8.0, 44.9, and 93.8 m
3/s, respectively. These high RMSEs were mostly from the difference in the rainy season, when the variation of runoff was very high.
5.2. Analysis of Increased Runoff
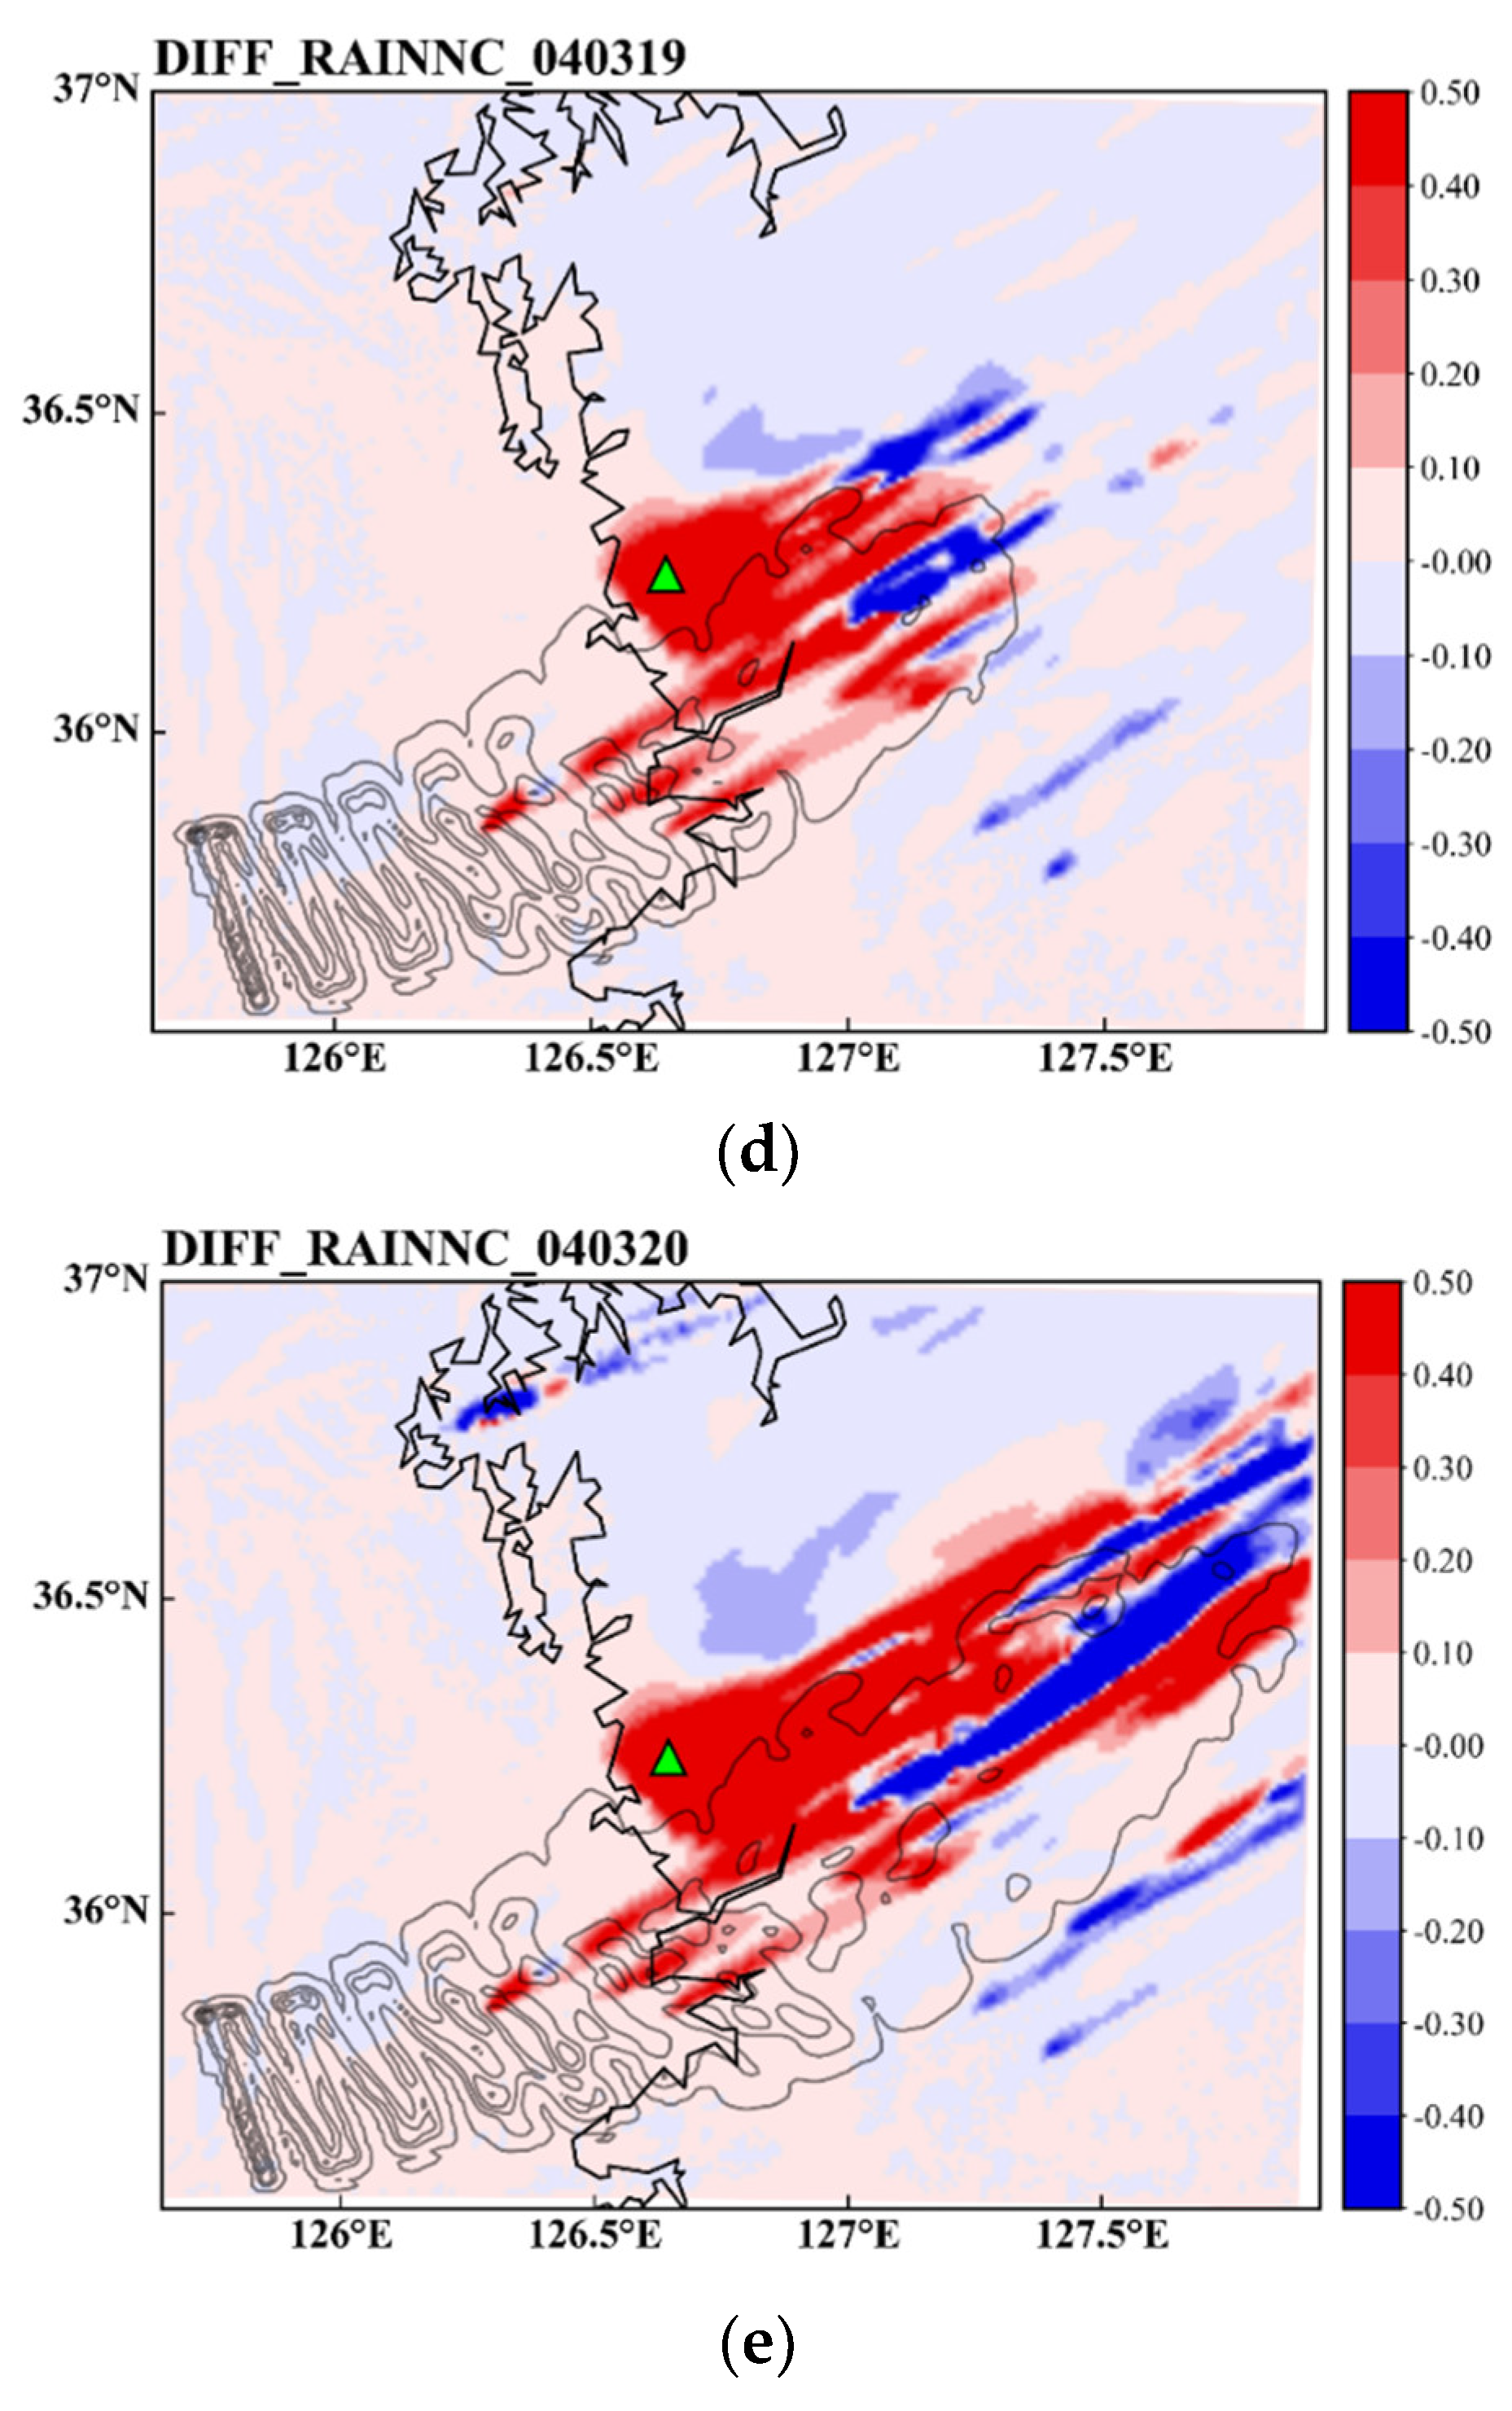
5.2.1. Application of Simulated Rainfall by the WRF−ARW
The rainfall–runoff analysis with the PRMS model was performed for the years 2018−2021 in all three dam basins. First, the observed rainfall and temperature data were used as input, and the resulting runoff was compared with the observed data at the exit of the basin. Additionally, the cloud seeding result (i.e., increased portion of rain rate) was considered in the same rainfall–runoff analysis, and a new runoff result derived. These two runoff results were then compared as the unseeded case (UNSD) and seeded case (SEED). As the simulated rainfall of both SEED and UNSD cases is distributed over the dam basin, the rain gauge density did not give any effect on the simulation result. Also, the simulated rainfall data were averaged over the basin or sub-basin to be used as input to the PRMS model. Thus, their spatial variability within the basin or sub-basin did not give any significant effect on the runoff result.
Table 5 shows various runoff components, i.e., baseflow, interflow, direct runoff, and total runoff, simulated for those years 2018−2021, respectively. Here, the baseflow indicates the flow from the groundwater and the interflow the flow from the three soil layers in the PRMS model. The direct runoff indicates the runoff due to effective rainfall [
45]. The first thing to notice in this table is that the runoff increase rate is higher than the rainfall increase rate. In the Yongdam Dam and Namgang Dam basins, the runoff increase rate was about two times or more than the rainfall increase rate. A similar result was also found in Yoo et al. (2022) [
12], who mentioned that this result was mainly due to the far smaller loss rate. As the cloud seeding was generally performed when the soil was wet with antecedent rainfall, most of the increased rainfall could directly contribute to the runoff increase. This is one important reason why the cloud seeding is effective for securing additional water resources.
It is also noticeable that cloud seeding has significantly increased interflow. In particular, when the increase rate of rainfall was small, rather than the direct runoff and baseflow, the increase rate of interflow was higher. Increased rainfall due to cloud seeding might be high enough to increase the infiltration, but too small to increase the groundwater level. In particular, in the Yongdam Dam and Namgang Dam basins, the increase rate of interflow was highest in all years of simulation. On the other hand, the increase rates of direct runoff and baseflow were found to be dependent on the increase rate of rainfall. With the large increase rate of rainfall, the increase rates of baseflow and direct runoff became large enough to be similar to the increase rate of interflow, such as in the Yongdam Dam and Namgang Dam basins in the years 2020 and 2021. But, in the small Boryeong Dam basin, the increase rate of baseflow was found to be always smaller than the interflow and direct runoff, in all cases.
Simulated runoff becomes the inflow to the dam reservoir. Additional inflow to the dam reservoir increases the storage, whose contribution is relative to the total storage capacity, effective storage capacity, and planned annual water supply.
Table 6 shows the relative amount of cloud seeding to these dam capacities. This information shows that the effect of cloud seeding can differ, depending on the dam basin and dam reservoir characteristics. First, in the Boryeong Dam and Yongdam Dam basins, the increase rate of total storage was found to be smaller than that of the total runoff. This is mainly due to the large total storage capacity, compared to the size of dam basin area. This imbalance is somewhat more serious in the Yongdam Dam basin, where the increase rate of total storage was found to be less than that of the total runoff. On the other hand, a totally opposite result was derived from the Namgang Dam. The increase rate of total storage was found to be more than three times the total runoff. In fact, this is an exceptional result, due to the very small storage capacity, compared to the dam basin area. A similar result was also found in the comparison of the increase rate of effective rainfall. As the effective storage capacity is smaller than the total storage capacity, it is normal that the increase rate of effective storage is higher than that of the total storage.
The relative amount of the increased total runoff to the planned annual water supply (i.e., the increase rate of water supply) has another meaning, as it can be directly linked to the end user. In the Boryeong Dam basin, the increase rate of water supply was almost the same as that of total runoff. However, in the Yongdam Dam basin, this increase rate of annual water supply was found to be smaller than a half of the runoff increase rate. This result indicates that the planned annual water supply in the Yongdam Dam basin is too high. Finally, in the Namgang Dam basin, even though the increase rate of annual water supply is smaller than the increase of total storage, it is still more than twice the increase rate of total runoff. This result indicates that the effect of cloud seeding on the water supply could be higher in the Namgang Dam basin. This must depend on the fact that the increased total runoff can be supplied to the end users without any loss.
The above consideration shows that the relative role of cloud seeding differs, depending on the dam reservoir characteristics. In one dam, the increase rate of total storage might be remarkable, while in other dams, the increase of annual water supply might be significant. However, as the final goal of cloud seeding in this study is to increase the water supply, the increase rate of annual water supply must have a higher weight. In that sense, the contribution of cloud seeding may be higher in the Namgang Dam basin than in the other two dam basins. That is, assuming that the practical expectation of rainfall increase by cloud seeding may not be that high, the cloud seeding can be more advantageous in a dam basin with large basin area compared to small effective storage capacity (or small planned annual water supply).
5.2.2. Application of Scenario-Based Rainfall
In this part of the study, the rainfall data generated by considering the given increase scenario were considered in the same evaluation of cloud seeding. As explained in the previous chapter, four different increase scenarios, i.e., 5, 10, 15, and 20% increase, were considered in the rainfall data generation. The rainfall data observed in 2021 were considered as the base scenario. Rainfall has been increased by the given percentage at the same date when the cloud seeding was applied in the WRF−ARW simulation. Finally, the four different rainfall data generated by considering the four different increase scenarios along with the based data were applied to the same PRMS model for rainfall–runoff analysis.
Table 7 summarizes the relative change in the runoff components, like the baseflow, interflow, and direct runoff.
As can be found in
Table 7, the relative changes of the runoff components, like the baseflow, interflow, and direct runoff, are dependent on the rainfall increase rate, but also differ basin-by-basin. Different from the application of the simulated rainfall by WRF−ARW in the previous section, the increase of interflow and direct runoff were found dominant in all three basins. The increase of baseflow was found to be smaller than that of the interflow and the direct runoff. This result seems to be due to the rather large increase of rainfall. As the soil was already wet before the cloud seeding, the increased rainfall might contribute much to the direct runoff and interflow. As the groundwater is charged by the percolation process, it must have some limitation, even under the condition of large rainfall increase.
Additionally, it is also noticeable that the increase rate of total runoff seems to be proportional to the basin area. The increase rate of total runoff was smaller in the Bo-ryeong Dam basin, but quite high in the Yongdam Dam and Namgamg Dam basins. As a result, the increase rate of the total runoff in the Boryeong Dam basin was 21.9% when the increase rate of rainfall was 20%. It was much higher at 34.8% in the Yongdam Dam basin and at 33.0% in the Namgang Dam basin. In the latter two basins, the increase of interflow was a highly significant cause of the increase of total runoff. On the other hand, in the Boryeong Dam basin, the increase of total runoff was mostly from the increase of direct runoff.
Table 7 also confirms that the increase rate of runoff was higher than that of rainfall. That is, in the Boryeong Dam basin, the increase rate of runoff was 1.1 times higher than that of the rainfall, which in the Namgang Dam basin was much higher at 1.5 times. However, it should also be remembered that the increase amount of runoff is still smaller than that of the rainfall. The increased amount of runoff was found to be just 70% of the increased amount of rainfall in the Boryeong Dam and Yongdam Dam basins, while it was 80% in the Namgang Dam basin. This higher ratio in the Namgang Dam basin was mainly due to the smaller evapotranspiration amount with somewhat different vegetation types. Regardless of whether it is 70 or 80%, this ratio is an extremely high runoff ratio, if considering the normal runoff ratio in a basin in Korea. In these three dam basins, the normal runoff ratio is around 50%. It reduces to below 40% under extreme drought condition, just like in 2015 [
52]. The runoff ratio of 70 to 80% should be assumed to be a significant level, especially under the water shortage situation.
6. Relative Contribution to Water Supply According to Different Reservoir Operation Method
6.1. Reservoir Operation Methods
Increase of runoff in a basin indicates the increase of water resources. In simple terms, the increase of water resources is dependent upon the basin area and the rainfall increase. However, the usefulness of water resources is more dependent upon the characteristics of dam reservoirs, as well as the dam operation method. For example, Boryeong Dam is a small dam with a small reservoir; its basin area is also small. On the other hand, Yongdam Dam is big with a large reservoir; its basin area is also large. Interestingly, while Namgang Dam is much smaller than Yongdam Dam, its basin area is much larger. These characteristics highly affect the usefulness of the increased water resources by cloud seeding, which has been reviewed in previous sections. Additionally, it should be considered that the reservoir operation method can completely change the usefulness of the additional water resources. Simply put, the additional water resources secured in the dam reservoir may not be used effectively if the given dam reservoir and reservoir operation method cannot accept it.
The reservoir operation method (ROM) may be divided into the following five categories: the automatic ROM (Auto ROM), spillway rule curve ROM (SRC ROM), rigid ROM, technical ROM, and scheduled release discharge ROM (SRD ROM) [
53]. First, the Auto ROM is a simple method whereby the discharge from a dam occurs when the reservoir stage is higher than the given target stage. The dam discharge is determined by the spillway discharge rating curve. The SRC ROM is an empirical method to control the water gate to decrease the downstream peak flow, in which the downstream flood control is achieved by following the predetermined spillway rule curve. This method is known to be effective when the inflow is similar to the design flood. However, if the inflow is much higher than the design flood, the downstream flood damage could be worse.
The rigid ROM may be the most popular ROM in Korea. This ROM is also called the constant rate–constant magnitude method. That is, until the peak inflow, a constant rate is applied to the inflow to determine the discharge. After the peak inflow, a constant magnitude is discharged. This constant discharge is generally determined by the discharge determined at the time of peak inflow, i.e., simply by multiplying the peak inflow by the constant rate. The constant rate is thus important in the Rigid ROM. This constant rate is determined by trial-and-error method to satisfy the condition that the flood control capacity is filled with the inflow flood. The technical ROM is the method of determining the discharge by considering the predicted inflow hydrograph. This method is known to be very effective under the condition that the predicted inflow hydrograph is accurate, and it can then fully use the flood control volume. Finally, the SRD ROM considers past experience in the determination of discharge. Even though it is a primeval method, the SRD ROM is frequently used to test the change in reservoir stage before and after a flood.
Among the three dams considered in this study, Boryeong Dam and Yongdam Dam adopt the rigid ROM for their reservoir operation. However, Namgang Dam operates the reservoir rather empirically, as the size of dam reservoir is very small compared to the basin area [
54]. During the rainy season, to secure the flood control capacity, the flood water level is reduced by 5 m. That is, the restrictive water level is applied during the rainy season.
Table 8 summarizes the basic information of reservoir operation for those three dams in this study.
6.2. Reservoir Operation with Simulated Rainfall by the WRF−ARW
This study first considered the runoff data simulated by the PRMS model with the rainfall input generated by the WRF−ARW model from 2018 to 2021. The runoff data simulated with the observed rainfall data without considering the cloud seeding were also used for the comparison. The temporal resolution of this runoff simulation was one day, which is generally accepted for the evaluation of water supply from a dam [
55,
56]. Thus, the reservoir operation was performed on a daily basis, and as results, the daily reservoir storage and daily water supply could be derived.
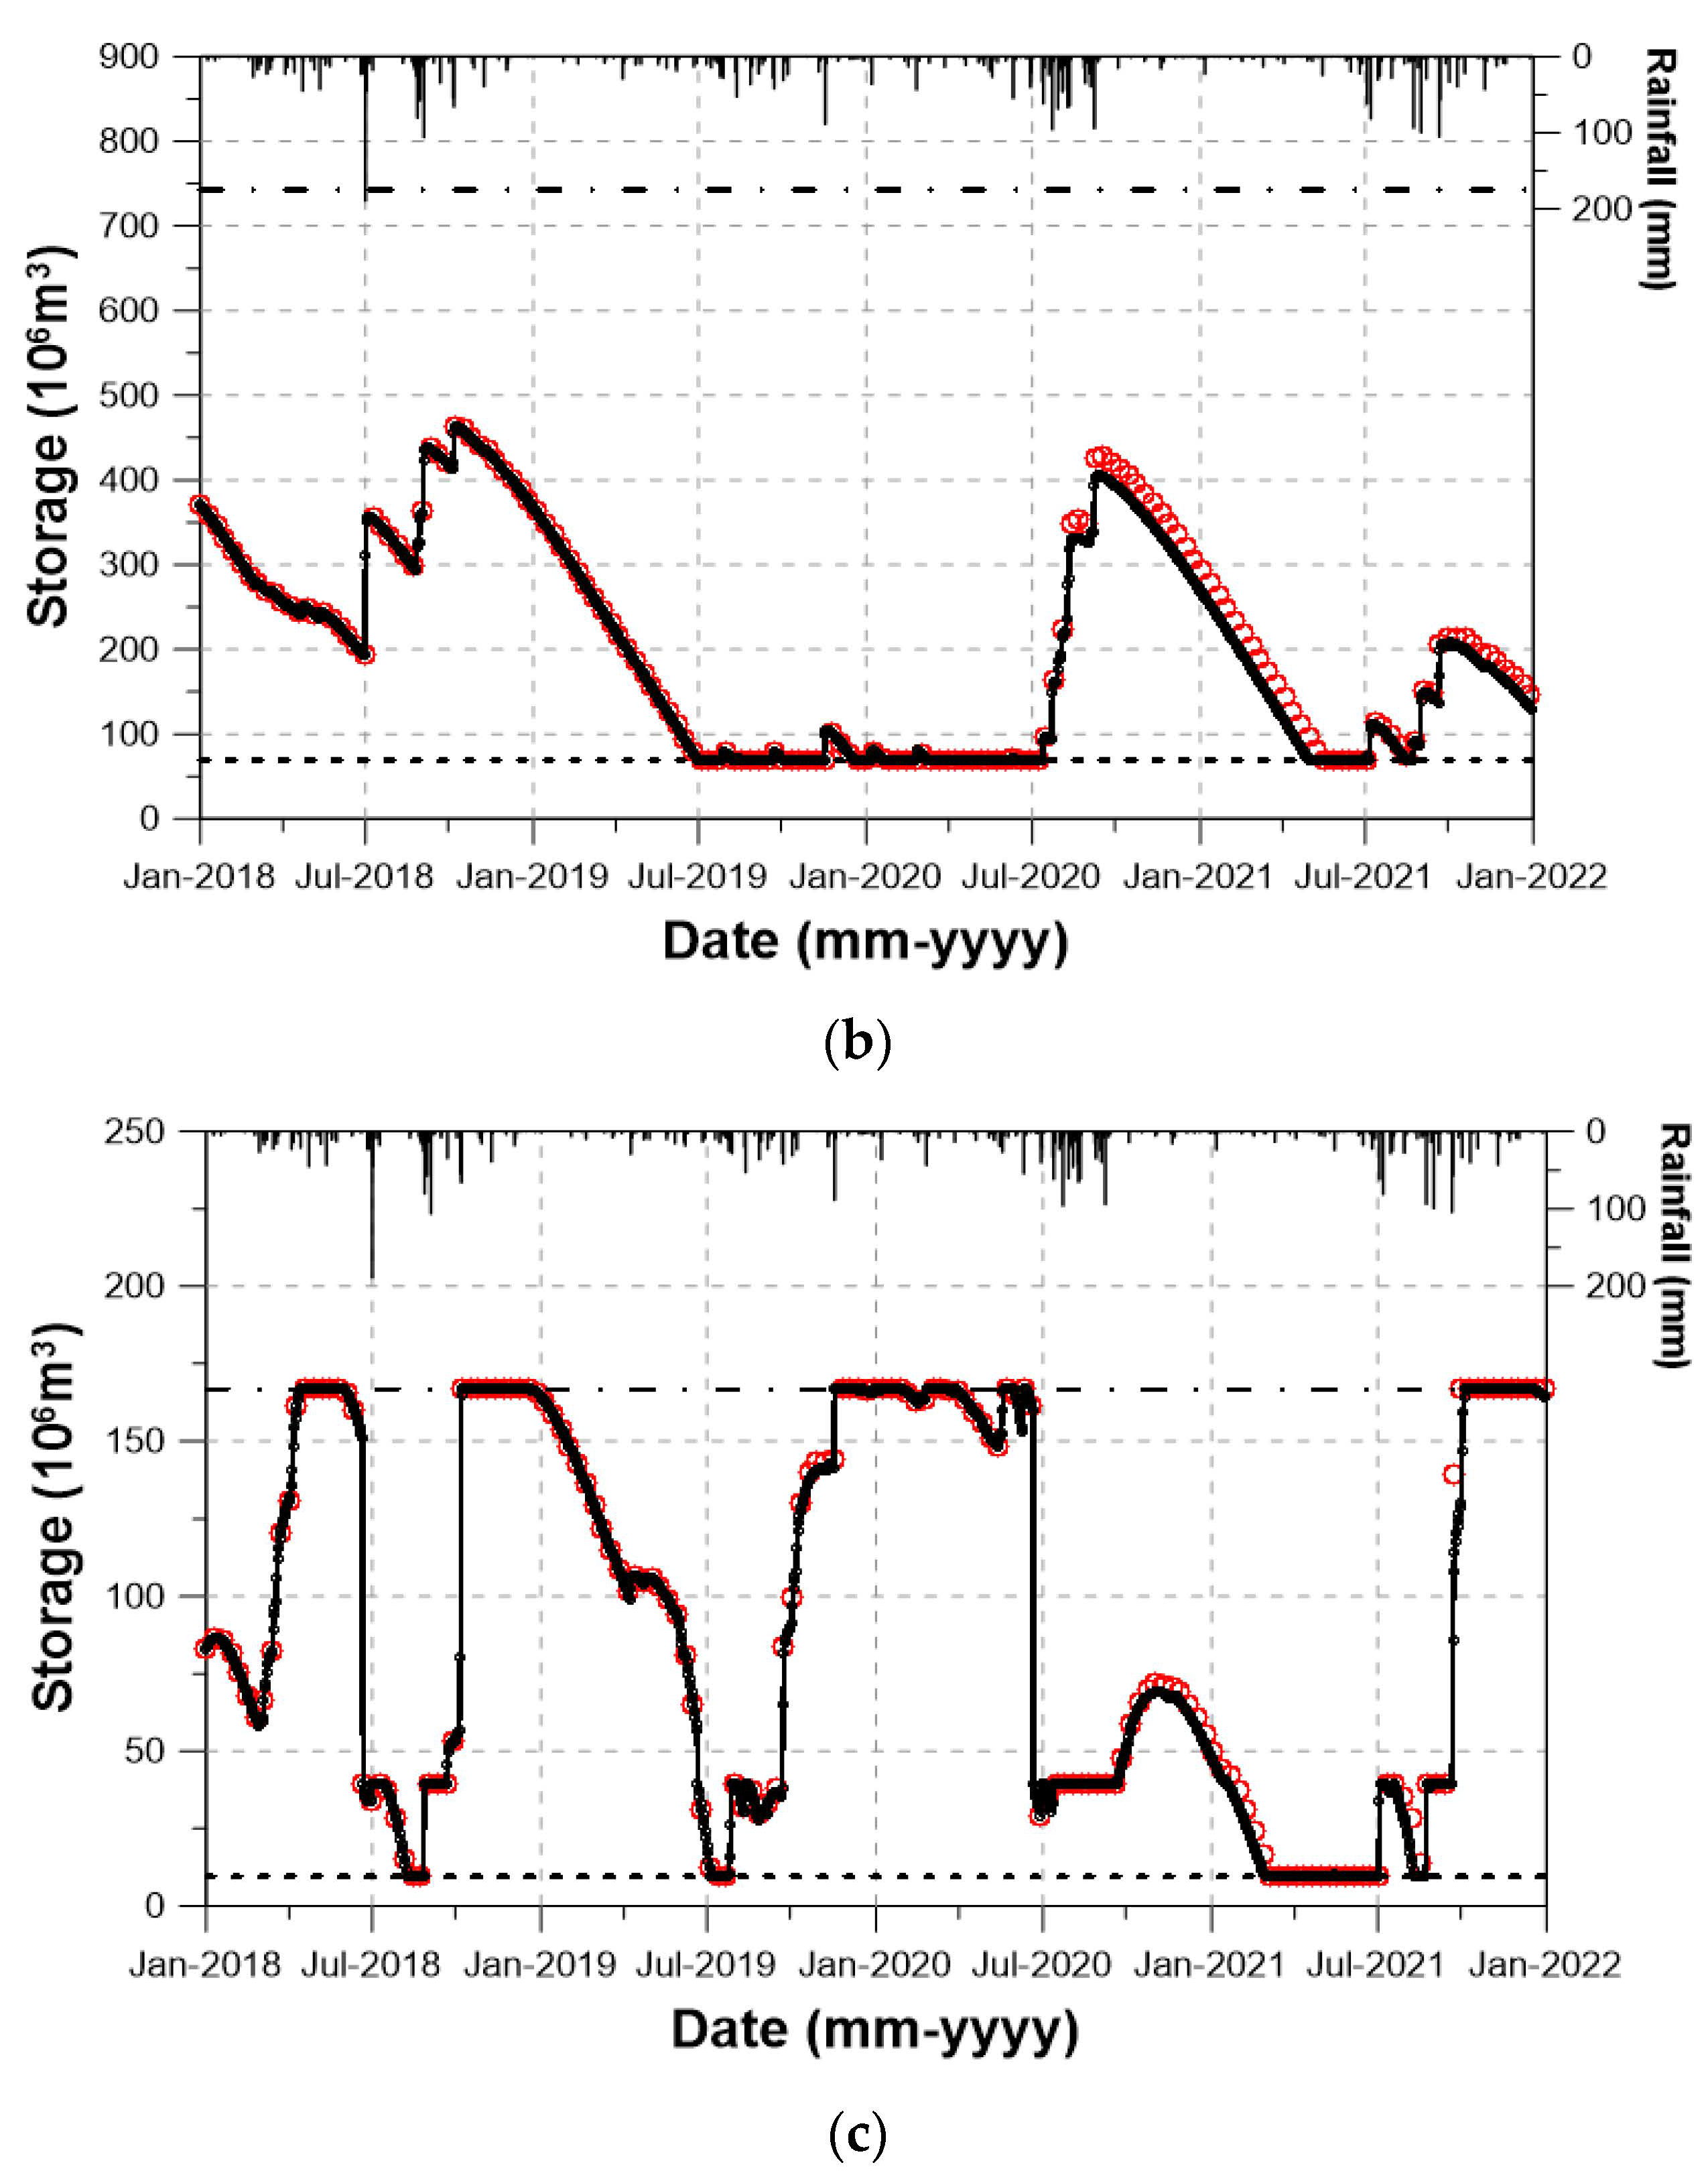
Figure 9 shows the daily variation of reservoir storage. The solid line is the UNSD case, while the red circle indicates the SEED case. These two cases move between the low water level (dotted line) and the high water level (alternated long and short dash line). From this figure, it is also possible to conjecture the normal water supply and water shortage. That is, if the remaining reservoir storage is smaller than the planned daily water supply, then a shortage of water supply occurs. However, the reservoir stage cannot be lower than the low water level. In the reservoir operation in this study, evaporation from the dam reservoir was not considered.
Figure 9 clearly shows the difference of dam situations. Even though they are all located within similar climatic regions, their reservoir operation results are totally different. The Boryeong Dam seems to have no serious problem, at least during the simulation period from 2018 to 2021. Its storage moved from about 40 to 100%, with its mean around 75%. A similar variation pattern of dam storage could be found in the Yongdam Dam. However, the mean storage was just 25%, moving from 0 to 50%. The behavior of dam storage in the Namgang Dam was more dramatic, moving from 0 to 100%, with its mean around 50%. As explained earlier, this totally different behavior is due to the different conditions of the dam basin, dam reservoir, and operation rule.
As can be seen in
Figure 9, the effect of cloud seeding was not that obvious. This trend was the same in all three dams, which was mainly due to the rather small increase of rainfall by cloud seeding. In 2020 and 2021, when the rainfall increase was rather high, it was possible to clearly find the difference. After 2020, the difference was rather high in the Yongdam Dam reservoir.
During the four years of simulation, the water level in Boryeong Dam was higher than the low water level. That is, during this simulation period, no water shortage occurred in Boryeong Dam. However, in the Yongdam Dam basin, the water level stayed around the low water level for almost one year from July 2019. A severe water shortage problem continued in this dam, but the cloud seeding somewhat alleviated the problem. Even though the water level became higher due to cloud seeding, this effect was not that vivid in this figure. The situation in the Namgang Dam was also similar to that in the Yongdam Dam. Due to the small increase rate of rainfall, the effect of cloud seeding could not be clearly detected. Also, during the wet summer season, frequent release from the dam reservoir to secure the flood control volume kept the Namgang Dam from securing the additional water resource by cloud seeding. This was the fundamental limitation of the Namgang Dam, with its large basin area but very small storage capacity.
Table 9 summarizes the number of water shortage days during this four-year simulation period. As mentioned in the previous paragraph, in Boryeong Dam, there was no water shortage. On the other hand, in Yongdam Dam, the number of water shortage days was 351 (about 88 days annually) under the UNSD condition. This corresponds to about 25% of the year. The cloud seeding decreased the number of water shortage days by 16 days. This decrease was concentrated in 2021, when the rainfall increase was rather large. Similar change could also be found in Namgang Dam, where the number of water shortage days was decreased from 171 to 154 (from about 43 to 38 days annually). The decrease in Namgang Dam was also concentrated in 2020 and 2021, when the rainfall increase was rather large. This change must be significant, especially considering the rainfall increase was not that large. However, this amount of rainfall increase by cloud seeding cannot solve the water shortage problem. More rainfall increase must be secured; also, it should consider the characteristics of the dam reservoir and the reservoir operation method.
6.3. Reservoir Operation with Scenario-Based Rainfall
A similar analysis and evaluation to that in
Section 6.2 is repeated in this section, but with the scenario-based rainfall data. As explained earlier, the four different scenario-based rainfall data were prepared by considering a 5, 10, 15, and 20% increase to the rainfall data in 2021. The runoff data simulated by the PRMS model were applied to the corresponding dam. The initial water stage in each dam was assumed to be the same as that at the end of 2020.
Figure 10 shows the change in water level, just as in the previous
Figure 9. In the figure, the solid line indicates the UNSD case, the red circle indicates the 5% increase, the blue diamond indicates the 10% increase, the green triangle indicates the 15% increase, and finally, the blue cross indicates the 20% increase. They all lie between the low water level and the high water level.
In Boryeong Dam, as the initial dam storage was high, no water shortage occurred. It was the same for all four scenarios of rainfall increase. However, the situations in Yongdam Dam and Namgang Dam basins were different. The role of rainfall increase was clear in both dams. In Yongdam Dam, as the initial dam storage was small, it was impossible to avoid a water shortage problem. However, the increased rainfall worked significantly to alleviate the problem. A more serious problem in the Yongdam Dam was that the dam storage was simulated to be even smaller at the end of the year. This was mainly due to the rather small rainfall during the wet summer season in 2021. More active cloud seeding should have been considered during, and just after, the wet summer season. As a result, it seems almost impossible to avoid a very severe water shortage problem in the following year without any large rainfall in the Spring.
Namgang Dam revealed its structural problem. Even though the initial dam storage was large, the water shortage problem could not be avoided. This was simply because the planned water supply was too much compared to the effective storage capacity. As a result, without sufficient dam inflow, the water shortage problem could not be avoided. Additionally, it is noticeable that the water shortage problem also occurred in the wet summer season. This problem shows how difficult it is to handle both flood control and water supply problems successfully at the same time. This worse problem in the Namgang Dam is simply due to it having a large basin area but very small dam reservoir. Even though the dam reservoir could be easily filled in the fall, just after the rainy summer season, any successful water supply the following year cannot be guaranteed. They should expect to have enough rainfall the next spring.
Table 10 summarizes the number of water shortage days. As mentioned earlier, no water shortage occurred in Boryeong Dam. However, in Yongdam Dam, the number of water shortage days was 58 days under the UNSD situation, but became 57, even under the scenario of 20% increase. The water shortage days simply remained unchanged. This was because most of the water shortage occurred during the dry spring season. In simple terms, the effect of cloud seeding was very limited and could not decrease the water shortage problem. These results indicate that cloud seeding should be considered during the wet summer season, as well as in the early fall. This is the only way to make the Yongdam Dam work normally. Finally, in the Namgang Dam basin, the effect of cloud seeding was found to be more direct than that in the Yongdam Dam basin. That is, the increase of rainfall decreased the water shortage days. The number of water shortage days decreased from 16 days under the UNSD situation to 11 days under the scenario of 10% increase, and 8 days under the scenario of 20% increase.
Additionally, the above simulation and evaluation were repeated, but with the initial condition of dam storage, simply 50% of effective storage capacity (
Figure 11). This 50% is a normal level in Boryeong Dam and Yongdam Dam, but is somewhat lower in Namgang Dam [
57]. First, no water shortage occurred in Boryeong Dam, just as in the previous case. At the end of the simulation year, the dam storage was about 50%. With the rainfall increase by cloud seeding, the dam storage at the end of year could be increased to be around 80% under the 20% rainfall increase scenario. This result shows that in the Boryeong Dam basin, cloud seeding could be very effective. However, in the Yongdam Dam basin, the situation was different. Even though water shortage did not occur in 2021, the dam storage at the end of the year was far less than 50%. Even under the 20% increase scenario, the dam storage could not reach the 50% level. A severe water supply problem could not be avoided the following year. A more active approach to secure additional water resources should be prepared.
The simulation results for the Namgang Dam look to be more difficult. During the Spring season, it is almost impossible to avoid the water shortage problem. Even though the cloud seeding effect can be expected to help a little, it seemed to not be sufficient. The increased rainfall and resulting runoff were still not enough to fill the planned water supply. The number of water shortage days was found to be 66 under the UNSD condition but decreased to 58 and 46 under the 10 and 20% increase scenarios, respectively (
Table 10). Simply put, while the large basin area of the Namgang Dam is advantageous, the small effective storage capacity is an obstacle that prevents saving the additional water resources by cloud seeding. Additionally, as the flood control volume is increased during the wet Summer season, it is not favorable to consider more active cloud seeding. The only option available is to fill the dam reservoir during the Fall season. Additionally, more active cloud seeding is important in the Spring season.
7. Conclusions
This study showed that the usefulness of cloud seeding is highly dependent on the dam and dam basin characteristics. First, the collection efficiency of increased rainfall by cloud seeding was compared for three dam basins, Boryeong Dam, Yongdam Dam, and Namgang Dam basins, located in the western part of the Korean Peninsula. Additionally, how much rainfall could be collected by the dam basin was evaluated. Second, the additional runoff volumes in those three basins by cloud seeding were compared with each other. The runoff volume can change, depending on the basin characteristics, like the soil, land use, and vegetation. Finally, by considering the dam reservoir operation and planned water supply, the change in water supply capacity was evaluated. The cloud seeding can contribute much in one dam, but only a little in other dams. In this study, the cloud seeding was simulated using the WRF−ARW model. Also, four different rainfall data generated by considering the scenarios of rainfall increase (i.e., 5, 10, 15, and 20%) were used for more practical evaluation.
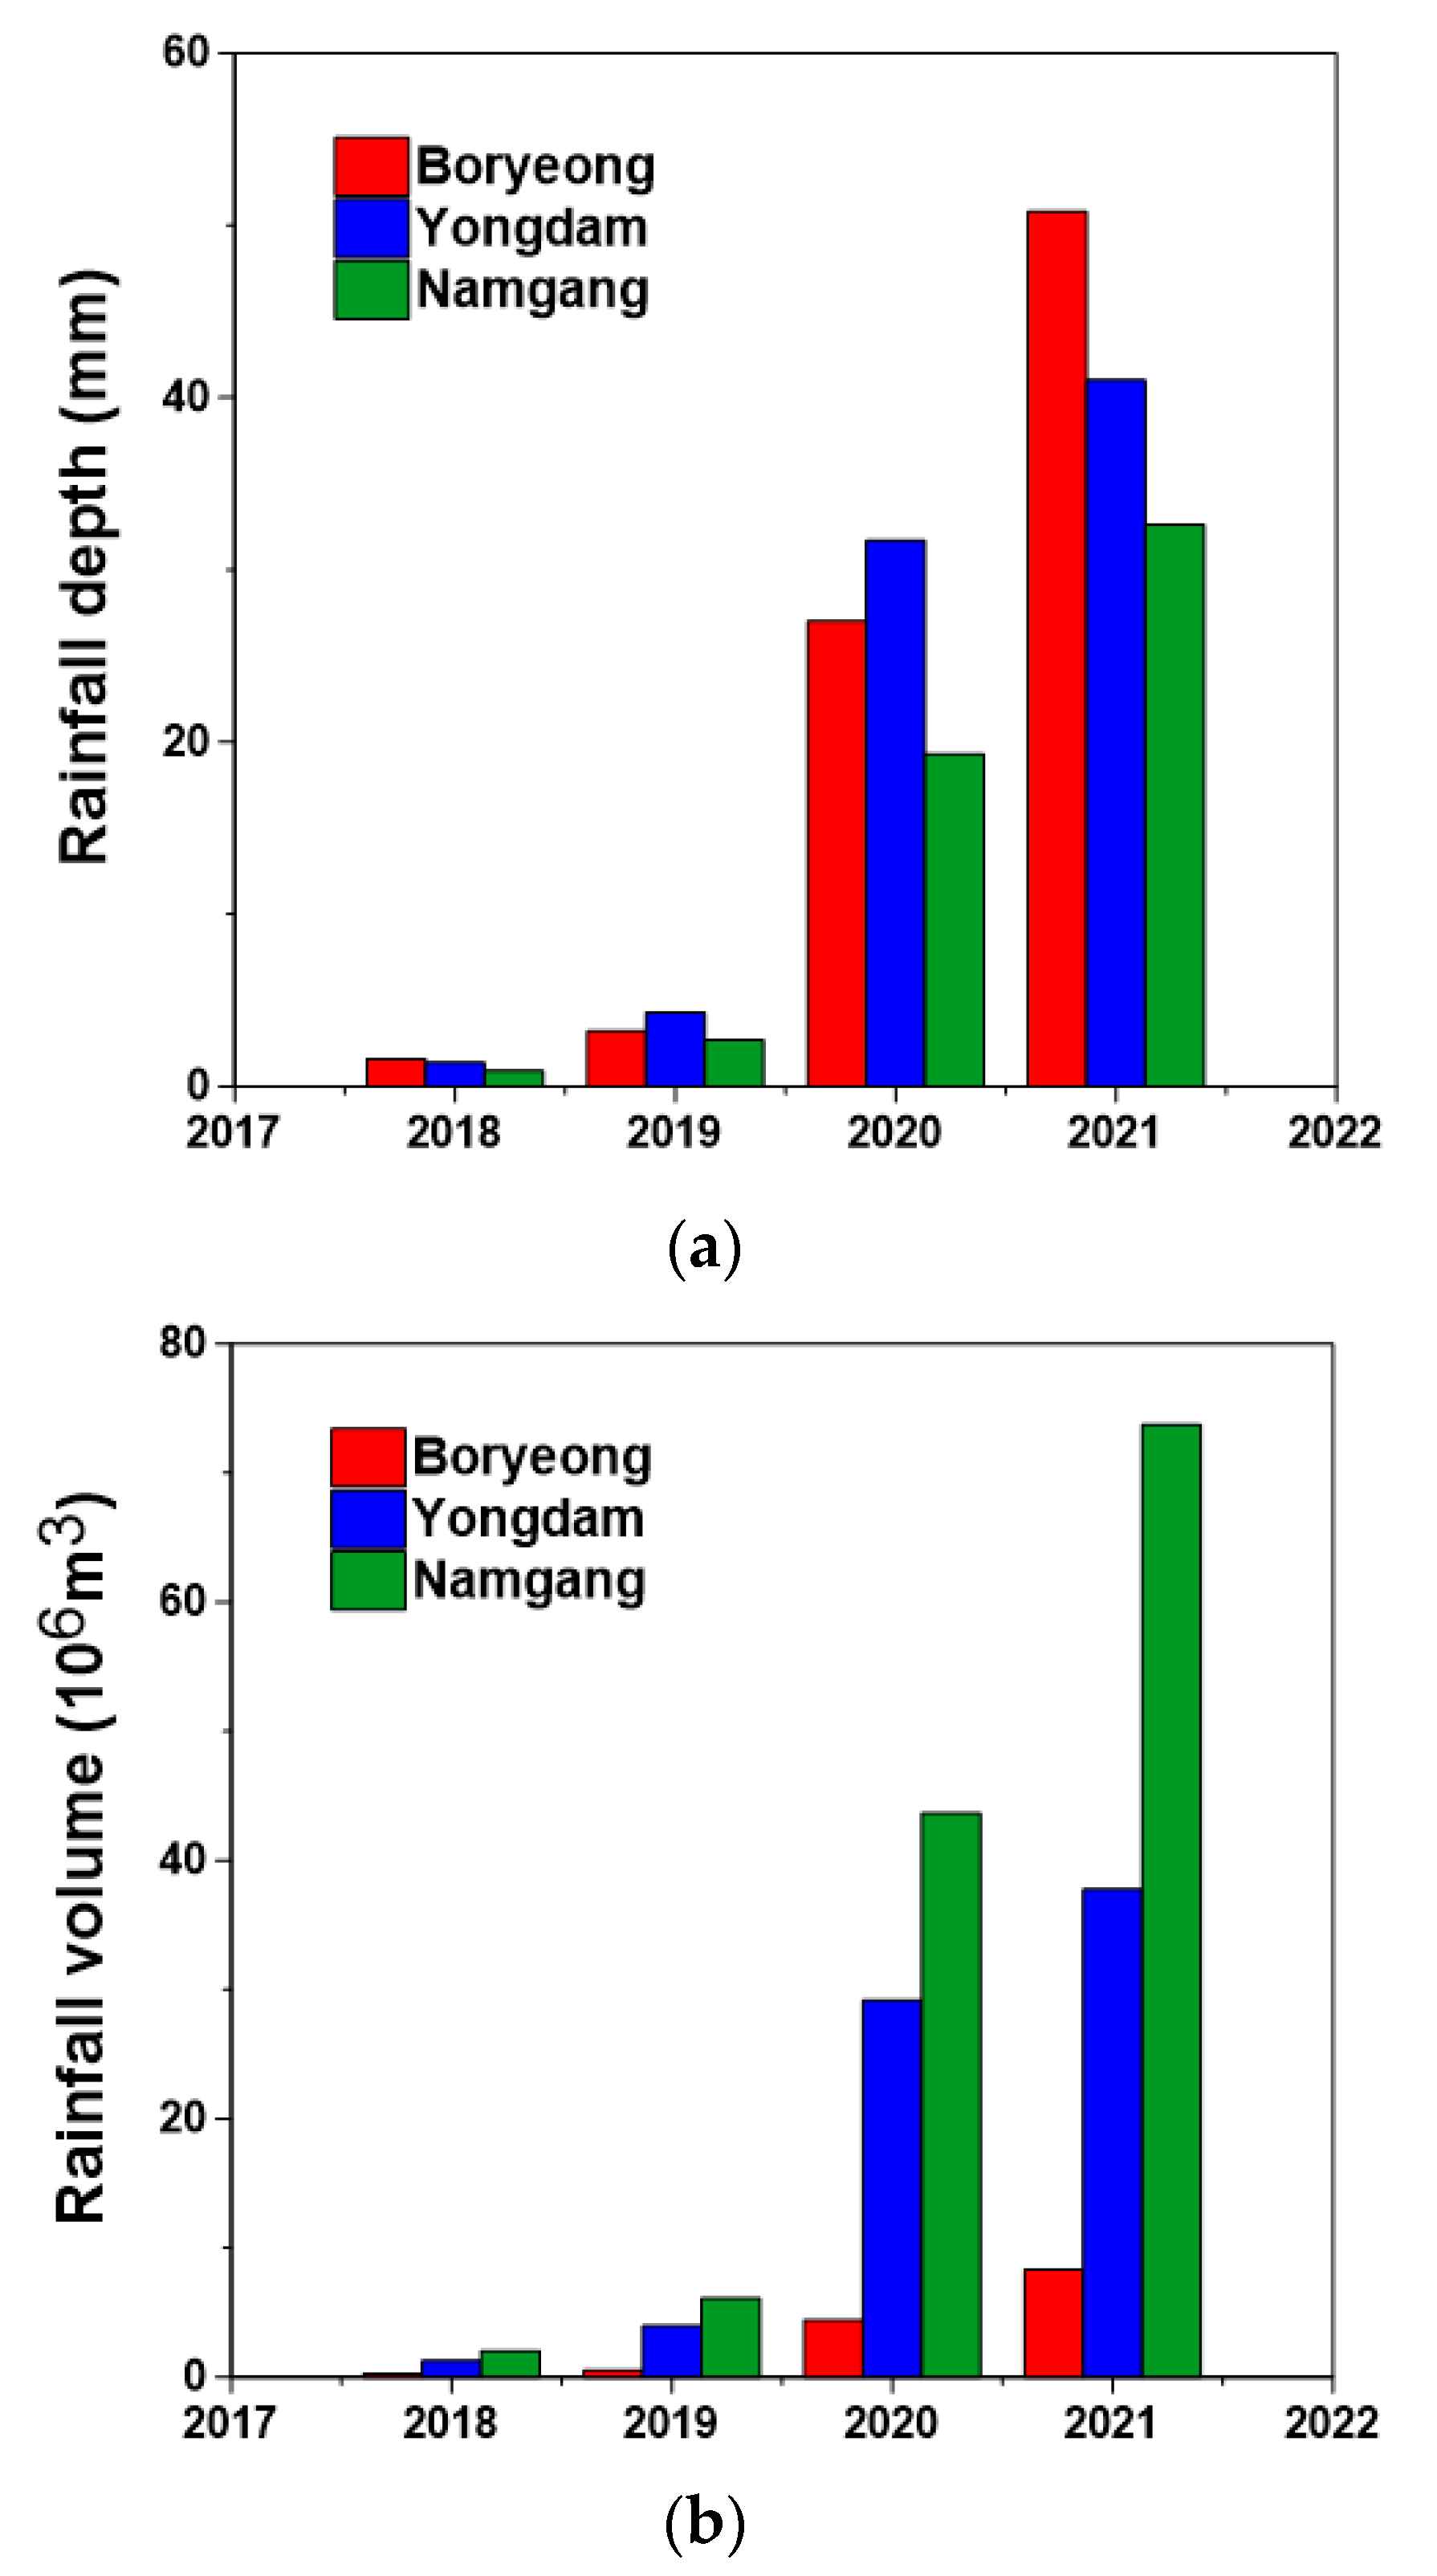
The results may be summarized as follows: First, the increase rates over the three dam basins were compared to evaluate the collection efficiency of the dam basins. As the rainfall increase rate was found to be somewhat higher in a small dam basin (i.e., the Boryeong Dam basin), the cloud seeding might be assumed to be successful. However, the total amount of increased rainfall was larger in the dam with the larger basin area (i.e., the Namgang Dam basin). Even though the rainfall increase rate was just 2.99% in the Namgang Dam basin (in year 2021), compared to 4.65 and 3.75% in the Boryeong Dam and Yongdam Dam basins, respectively, the total amount of increased water resources secured by the cloud seeding was 73.7 × 10⁶ m3, which is much higher than the 8.3 and 37.3 × 10⁶ m3 in the Boryeong Dam and Yongdam Dam basins, respectively. Simply put, the larger basin area is an important advantage for securing additional water resources.
Second, the runoff increase rate was found to be higher than the rainfall increase rate. In fact, the runoff increase rate was about two times or more than the rainfall increase rate in all three dam basins considered in this study. Also, the increase of total runoff was mostly due to the increase of interflow and direct runoff. In particular, the increase of interflow was noticeable in all three basins. This result shows the advantage of cloud seeding to secure additional water resources, as the cloud seeding is generally conducted when the soil is wet with antecedent rainfall. As a result, most of the increased rainfall can directly contribute to the runoff increase.
Third, even though the additional inflow to the dam reservoir increases the storage, its contribution was found to be highly relative, depending on the storage capacity and planned annual water supply from a dam. For example, in the Yongdam Dam and Boryeong Dam basins, the increase rate of total storage was found to be less than that of the total runoff. On the other hand, in the Namgang Dam basin, it was found to be more than three times that of the total runoff. Because of the small total storage capacity of the Namgang Dam, this was an exceptional result, even though its basin area was the largest among the three dams. The increase of annual water supply was also different from dam to dam. In Boryeong Dam, the increase rate of water supply was almost the same as that of the total runoff. In the Yongdam Dam, it was less than half of the runoff increase rate. However, in the Namgang Dam basin, it was more than twice the increase rate of the total runoff. This result indicates that in the Namgang Dam basin, the effect of cloud seeding on the water supply can be higher.
Finally, the results of reservoir operation revealed another practical aspect of those three dams. Basically, the situation in the Boryeong Dam was found to be better. More active cloud seeding was found necessary in the Yongdam Dam basin. This was also the same situation in the Namgang Dam basin. However, it was also found that cloud seeding cannot solve the water supply problems in those dams. In particular, the situation in the Namgang Dam basin looks very serious. Regardless of the significant help of cloud seeding, the water shortage problem in the Spring season was found to be unavoidable. In simple terms, the large basin area of the Namgang Dam is advantageous, but the small dam storage capacity is a major obstacle to prevent saving the additional water resources by cloud seeding.
The above results show that cloud seeding should be carefully planned and might well vary dam-by-dam. Cloud seeding can be effective every season in one dam, but only in Spring in another dam. In other dams, the Summer or Fall seasons can be the best option. The target increase of rainfall is also an important issue. Just a mild increase could be better in one dam, but it can be important to secure much more rainfall in others. It is interesting to note that, even though the three dams considered in this study are located in practically the same climatic zone, the conditions required for cloud seeding are totally different.
This study tried to show that there are many other factors to consider in the cloud seeding. Basically, the basin characteristics are very important. Basin characteristics, including the soil, geology, etc., control the runoff ratio. Increased rainfall may not directly result in the increased runoff if the soil is very permeable or the evapotranspiration is very high. Other socioeconomic factors are assumed to be considered in the planned amount of water supply. Depending on the size of population or industry, the amount of water supply can be larger even though the size of dam reservoir is small. Those three dams considered in this study are also very different in their basin area, size of dam reservoir, and the amount of planned water supply. Depending on these characteristics, the effect of cloud seeding can be so different. However, relative roles of these characteristics to the efficiency of cloud seeding could not be quantified in this study. This issue may be solved based on the sensitivity analysis. Consideration of more dam basins with different characteristics would also be helpful to derive a more significant result.

 ,
, 


