Article

Measuring Evapotranspiration Suppression from the Wind Drift and Spray Water Losses for LESA and MESA Sprinklers in a Center Pivot Irrigation System

1
Department of Agricultural and Environmental Sciences, Tennessee State University, Nashville, TN 37209, USA
2
Center for Precision and Automated Agricultural Systems, Department of Biological Systems Engineering, Washington State University, Prosser, WA 99350, USA
3
Department of Biological Systems Engineering, Tidewater AREC, Virginia Tech, Suffolk, VA 23437, USA
4
Department of Biological Systems Engineering, Washington State University, Pullman, WA 99164, USA
5
Department of Crop and Soil Science, Washington State University, Pullman, WA 99164, USA
*
Author to whom correspondence should be addressed.
Water 2023, 15(13), 2444; https://doi.org/10.3390/w15132444
Submission received: 30 May 2023 / Revised: 22 June 2023 / Accepted: 30 June 2023 / Published: 2 July 2023
(This article belongs to the Special Issue Evapotranspiration Measurements and Modeling II)

Abstract

:
Wind drift and evaporation loss (WDEL) of mid-elevation spray application (MESA) and low-elevation spray application (LESA) sprinklers on a center pivot and linear-move irrigation machines are measured and reported to be about 20% and 3%, respectively. It is important to estimate the fraction of WDEL that cools and humidifies the microclimate causing evapotranspiration (ET) suppression, mitigating the measured irrigation system losses. An experiment was conducted in 2018 and 2019 in a commercial spearmint field near Toppenish, Washington. The field was irrigated with an 8-span center pivot equipped with MESA but had three spans that were converted to LESA. All-in-one weather sensors (ATMOS-41) were installed just above the crop canopy in the middle of each MESA and LESA span and nearby but outside of the pivot field (control) to record meteorological parameters on 1 min intervals. The ASCE Penman–Monteith (ASCE-PM) standardized reference equations were used to calculate grass reference evapotranspiration (ETo) from this data on a one-minute basis. A comparison was made for the three phases of before, during, and after the irrigation system passed the in-field ATMOS-41 sensors. In addition, a small unmanned aerial system (UAS) was used to capture 5-band multispectral (ground sampling distance [GSD]: 7 cm/pixel) and thermal infrared images (GSD: 13 cm/pixel) while the center pivot irrigation system was irrigating the field. This imagery data was used to estimate crop evapotranspiration (ETc) using a UAS-METRIC energy balance model. The UAS-METRIC model showed that the estimated ETc under MESA was suppressed by 0.16 mm/day compared to the LESA. Calculating the ETo by the ASCE-PM method showed that the instantaneous ETo rate under the MESA was suppressed between 8% and 18% compared to the LESA. However, as the time of the ET suppression was short, the total amount of the estimated suppressed ET of the MESA was less than 0.5% of the total applied water. Overall, the total reduction in the ET due to the microclimate modifications from wind drift and evaporation losses were small compared to the reported 17% average differences in the irrigation application efficiency between the MESA and the LESA. Therefore, the irrigation application efficiency differences between these two technologies were very large even if the ET suppression by wind drift and evaporation losses was accounted for.

1. Introduction

Gross irrigation requirements (Ig) are used for designing irrigation systems, storage basins, water management projects, and water rights. The gross irrigation requirement (Ig, Equation (1)) is defined as the depth of net irrigation (In, or the actual amount of water that reaches the soil surface) divided by irrigation application efficiency (IAE) of the irrigation system.
I g = I n IAE
This publication defines the IAE of a sprinkler irrigation system as the fraction of the total water emitted through the sprinklers that reaches the ground surface (In/Ig). In is driven by crop water needs (Equation (2)) and is estimated by the actual crop evapotranspiration (ETc) minus effective precipitation (Pe), deep percolation (DP) losses, and runoff as:
I n = E T c P e D P R
Wind drift and evaporation water losses (WDEL) from sprinklers modify the microclimate. It is usually defined as WDEL = Ig − In. WDEL decreases air temperature, vapor pressure deficit (VPD), and canopy temperature during the irrigation event compared to the non-sprinkled field [1,2,3,4,5,6,7,8,9]. Wind drift and evaporation losses are captured by the crop canopy as interception losses (IL; [6], or it evaporates, creating a cooler and more humid microclimate that should suppress crop evapotranspiration (ET suppression or ETs) at and downwind of the operating sprinkler. WDELs are usually measured with catch-can tests [6], whereas the IL values are measured by subtracting the ET recorded by the lysimeter after irrigation and before irrigation events [6]. To accurately calculate the gross amount of water needed over a crop growing season (Ig), it is important to quantify how much the microclimate modifications from WDEL suppresses the crop ET downwind. Thus, when calculating gross irrigation water requirements, ET suppression (ETs) should be used to adjust the IAE of the irrigation systems by subtracting ETs from the WDEL, which, in effect, increases the IAE as:
I A E = I n + E T s I g
This increased IAE would, in effect, decrease the estimated real gross required irrigation depth. Therefore, it is important to understand the relative magnitude of ET suppression from WDEL so that total agricultural water requirements can be more accurately estimated.
Urrego-Pereira et al. [8] measured the magnitude of suppressed evapotranspiration under sprinkler irrigation to be 1.5–1.8% of the applied irrigation water. In another study, an instantaneous decrease of 32–55% of crop evapotranspiration was reported during the irrigation event compared to plots without irrigation [6]. The durations of the changes in the microclimatic and suppressed ET under the solid-set sprinkler irrigation were reported to be between 50 and 60 min [5] and 1 and 2 h [6]. Previous researchers measured the sprinkler evaporation losses during day and night by comparing the ET changes from weighing lysimeters, using transpiration rates from sap flow measurements [6] and by comparing the transpiration rate and microclimate changes under irrigation treatments and non-irrigated plots [8].
About 10.8 million hectares in the United States are irrigated with center pivot and linear move irrigation systems (NASS, 2018). These systems can irrigate large acreages in a short period with minimum labor costs. In the past four decades, different modifications to the sprinkler packages and designs have increased the irrigation application efficiencies of center pivots. The IAEs of center pivots and linear machines depend on the nozzles’ sizes, pressures, sprinkler types, heights, distances between the sprinklers, wind speeds, and vapor pressure deficits (VPD) during the irrigation event [10]. Thus, they can vary significantly over time. Different methods have been used for measuring or estimating the IAEs of irrigation systems, including catch-can tests [11,12,13], weighing lysimeters [6,14,15], drainage lysimeters [12], salinity increases [10], and stable water isotopes [13]. A study comparing sprinklers at different heights showed that the higher the nozzle was above the ground the higher the evaporation losses from the sprinkler irrigation system [16,17]. Accordingly, the irrigation water of mid-elevation sprinkler application (MESA; sprinklers at 2–3 m above ground) systems is subject to greater wind drift and evaporation losses than low-elevation spray application systems (LESA; sprinklers about 0.3 m above ground) [10,17]. The IAEs of MESA and LESA systems have been reported to be around 80% and 97%, respectively [3,11,13,18]. In the studies that compared the irrigation efficiencies during day and night, higher evaporations and drift losses were reported during the daytime compared to the nighttime due to the differences in the air temperatures, wind speeds, and humidities [13,17,19].
The objective of this study was (1) to do a side-by-side comparison of MESA with LESA on the same center pivot system to quantify and compare the reference evapotranspiration suppression above the canopy and downwind of the MESA and LESA systems, (2) to compare the actual ET suppressions of the MESA and LESA systems compared to the weather station downwind of the irrigated area, and (3) to use small, UAS-based spatial imagery to compare crop evapotranspiration estimates under the two types of irrigation systems before, during, and after an irrigation event.

2. Materials and Methods

2.1. Experimental Site

An experimental study was set up in a commercial, 57 ha spearmint field irrigated with a center pivot sprinkler irrigation system near Toppenish, Washington (Latitude: ~46.37° N, Longitude: ~−120.45° W) for two continuous years (2018–2019). This was in a semiarid climate with an average annual precipitation of 231 mm with minimal summer rainfall in August and an average monthly vapor pressure deficit (VPD) of 2.5–3 kPa during July and August.
Half of this field was planted with native spearmint, a perennial crop, which was in year 4 of the growth cycle. The other half of the field was planted with peppermint and was not considered for this experiment. This field was irrigated with a full-sized, eight-span center pivot system with MESA sprinklers with 1.4 bar (20 psi) pressure regulators that were located 2 m above ground level and 3 m apart from each other. For this study, every other span of this pivot (spans 4, 6, and 8) was converted from MESA to LESA in the spring of 2018 (Figure 1). The remaining spans (spans 1, 2, 3, 5, 7, and the corner arm) were left in MESA. The sprinklers in the LESA spans were 0.76 m apart, used 0.7 bar (10 psi) pressure regulators, and the nozzles were 0.3 m above the ground. A research study in eastern Washington comparing the irrigation application efficiencies of the MESA and LESA systems showed 15–20% water savings by using the LESA irrigation system [10]. Therefore, the LESA system on the experimental site was designed with nozzles for 15% lower flow rates than the existing MESA system in an attempt to approximately apply the same amount of water to the ground. To validate this, soil water content was measured to the depth of 1.2 m under each span of the MESA and LESA irrigation systems once a week during growing seasons, and it showed no significant differences between the soil moisture contents of the MESA and LESA treatments. More information about the irrigation system designs can be found in Molaei et al. [19].

2.2. Data Collection

2.2.1. Meteorological Measurements

In 2018, three portable, all-in-one ATMOS-41 weather sensors (METER-Group, Pullman, WA, USA) were installed in the middle of spans 6 (LESA), 7 (MESA), and 8 (LESA) with synchronous alignment to the pivot lateral (Figure 1). During this data collection, the spearmint crop was 50–60 cm tall and fully covered the soil surface. The ATMOS-41 sensors were mounted on a tripod at 1.8 m above ground level (AGL) to record micro-climate parameters under the three irrigation systems on one-minute intervals (Figure 2). This short interval was selected to measure changes in the microclimate while the center pivot system was passing a certain location. The amount of time that water was sprayed on each location was between 20 and 30 min. The data loggers (CR1000, Campbell Scientific, Logan, UT, USA) were placed in a water-proof casing on the ground to avoid interaction with the irrigation water. The stored data was transferred to a computer using the logger’s built-in serial communication protocol. The ATMOS-41 sensors were placed on a line perpendicular to the prevailing wind direction. The time of data acquisition was selected when wind speed was not high enough to cause extreme turbulence while it was blowing perpendicular to the orientation of the pivot as it crossed over the ATMOS-41 sensors. Therefore, the measured weather parameters would primarily be a function of the evaporative losses downwind and then upwind of the operating sprinklers after the sprinklers passed the sensors.
In 2019, two portable ATMOS-41s were installed 1 m above ground level (AGL) to monitor the crop microclimate near the crop canopy. One sensor was installed under span 6 (LESA), and the other one was installed under span 5 (MESA). As a control measurement (Cntr. treatment) of the microclimate, an additional ATMOS-41 was installed at 1 m AGL outside of, downwind from, but at the edge of the field on the bare soil and the non-irrigated spot (Figure 1). A ZL6 data logger (METER-Group, Pullman, WA, USA) was used for recording the data at 1 min intervals (Figure 1 and Figure 3). The sensors were left in the field for a 20-day period in August 2019 to capture the pivot passing under a wide variety of weather conditions.

2.2.2. UAS-Based Imagery

A small UAS (unmanned aerial system)-imagery-based method of estimating crop water consumption (UAS-METRIC; mapping evapotranspiration at high resolution with internalized calibration; [20]) was also used as a second method of evaluating ET suppression under the MESA and LESA systems. The UAS platform (ATI AgBOT™, Aerial Technology International, Wilsonville, OR, USA) was equipped with a multispectral imaging sensor (RedEdge 3, MicaSense, Inc., Seattle, WA, USA) with five wavebands, including blue (475 ± 10 nm), green (560 ± 10 nm), red (668 ± 5 nm), red edge (717 ± 5 nm), and near-infrared (840 ± 20 nm), and a radiometric-calibrated thermal infrared imaging sensor (11,000 ± 3000 nm, Tau 2 640, FLIR Systems, Wilsonville, OR, USA). The platform was flown to collect images while the irrigation system was passed over the ATMOS-41 weather sensors. The ideal time for aerial imagery was during the day at a time when the center pivot lateral was passing the installed ATMOS-41 sensors in the field to monitor the crop microclimate changes under the MESA and LESA. As low cloud cover was required for high quality aerial imagery data collection, and wind speeds lower than 4.5 m/s (10 mph) were required for the UAS flight mission, there was limited chances for aerial imagery data acquisition during this study, yet one timestamp was found to meet nearly ideal circumstances, and this set of UAS imagery was used for comparing the downwind ETc suppression under MESA and LESA irrigation systems.

2.3. Data Analysis

2.3.1. Reference Evapotranspiration from Standardized ASCE-Penman-Monteith

A module was created in RStudio (ver.4.1.0., Open Source) for calculating reference evapotranspiration ETo on an hourly basis following the standardized ASCE Penman-Monteith (ASCE-PM) equations [21]. The inputs to the model were solar radiation, wind speed, air temperature (Ta), relative humidity (RH), and vapor pressure deficit on one-minute intervals. The input parameters were used to calculate some intermediate parameters such as slope of the saturation vapor pressure curve, actual vapor pressure, net short-wave radiation, net longwave radiation, cloudiness, clear-sky solar radiation, extraterrestrial solar radiation for hourly periods, solar time angles, and soil heat flux density. Then, the standardized reference evapotranspiration (ETo) for the short reference crops (grass) was calculated using the calculated intermediate parameters and the grass reference Cn and Cd coefficients based on hourly daytime data [21]. As the constants that were used for these calculations were for use on an hourly basis, the hourly ETo values were divided by 60 to give ETo values on a one-minute basis.
The chosen duration of the recorded microclimate data was 1.5 h on 10 August 2018 and 2.5 h on 12 August 2018. For the statistical analysis, the calculated ETo was divided into three phases: before irrigation (BI), during irrigation (DI), and after irrigation (AI). An ANOVA test at the level of significance of p = 0.05 was used to compare the mean values of calculated ETo from the microclimates under MESA and LESA.
In 2019, to find irrigation events without rainfall, the relative humidity and precipitation were plotted for the MESA, LESA, and control (Cntr.) treatments for the 20 continuous days of recorded meteorological data. Days with measured precipitation (catch) values for the MESA treatments were the irrigation days, and the days with measured precipitation in the LESA and control treatments were flagged as rainy days, as water from the LESA sprinklers could not enter the ATMOS-41 rain gauges. Of the 20 days of data, five irrigated days (DOY: 217, 220, 226, 229, and 235) were highlighted with red frames (Figure 4). Days with the irrigation events at night were not considered for this experiment since the weather-based calculation of ETo was sensitive to solar radiation. Therefore, from the 20 days of recorded data for this experiment, only data of days 220 and 226 with daytime irrigation events were used.
The weather station was located on a line north to south such that the wind direction was perpendicular to the lateral irrigation system movement (Figure 1). A wind rose plotted by the ATMOS-41 installed under MESA and LESA irrigation systems showed the dominant wind direction during DOY 220 and 226 was blowing mostly from west to east (Figure 5).
A 7 h period from these days was considered for the statistical analysis. This period started 3 h before the irrigation system reached ATMOS-41 and ended up to 3 h after the irrigation event was completed. As the reported IAE of LESA was so high and because actual ET could not be directly measured, the percentage of the suppressed rate in each phase was calculated as a difference of the ETo between MESA and LESA compared to the LESA treatments (Equation (4)) or compared to the gross applied water (Equation (5)) as follows:
%   S u p p r e s s e d   R a t e   %   S R = A V G . E T 0 L E S A A V G . E T 0 M E S A A V G . E T 0 L E S A × 100
%   S u p p r e s s e d   b y   A p p l i e d   W a t e r   %   S A W = E T 0 L E S A E T 0 M E S A ( D R a i n   G a u g e ) / I A E × 100
where AVG.ETo (LESA) is the average ETo calculated from the microclimate under the LESA span in each phase of irrigation, and AVG.ETo (MESA) is the average ETo calculated from the microclimate under the MESA span in each phase of irrigation. Drain Gauge is the cumulative water that was captured by rain gauge (mm). The irrigation application efficiency (IAE) of the MESA and LESA systems was measured by following ASABE standard S436.1 [22] using a bucket and a stopwatch to measure the flow rate, a pressure gauge to measure the pressures of the nozzles, and a catch-can test for measuring net applied water under each span. The IAE of the MESA system was measured as 85%. The depth of the captured water in the MESA rain gauge was used as the measure-applied water (net irrigation, or In). The amount of ETo suppression due to the additional sprinkler water losses under the MESA span was the difference between the calculated ETo of the LESA and MESA treatments.

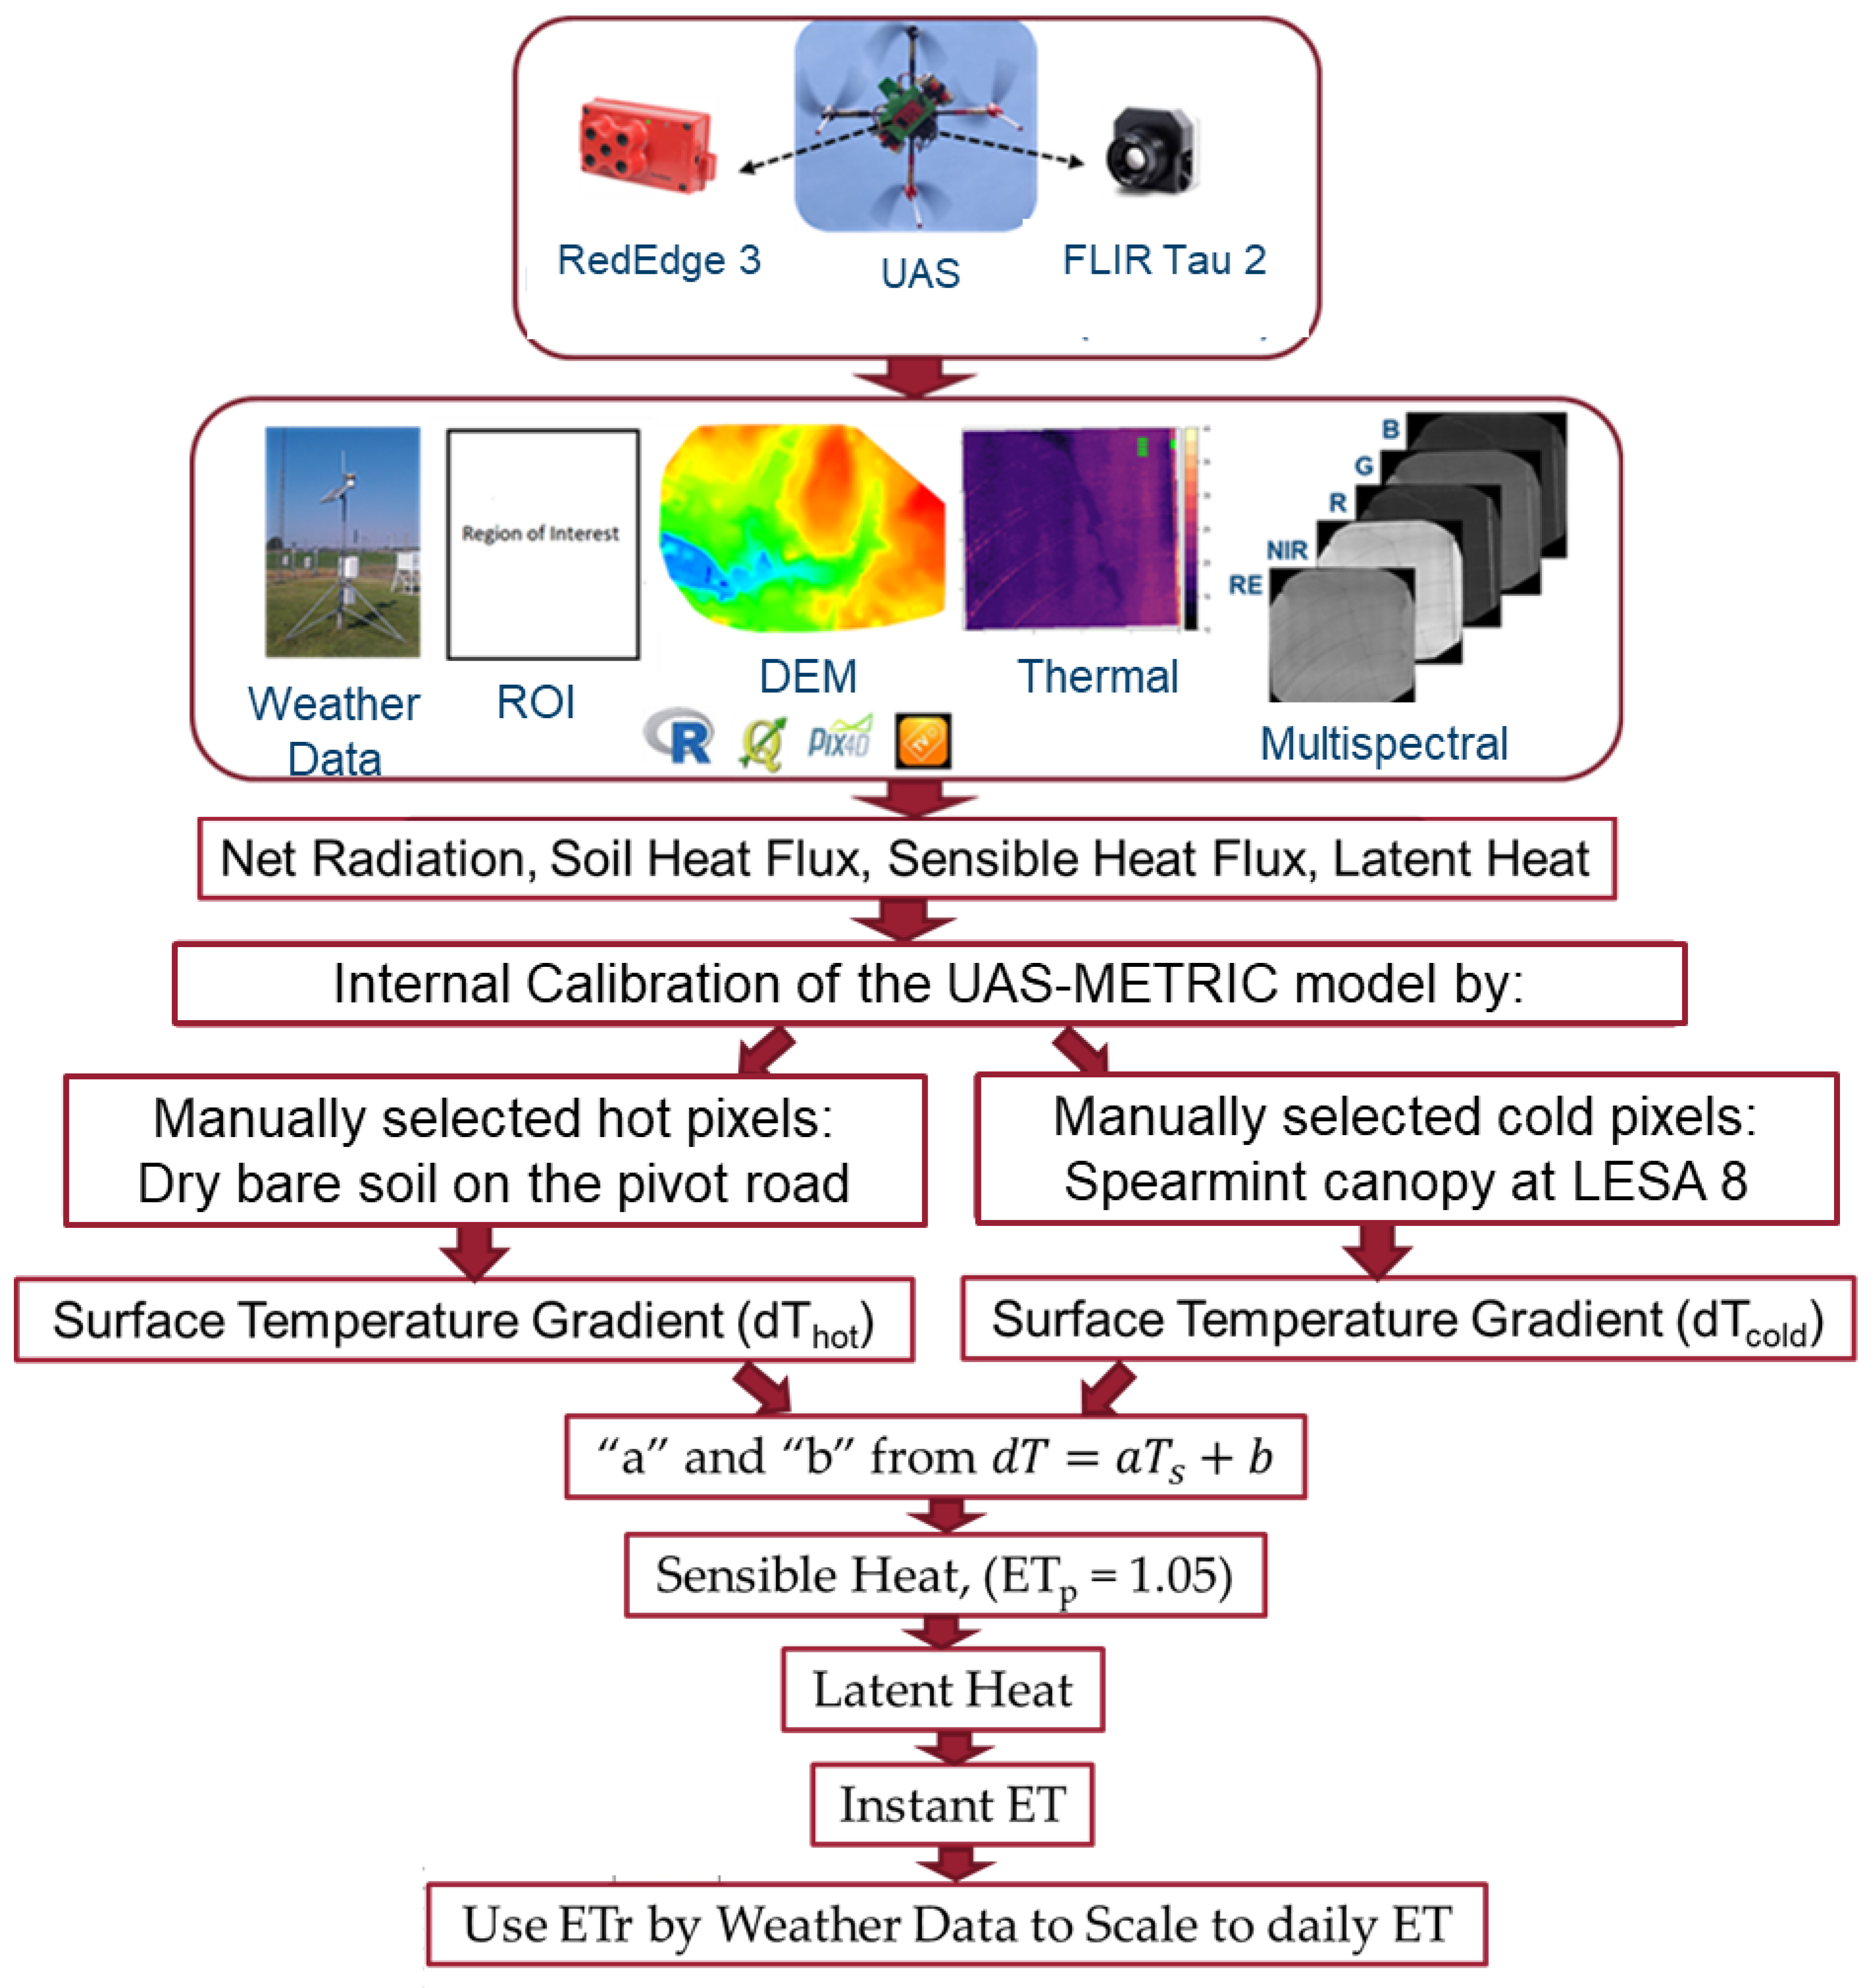
2.3.2. UAS-METRIC Model Analysis

Aerial imagery preprocessing steps for the multispectral and thermal camera were performed by photogrammetry and mapping software (Pix4D Mapper, Version 4.8.4, Pix4D, Inc., Lausanne, Switzerland). The process for generating ETc map steps followed the steps as described by Chandel et al. [1]. However, for the internal calibration of the model, instead of using the auto selection of extreme end-point pixels, the cold pixels were selected from the spearmint canopy at LESA 8 before getting wet with the irrigation system, and hot pixels were selected from dry bare soil on the pivot road. More information regarding replacing manual selection of hot and cold pixels instead of auto selection of UAS-based METRIC can be found at Molaei et al. [23].
Rectangular regions of interests (ROI) were created in QGIS to extract the samples of average ETc from three phases BI, DI, and AI, where phase BI was before the center pivot system irrigating the crop, DI was the phase during irrigation, and AI was the phase after the irrigation system passed the crop (Figure 6). The ROI samples were taken in each phase from the LESA spans (spans 6 and 8) and the MESA spans (spans 5 and 7).
Mean and standard deviation (SD) of the extracted crop evapotranspiration (ETc) from the UAS-METRIC map (Figure 7) under the MESA-5 and MESA-7 spans compared to the LESA-6 and LESA-8 spans before (BI), during (DI) and after irrigation (AI).

3. Results

3.1. Microclimate and ETo Changes

For 2018, the relative humidity (RH), air temperature (Ta), and vapor pressure deficit (VPD) under the LESA-span 6 (LESA-6), MESA-7, and LESA-8 treatments are shown in Figure 8. In the BI phase (before the irrigation system reached ATMOS-41), there were no significant differences between the RH%, Ta, and VPD under the MESA and LESA treatments. However, the average RH% values under the LESA spans at the DI (during the irrigation) phase were significantly (41–45%) lower compared to the MESA. The average RH% difference between the LESA and MESA treatments in the AI phases was 32–47% (Table 1).
Similar to the RH% values, there were no significant differences between the Ta and VPD values under LESA and MESA treatments at the BI phase. At the DI phase, the Ta of the LESA treatment was 28–34% higher compared to the MESA, and the VPD for the LESA was 1.1–2.3 kPa higher for the LESA compared to the MESA treatments. This large difference between the Ta and VPD in the MESA and LESA treatments lasted for the duration of the AI phase (Figure 8, Table 1). The average calculated ETo for MESA-7 in the BI phase was 7.1 µm/min, which was not statistically significantly different (p > 0.05) from the average ETo of LESA-6 (6.7 µm/min) and LESA-8 (7.8 µm/min, Figure 9B). A slight drop of ETo in the BI phase for both MESA and LESA treatments (Figure 9A) can be explained by the drop in the solar radiation due to the cloud cover. The instantaneous ETo rate of the MESA-7 irrigation treatment in the DI phase was suppressed by 8.0% (Equation (4)) compared to LESA-6, and 18.0% compared to LESA-8 during the irrigation event of August 10, and 11% during the irrigation event on August 12 (Table 2). The percentage of suppressed ETo by the applied water (Equation (5)) was lower than 0.5% for both irrigation events (Table 2).
Figure 10 shows the continuous monitoring of the changes in Ta, RH%, and VPD values for the MESA, LESA, and control treatments, starting 3 h before the irrigation system reached the ATMOS-41 (3 h BI) to 3 h after the irrigation (3 h AI) system passed the ATMOS-41 on DOY 220 and 226. There were no significant differences between the RH%, Ta, and VPD of the MESA and LESA treatments in all three BI phases. The RH% at the MESA treatments increased significantly by 35–42% compared to the LESA at the DI phase, and this large significant difference lasted for 1 to 2 h after the irrigation systems passed the ATMOS-41 (Table 3). The percentage differences of the Ta and VPD values between the LESA and MESA treatments at the DI phase were 14.1–16.1% (DOY: 220–226) and 0.9–1.0 kPa, respectively.
Several decreases in the ETo of the MESA, LESA, and control treatments could be observed at the BI phase in DOY 220, which could be explained by incident cloud cover and a resultant reduction in solar radiation (Figure 11A), whereas there was no significant difference between the ETo values of the MESA and LESA treatments. During the DI phases of both irrigation days, the ETo rate of the MESA compared to the LESA (Equation (4)) was suppressed by 16.9% and 11.9%. When considered as a percentage of applied water (Equation (5)), the ETo was suppressed by 0.3% and 0.2%. The percentage of suppressed ETo remained high for two hours after irrigation in both DOY 220 and 226 (Table 4). The percentage of suppressed ETo by applied water (Equation (5)) was measured as lower than 0.5% for all phases of irrigation. This indicated that only a very small portion of the applied irrigation water was suppressing ETo (ETs) under the MESA irrigation systems.

3.2. Changes in Estimated ETc Using UAS-METRIC Model

From the UAS-based estimates of ET, the overall comparison of ETc showed significantly higher ETc for LESA (4.44 ± 0.29 mm/day) compared to MESA (4.28 ± 0.29 mm/day). Using the UAS-METRIC method, the ETc rate under MESA was suppressed by 4% (Equation (4)) compared to the LESA treatments, whereas ETc was suppressed by 2% of the applied water (Equation (5)). For each phase of irrigation (BI, DI, and AI), the ETc rate under MESA was suppressed by between 3 and 4% (Equation (4)) compared to LESA (Table 5). The highest ETc was found in the DI phase (4.55 ± 0.21 mm/day), which was not significantly different from the AI phase (4.40 ± 0.32 mm/day). However, the BI treatment had the significantly lowest ETc (4.12 ± 0.16 mm/day) of all the treatments.

4. Discussion

The results show that before the crop canopy is wetted by an irrigation event (BI phase), there is no significant difference between the microclimate parameters such as Ta, RH, VPD, and ETo of the MESA and LESA irrigation treatments. A previous research study [8] that reported a reduction in the air temperature and vapor pressure deficit before the pivot sprinklers irrigated it contrasted with our observations in the 1 h BI phase for both years of the study. This could have been due to meteorological conditions or due to wind speed not being perpendicular to the pivot lateral, which does not allow for proper meteorological parameters measurements. During the irrigation event, a significantly higher %RH for MESA was observed compared to the LESA treatments, whereas the Ta and VPD under MESA decreased significantly. The maximum differences between RH and Ta between MESA and LESA were 42% and 16%, respectively. The observed significant increase in RH under MESA treatment lasted for 2 h after the irrigation system passed the ATMOS-41 and then diminished gradually until the RH values again became similar to the RH of LESA treatments. The drops of Ta in the DI and AI phases were similar to previous studies [2,5,7,8] that reported between 1.5 and 2.0 °C decreases in the canopy air temperatures. Our study showed a higher drop in Ta of up to 4.5 °C for the MESA treatment in the DI phase compared to LESA. In all ETo comparisons in the DI phases, there were significant differences between the MESA and LESA treatments. The results indicated that the microclimate created by the MESA irrigation systems could suppress ETo for up to 2 h after the irrigation passed a specific location. Urrego-Pereira et al. [8] reported a 4 h duration of the transpiration changes (sap flow measurement) for maize irrigated with the center pivot system [8]. The extended period of ET suppression might have been due to the additional amount of water that a mature maize canopy could hold as interception water compared to the shorter mint crop. In this study, both main treatments (MESA and LESA) were simultaneously irrigating the field during the experiment, whereas, in the previous studies [6,8], evapotranspiration reductions in the sprinkler irrigating plots were compared to non-irrigated plots with some time delays in measurements.
The overall results showed that the ETo of MESA (based on the microclimate parameters) was suppressed significantly compared to the LESA (p < 0.05) during the irrigation phase and one hour after the irrigation system passed the specific location. These results were shown by both the calculated ETo from the microclimate measurements and by the UAS-METRIC measurements in this experiment. However, while significant, the suppressed ET (MESA-LESA) was, on average, equivalent to less than 0.5% of the applied water in all the estimated phases. Although these differences were statistically significant, the overall reduction in ET due to microclimate modifications such as wind drift and evaporation losses was relatively small when compared to the substantial 17% average disparities in irrigation application efficiency between the MESA and LESA. Consequently, even after considering the ET suppression caused by wind drift and evaporation losses, the disparities in IAE between these two sprinkler technologies remained significant. Furthermore, the modifications applied to the IAE to accommodate the suppression of ET typically fell within the acceptable range of error for the majority of IAE measurements. To generalize these results across diverse weather conditions and irrigation practices, further extensive long-term research studies are required to evaluate the extents of ET suppressions downwind of MESA and LESA irrigation systems in various climates.

5. Conclusions

The total wind drift and evaporation losses from the center pivots were much higher for MESA systems (typically measured to be about 20%) than for the LESA systems (typically estimated to be around 3%). These water losses from wind drift and evaporation cooled and humidified the air. This reduced the energy available for crop evapotranspiration (suppressed ET). All-in-one weather stations were placed underneath a mid-elevation spray application (MESA), and low-elevation spray application (LESA) spans of a center pivot with one sensor were also placed nearby but outside the pivot field for comparison. These were used to measure solar radiation, temperature, and humidity before, during, and after a center pivot passed their locations, and this information was used with the ASCE-PM reference ET equation to calculate the amount of energy available for evapotranspiration on a one-minute basis (ETo). Aerial imagery from a UAS was also used to estimate crop ET using the METRIC energy balance model. The following conclusions were drawn from this study:
  • The MESA-irrigated treatments decreased the air temperature by 0.2–0.4 °C in the 1 h BI phase, 4.5–7 °C in the DI phase, 1.9–3.3 °C in the 1 h AI phase, and between 0.1 and 0.3 °C in the 2 h AI phases.
  • The instantaneous ETo suppression (rate reduction) of the MESA treatment compared to the LESA was between 0.79 and 1.88 µm/min (8–18% suppressed ETo rate) in the DI phase, using measurements of 1.8 m AGL. At one-meter height, the instantaneous ETo rate of the MESA was suppressed by 1.17–1.66 µm/min (12–17%) compared to the LESA.
  • ETo suppression (MESA-LESA) was, on average, equivalent to 0.5% of the applied water. Although the differences were statistically significant, the total reductions in ET due to the microclimate modifications from wind drifts and evaporation losses were small compared to the 17% average differences in irrigation application efficiencies between the MESA and LESA systems. Therefore, the irrigation application efficiency (IAE) differences between these two sprinkler technologies were still large even if the ET suppressions by wind drifts and evaporation losses were accounted for, and adjustments to the IAEs for ET suppressions were within margin of error for most measurements of the IAEs.
  • The UAS-METRIC model showed that the estimated ETc of the spearmint under MESA was suppressed by 0.16 mm/day compared to the LESA.
  • The UAS-METRIC estimated a total daily ETc from ROIs from the DI phase of both treatments of 4.55 mm/day and 4.12 mm/day from ROIs from the AI phase. This indicated that the canopy wetting under MESA was reflected in cooler canopy temperatures and thus higher estimated ETc values in the DI phase.

Author Contributions

Conceptualization, B.M., R.T.P., L.R.K., A.K.C., C.O.S. and C.S.C.; methodology, B.M., R.T.P., L.R.K., A.K.C., C.O.S. and C.S.C.; software, A.K.C. and B.M.; validation, B.M.; formal analysis, B.M.; investigation, B.M., R.T.P.; resources, R.T.P., L.R.K., C.O.S. and C.S.C.; data curation, B.M. and A.K.C.; writing—original draft preparation, B.M.; writing—review and editing, B.M., R.T.P., L.R.K., A.K.C., C.O.S. and C.S.C.; visualization, B.M.; supervision, R.T.P., L.R.K., C.O.S. and C.S.C.; project administration, R.T.P., L.R.K., C.O.S. and C.S.C.; funding acquisition, R.T.P., L.R.K., C.O.S. and C.S.C. All authors have read and agreed to the published version of the manuscript.

Funding

Part of this research was funded by the United States Department of Agriculture, National of Food and Agriculture (USDA-NIFA) institute, project numbers 1016467 and WNP0839. Also, it was funded by the Washington Mint Commission, Bonneville Power Administration, Wrigley’s, The Idaho Mint Commission, The Oregon Mint Commission, the Mint Industry Research Council (MIRC), and The Canadian Mint Growers.

Data Availability Statement

UAS data and ATMOS-41 data will be available per request.

Acknowledgments

The authors would like to thank London Lommers, Abid Sarwar, and Abdelmoneim Zakaria Mohamed for assistance and support for irrigation system conversion from MESA to LESA in this project and for their help with the data collection in this project. We acknowledge the contributions of the Center of Precision and Automate Agriculture Systems (CPAAS) at Washington State University for their support.

Conflicts of Interest

The authors declare no conflict of interest.

References

  1. Howell, T.A.; Hiler, E.A.; Van Bavel, C.H.M. Crop Response to Mist Irrigation. Trans. ASAE 1971, 14, 906–910. [Google Scholar] [CrossRef]
  2. Steiner, J.L.; Kanemasu, E.T.; Hasza, D. Microclimatic and crop responses to center pivot sprinkler and to surface irrigation. Irrig. Sci. 1983, 4, 201–214. [Google Scholar] [CrossRef]
  3. Schneider, A.D. Efficiency and uniformity of the lepaand spray sprinkler methods: A review. Trans. ASAE 2000, 43, 937–944. [Google Scholar] [CrossRef]
  4. Kang, Y.; Liu, H.-J.; Liu, S.-P. Effect of Sprinkler Irrigation on Field Microclimate. In Proceedings of the 2002 ASAE Annual Meeting, Chicago, IL, USA, 28–31 July 2002; American Society of Agricultural and Biological Engineers: St. Joseph, MI, USA, 2002. [Google Scholar]
  5. Liu, H.-J.; Kang, Y. Regulating Field Microclimate using Sprinkler Misting under Hot-dry Windy Conditions. Biosyst. Eng. 2006, 95, 349–358. [Google Scholar] [CrossRef]
  6. Martínez-Cob, A.; Playán, E.; Zapata, N.; Cavero, J.; Medina, E.T.; Puig, M. Contribution of Evapotranspiration Reduction during Sprinkler Irrigation to Application Efficiency. J. Irrig. Drain. Eng. 2008, 134, 745–756. [Google Scholar] [CrossRef] [Green Version]
  7. Cavero, J.; Medina, E.T.; Puig, M.; Martínez-Cob, A. Sprinkler Irrigation Changes Maize Canopy Microclimate and Crop Water Status, Transpiration, and Temperature. Agron. J. 2009, 101, 854–864. [Google Scholar] [CrossRef]
  8. Urrego-Pereira, Y.; Cavero, J.; Medina, E.T.; Martínez-Cob, A. Microclimatic and physiological changes under a center pivot system irrigating maize. Agric. Water Manag. 2013, 119, 19–31. [Google Scholar] [CrossRef] [Green Version]
  9. Uddin, M.J.; Murphy, S.R. Evaporation Losses and Evapotranspiration Dynamics in Overhead Sprinkler Irrigation. J. Irrig. Drain. Eng. 2020, 146, 04020023. [Google Scholar] [CrossRef]
  10. Sarwar, A.; Peters, R.T.; Mehanna, H.; Amini, M.Z.; Mohamed, A.Z. Evaluating water application efficiency of low and mid elevation spray application under changing weather conditions. Agric. Water Manag. 2019, 221, 84–91. [Google Scholar] [CrossRef]
  11. Thompson, A.L.; Martin, D.L.; Norman, J.M.; Tolk, J.A.; Howell, T.A.; Gilley, J.R.; Schneider, A.D. Testing of a water loss distribution model for moving sprinkler systems. Trans. ASAE 1997, 40, 81–88. [Google Scholar] [CrossRef]
  12. Sarwar, A.; Peters, R.T.; Shafeeque, M.; Mohamed, A.; Arshad, A.; Ullah, I.; Saddique, N.; Muzammil, M.; Aslam, R.A. Accurate measurement of wind drift and evaporation losses could improve water application efficiency of sprinkler irrigation systems − A comparison of measuring techniques. Agric. Water Manag. 2021, 258, 107209. [Google Scholar] [CrossRef]
  13. Al-Oqaili, F.; Good, S.P.; Peters, R.T.; Finkenbiner, C.; Sarwar, A. Using stable water isotopes to assess the influence of irrigation structural configurations on evaporation losses in semiarid agricultural systems. Agric. For. Meteorol. 2020, 291, 108083. [Google Scholar] [CrossRef]
  14. Abo-Ghobar, H.M. Losses from low-pressure center-pivot irrigation systems in a desert climate as affected by nozzle height. Agric. Water Manag. 1992, 21, 23–32. [Google Scholar] [CrossRef]
  15. Lamm, F.R.; Bordovsky, J.P.; Howell Sr., T.A. A Review of In-Canopy and Near-Canopy Sprinkler Irrigation Concepts. Trans. ASABE 2019, 62, 1355–1364. [Google Scholar] [CrossRef]
  16. Irmak, S.; Odhiambo, L.; Kranz, W.L.; Eisenhauer, D. Irrigation Efficiency and Uniformity, and Crop Water Use Efficiency; Biological Systems Engineering Pap. Publ.: 2011. Available online: https://digitalcommons.unl.edu/biosysengfacpub/451 (accessed on 25 June 2023).
  17. Ranjan, R.; Khot, L.R.; Peters, R.T.; Salazar-Gutierrez, M.R.; Shi, G. In-field crop physiology sensing aided real-time apple fruit surface temperature monitoring for sunburn prediction. Comput. Electron. Agric. 2020, 175, 105558. [Google Scholar] [CrossRef]
  18. Ortíz, J.N.; Tarjuelo, J.M.; de Juan, J.A. Characterisation of evaporation and drift losses with centre pivots. Agric. Water Manag. 2009, 96, 1541–1546. [Google Scholar] [CrossRef]
  19. Molaei, B.; Peters, R.T.; Mohamed, A.Z.; Sarwar, A. Large scale evaluation of a LEPA/LESA system compared with MESA on spearmint and peppermint. Ind. Crops Prod. 2021, 159, 113048. [Google Scholar] [CrossRef]
  20. Chandel, A.K.; Molaei, B.; Khot, L.R.; Peters, R.T.; Stöckle, C.O. High Resolution Geospatial Evapotranspiration Mapping of Irrigated Field Crops Using Multispectral and Thermal Infrared Imagery with METRIC Energy Balance Model. Drones 2020, 4, 52. [Google Scholar] [CrossRef]
  21. Allen, R.G.; Walter, I.A.; Elliott, R.L.; Howell, T.A.; Itenfisu, D.; Jensen, M.E. The ASCE Standardized Reference Evapotranspiration Equation; American Society of Civil Engineers: Reston, VA, USA, 2005; ISBN 978-0-7844-0805-6. [Google Scholar]
  22. ANSI/ASAE S436.1; Test Procedure for Determining the Uniformity of Water Distribution of Center Pivot and Lateral Move Irrigation Machines Equipped with Spray or Sprinkler Nozzles. ASAE: St. Joseph, MI, USA, 2007; p. 8.
  23. Molaei, B.; Peters, R.T.; Khot, L.R.; Stöckle, C.O. Assessing Suitability of Auto-Selection of Hot and Cold Anchor Pixels of the UAS-METRIC Model for Developing Crop Water Use Maps. Remote Sens. 2022, 14, 4454. [Google Scholar] [CrossRef]
Figure 1. Scheme of the experimental design in 2018 and 2019.
Water 15 02444 g001
Figure 2. ATMOS-41 weather stations installed at 1.8 m above ground under spans of MESA and LESA configurations of the center pivot as it approached the sensors in August 2018.
Water 15 02444 g002
Figure 3. ATMOS-41 weather stations installed at 1 m above ground under spans of MESA and LESA configurations of the center pivot as it passed over the sensors in August 2019.
Water 15 02444 g003
Figure 4. Relative humidity and precipitation of the 20 days of recorded data in 2019 for the MESA, LESA, and Control treatments to find days with irrigation events (the dates with red borders) that were used in this study.
Water 15 02444 g004
Figure 5. Wind rose of the MESA and LESA treatments for day of year 220 and 226 in year 2019.
Water 15 02444 g005
Figure 6. Visual flowchart for processing UAS-based imagery to obtain mapping evapotranspiration at high resolution with internalized calibration (METRIC) energy balance model. The manually selected hot and cold pixels on this flowchart only applies to this field of view.
Water 15 02444 g006
Figure 7. (A) Thermal map of the spearmint field irrigated with MESA (spans 5 and 7) and LESA (6 and 8) irrigation systems. The green triangles on pivot road and the spearmint canopy indicated the hot and cold pixels, respectively, that were used for the internal calibration of the UAS-METRIC model. (B) Spearmint evapotranspiration from the UAS-METRIC model using aerial images taken 100 m above the ground level. The ETc map was imported in MATLAB for extracting ROI samples. ROIs were divided into three phases: before, during, and after irrigation by the center pivot system.
Water 15 02444 g007
Figure 8. Measurements of relative humidity and air temperature (1 min interval) relative to the ATMOS-41 installed under MESA and LESA treatments in three phases of before (BI), during (DI), and after irrigation (AI) in 2018. The measured depth of irrigation (mm) is plotted to identify these phases.
Water 15 02444 g008
Figure 9. (A) One-minute basis calculation of reference evapotranspiration (ETo) under MESA and LESA treatments relative to the ATMOS-41 in three phases of before (BI), during (DI), and after irrigation (AI). (B) Spread of calculated ETo with statistical analysis between MESA and LESA treatments in each phase of irrigation. Different letters indicate that mean value of the measured parameters was significantly different after ANOVA test with a single factor (p < 0.05).
Water 15 02444 g009
Figure 10. One-minute measurements of relative humidities and air temperatures under the MESA and LESA treatments for day of year (DOY) 220 and 226. The phases are shown relative to the irrigation event for 3 h before irrigation (3 h BI) until 3 h after irrigation (3 h AI) the ATMOS-41. The depth of irrigation (mm) is plotted to identify these phases.
Water 15 02444 g010
Figure 11. (A) Monitoring changes in the reference evapotranspiration (ETo) under center pivot spans with MESA and LESA irrigation systems while the irrigation system is passing the ATMOS-41. (B) Spread of calculated ETo for DOY 220 and 226 with statistical analysis between MESA and LESA treatments in each phase of irrigation. Different letters indicate that mean value of the measured parameters was significantly different after ANOVA test with a single factor (p < 0.05).
Water 15 02444 g011
Table 1. Mean, standard deviation (SD), and percentage differences of the relative humidities (RH), air temperatures (Ta), and vapor pressure deficits (VPDs) (1 min interval) under MESA and LESA treatments in the phases of before (BI), during (DI), and after irrigation (AI) event in 2018.
Date, TreatmentsPhaseRH_MESA (%) RH_LESA (%)% RH Diff.
(LESA-MESA)
Ta_MESA (°C)Ta_LESA (°C)% Ta Diff.
(LESA-MESA)
VPD_MESA
(kPa)
VPD_LESA
(kPa)
VPD Diff.
(LESA-MESA)
Mean ± SD 2Mean ± SD Mean ± SDMean ± SD Mean ± SDMean ± SD
10 August 2018,
MESA_7, LESA_6
BI0.48 a 3 ± 0.030.49 a ± 0.04+2.0832.5 a ± 0.6131.9 a ± 0.82−1.882.5 a ± 0.22.4 a ± 0.2−0.1
DI0.82 a ± 0.140.45 b ± 0.04−45.225.4 b ± 2.4332.6 a ± 0.48+28.30.6 b ± 0.32.7 a ± 0.1+2.1
AI0.71 a ± 0.030.48 b ± 0.03−32.332.8 a ± 0.6229.9 b ± 0.65−8.841.2 b ± 0.22.6 a ± 0.3+1.4
10 August 2018,
MESA_7, LESA_8
BI0.48 a ± 0.030.45 b ± 0.03−6.2532.5 a ± 0.6132.8 a ± 0.54+0.922.5 a ± 0.12.7 a ± 0.2+0.2
DI0.83 a ± 0.140.44 b ± 0.02−46.925.7 b ± 2.433.4 a ± 0.23+29.90.6 b ± 0.22.9 a ± 0.4+2.3
AI0.71 a ± 0.030.46 b ± 0.02−35.229.9 b ± 0.6233.2 a ± 0.46+11.11.2 b ± 0.32.7 a ± 0.2+1.5
12 August 2018,
MESA_7, LESA_8
BI0.57 a ± 0.020.58 a ± 0.03+1.7520.4 a ± 0.420.6 a ± 0.52+0.981.0 a ± 0.11.0 a ± 0.4+0
DI0.93 a ± 0.120.54 b ± 0.03−41.916.2 b ± 1.421.7 a ± 0.43+33.90.1 b ± 0.21.2 a ± 0.2+1.1
AI0.95 a ± 0.040.52 b ± 0.03−45.317.3 b ± 2.122.3 a ± 0.52+28.90.1 b ± 0.31.3 a ± 0.3+1.2
Note(s): All values of relative humidity multiply by 100; 2 Standard deviation; 3 For each phase and pivot span, different letters indicate that mean value of the measured parameters was significantly different after ANOVA test with a single factor (p < 0.05).
Table 2. Percentage of suppression rate (%SR) and suppression of applied water (%SAW) between MESA and LESA treatments in the experiment of 2018.
DatePhaseMean (h)Pivot Span NumberNet Applied Water (mm)% SR
(LESA-MESA)
% SAW
(LESA-MESA)
10 August 2018BI0.537 and 68.7−5.4−0.13
DI0.338.00.14
AI0.63−1.6−0.05
10 August 2018BI0.537 and 88.790.25
DI0.33180.37
AI0.6280.26
12 August 2018BI17 and 812.92.20.05
DI0.4110.90.10
AI0.814.80.09
Table 3. One-hour mean and standard deviation (SD) of microclimate variables (relative humidity, RH, and air temperature, Ta) in the MESA, LESA, and Control treatments from 3 h before irrigation event (3 h BI) until 3 h after irrigation event (3 h AI).
DateDOY 1PhaseRH_MESA
(%) 2
RH_LESA
(%)
RH_Control
(%)
% RH Diff.
(LESA-MESA)
Ta_MESA
(°C)
Ta_LESA
(°C)
Ta_Control
(°C)
% Ta Diff.
(LESA-MESA)
VPD_MESA
(kPa)
VPD_LESA
(kPa)
VPD_Control (kPa)
Mean ± SDMean ± SDMean ± SD Mean ± SDMean ± SDMean ± SD Mean ± SDMean ± SDMean ± SD
8 August 20192203 h BI69.1 a 3 ± 5.069.6 a ± 5.061.3 b ± 6.00.726.1 b ± 0.826.2 b ± 0.826.8 a ± 1.00.41.0 b ± 0.21.0 b ± 0.21.4 a ± 0.3
2 h BI57.9 a ± 6.058.7 a ± 6.046.8 b ± 4.01.428.9 b ± 0.0628.8 b ± 0.0630.1 a ± 0.04−0.341.7 b ± 0.31.6 b ± 0.32.3 a ± 0.3
1 h BI53.1 a ± 3.555.6 a ± 2.944.4 b ± 3.84.529.1 b ± 0.0428.7 b ± 0.0330.1 a ± 0.04−1.41.9 b ± 0.21.8 b ± 0.22.4 a ± 0.3
DI75.4 a ± 1155.9 b ± 1.446.0 c ± 1.4−34.824.3 c ± 2.328.3 b ± 0.429.7 a ± 0.514.10.8 c ± 0.51.7 b ± 0.12.2 a ± 0.1
1 h AI67.7 a ± 8.055.7 b ± 1.144.6 c ± 2.0−21.526.9 c ± 1.228.8 b ± 0.430.6 a ± 0.46.61.2 c ± 0.41.8 b ± 0.12.4 a ± 0.1
2 h AI51.6 a ± 2.048.6 b ± 1.838.2 c ± 2.0−6.228.8 c ± 0.429.1 b ± 0.331.0 a ± 0.411.9 c ± 0.12.1 b ± 0.12.8 a ± 0.1
3 h AI55.1 a ± 3.355.6 a ± 3.543.4 b ± 0.41.128.2 b ± 0.0327.9 b ± 0.0330.3 a ± 0.6−11.7 b ± 0.21.7 b ± 0.22.4 a ± 0.2
14 August 20192263 h BI59.3 a ± 2.859.7 a ± 2.845.9 b ± 1.60.725.2 c ± 0.4924.9 b ± 0.526.1 a ± 0.5−1.21.3 b ± 0.11.3 b ± 0.11.8 a ± 0.1
2 h BI55.1 a ± 3.455.9 a ± 2.840.1 b ± 2.01.426.6 b ± 0.6326.3 b ± 0.527.6 a ± 0.5−1.151.6 b ± 0.21.5 b ± 0.12.2 a ± 0.1
1 h BI49.1 a ± 2.650.2 a ± 2.534.9 b ± 1.72.227.8 b ± 0.5427.6 b ± 0.329.0 a ± 0.5−0.71.9 b ± 0.11.8 b ± 0.12.6 a ± 0.1
DI72.3 a ± 4.050.7 b ± 2.232.8 c ± 0.8−42.623.4 c ± 2.6827.9 b ± 0.330.0 a ± 0.316.10.9 c ± 0.61.9 b ± 0.12.9 a ± 0.1
1 h AI66.9 a ± 7.648.4 b ± 0.231.3 c ± 0.8−38.225.1 c ± 1.1628.4 b ± 0.330.6 a ± 0.411.61.1 c ± 0.52.0 b ± 0.13.0 a ± 0.1
2 h AI48.7 a ± 1.648.6 a ± 2.229.4 b ± 0.8−0.228.7 b ± 0.3428.8 b ± 0.431.5 a ± 0.30.32.0 b ± 0.12.0 b ± 0.13.3 a ± 0.1
3 h AI45.7 b ± 1.147.2 a ± 1.231.2 c ± 0.93.1729.3 b ± 0.2228.9 c ± 0.231.6 a ± 0.3−1.42.2 b ± 0.12.1 b ± 0.13.2 a ± 0.1
Note(s): 1 DOY: Day of year; 2 Multiply all values of relative humility by 100; 3 For each phase and pivot span, different letters indicate that mean value of the measured parameters was significantly different after ANOVA test with single factor (p = 0.05).
Table 4. Percentage of suppression rate (%SR) and suppression of applied water (%SAW) between MESA and LESA and Control treatments in the experiment of 2019.
DateDOY 1PhasePhase Duration (Hour)Net Applied Water (mm)% SAW
(LESA-MESA)
% SAW
(Control-MESA)
% SAW
(Control-LESA)
% SR
(LESA-MESA)
% SR
(Control-MESA)
% SR
(Control-LESA)
8 August 20192203 h BI119.50.050.130.082.345.853.26
2 h BI10.060.150.092.265.593.11
1 h BI1−0.03−0.010.03−1.47−0.251.20
DI0.60.270.280.0116.920.890.45
1 h AI10.260.22−0.0410.49.84−1.65
2 h AI10.05−0.06−0.112.19−2.82−5.20
3 h AI1−0.04−0.030.01−4.37−2.791.43
Overall 0.620.680.06
14 August 20192263 h BI119.70.010.210.210.0211.011.0
2 h BI10.030.230.201.379.448.18
1 h BI10.440.550.1217.5321.34.58
DI0.660.200.330.1311.8918.27.11
1 h AI10.410.490.0716.4018.72.76
2 h AI10.290.330.0411.7113.31.77
3 h AI10.010.010.000.660.54−0.12
Overall 1.382.150.77
Note(s): 1 DOY: Day of year.
Table 5. Mean and standard deviation (SD) of the extracted crop evapotranspiration (ETc) from the UAS-METRIC map (Figure 7) under the MESA-5 and MESA-7 spans compared to the LESA-6 and LESA-8 spans before (BI), during (DI) and after irrigation (AI).
Phase Net Applied
Water (mm)
ETc_(mm/day)ETc Suppression of the Total Applied Water (%)
(Equation (5))
ETc Suppression Rate (%)
(Equation (4))
Mean ± SD
Irrigation Systems, Means for All Phases 1LESA12.94.9 a ± 0.32.04.0
MESA4.7 b ± 0.3
Phase of Irrigation, Means for Both 2BI4.7 b ± 0.2
DI4.9 a ± 0.2
AI4.8 a ± 0.3
BILESA4.8 a ± 0.12.04.0
MESA4.6 b ± 0.2
DILESA5.0 a ± 0.21.03.0
MESA4.8 b ± 0.2
AILESA5.0 a ± 0.52.04.0
MESA4.7 b ± 0.3
Note(s): 1 LSMeans Differences Student’s t-test; 2 LSMeans Difference Tukey HSD.
Disclaimer/Publisher’s Note: The statements, opinions and data contained in all publications are solely those of the individual author(s) and contributor(s) and not of MDPI and/or the editor(s). MDPI and/or the editor(s) disclaim responsibility for any injury to people or property resulting from any ideas, methods, instructions or products referred to in the content.

