Article

Hydrogeochemical Characteristics and Environment Quality Assessment of Karst Groundwater in Mengzi Basin of Yunnan Province, China

1
CCCC Highway Consultants Co., Ltd., Beijing 100010, China
2
School of Earth Sciences, Guilin University of Technology, Guilin 541006, China
3
Institute of Karst Geology, Chinese Academy of Geological Sciences, Guilin 541004, China
*
Author to whom correspondence should be addressed.
Water 2023, 15(11), 2126; https://doi.org/10.3390/w15112126
Submission received: 26 March 2023 / Revised: 18 May 2023 / Accepted: 29 May 2023 / Published: 3 June 2023
(This article belongs to the Topic Carbon-Energy-Water Nexus in Global Energy Transition)

Abstract

:
One quarter of the world’s population uses karst groundwater. Due to the complex hydrological conditions in karst areas, they are vulnerable to pollution. The study of the hydrochemical characteristics and environmental quality evaluations of karst groundwater is of great significance for the rational development and utilization of karst groundwater. The study area is located in the Mengzi area of Yunnan Province, which is a typical karst area. The groundwater in the study area was analyzed and evaluated by a statistical analysis, hydrogeochemical analysis, ion ratio and Nemerow’s index method (PN). The results show that the hydrochemical types are mainly the Ca–HCO3 and Ca–Mg–HCO3 types. The main hydrochemical compositions of groundwater were controlled by carbonate dissolution. The results of the water quality evaluation show that the main pollutants in the study area are Mn, COD and NO3. Compared with groundwater, the concentration and exceeding rate of pollutants in surface water are much higher than those in groundwater. There is the possibility of groundwater pollution by surface water infiltration. The results reveal the characteristics of groundwater pollution in typical karst areas and provide a theoretical basis for the rational development and utilization of groundwater.

1. Introduction

Water resources can be very scarce in our country, and groundwater is vital. It is estimated that groundwater supplies one third of the world’s freshwater intake and 50% of drinking water [1,2], and groundwater is the main or even the only drinking source in many regions [3,4]. It is estimated that 25% of the world’s population is mainly or entirely supplied by karst groundwater [5]. Karst groundwater has the advantages of better quality, stable quantity, abundant reserves and is mainly discharged in the form of underground rivers or karst springs, and it has become an important water source in karst areas [6,7]. However, karst groundwater has the characteristics of concealment, difficult recovery and persistence, which increases the difficulty of pollution prevention and control [8]. In addition, karst groundwater has strongly hydraulic alternation conditions, so it is more susceptible to pollution and rapid migration [9]. Once the karst groundwater is polluted, it is difficult to recover and seriously threatens the health of local residents, resulting in increased health risks [10,11].
In recent years, a large number of studies have shown that groundwater quality has deteriorated seriously. Climate change and related extreme events have exacerbated the negative trend of water quality [12,13]. Natural inferior groundwater has also been widely reported [14,15,16]. Natural high chromium groundwater has been reported in China [17], the USA [18] and Italy [19], and its concentration exceeds the 50 μg/L stipulated by the WHO. Natural high arsenic groundwater is widely distributed in the world, in China [20], Bangladesh [21] and Vietnam [22]. Seasonal changes also affect water quality and geologic pollution is an important factor; Karunanidhi et al. [23] counted the geological pollution of groundwater in different parts of the world, such as seawater intrusion contaminated groundwater along coastal south India [24], and found that fluorine pollution exists in the groundwater in the semi-arid area of Maharashtra in western India [25]. Fuoco et al. [26] found that in a deep crystalline rock aquifer, the decrease of calcium ion concentration leads to the dissolution of fluorite, which leads to an increase in the F content in groundwater. Due to the significant differences in bacterial community structures in different seasons, the water quality changes seasonally [27]. Peter et al. [28] found that the concentration of nitrate in Beijing’s rainy season was too high due to the pollution of ammonium salt.
Karst groundwater systems are the most easily polluted groundwater system. Numerous studies show that groundwater is seriously polluted by humans [29]. For instance, Zhang et al. [30] argued that the decline of groundwater levels and water quantity in Taiyuan, Shanxi, was mainly caused by overexploitation. Coal mining in the Jiaozuo area leads to a decline of the karst groundwater level, deterioration of water quality and water pollution [31]. Recently, a typical anthropogenic pollutant microplastic was found in karst groundwater in Anshun City, Guizhou Province [32]. Microplastics and other anthropogenic pollutants, including phosphate, chloride and triclosan, were found in karst groundwater in Illinois, USA [33].
With the development of urbanization and agriculture, karst groundwater has become polluted. Some areas relying on karst groundwater resources are facing a water shortage, so it is urgent to carry out a karst groundwater environmental assessment. At present, multivariate statistical techniques, hydrogeochemical evaluation, heavy metal index and other evaluation methods have been developed [34,35,36]. Groundwater hydrochemical characteristics are widely used to reveal the current situation of groundwater environmental quality and its interaction mechanism with the environment [37,38]. The influence of the water–rock interaction and activity on groundwater can be effectively by multiple ion ratio and chemical equilibrium analysis [39,40]. Song et al. [9] used a hydrogeological chemical process analysis and optimized fuzzy clustering analysis method to improve the rationality of the division of karst groundwater risk areas, and provide a scientific basis for the protection of groundwater. Nemerow’s index represents the comprehensive pollution level of several parameters, which is widely used in comprehensive evaluations of water quality [17,41,42,43].
Yunnan karst areas have an abundance of groundwater resources, but groundwater pollution is becoming more and more serious. Due to anthropogenic pollution, the phosphorus in groundwater in Songming, Yunnan was obviously excessive [44]. The hot spring water in eastern Yunnan has a high fluoride content [45]. A large amount of semi-volatile organic compounds was also detected in Yunnan groundwater [46]. At the same time, Yunnan surface water is also polluted to a certain extent [47]. Most karst groundwater pollution is closely related to industrial activities, and there are few reports on karst groundwater pollution in non-industrial areas. The Mengzi Basin is one of the six major basins in Yunnan Province, which belongs to one of the super large karst underground river systems in southwest China. The shortage of water resources is stable and serious, and the anthropogenic pollution in the discharge area has been aggravated in recent years [48]. However, the hydrochemical characteristics and water quality of groundwater in the source recharge area are still unclear.
Therefore, the karst groundwater in the Mengzi area of Yunnan Province was taken as the research object, and the groundwater quality was comprehensively investigated. The chemical characteristics of groundwater in the study area were discovered, and the environmental quality of the study area was evaluated. The findings provide a basis for the rational development and utilization of groundwater and the protection of the groundwater environment.

2. Materials and Methods

2.1. Study Area

The study area is located in Mengzi City, Yunnan Province, China (Figure 1a). It has a subtropical monsoon climate, with an average annual temperature of 19.9 °C, an average annual rainfall of 1533 mm and average evaporation of 1340 mm. The rainfall is mostly concentrated in May to September, and the altitude is 1380 to 2320 m above sea level. The study area belongs to the typical karst landform. The groundwater system is developed, and the surface rocky desertification is significant. At the same time, the regional surface water shortage is serious. Dounan manganese deposit, one of the eight major manganese deposits in China, is developed within the study area. A significant amount of mineralization phenomena can be seen on the surface of the study area: manganese nodules, iron staining and thin coal seams.
The Mengzi Basin is one of the six major basins in Yunnan Province. It is a lacustrine plain formed by lacustrine sediments. The exposed strata in the area are Cambrian, Devonian, Carboniferous, Permian, Triassic, Neogene and Quaternary (Figure 1c). Among them, Cambrian, Devonian and Triassic are the most widely distributed and the main aquifers in the area. The water-bearing lithology is mainly limestone, dolomite and sandstone, and the water is abundant. It is the main source of water for residents in the area. The development of faults in the study area leads to the fracture of carbonate rocks in the area, which provides favorable conditions for the development of an underground river system.
The groundwater in the study area belongs to the Nandong groundwater system (Figure 1b). The types of groundwater in the area are pore water and karst water. The pore water occurs in Quaternary loose rocks and Neogene pores, and karst water occurs in carbonate caves or fissures. This study is mainly based on karst water. Karst groundwater in the study area is mainly recharged by atmospheric precipitation. Precipitation is poured into the groundwater through a sinkhole or is quickly infiltrated through the dissolution fissure to recharge the groundwater. Groundwater is collected in the underground river pipeline, rapidly runoffs to low-lying areas and is discharged through the underground river outlet and karst springs. Groundwater flows from southeast to northwest.

2.2. Groundwater Sampling

A total of sixty-four water samples were collected in the summer of 2015, as shown in Figure 1b. These samples include twelve surface water samples and fifty-two groundwater samples. In addition, the groundwater was collected from the spring and the groundwater river outlet; the surface water samples include ten pond samples and two reservoir samples. This groundwater is used for irrigation and drinking, while surface water is mostly used for daily life and a small part for drinking.
Sampling began after the pH, oxidation reduction potential (ORP), electric conductivity (EC), temperature (T) and dissolved oxygen (DO) were stabilized. Sampling containers were acid-washed and rinsed with deionized water (DI water) thoroughly in the laboratory prior to the field sampling. All water samples were passed through 0.22 μm membrane filters in the field. The samples for the analysis of major cations, trace elements and heavy metals were collected in 500 mL HDPE (high density polyethylene) bottles and acidified to pH < 2 with high-grade pure nitric acid. The samples for testing major anions were taken in 500 mL HDPE bottles. The HDPE bottles were produced by Tianjin Jingteng. All groundwater samples were brought to the laboratory within 3 days and stored at 4 °C before analysis.

2.3. Water Analysis

Groundwater EC, pH, ORP, T and TDS were measured in situ in the field using a multiparameter probe meter (HANNA, HI 9828), and the precision was 1 μs/cm, 0.01, 0.01 mv, 0.1 °C and 0.01 mg/L, respectively. Alkalinity was measured in the field using a model 16900 digital titrator (HACH) with a bromocresol green-methyl red indicator, with an accuracy of 0.01 mg/L. The contents of NH4+ were measured by a portable spectrophotometer (DR2800, HACH) with resolutions of 0.02 mg/L. All meters were calibrated with standard solutions prior to use.
All groundwater sample determinations were completed at the Karst Geological Resources and Environmental Supervision and Testing Center of the Ministry of Natural Resources, with analytical and testing qualifications (CMA measurement certification). The major cations of Ca2+, Mg2+, Na+ and K+ in the groundwater were analyzed by ICP-AES (iCAP6000, Thermo, Waltham, MA, USA), and heavy metals and trace elements were measured by ICP-MS (7500C, Agilent, Santa Clara, CA, USA), with detection accuracies better than 0.5%. Cl, NO3 and SO42−, were measured by ion chromatography (ICS2000, Dionex, Sunnyvale, CA, USA), and the analytical precision was better than 3%. The ionic charge imbalance between the main cations and anions was mostly less than ±5% [49]. CODMn was measured using KMnO4 as the oxidant.

3. Results and Discussion

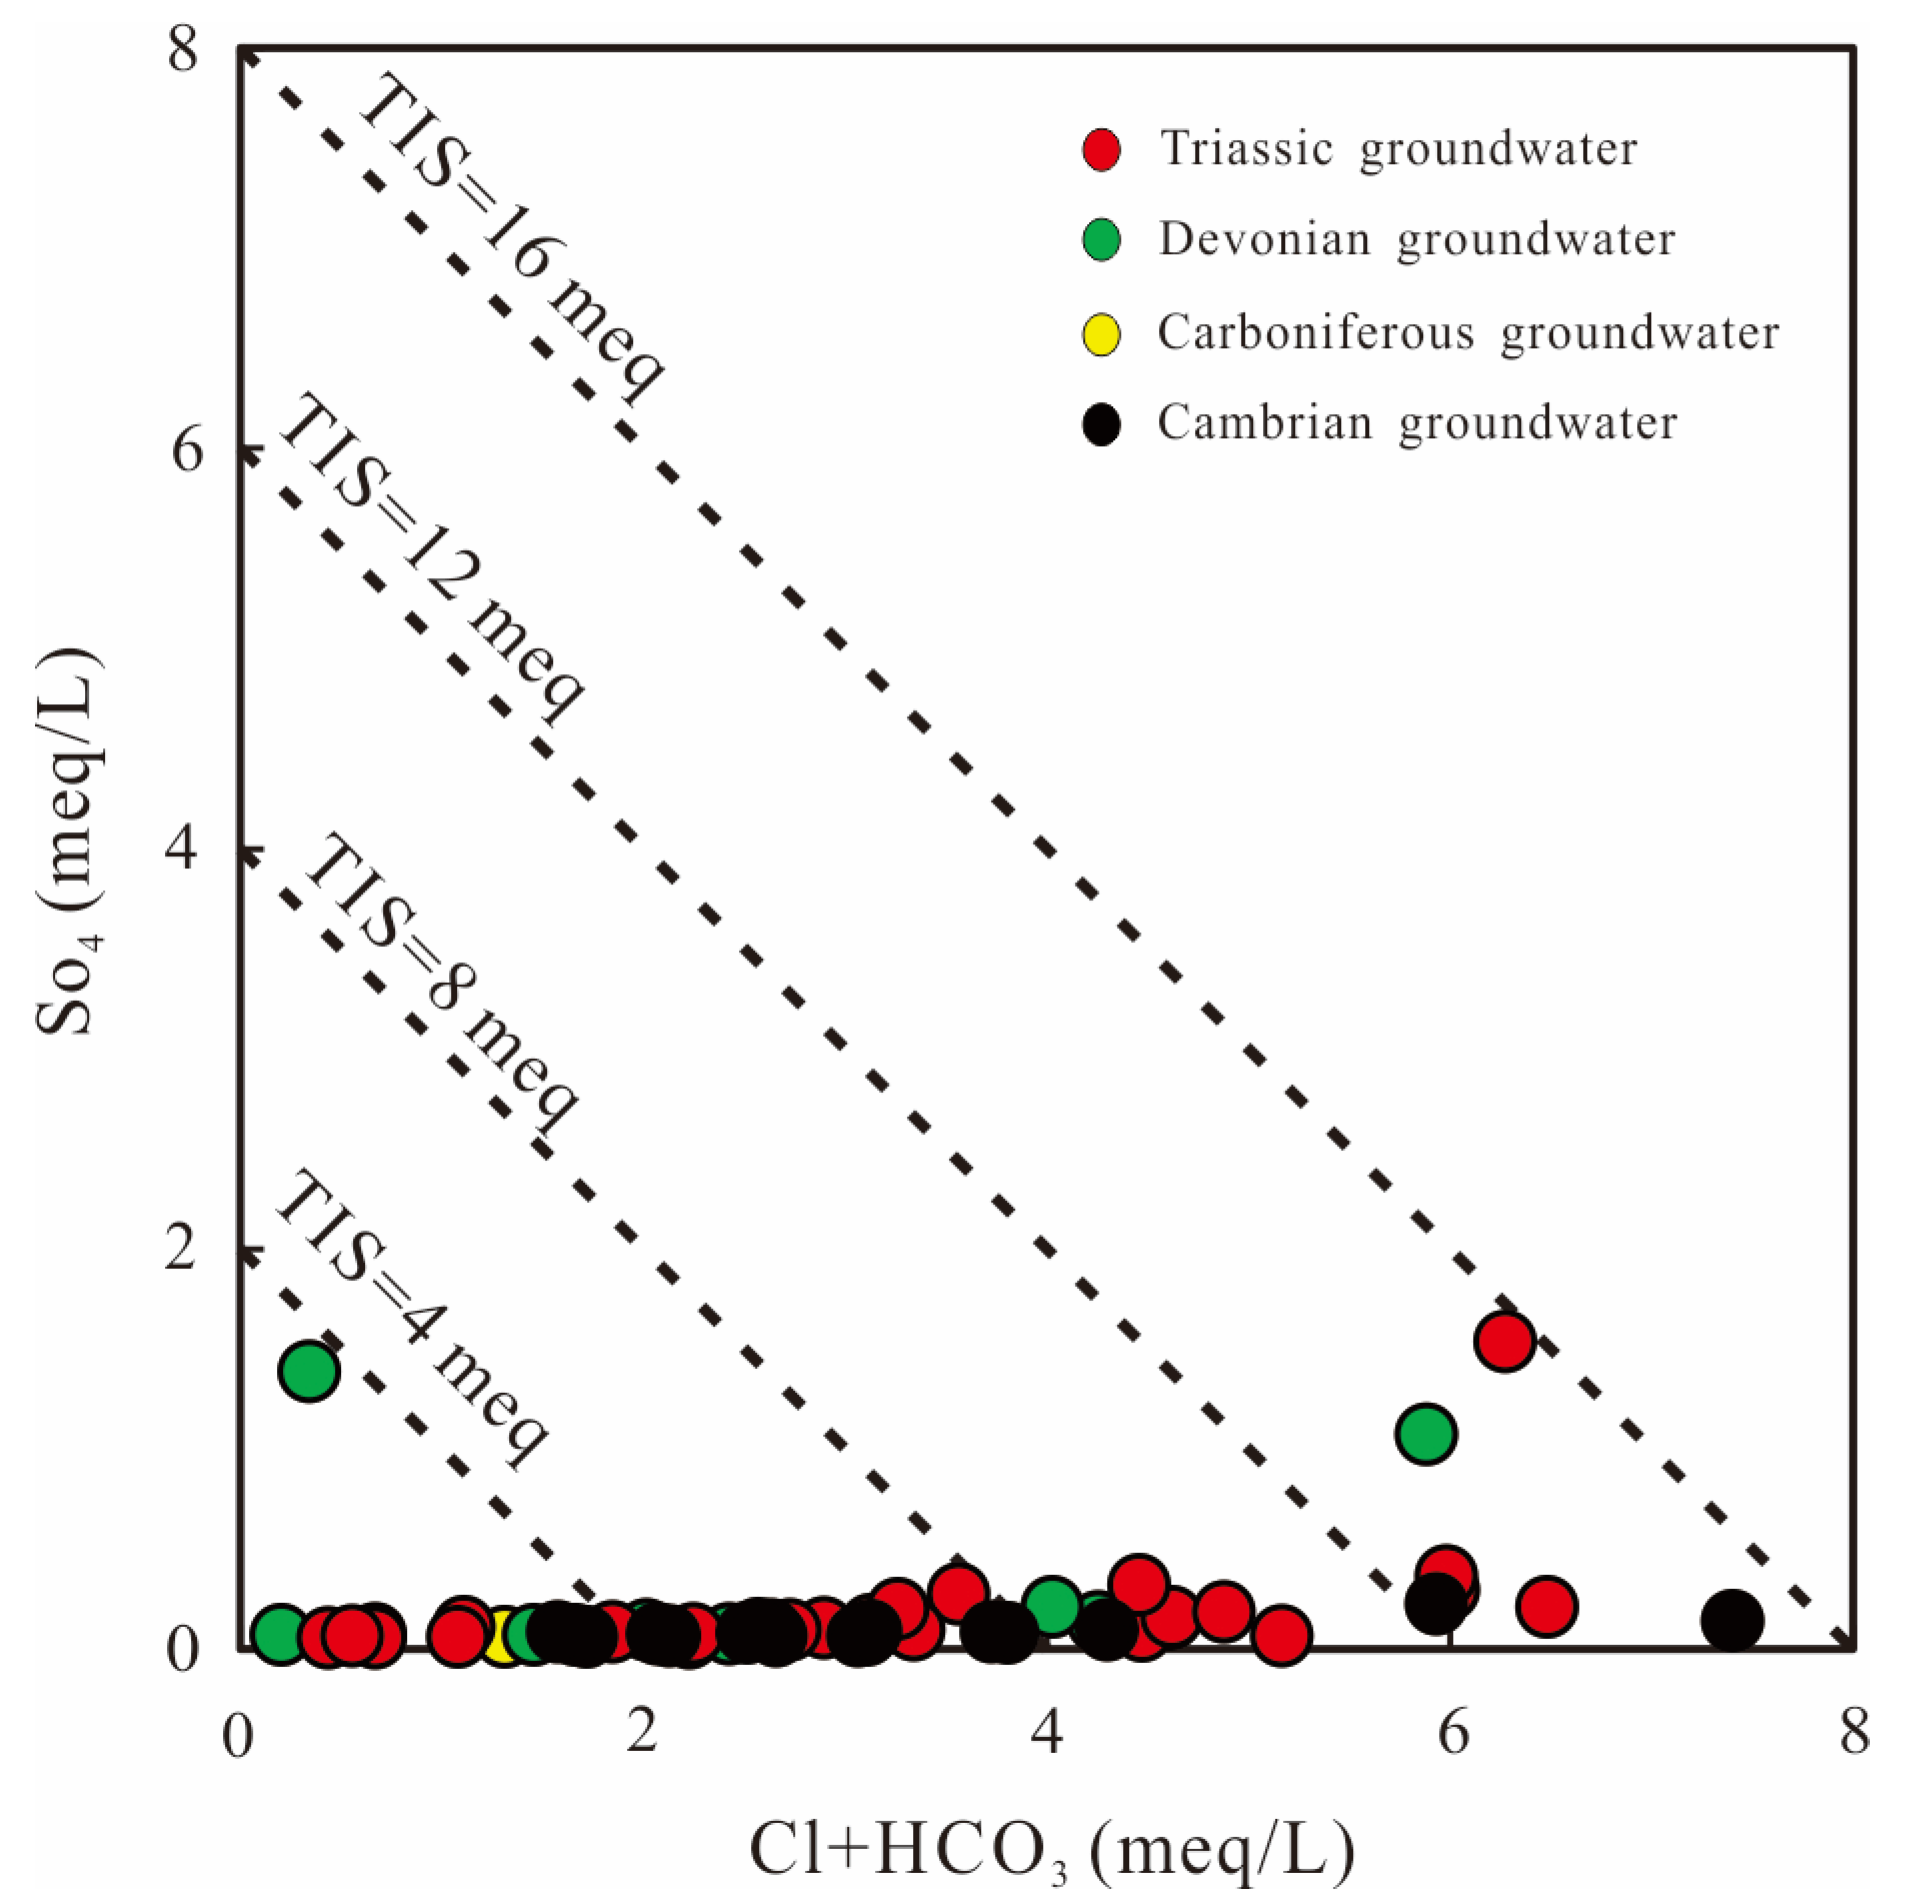
3.1. Hydrochemical Characteristics

According to different aquifer strata, the groundwater samples were divided into: 24 Triassic groundwater, 12 Devonian groundwater, 1 Carboniferous groundwater and 15 Cambrian groundwater. The statistical results of the main hydrochemical parameters of groundwater samples in this study are shown in Table 1.
The groundwater in the study area was neutral. The pH of Triassic groundwater was between 6.89 and 8.16 with a mean value of 7.45. The pH values in Devonian groundwater and Cambrian groundwater range from 6.25 to 8.12 (average, 7.38) and 7.21 to 8.08 (average, 7.83), and in surface water they range from 6.97 to 7.89 (average, 7.31). There was no obvious difference in pH value, and the pH of the Cambrian groundwater was slightly higher than other groundwater.
The total dissolved solid (TDS) values of groundwater in this study area are very low. The TDS in Triassic groundwater was in the range of 37.3–616 mg/L (average, 282 mg/L); the TDS in Devonian groundwater between 17 and 555 mg/L with a mean value of 218 mg/L; and in Cambrian groundwater between 132 and 580 mg/L with a mean value of 270 mg/L. The TDS values in surface water were similar to that of groundwater, in the range of 58.2–446 mg/L with a mean value of 243 mg/L.
The chemical oxygen demand (CODMn) reflects the organic pollution in water. CODMn was not detected in most of the groundwater samples, but it was detected in all surface water samples. The maximum CODMn concentrations in Triassic groundwater, Devonian groundwater and Cambrian groundwater were 3.01 mg/L, 2.28 mg/L and 5.06 mg/L, respectively. There were lower levels in the surface water samples (0.95 to 7.63 mg/L, average 4.39 mg/L), indicating that the surface water contains more organic matter.
For cations, Calcium was the major cation. The Ca2+ concentrations of the Triassic groundwater, Devonian groundwater and Cambrian groundwater samples ranged from 5.62 to 149 mg/L (mean, 58.4 mg/L), 1.09 to 149 mg/L (mean, 41.2 mg/L) and 20.8 to 75 mg/L (mean, 37.2), respectively. The second highest major cation was Magnesium, which range between 0.86–32.3 mg/L (mean, 8.39) in Triassic groundwater, be-tween 0.44–24.3 mg/L (mean, 10.1 mg/L) in Devonian groundwater and from 4.71 to 36.7 mg/L (mean, 19 mg/L) in Cambrian groundwater. As shown in Figure 2, the concentrations of Ca2+ in groundwater was Triassic > Devonian > Cambrian, but Mg2+ concentrations were Cambrian > Devonian > Triassic. The order of cation in groundwater is the Ca2+ > Mg2+ > Na+ > K+. The highest major cations in surface water were Ca2+ (6.69 to 44.1 mg/L, mean 29.3 mg/L), followed by K+ (0.4 to 51.9 mg/L, mean 22.6 mg/L), Na+ (0.35 to 26 mg/L, mean 6.47 mg/L).
In terms of anions, HCO3 was the highest abundant major anion in groundwater, and in Cambrian groundwater the concentration was 94.3 to 438 mg/L (mean, 199 mg/L), followed by Triassic groundwater (24.9 to 392 mg/L, mean 201 mg/L) and Devonian groundwater (10.7 to 331 mg/L, mean 145 mg/L). Concentrations of other anions (including, Cl, SO42− and NO3) in groundwater were significantly lower. The variation of surface water was consistent with that of groundwater, and the anion concentrations were HCO3 > SO42− > Cl > NO3. Groundwater samples were predominantly of the Ca–HCO3 and Ca–Mg–HCO3 types (Figure 3), and there was no obvious difference between different strata. However, surface water was predominantly of the Na–Ca–HCO3 (Figure 3).
Ionic salinity or total ionic salinity (TIS) represents the sum of major anion and cation concentrations [50]. The correlation diagram of SO42− vs. HCO3 + Cl shows the iso-TIS line (Figure 4). Figure 4 shows that the iso-TIS lines of groundwater in the study area are between 1 and 8 meq/L. There is no significant difference in the iso-TIS values between different strata, and the overall sulfate concentration is extremely low.
The heavy metals in water pollution mainly refer to Hg, Cd, Pb, Cr and metal-like As with significant biological toxicity, and also include toxic heavy metals such as Zn, Co, Ni, V, Cu, Sn and other pollutants [51]. In this study, four heavy metals (including, Mn, Cu, Zn and Pb) in groundwater samples were detected and analyzed. They are used to evaluate the groundwater pollution in the study area.
The concentrations of heavy metals in groundwater were relatively low in this study (Figure 5), but the concentrations of Mn were significantly higher than other heavy metals in the groundwater. The mean Mn average concentrations of Mn in Triassic, Devonian and Cambrian groundwater was 10.2, 10.8 and 16.1 μg/L, respectively. There were unusually high Mn concentrations in Devonian and Cambrian groundwater, which were 1740 and 312 μg/L, respectively. The contents of Cu, Zn and Pb in groundwater were relatively low, most of them were less than 1 μg/L, and their maximum concentrations were 4.17, 63.6 and 1.48 μg/L, respectively. These were lower than other karst groundwater, such as the Sidi River’s karst basin [52] and Maros karst groundwater [53], which are similar to the groundwater of agricultural land in Guiyang karst area [54].
The regularity of heavy metals in surface water is consistent with that in groundwater, and the highest heavy metal was Mn, which ranged from 15.3 to 3220 μg/L (mean, 781 μg/L). This is obviously higher than the Lijiang river (23.9 μg/L), Pearl River (1.06 μg/L), Trinity river (4.2 ug/L) and the world average (34 μg/L) [52]. The concentrations of other heavy metals (including Cu, Zn and Pb) were low, and their average concentrations were 0.75, 6.38 and 0.42 μg/L, respectively.

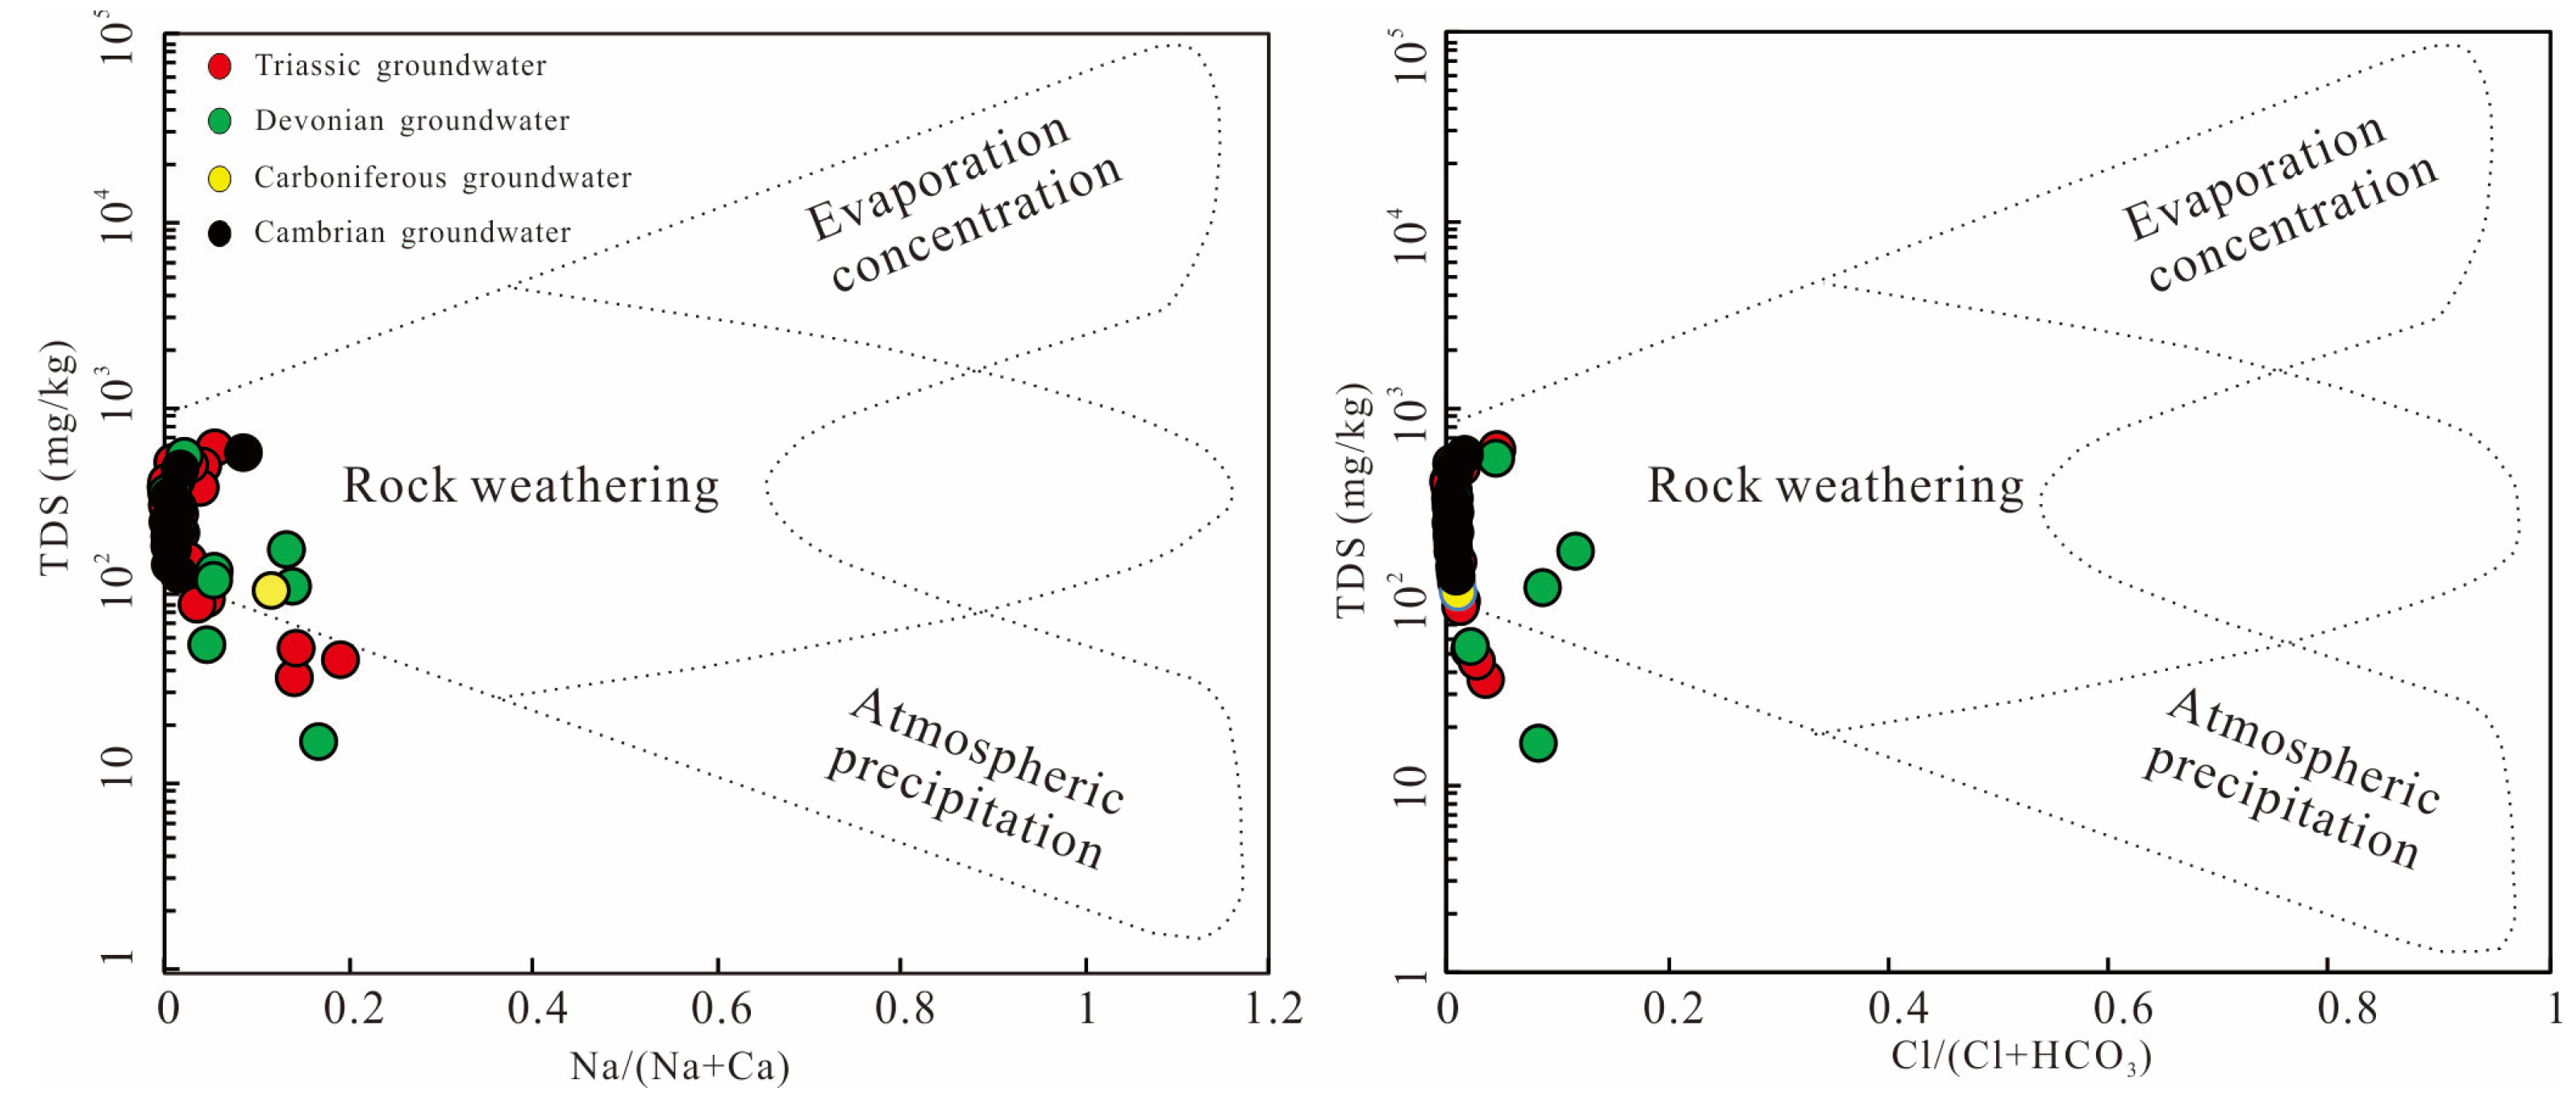
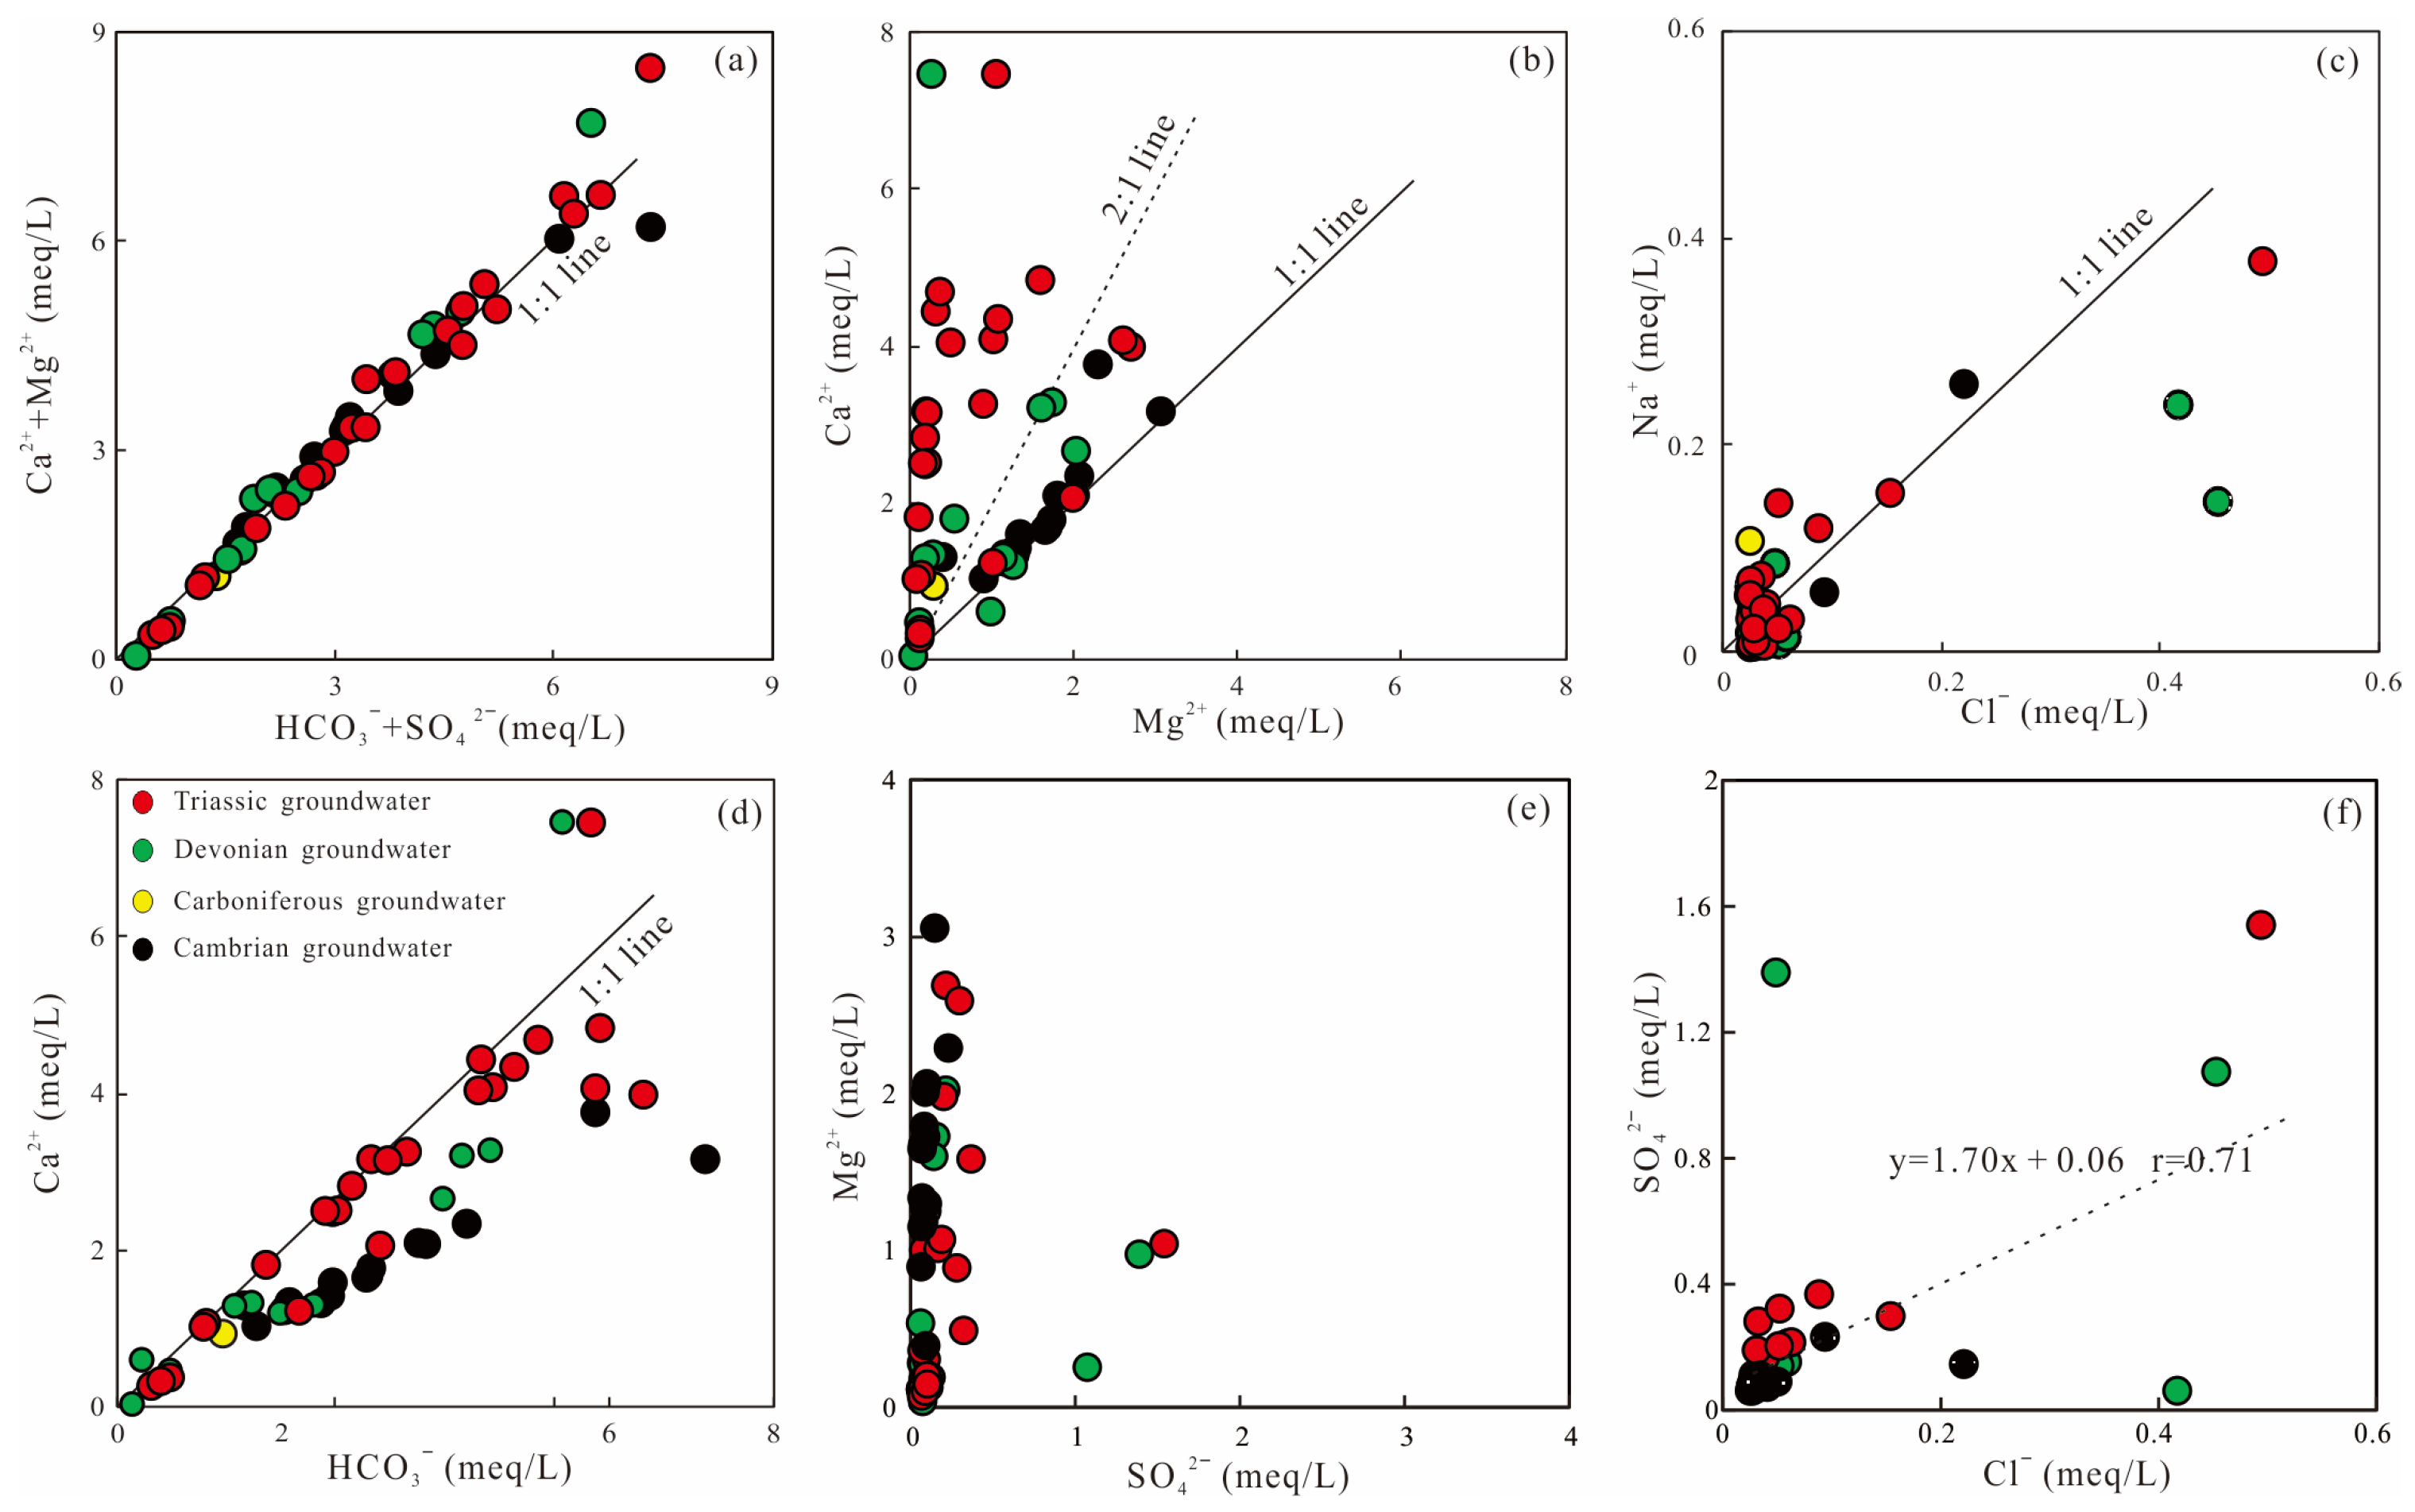
3.2. Hydrochemical Process

The evolution of groundwater reflects the material exchange relationship between groundwater, aquifer medium and different water. The chemical composition of groundwater was the result of the long-term evolution of groundwater, and analysis of groundwater evolution law was helpful to identify the source of the chemical composition of groundwater.
A Gibbs diagram was often used to analyze the hydrochemical process of groundwater [30]. According to the ratio diagram of TDS to Na+/(K+ + Na+) and the ratio diagram of TDS to Cl/(HCO3 + Cl), the process of controlling groundwater chemicals was divided into three types of influence: evaporation concentration, rock weathering and atmospheric precipitation. Figure 6 shows that the groundwater samples fall on the mid-left side of these diagrams (i.e., rock weathering field), where the Na+/(K+ + Na+) and Cl/(HCO3 + Cl) ratios are less than 0.3, indicating that the process of rock weathering is the major factor controlling the composition of hydrochemistry. In addition, human activities also have a certain impact on it.
However, the Gibbs diagram cannot determine which type of water–rock interaction affects the groundwater, so it is necessary to further analyze the source of the chemical components in groundwater. The milligram equivalent ratio of Mg2+/Na+, Ca2+/Na+ to HCO3/Na+ can be used to judge the interaction between groundwater and different rocks [55]. Figure 7 shows that the groundwater sample points in the study area were mainly distributed in the carbonate dissolution area, indicating that the groundwater was affected by the dissolution of carbonate rocks. The effect of silicate weathering dissolution is weak.
In the process of the water–rock interaction, the reaction rate of the minerals determines the amount of ions in the solution [56]. The mineral saturation index (SI) can be used to characterize the state of minerals in groundwater. The SI of each mineral phase in groundwater was calculated by the software Phreeqc [57,58], and the trend of mineral precipitation and the dissolution of different minerals in the evolution process of groundwater was analyzed. Generally, an SI value of less than −0.5 indicates that the mineral is in dissolution state, while an SI value greater than 0.5 represents that the mineral is in the precipitation state, while an SI value between −0.5 and 0.5 suggests that the mineral is in equilibrium state [59].
The statistical results are shown in Table 2, which shows that the SI of anhydrite, gypsum, halite and sylvite minerals in groundwater in the study area was less than −0.5 and they are in the dissolution state. Calcite is mostly in the equilibrium state, accounting for 50%, 33.3% and 73.3% of the Triassic, Devonian and Cambrian groundwater, respectively. Dolomite is mostly in the dissolution state; the proportions in the Triassic, Devonian and Cambrian groundwater are 54.2%, 50% and 50%, respectively. It is shown that the dissolution of dolomite was stronger than that of calcite, especially in Cambrian groundwater.
Under different causes or conditions, the proportion coefficient of some ions will also have obvious differences. Therefore, the evolution of groundwater can be judged by the ratio between different ions [20,60].
The ratio of (Ca2+ + Mg2+) (meq/L)/(HCO3 + SO42−) (meq/L) can be used to reflect the dissolution of carbonate and sulfate minerals in groundwater systems. If the dissolution was mainly calcite and dolomite, the ratio should be close to 1 [61,62]. Figure 8a shows that the groundwater sample points in the study area were distributed on or near the 1:1 line, indicating that carbonate rock dissolution is the main reaction of the groundwater system.
The ratio of Ca2+ (meq/L) to Mg2+ (meq/L) can be used to reflect the dissolution of calcite and dolomite. If the ratio is close to 1, it indicates that dolomite is the main dissolved carbonate mineral. If the ratio increase, it may also contribute to calcite. If the ratio is greater than 2, it indicates that silicate minerals may also be the main process [63]. Figure 8b shows that the Cambrian and Devonian groundwater sample points were distributed between the 1:1 and 2:1 lines, explaining that the dissolution of calcite and dolomite is dominant, while the Triassic groundwater sample points were mostly distributed above the 2:1 line, showing that the dissolution of silicate minerals is also the main reaction of Triassic groundwater. Consistent with the stratigraphic lithology, the Cambrian and Devonian are mainly carbonate rocks, while the Triassic is mainly carbonate rocks and sandstones.
The ratio of Na+ (meq/L) to Cl (meq/L) is usually used to characterize the concentration of sodium ions [60,64]. Figure 8c shows that the groundwater sample points were distributed near the 1:1 line, but their concentration was very low, indicating a weak the dissolution of salt rock. At the same time, Na+ to Cl does not increase in proportion, showing that the source of Na was not unique and may also come from silicate. The content of Na in groundwater in the study area is very low, and a small amount of sandstone in the stratum also supports this view.
The scatter diagram of Ca2+ (meq/L) versus HCO3 (meq/L) illustrated in Figure 8d shows that all samples fall below the 1:1 line, suggesting that Ca2+ and HCO3 in groundwater were derived from carbonate dissolution. The location of individual samples above the 1:1 line represent a small amount of other sources of Ca2+, such as the dissolution of gypsum [65,66].
The natural source of Mg2+ in groundwater is usually related to the dissolution of SO42− [67]. Figure 8e shows that the groundwater in the study area has obvious characteristics of low SO42− (meq/L) and high Mg2+ (meq/L), especially in the Cambrian strata. Combined with stratigraphic considerations, the excess Mg2+ is mainly derived from dolomite (CaMg(CO3) 2). A small amount of sulfate may be produced by the oxidation of sulfides in carbonates [68]. Figure 8f shows that SO42− (meq/L) and Cl (meq/L) have a good correlation (r = 0.71, p < 0.01), indicating that SO42− and Cl have geological origin, such as the dissolution of sulfate [68,69]. The high content of SO42− may come from the surrounding coal-bearing strata.
During groundwater runoff, cations in the groundwater will exchange with cations adsorbed on the surface of aqueous medium under certain conditions, resulting in changes in the chemical composition of groundwater. (Na+ − Cl) and (Ca2+ + Mg2+ − HCO3 − SO42−) respectively represent the remaining Na+ after the dissolution of rock salt and (Ca2+ + Mg2+) after the removal of sulfate, carbonate rocks and silicates. If the linear fitting slope is −1, it suggests that a cation exchange affects the chemical composition of groundwater [70]. Figure 9a shows that (Na+ − Cl) has a good linear relationship with (Ca2+ + Mg2+ − HCO3 − SO42−) (r = 0.711, p < 0.01), but the slope is −4.16, suggesting that there is a cation exchange in groundwater in the study area, but its influence on the chemical composition of groundwater is weak. The Schoeller index (CAI-I and CAI-II) is an important index of ion exchange in aquifers [71]. The CAI-I and CAI-II have the following equations:
CAI-I = (Cl − Na+ + K+)/Cl,
CAI-II = (Cl − Na+ + K+)/(Cl + HCO3 +SO42− + NO3),
Both CAI-I and CAI-II are negative values, indicating that a positive ion exchange occurs in groundwater, while positive values indicate that a reverse ion exchange occurs in groundwater [72]. As shown in Figure 9b, the positive and reverse ion exchange in groundwater in the study area occurred simultaneously.

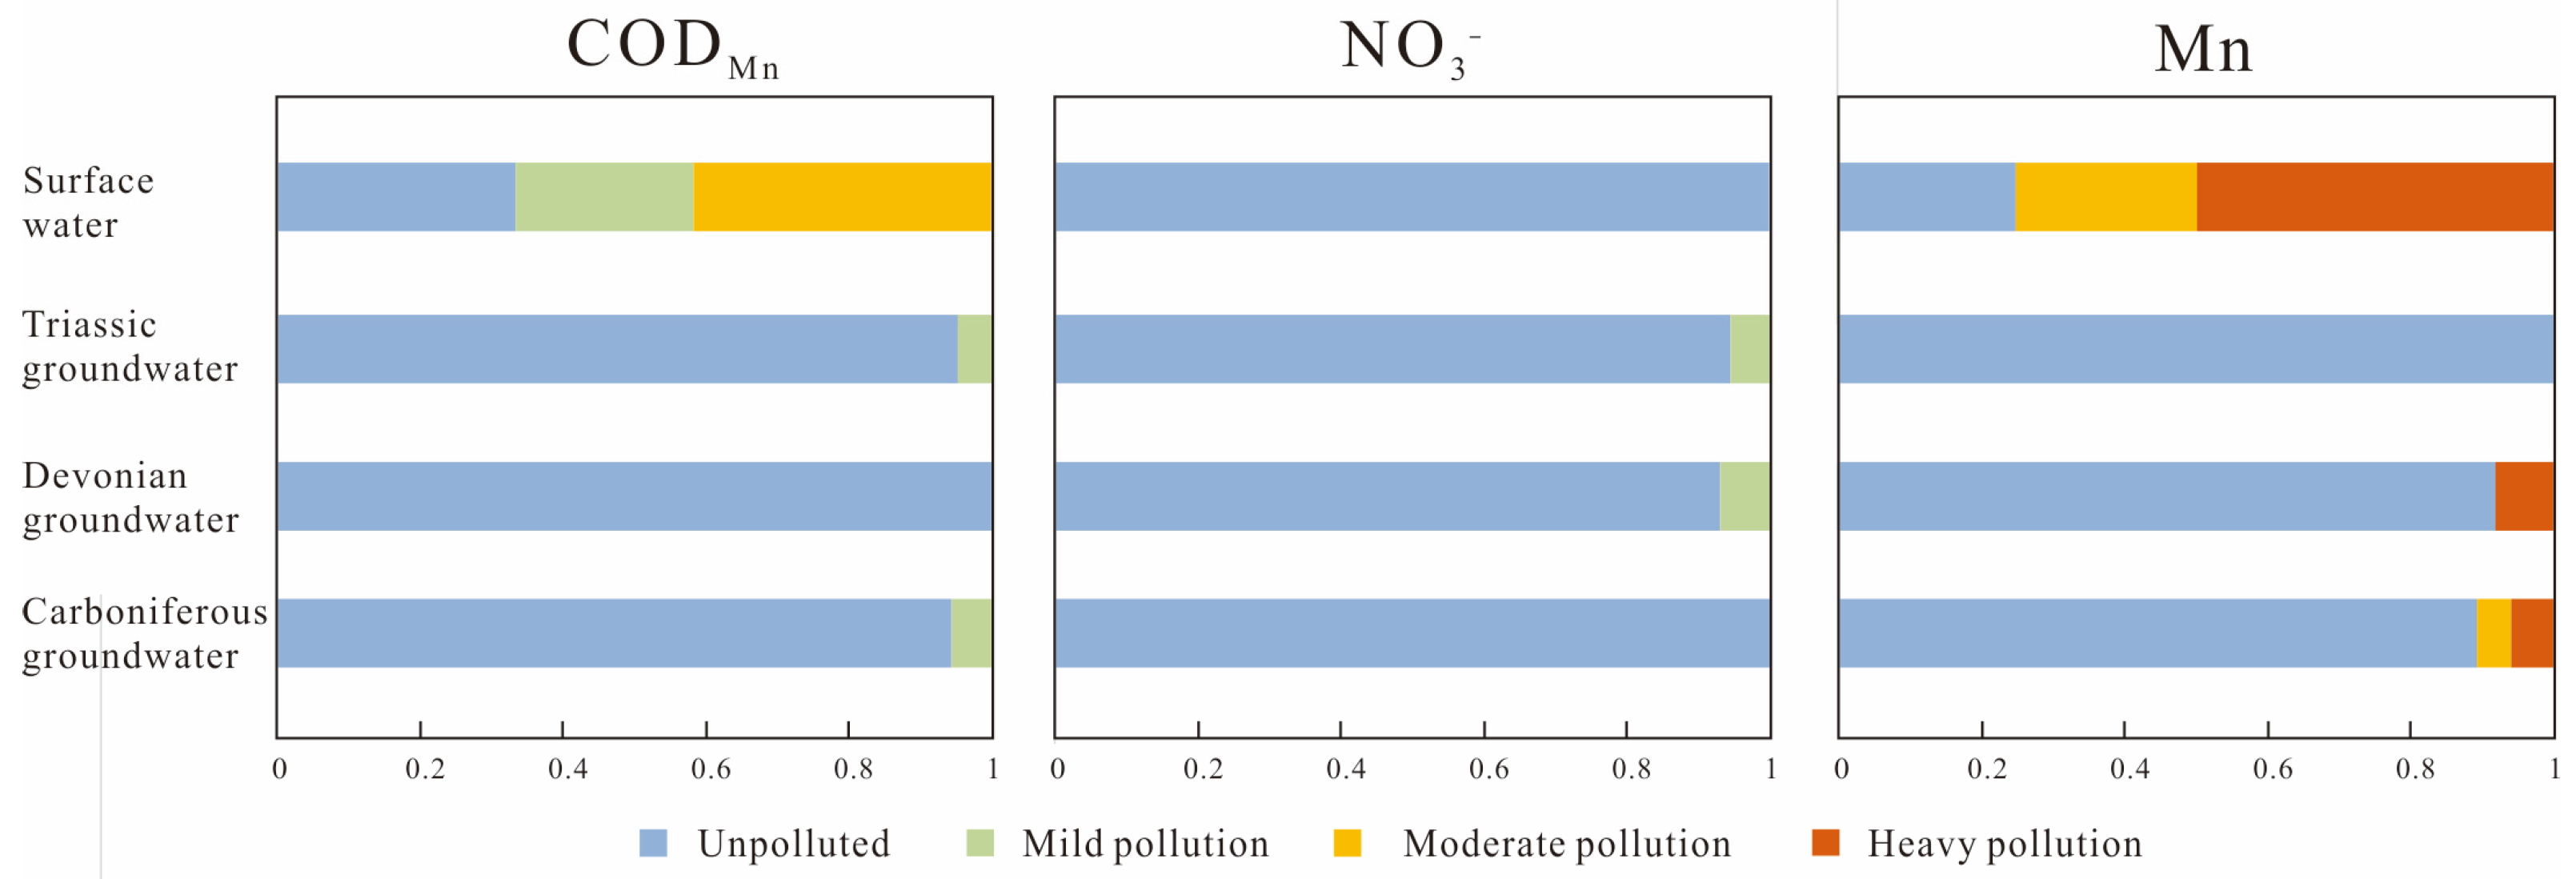
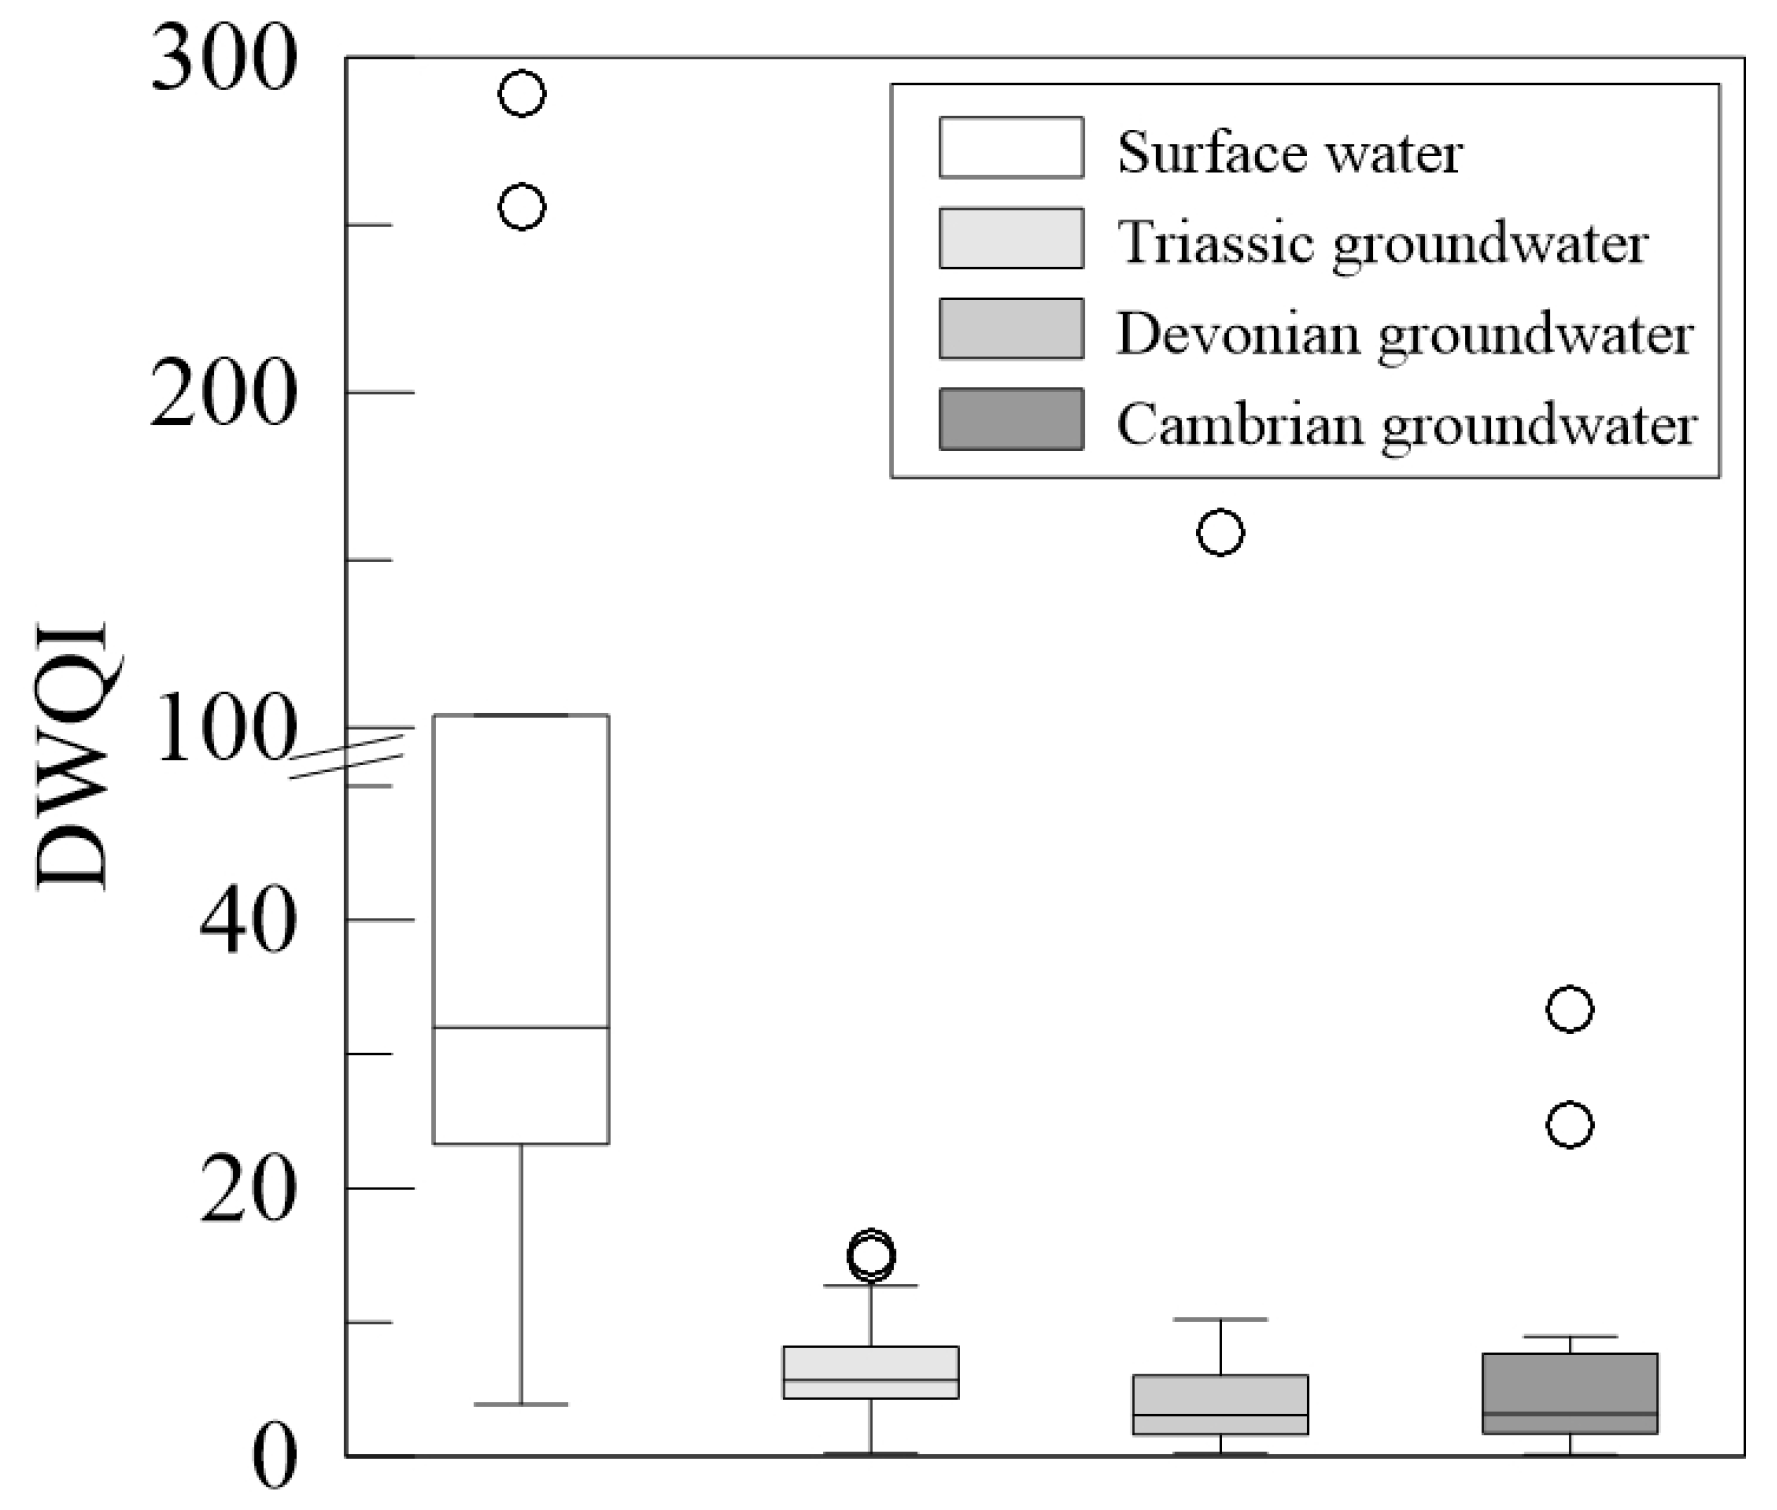
3.3. Water Quality Assessment

At present, the deterioration of water quality has become a serious problem, and water quality assessment is the premise of the implementation of a water resources protection policy. The Nemerow pollution index is widely used to assess integrated water quality [17,73], and the drinking water quality index (DWQI) reveals the cumulative effects of different physical and chemical parameters and effectively shows the groundwater quality [74]. According to the Class III standards of the “Environmental Quality Standard for Groundwater” (Ministry of Health of PR China, 2006) [75] and the WHO drinking water guideline, the environmental quality of groundwater and surface water samples in the study area was evaluated by the single factor contaminant index (Pi) method, Nemerow’s synthetical pollution Index (PN) method and DWQI. The calculation formulae are shown in the following equations:
Pi = Ci/Si,
Pimax = (Ci/Si)max,
Piave = (Ci/Si)ave,
P N = P imax 2 + P iave 2   /   2 ,
where Ci is the measured concentration of an element i, Si is the evaluation standard value of element I, Pimax is the largest single pollution index and Piave is the average single pollution index. The grading standards for the Pi and PN evaluations are shown in Table 3.
D W Q I = i = 1 n q i W i
q i = V i V 0 S i V 0 × 100
W I = K / S i
where qi is the sub-quality index of each parameter, Wi is the weight unit of each parameter, Vi is a test value of each parameter, S is the allowable limit value of each parameter standard, V0 is an ideal value of each parameter (except pH = 7.0, the other parameters were 0) and K is the proportionality constant. The grading standards for the DWQI evaluation are shown in Table 3. In this study, 14 variables (including pH, CODMn, K, Na, Ca, Mg, Cl, SO4, HCO3, NO3, Mn, Cu, Zn and Pb) were selected and calculated by the arithmetic weight method (Table 4).
In karst aquifers, heavy metals such as Cr, Pb, Ni and Cd tend to precipitate in the form of hydroxides and carbonates. Under flow conditions, metals adsorbed on the surface of particles can easily migrate into groundwater [76]. Therefore, karst groundwater is more susceptible to potential toxic metal pollution [77]. According to the single factor pollution index (Pi) method, the exceeding standard rate of groundwater in the study area is 11.5%, and the exceeding standard indexes are CODMn, NO3 and Mn. The pollution degree of CODMn and NO3 is low, which belongs to mild pollution, while the pollution of Mn is serious, which belongs to heavy pollution (Figure 10). In the study area, 11.5% of groundwater samples exceeded the standard, and the higher NO3 concentrations were found near the farmland, indicating that the high concentration of NO3 maybe caused by agricultural activities. The highest Mn content is 1740 (Devonian), and the Pi value is 17.4, similar to the karst groundwater in the Yucatan Peninsula, Mexico (10–2600 nmol/L) [78]. Except for specific areas with high levels of Mn, the health risk level is low, which is similar to the content of trace elements in groundwater in Beijing [43]. The stratum in the study area contains a certain amount of manganese ore, which may be due to the dissolution and release of manganese minerals in the stratum, resulting in an increase in the content of Mn in groundwater. Previous research [79] had shown that low CODMn is conducive to the increase of Mn content in groundwater. The average CODMn concentration in groundwater is 0.5 mg/L, which is conducive to the increase of Mn content.
Surface water is more seriously polluted than groundwater; 83.3% of samples exceeded the standard. The surface water mainly contained levels of CODMn and Mn exceeding the standard, and the maximum Pi values were 2.54 and 32.2, which are moderate pollution and heavy pollution. This is obviously higher than the Lijiang river (23.9 μg/L), Pearl river (1.06 μg/L), Trinity river (4.2 ug/L) and the world average (34 μg/L) [52]. Contaminated surface water may infiltrate into the groundwater through leaching, affecting groundwater quality [80,81].
According to the calculation results of Nemerow’s synthetical pollution index, surface water and groundwater in the study area have different degrees of pollution; the PN values of Triassic, Devonian and Cambrian groundwater were 1.3, 12.3 and 2.2, respectively. Triassic groundwater belongs to mild pollution, and only one sample has a single factor contaminant index (Pi) of CODMn and NO3 above 1, and the values are 1.03 and 1.83, respectively. The groundwater in the Devonian system is heavy pollution; the highest CODMn and NO3 concentrations are 1.13 and 17.4 times higher than the standard limits. The Cambrian groundwater has moderate pollution; only two samples exceeded the standard. Overall, the levels of 5.8% Mn, 3.8% CODMn and 3.8% NO3 of groundwater samples in the study aera exceeded the standards. Surface water is more seriously polluted than groundwater; the Nemerow synthetical pollution index value is 22.8 (categorized as heavy pollution) was much higher than groundwater.
Compared with the PN index, DWQI considers the weight and rate of different parameters and reveals the cumulative effects of different physical and chemical parameters [82]. The DWQI value of groundwater samples in the study area is shown in Figure 11. The DWQI values in Triassic groundwater varied from 0.2 to 15.1, with an average of 6.2. which is excellent water. One sample (DWQI = 157.9) of the Devonian groundwater is unsuitable water, and the DWQI values of the remaining samples were less than 25, which are excellent water. The maximum DWQI value of the Cambrian groundwater sample was 33.3, of which 86.7% of the samples are excellent water and 13.3% are good water. The mean DWQI of surface water was 73.7 (from 3.88 to 289.4). According to the DWQI results, 25% of surface water was unsuitable water and 8.3% was poor water. Combined with the test results, it was found that all unsuitable water samples were caused by high concentrations of Mn. Compared with surface water, groundwater is more suitable for drinking water, and only 1.9% of the samples were unsuitable for drinking water.
Through the comprehensive water quality evaluation of the Pi index, PN index and DWQI in the study area, it is found that the overall water quality of groundwater is good, the surface water pollution is serious and the main pollutant was Mn. Mn in groundwater is likely to come from surface water infiltration and dissolution of manganese oxides in the formation. The fractures in the study area are developed, and the contaminated surface water may infiltrate into the underground through leaching after rainfall collection, thus affecting the groundwater quality. In the subsequent development and utilization of regional groundwater resources, attention should be paid to surface water pollution to prevent further infiltration of surface water to pollute groundwater. In the future, the sources of pollutants in groundwater should be further identified by means of drilling, rock geochemical analysis, sequential extraction and isotope tracing, to provide more favorable evidence for the development and utilization of groundwater.

4. Conclusions

Taking the Mengzi area of Yunnan Province as the research object, the hydrogeochemical characteristics and environmental quality assessment were analyzed and evaluated by a statistical analysis, hydrogeochemical analysis, ion ratio and Nemerow’s index method (PN). The main conclusions are as follows:
  • The studied groundwater was neutral-to-weakly alkaline. The groundwater samples were predominantly of the Ca–HCO3 and Ca–Mg–HCO3 types. The main hydrochemical composition of groundwater in the study area is controlled by the dissolution of carbonate rocks, and the influence of silicate weathering and ion exchange is weak.
  • Compared with groundwater, the surface water pollution in the study area is serious, and the main pollution factors are CODMn, NO3 and Mn. The exceeding standard rates of groundwater and surface water were 11.5% and 83.3%, respectively. The highest concentrations of Mn in groundwater and surface water are 1740 μg/L (in Devonian groundwater) and 3320 μg/L. According to the PN index, the surface water and Devonian groundwater are heavy polluted. The DWQI results show that 1.9% of groundwater and 25% of surface water samples are unsuitable water.
  • In the process of groundwater development and utilization in the study area, attention should be paid to surface water pollution to prevent further infiltration of surface water into groundwater. At the same time, the sources of heavy metals in groundwater were further identified by means of rock geochemistry and isotope tracing.

Author Contributions

Conceptualization, writing–original draft preparation, investigation, X.D.; methodology, software, formal analysis, validation, Z.S.; supervision, project administration, funding acquisition, writing–review and editing, S.L.; writing–review and editing, supervision, Z.J.; investigation, data curation, H.L. All authors have read and agreed to the published version of the manuscript.

Funding

The study was financially supported by the China Geological Survey (grant nos. 12120114069101-03).

Data Availability Statement

Not applicable.

Acknowledgments

The authors thank the School of Earth Sciences, Guilin University of Technology for their support. Thanks to the Karst Geological Resources and Environmental Supervision and Testing Center of the Ministry of Natural Resources for the sample analysis. The authors thank the anonymous reviewers for constructive comments that greatly improved this manuscript.

Conflicts of Interest

The authors declare no conflict of interest.

References

  1. Bondu, R.; Casiot, C.; Pistre, S.; Batiot-Guilhe, C. Impact of past mining activities on water quality in a karst area in the Cévennes region, Southern France. Sci. Total Environ. 2023, 873, 162274. [Google Scholar] [CrossRef] [PubMed]
  2. Sharma, G.K.; Jena, R.K.; Ray, P.; Yadav, K.K.; Moharana, P.C.; Cabral-Pinto, M.M.S.; Bordoloi, G. Evaluating the geochemistry of groundwater contamination with iron and manganese and probabilistic human health risk assessment in endemic areas of the world’s largest River Island, India. Environ. Toxicol. Pharm. 2021, 87, 103690. [Google Scholar] [CrossRef] [PubMed]
  3. Guo, H.; Zhao, W.; Li, H.; Xiu, W.; Shen, J. High Radionuclides in Groundwater of an Inland Basin from Northwest China: Origin and Fate. ACS Earth Space Chem. 2018, 2, 1137–1144. [Google Scholar] [CrossRef]
  4. Zhao, D.; Hubacek, K.; Feng, K.; Sun, L.; Liu, J. Explaining virtual water trade: A spatial-temporal analysis of the comparative advantage of land, labor and water in China. Water Res. 2019, 153, 304–314. [Google Scholar] [CrossRef]
  5. Gunn, J. Karst groundwater in UNESCO protected areas: A global overview. Hydrogeol. J. 2020, 29, 297–314. [Google Scholar] [CrossRef]
  6. Stevanović, Z. Karst waters in potable water supply: A global scale overview. Environ. Earth Sci. 2019, 78, 662. [Google Scholar] [CrossRef]
  7. Zheng, X.; Zang, H.; Zhang, Y.; Chen, J.; Zhang, F.; Shen, Y. A Study of Hydrogeochemical Processes on Karst Groundwater Using a Mass Balance Model in the Liulin Spring Area, North China. Water 2018, 10, 903. [Google Scholar] [CrossRef] [Green Version]
  8. Nguyet, V.T.M.; Goldscheider, N. A simplified methodology for mapping groundwater vulnerability and contamination risk, and its first application in a tropical karst area, Vietnam. Hydrogeol. J. 2006, 14, 1666–1675. [Google Scholar] [CrossRef] [Green Version]
  9. Song, K.; Yang, G.; Wang, F.; Liu, J.; Liu, D. Application of Geophysical and Hydrogeochemical Methods to the Protection of Drinking Groundwater in Karst Regions. Int. J. Environ. Res. Public Health 2020, 17, 3627. [Google Scholar] [CrossRef]
  10. Li, P.; Wu, J. Drinking Water Quality and Public Health. Expo. Health 2019, 11, 73–79. [Google Scholar] [CrossRef]
  11. Su, H.; Kang, W.; Xu, Y.; Wang, J. Evaluation of groundwater quality and health risks from contamination in the north edge of the Loess Plateau, Yulin City, Northwest China. Environ. Earth Sci. 2017, 76, 467. [Google Scholar] [CrossRef]
  12. Stigter, T.Y.; Miller, J.; Chen, J.; Re, V. Groundwater and climate change: Threats and opportunities. Hydrogeol. J. 2023, 31, 7–10. [Google Scholar] [CrossRef]
  13. Panwar, S.; Chakrapani, G.J. Climate change and its influence on groundwater resources. Curr. Sci. 2013, 105, 37–46. [Google Scholar]
  14. Cil, A.; Muhammetoglu, A.; Ozyurt, N.N.; Yenilmez, F.; Keyikoglu, R.; Amil, A.; Muhammetoglu, H. Assessment of groundwater contamination risk with scenario analysis of hazard quantification for a karst aquifer in Antalya, Turkey. Environ. Earth Sci. 2020, 79, 191. [Google Scholar] [CrossRef]
  15. Jiang, Y.; Cao, M.; Yuan, D.; Zhang, Y.; He, Q. Hydrogeological characterization and environmental effects of the deteriorating urban karst groundwater in a karst trough valley: Nanshan, SW China. Hydrogeol. J. 2018, 26, 1487–1497. [Google Scholar] [CrossRef]
  16. Marin, A.I.; Martin Rodriguez, J.F.; Barbera, J.A.; Fernandez-Ortega, J.; Mudarra, M.; Sanchez, D.; Andreo, B. Groundwater vulnerability to pollution in karst aquifers, considering key challenges and considerations: Application to the Ubrique springs in southern Spain. Hydrogeol. J. 2021, 29, 379–396. [Google Scholar] [CrossRef]
  17. Kong, M.; Zhong, H.; Wu, Y.; Liu, G.; Xu, Y.; Wang, G. Developing and validating intrinsic groundwater vulnerability maps in regions with limited data: A case study from Datong City in China using DRASTIC and Nemerow pollution indices. Environ. Earth Sci. 2019, 78, 262. [Google Scholar] [CrossRef]
  18. Mills, C.T.; Morrison, J.M.; Goldhaber, M.B.; Ellefsen, K.J. Chromium(VI) generation in vadose zone soils and alluvial sediments of the southwestern Sacramento Valley, California: A potential source of geogenic Cr(VI) to groundwater. Appl. Geochem. 2011, 26, 1488–1501. [Google Scholar] [CrossRef]
  19. Lelli, M.; Grassi, S.; Amadori, M.; Franceschini, F. Natural Cr(VI) contamination of groundwater in the Cecina coastal area and its inner sectors (Tuscany, Italy). Environ. Earth Sci. 2014, 71, 3907–3919. [Google Scholar] [CrossRef]
  20. Wang, Z.; Guo, H.; Xiu, W.; Wang, J.; Shen, M. High arsenic groundwater in the Guide basin, northwestern China: Distribution and genesis mechanisms. Sci. Total Environ. 2018, 640–641, 194–206. [Google Scholar] [CrossRef]
  21. Fendorf, S.; Michael, H.A.; van Geen, A. Spatial and Temporal Variations of Groundwater Arsenic in South and Southeast Asia. Science 2010, 328, 1123–1127. [Google Scholar] [CrossRef] [PubMed] [Green Version]
  22. Erban, L.E.; Gorelick, S.M.; Fendorf, S. Arsenic in the Multi-aquifer System of the Mekong Delta, Vietnam: Analysis of Large-Scale Spatial Trends and Controlling Factors. Environ. Sci. Technol. 2014, 48, 6081–6088. [Google Scholar] [CrossRef] [PubMed]
  23. Karunanidhi, D.; Subramani, T.; Roy, P.D.; Li, H. Impact of groundwater contamination on human health. Environ. Geochem. Health 2021, 43, 643–647. [Google Scholar] [CrossRef]
  24. Khan, A.F.; Srinivasamoorthy, K.; Prakash, R.; Rabina, C. Hydrochemical and statistical techniques to decode groundwater geochemical interactions and saline water intrusion along the coastal regions of Tamil Nadu and Puducherry, India. Environ. Geochem. Health 2021, 43, 1051–1067. [Google Scholar] [CrossRef] [PubMed]
  25. Marghade, D.; Malpe, D.B.; Rao, N.S. Applications of geochemical and multivariate statistical approaches for the evaluation of groundwater quality and human health risks in a semi-arid region of eastern Maharashtra, India. Environ. Geochem. Health 2021, 43, 683–703. [Google Scholar] [CrossRef] [PubMed]
  26. Fuoco, I.; Marini, L.; De Rosa, R.; Figoli, A.; Gabriele, B.; Apollaro, C. Use of reaction path modelling to investigate the evolution of water chemistry in shallow to deep crystalline aquifers with a special focus on fluoride. Sci. Total Environ. 2022, 830, 154566. [Google Scholar] [CrossRef] [PubMed]
  27. Zhang, H.; Xu, L.; Huang, T.; Yan, M.; Liu, K.; Miao, Y.; He, H.; Li, S.; Sekar, R. Combined effects of seasonality and stagnation on tap water quality: Changes in chemical parameters, metabolic activity and co-existence in bacterial community. J. Hazard. Mater. 2021, 403, 124018. [Google Scholar] [CrossRef]
  28. Peters, M.; Guo, Q.; Strauss, H.; Wei, R.; Li, S.; Yue, F. Seasonal effects on contamination characteristics of tap water from rural Beijing: A multiple isotope approach. J. Hydrol. 2020, 588, 125037. [Google Scholar] [CrossRef]
  29. Zhou, Y.; Yang, F.; Wu, X.; Jia, C.; Liu, S.; Gao, Y.; IOP. Bibliometric analysis of research progress on karst groundwater pollution. In Proceedings of the 2nd Global Conference on Ecological Environment and Civil Engineering (GCEECE), Electrical Network, Guangzhou, China, 7–9 August 2020. [Google Scholar]
  30. Zhang, Z.; Xu, Y.; Zhang, Y.; Guo, L.; Wang, Z.; Zheng, Q. Impact of groundwater overexploitation on karst aquifer and delineation of the critical zones: Case study of Jinci spring in Shanxi, China. Carbonates Evaporites 2022, 37, 68. [Google Scholar] [CrossRef]
  31. Keqiang, H.; Lu, G.; Yuanyuan, G.; Huilai, L.; Yongping, L. Research on the effects of coal mining on the karst hydrogeological environment in Jiaozuo mining area, China. Environ. Earth Sci. 2019, 78, 434. [Google Scholar] [CrossRef]
  32. An, X.; Li, W.; Lan, J.; Adnan, M. Preliminary Study on the Distribution, Source, and Ecological Risk of Typical Microplastics in Karst Groundwater in Guizhou Province, China. Int. J. Environ. Res. Public Health 2022, 19, 14751. [Google Scholar] [CrossRef] [PubMed]
  33. Panno, S.V.; Kelly, W.R.; Scott, J.; Zheng, W.; McNeish, R.E.; Holm, N.; Hoellein, T.J.; Baranski, E.L. Microplastic Contamination in Karst Groundwater Systems. Groundwater 2019, 57, 189–196. [Google Scholar] [CrossRef] [PubMed]
  34. Chen, J.; Huang, Q.; Lin, Y.; Fang, Y.; Qian, H.; Liu, R.; Ma, H. Hydrogeochemical Characteristics and Quality Assessment of Groundwater in an Irrigated Region, Northwest China. Water 2019, 11, 96. [Google Scholar] [CrossRef] [Green Version]
  35. Maskooni, E.; Naseri-Rad, M.; Berndtsson, R.; Nakagawa, K. Use of Heavy Metal Content and Modified Water Quality Index to Assess Groundwater Quality in a Semiarid Area. Water 2020, 12, 1115. [Google Scholar] [CrossRef] [Green Version]
  36. Ndoye, S.; Fontaine, C.; Gaye, C.; Razack, M. Groundwater Quality and Suitability for Different Uses in the Saloum Area of Senegal. Water 2018, 10, 1837. [Google Scholar] [CrossRef] [Green Version]
  37. Fu, C.; Li, X.; Ma, J.; Liu, L.; Gao, M.; Bai, Z. A hydrochemistry and multi-isotopic study of groundwater origin and hydrochemical evolution in the middle reaches of the Kuye River basin. Appl. Geochem. 2018, 98, 82–93. [Google Scholar] [CrossRef]
  38. Liu, P.; Hoth, N.; Drebenstedt, C.; Sun, Y.; Xu, Z. Hydro-geochemical paths of multi-layer groundwater system in coal mining regions—Using multivariate statistics and geochemical modeling approaches. Sci. Total Environ. 2017, 601–602, 1–14. [Google Scholar] [CrossRef]
  39. Chetelat, B.; Liu, C.Q.; Zhao, Z.Q.; Wang, Q.L.; Li, S.L.; Li, J.; Wang, B.L. Geochemistry of the dissolved load of the Changjiang Basin rivers: Anthropogenic impacts and chemical weathering. Geochim. Cosmochim. Acta 2008, 72, 4254–4277. [Google Scholar] [CrossRef]
  40. Zhu, Z.; Wang, J.; Hu, M.; Jia, L. Geographical detection of groundwater pollution vulnerability and hazard in karst areas of Guangxi Province, China. Environ. Pollut. 2019, 245, 627–633. [Google Scholar] [CrossRef]
  41. Hao, J.; Zhang, Y.; Jia, Y.; Wang, H.; Niu, C.; Gan, Y.; Gong, Y. Assessing groundwater vulnerability and its inconsistency with groundwater quality, based on a modified DRASTIC model: A case study in Chaoyang District of Beijing City. Arab. J. Geosci. 2017, 10, 144. [Google Scholar] [CrossRef]
  42. Zhang, Y.; Hou, K.; Qian, H. Water quality assessment using comprehensive water quality index and modified Nemerow index method: A case study of Jinghui Canal, North China. In Proceedings of the 4th International Conference on Energy Engineering and Environmental Protection (EEEP), Xiamen, China, 19–21 November 2019. [Google Scholar]
  43. Fang, H.; Lin, Z.; Fu, X. Spatial variation, water quality, and health risk assessment of trace elements in groundwater in Beijing and Shijiazhuang, North China Plain. Environ. Sci. Pollut. Res. 2021, 28, 57046–57059. [Google Scholar] [CrossRef] [PubMed]
  44. Shi, Z.; Liu, X.; Liu, Y.; Huang, Y.; Peng, H. Catastrophic groundwater pollution in a karst environment: A study of phosphorus sludge waste liquid pollution at the Penshuidong Cave in Yunnan, China. Environ. Earth Sci. 2009, 59, 757–763. [Google Scholar] [CrossRef]
  45. Luo, K.; Liu, Y.; Li, H. Fluoride content and distribution pattern in groundwater of eastern Yunnan and western Guizhou, China. Environ. Geochem. Health 2012, 34, 89–101. [Google Scholar] [CrossRef] [PubMed]
  46. Chen, L.; Jin, S.; Liu, Y.; Liu, F. Presence of Semi-Volatile Organic Contaminants in Shallow Groundwater of Selected Regions in China. Ground Water Monit. Remediat. 2014, 34, 33–43. [Google Scholar] [CrossRef]
  47. Zhang, X.-L.; Li, F.; Liu, H.-Z. Analysis on the Emergency-Type Groundwater Source Fields of Qujing City in Yunnan. In Proceedings of the 2nd International Conference on Energy, Environment and Sustainable Development (EESD 2012), Jilin, China, 12–14 October 2012; pp. 2653–2657. [Google Scholar]
  48. Gan, F.; Han, K.; Lan, F.; Chen, Y.; Zhang, W. Multi-geophysical approaches to detect karst channels underground—A case study in Mengzi of Yunnan Province, China. J. Appl. Geophys. 2017, 136, 91–98. [Google Scholar] [CrossRef]
  49. Guo, H.; Chen, Y.; Hu, H.; Zhao, K.; Li, H.; Yan, S.; Xiu, W.; Coyte, R.M.; Vengosh, A. High Hexavalent Chromium Concentration in Groundwater from a Deep Aquifer in the Baiyangdian Basin of the North China Plain. Environ. Sci. Technol. 2020, 54, 10068–10077. [Google Scholar] [CrossRef]
  50. Apollaro, C.; Tripodi, V.; Vespasiano, G.; De Rosa, R.; Dotsika, E.; Fuoco, I.; Critelli, S.; Muto, F. Chemical, isotopic and geotectonic relations of the warm and cold waters of the Galatro and Antonimina thermal areas, southern Calabria, Italy. Mar. Pet. Geol. 2019, 109, 469–483. [Google Scholar] [CrossRef]
  51. Liu, Y.; Ma, R. Human Health Risk Assessment of Heavy Metals in Groundwater in the Luan River Catchment within the North China Plain. Geofluids 2020, 2020, 8391793. [Google Scholar] [CrossRef]
  52. Liao, H.-W.; Jiang, Z.-C.; Zhou, H.; Qin, X.-Q.; Huang, Q.-B.; Zhong, L.; Pu, Z.-G. Dissolved Heavy Metal Pollution and Assessment of a Karst Basin around a Mine, Southwest China. Int. J. Environ. Res. Public Health 2022, 19, 14293. [Google Scholar] [CrossRef]
  53. Mallongi, A.; Rauf, A.U.; Daud, A.; Hatta, M.; Al-Madhoun, W.; Amiruddin, R.; Stang, S.; Wahyu, A.; Astuti, R.D.P. Health risk assessment of potentially toxic elements in Maros karst groundwater: A Monte Carlo simulation approach. Geomat. Nat. Hazards Risk 2022, 13, 338–363. [Google Scholar] [CrossRef]
  54. Liu, F.; Liu, C.-Q.; Zhao, Y.; Li, Z. Changes of hydrochemical composition and heavy metals concentration in shallow groundwater from karst hilly areas in Guiyang region, China. J. Cent. South Univ. Technol. 2010, 17, 1216–1222. [Google Scholar] [CrossRef]
  55. Xiao, J.; Jin, Z.; Zhang, F.; Wang, J. Major ion geochemistry of shallow groundwater in the Qinghai Lake catchment, NE Qinghai-Tibet Plateau. Environ. Earth Sci. 2012, 67, 1331–1344. [Google Scholar] [CrossRef]
  56. Apollaro, C.; Marini, L.; De Rosa, R. Use of reaction path modeling to predict the chemistry of stream water and groundwater: A case study from the Fiume Grande valley (Calabria, Italy). Environ. Geol. 2006, 51, 1133–1145. [Google Scholar] [CrossRef]
  57. Gao, M.; Li, X.; Qian, J.; Wang, Z.; Hou, X.; Fu, C.; Ma, J.; Zhang, C.; Li, J. Hydrogeochemical Characteristics and Evolution of Karst Groundwater in Heilongdong Spring Basin, Northern China. Water 2023, 15, 726. [Google Scholar] [CrossRef]
  58. Wu, J.; Li, P.; Qian, H. Hydrochemical characterization of drinking groundwater with special reference to fluoride in an arid area of China and the control of aquifer leakage on its concentrations. Environ. Earth Sci. 2015, 73, 8575–8588. [Google Scholar] [CrossRef]
  59. Wang, R.; Li, X.; Wei, A. Hydrogeochemical characteristics and gradual changes of groundwater in the Baiquan karst spring region, northern China. Carbonates Evaporites 2022, 37, 47. [Google Scholar] [CrossRef]
  60. Wang, D.; Wang, L.; Yang, Q.; Yu, K.; Ma, H. Hydrogeochemistry Assessment of Shallow Groundwater and Human Health Threats in the Northwestern Ordos Basin, China. Arch. Environ. Contam. Toxicol. 2021, 80, 92–106. [Google Scholar] [CrossRef]
  61. Yan, S.; Guo, H.; Yin, J.; Hu, H.; Cui, D.; Gao, B. Genesis of high hexavalent chromium groundwater in deep aquifers from loess plateau of Northern Shaanxi, China. Water Res. 2022, 216, 118323. [Google Scholar] [CrossRef]
  62. Li, K.; Li, H. Hydrochemical Characteristics, Controlling Factors, and Solute Sources of Streamflow and Groundwater in the Hei River Catchment, China. Water 2019, 11, 2293. [Google Scholar] [CrossRef] [Green Version]
  63. Yidana, S.M.; Bawoyobie, P.; Sakyi, P.; Fynn, O.F. Evolutionary analysis of groundwater flow: Application of multivariate statistical analysis to hydrochemical data in the Densu Basin, Ghana. J. Afr. Earth Sci. 2018, 138, 167–176. [Google Scholar] [CrossRef]
  64. Gao, Z.; Han, C.; Yuan, S.; Liu, J.; Peng, Y.; Li, C. Assessment of the hydrochemistry, water quality, and human health risk of groundwater in the northwest of Nansi Lake Catchment, north China. Environ. Geochem. Health 2022, 44, 961–977. [Google Scholar] [CrossRef] [PubMed]
  65. Chae, G.T.; Kim, K.; Yun, S.T.; Kim, K.H.; Kim, S.O.; Choi, B.Y.; Kim, H.S.; Rhee, C.W. Hydrogeochemistry of alluvial groundwaters in an agricultural area: An implication for groundwater contamination susceptibility. Chemosphere 2004, 55, 369–378. [Google Scholar] [CrossRef] [PubMed]
  66. JACOBSON, A.D.; BLUM, J.D.; WALTER, L.M. Reconciling the elemental and sr isotope composition of Himalayan weathering fluxes: Insights from the carbonate geochemistry of stream waters. Geochim. Cosmochim. Acta 2022, 66, 3417–3429. [Google Scholar] [CrossRef]
  67. Adams, S.; Titus, R.; Pietersen, K.; Tredoux, G.; Harris, C. Hydrochemical characteristics of aquifers near Sutherland in the Western Karoo, South Africa. J. Hydrol. 2001, 241, 91–103. [Google Scholar] [CrossRef] [Green Version]
  68. Moses, C.O.; Nordstrom, D.K.; Herman, J.S.; Mills, A.L. Aqueous Pyrite Oxidation by Dissolved-Oxygen and by Ferric Iron. Geochim. Cosmochim. Acta 1987, 51, 1561–1571. [Google Scholar] [CrossRef]
  69. Rajmohan, N.; Elango, L. Hydrogeochemistry and its relation to groundwater level fluctuation in the Palar and Cheyyar river basins, southern India. Hydrol. Process. 2006, 20, 2415–2427. [Google Scholar] [CrossRef]
  70. Li, P.; Wu, J.; Tian, R.; He, S.; He, X.; Xue, C.; Zhang, K. Geochemistry, Hydraulic Connectivity and Quality Appraisal of Multilayered Groundwater in the Hongdunzi Coal Mine, Northwest China. Mine Water Environ. 2018, 37, 222–237. [Google Scholar] [CrossRef]
  71. Li, P.; Li, X.; Meng, X.; Li, M.; Zhang, Y. Appraising Groundwater Quality and Health Risks from Contamination in a Semiarid Region of Northwest China. Expo. Health 2016, 8, 361–379. [Google Scholar] [CrossRef]
  72. Venkatramanan, S.; Chung, S.Y.; Ramkumar, T.; Gnanachandrasamy, G.; Vasudevan, S.; Lee, S.Y. Application of GIS and hydrogeochemistry of groundwater pollution status of Nagapattinam district of Tamil Nadu, India. Environ. Earth Sci. 2014, 73, 4429–4442. [Google Scholar] [CrossRef]
  73. Zhang, Q.; Feng, M.; Hao, X.; IOP. Application of Nemerow Index Method and Integrated Water Quality Index Method in Water Quality Assessment of Zhangze Reservoir. In Proceedings of the 3rd International Conference on Energy Equipment Science and Engineering (ICEESE), Beijing, China, 28–31 December 2017. [Google Scholar]
  74. Gad, M.; El Osta, M. Geochemical controlling mechanisms and quality of the groundwater resources in El Fayoum Depression, Egypt. Arab. J. Geosci. 2020, 13, 861. [Google Scholar] [CrossRef]
  75. GB5749-2006; Standard for Drinking Water Quality. Ministry of Health of the People’s Republic of China: Beijing, China, 2006.
  76. Gutierrez, F.; Parise, M.; De Waele, J.; Jourde, H. A review on natural and human-induced geohazards and impacts in karst. Earth-Sci. Rev. 2014, 138, 61–88. [Google Scholar] [CrossRef]
  77. Marina, P.; Snezana, M.; Maja, N.; Miroslava, M. Determination of Heavy Metal Concentration and Correlation Analysis of Turbidity: A Case Study of the Zlot Source (Bor, Serbia). Water Air Soil. Pollut. 2020, 231, 98. [Google Scholar] [CrossRef]
  78. Gonneea, M.E.; Charette, M.A.; Liu, Q.; Herrera-Silveira, J.A.; Morales-Ojeda, S.M. Trace element geochemistry of groundwater in a karst subterranean estuary (Yucatan Peninsula, Mexico). Geochim. Cosmochim. Acta 2014, 132, 31–49. [Google Scholar] [CrossRef]
  79. Chu, X.; Ma, Z.; Wu, D.; Wang, H.; He, J.; Chen, T.; Zheng, Z.; Li, H.; Wei, P. High Fe and Mn groundwater in the Nanchang, Poyang Lake Basin of China: Hydrochemical characteristics and genesis mechanisms. Environ. Monit. Assess. 2022, 195, 124. [Google Scholar] [CrossRef]
  80. Uhl, A.; Hahn, H.J.; Jaeger, A.; Luftensteiner, T.; Siemensmeyer, T.; Doell, P.; Noack, M.; Schwenk, K.; Berkhoff, S.; Weiler, M.; et al. Making waves: Pulling the plug-Climate change effects will turn gaining into losing streams with detrimental effects on groundwater quality. Water Res. 2022, 220, 118649. [Google Scholar] [CrossRef]
  81. Radelyuk, I.; Tussupova, K.; Persson, M.; Zhapargazinova, K.; Yelubay, M. Assessment of groundwater safety surrounding contaminated water storage sites using multivariate statistical analysis and Heckman selection model: A case study of Kazakhstan. Environ. Geochem. Health 2021, 43, 1029–1050. [Google Scholar] [CrossRef]
  82. Rana, R.; Ganguly, R.; Gupta, A.K. Indexing method for assessment of pollution potential of leachate from non-engineered landfill sites and its effect on ground water quality. Environ. Monit. Assess. 2018, 190, 46. [Google Scholar] [CrossRef]
Figure 1. (a) Location of the study area (red star—Beijing, dotted line—South China Sea coastline); (b) groundwater system diagram of the study area; (c) regional geological map and sampling point location in the study area. Quaternary: alluvial, residual slope deposits; Neogene: mudstone; Triassic: dolomite, limestone and sandstone; Permian: basalt, limestone and sandstone; Carboniferous: limestone and a little dolomite; Devonian: limestone and dolomite; Cambrian: dolomite and a little sandstone.
Water 15 02126 g001
Figure 2. Box–whisker plots of major ions in surface water and groundwater in the study area.
Water 15 02126 g002
Figure 3. Piper diagrams showing the hydrochemical types of the studied water.
Water 15 02126 g003
Figure 4. Correlation diagram of SO42− vs. HCO3 + Cl for groundwater. Iso salinity lines are drawn for reference.
Water 15 02126 g004
Figure 5. Box–whisker plots of heavy metals in surface water and groundwater in the study area.
Water 15 02126 g005
Figure 6. Gibbs diagram explains the chemical and geochemical processes of groundwater in the study area.
Water 15 02126 g006
Figure 7. Scatter plots of (Ca2+/Na+) and (Mg2+/Na+) (a), and (Ca2+/Na+) and (HCO3/Na+) (b) in the studied groundwater.
Water 15 02126 g007
Figure 8. Scatterplot showing the relationship between the hydrochemical composition of groundwater: (a) (Ca2+ + Mg2+) versus (HCO3 + SO42−); (b) Ca2+ versus Mg2+; (c) Na+ versus Cl; (d) Ca2+ versus HCO3; (e) Mg2+ versus SO42−; (f) SO42− versus Cl.
Water 15 02126 g008
Figure 9. The relationship between groundwater (Na+ − Cl) and (Ca2+ + Mg2+ − HCO3 − SO42−) (a) and Scatter plot of CAI-I versus CAI-II (b).
Water 15 02126 g009
Figure 10. Proportion of single factor pollution index of groundwater in different strata.
Water 15 02126 g010
Figure 11. The drinking water quality index (DWQI) values of water in the study aera.
Water 15 02126 g011
Table 1. Statistic results of physicochemical parameters of water samples in the study area.
pHTDS
mg/L
CODMn
mg/L
Ca2+ mg/LMg2+ mg/LNa+ mg/LK+ mg/LCl mg/LSO42− mg/LNO3 mg/LHCO3 mg/LMn μg/LCu μg/LZn μg/LPb μg/L
Surface
water
(n = 12)
AVG7.312434.3929.35.856.4722.66.277.363.521667810.756.380.42
MAX7.894467.6344.111.726.051.914.919.610.729932202.2712.61.34
MIN6.9758.20.956.691.180.350.41.02.992.0141.815.30.191.150.02
Triassic
groundwater
(n = 24)
AVG7.452820.5258.48.391.460.862.189.8413.520110.20.385.240.63
MAX8.166163.0114932.38.73.217.574.091.539265.80.97171.48
MIN6.8937.3ND5.620.860.180.050.882.922.0124.90.360.141.350.16
Devonian
groundwater
(n = 12)
AVG7.382180.4741.210.11.360.73.7114.012.214510.80.969.50.33
MAX8.125552.2814924.35.521.3916.166.856.533117404.1763.60.67
MIN6.2517.0ND1.090.440.210.10.912.922.0210.70.270.290.210.13
Carboniferous groundwater (n = 1)7.55580ND18.93.42.50.740.933.22.3678.386.60.633.970.93
Cambrian
groundwater
(n = 15)
AVG7.832700.5337.219.00.762.531.784.644.5119916.10.613.170.46
MAX8.085805.0675.036.75.9821.17.8511.18.384383121.177.140.97
MIN7.211320.9520.84.710.150.520.923.112.0294.30.120.141.170.16
Note: ND: not detectable.
Table 2. Statistical table of saturation index for different minerals in groundwater in the study area.
AnhydriteCalciteDolomiteGypsumHaliteSylvite
Surface
water
(n = 12)
AVG−3.4−0.47−1.31−3.11−9.39−8.4
MAX−2.80.240.2−2.49−7.97−7.28
MIN−4.08−1.6−3.46−3.78−10.9−10.5
Triassic
groundwater
(n = 24)
AVG−3.18−0.04−0.72−2.87−10.4−10.2
MAX−1.810.871.49−1.5−8.4−8.73
MIN−4.21−2.11−4.5−3.91−11.2−11.4
Devonian
groundwater
(n = 12)
AVG−3.36−0.56−1.4−0.36−10.4−10.2
MAX−1.940.841.4−1.63−8.63−8.79
MIN−4.81−3.03−6.12−4.5−11.2−11
Carboniferous groundwater (n = 1)7.55−3.74−0.56−1.51−3.44−10.2
Cambrian
groundwater
(n = 15)
AVG−3.480.290.61−3.17−10.8−9.83
MAX−2.860.891.88−2.55−8.9−7.92
MIN−3.77−0.46−0.84−3.46−11.4−10.4
Table 3. Classification criteria of pollution.
PiClassPNClassDWQIClass
Pi ≤ 1UnpollutedPN ≤ 0.7Safety0–25Excellent
1 ≤ Pi ≤ 2Mild pollution0.7 ≤ PN ≤ 1Alert26–50Good
2 ≤ Pi ≤ 3Moderate pollution1 ≤ PN ≤ 2Mild pollution51–75Poor
3 ≤ PiHeavy pollution2 ≤ PN ≤ 3Moderate pollution76–100Very poor
3 ≤ PNHeavy pollution>100Unsuitable
Table 4. Calculation method of DWQI.
ParameterpHCODMnKNaCaMgCl
Si (WHO)8.53122007550250
Wi0.0010450.002960.000740.0000440.0001180.0001780.0000355
ParameterSO4HCO3NO3MnCuZnPb
Si (WHO)250150500.1110.01
Wi0.00003550.0000740.0001780.08880.008880.008880.888
Note: K = 1 / 1 / Sn = 0.00888 W i = 1 .
Disclaimer/Publisher’s Note: The statements, opinions and data contained in all publications are solely those of the individual author(s) and contributor(s) and not of MDPI and/or the editor(s). MDPI and/or the editor(s) disclaim responsibility for any injury to people or property resulting from any ideas, methods, instructions or products referred to in the content.

