Article

Laboratory Study of the Hydraulic Performance of the A-Type Triangular Piano Key Weir

by
Forough Alizadeh Sanami
1,
Amir Ghaderi
2,*,
Fardin Alizadeh Sanami
3,
Parisa Mirkhorli
4 and
Silvia Di Francesco
5,*
1
Faculty of Civil, Water and Hydraulic Structure Engineering, Iran University of Science and Technology, Tehran 13114-16846, Iran
2
Department of Civil Engineering, Faculty of Engineering, Urmia University, Urmia 57561-15311, Iran
3
Faculty of Mechanic, Pardisan University, Mazandaran 46314, Iran
4
Faculty of Engineering, Islamic Azad University Science and Research Branch, Tehran 14515-775, Iran
5
Department of Engineering, Niccolò Cusano University, 00166 Rome, Italy
*
Authors to whom correspondence should be addressed.
Water 2023, 15(11), 2124; https://doi.org/10.3390/w15112124
Submission received: 22 April 2023 / Revised: 28 May 2023 / Accepted: 31 May 2023 / Published: 2 June 2023
(This article belongs to the Section Hydraulics and Hydrodynamics)

Abstract

:
A piano key weir (PKW), a new type of weir aiming to increase the discharge capacity of an existing dam, was recently designed. Despite a large body of research in this field, only a few studies were conducted on A-type triangular piano key weirs (TPKW) in straight channels. In this context, this present research sought to study the flow regime, stage–discharge relationship, and discharge coefficient. Experiments were carried out using nine TPKW models and three linear weirs (LW) as the control weirs. The results indicated that the triangular piano key weirs are capable of passing a higher discharge in similar laboratory conditions compared to linear key weirs due to their longer length. For a given h/P ratio (h is the water head over the weir crest, and P is the weir height) and constant length (Le), an increase in the weir height from 0.07 m to 0.15 m decreases the discharge coefficient by approximately 20%. From sensitivity analysis, the most influential parameters for the tested TPKW models are the h/Le dimensionless ratio, followed by the P/Le and Fr. Moreover, the discharge coefficient has a reverse trend when the dimensionless parameters h/P, h/Le, and Froude number are increased. However, with decreasing h/Le, the discharge coefficient of TPKW tends to that of a broad-crested weir because of local submergence. It is expected that the results obtained will be a reference for researchers who work in this field.

1. Introduction

Weirs are classified into two broad groups that depend on the plan shape: linear and nonlinear weirs. A nonlinear weir with a folded crest enhances the spillway system discharge capacity by increasing the crest length for a given channel width. Piano key weirs (PKW) are an innovative and efficient modification of nonlinear weirs [1]. An increase in the weir crest length for a given channel width and constant upstream water head can increase the effective discharge of these weirs by three to four times with respect to the linear weir [2,3]. Furthermore, the inclined keys in piano key weirs, which substitute the horizontal-vertical design of labyrinth weirs, enhance their hydraulic performance [4]. There are four types of PKW known as type A, type B, type C, and type D (Figure 1). Main geometrical parameters of the PKW are in Figure 2. In this figure, P = weir height, B = weir length, Bo = upstream overhang length, Bi = downstream overhang length, Bb = weir base width, and t = wall thickness [5].
To the best of our knowledge, hardly any research and no standard design method exist for TPKW, although a large number of studies were conducted on other types of PKW. By comparing types A and D piano key weirs, Anderson and Tullis [7] stated that overhangs could increase discharge efficiency. Kabiri Samani and Javaheri [8] presented experimental relations to calculate the piano key weir’s discharge coefficient using dimensional analysis. By applying the results of physical models, Ribrio et al. [4] developed a stage–discharge equation of the piano key weirs. Mehbodi et al. [9] experimentally investigated the discharge coefficient of the trapezoidal PKW. Using a numerical model, Safarzadeh and Noroozi [10] evaluated the three-dimensional hydrodynamics of a trapezoidal piano key weir and concluded that the piano key weir is more efficient than a corresponding labyrinth weirs. According to the study by Ghanbari and Heidarnejad [11], the discharge coefficient of PKW with a triangular nose is 25% higher than the conventional one. With decreased weir height, the discharge coefficient increased. Crookeston et al. [12] examined and estimated the discharge coefficient of piano-shaped key weirs in free flow. Karimi et al. [13] experimentally evaluated and compared piano-key, labyrinth, and linear side weirs. They found that the trapezoidal piano key weir had a substantially higher discharge coefficient than the linear and labyrinth weirs. They reported that the trapezoidal piano key weir discharge coefficient was significantly higher than that of the linear and labyrinth weirs. Razavizadeh et al. [14] examined the flow passing the sinusoidal and semicircular labyrinth weirs and provided accurate equations for calculating and determining the discharge coefficient. By evaluating the flow characteristics and discharge coefficients of symmetric and asymmetric triangular weirs, Karimi et al. [15] indicated the higher discharge coefficient of the asymmetric triangular weir relative to the symmetric triangular weir. In another study, Saghari et al. [16] proposed an empirical equation to calculate the discharge coefficient and reported a higher discharge coefficient for the trapezoidal piano key weir compared to the rectangular weir. Guo et al. [17] evaluated the discharge capacity and hydraulic design of the piano key weirs and briefly analyzed the discharge formulas introduced by other researchers. Given the existing data and dimensional analysis, they suggested a new formula and proposed a mathematical formula that was capable of predicting the A-type PKW discharge capacity. Kadia et al. [18] proposed an empirical equation to predict the discharge coefficient of A-type PKW for a wide range of specific parameters. Dabling and Tullis [19] compared submerged head–discharge relationships for PKW Type A and labyrinth weirs. Torre-Gómez et al. [20] compared the performance of type A and type B PKWs. They reported that B-type PKWs in lower water heads are more efficient than A-types. This is despite the fact that during submergence of the weir and higher water heads, the efficiency of type A is higher than that of type B. Alizadeh Sanami et al. [21] evaluated the laboratory tests of the hydraulic efficiency of triangular D-type PKWs. They found that the Cd (discharge coefficient) of D-type triangular PKWs was greater than that of rectangular ones, and it varied between 0.48 < Cd <1.60 and 0.6 < Cd_without <1.80 (with and without a downstream slope), respectively. They proposed some equations to estimate the discharge coefficient of the TPKW. Alizadeh Sanami et al. [22] offered an investigation on the discharge coefficient of a B-type triangular PKW, demonstrating that the sloping triangular surface of the PKW assisted the swift transfer of flow from the channel bed, specifically in the outlet keys. Additionally, with increasing the dimensionless parameters h/Le (weir length magnification ratio) and h/P (head water ratio), the discharge coefficient decreased. Bekheet et al. [23] examined the effect of the shape and type of piano key weirs on flow efficiency. They found that the ratio Wi/Wo is the most studied effective parameter on the PKW flow efficiency, followed by the weir’s shape and then its type.
Based on PKW literature, it can be concluded that the plan shape significantly affects PKW performance and can result in cost savings in both construction and operation parts. Although various valuable studies were conducted on the hydraulic aspect of PKWs, no previous study considered type-A triangular PKWs in a straight channel in free-flow hydraulic conditions, as far as the authors know. Thus, the main objectives of the present study are to (1) study the flow pattern, (2) determine the effect of parameters that influence the discharge coefficient (Cd), and (3) propose equations for estimating the discharge coefficient of A-type triangular PKWs. The paper is organized as follows: Firstly, a brief overview of the literature is presented in Section 1. Section 2 expresses the theoretical background through the approach of identifying parameters affecting the discharge coefficient of triangular PKWs. The details of the physical models are given in Section 3. Section 3 analyzes and discusses the hydraulic properties of flow at different hydraulic and geometrical conditions based on observations and experimental results. Afterwards, in Section 4, the main conclusions are listed.

2. Materials and Methods

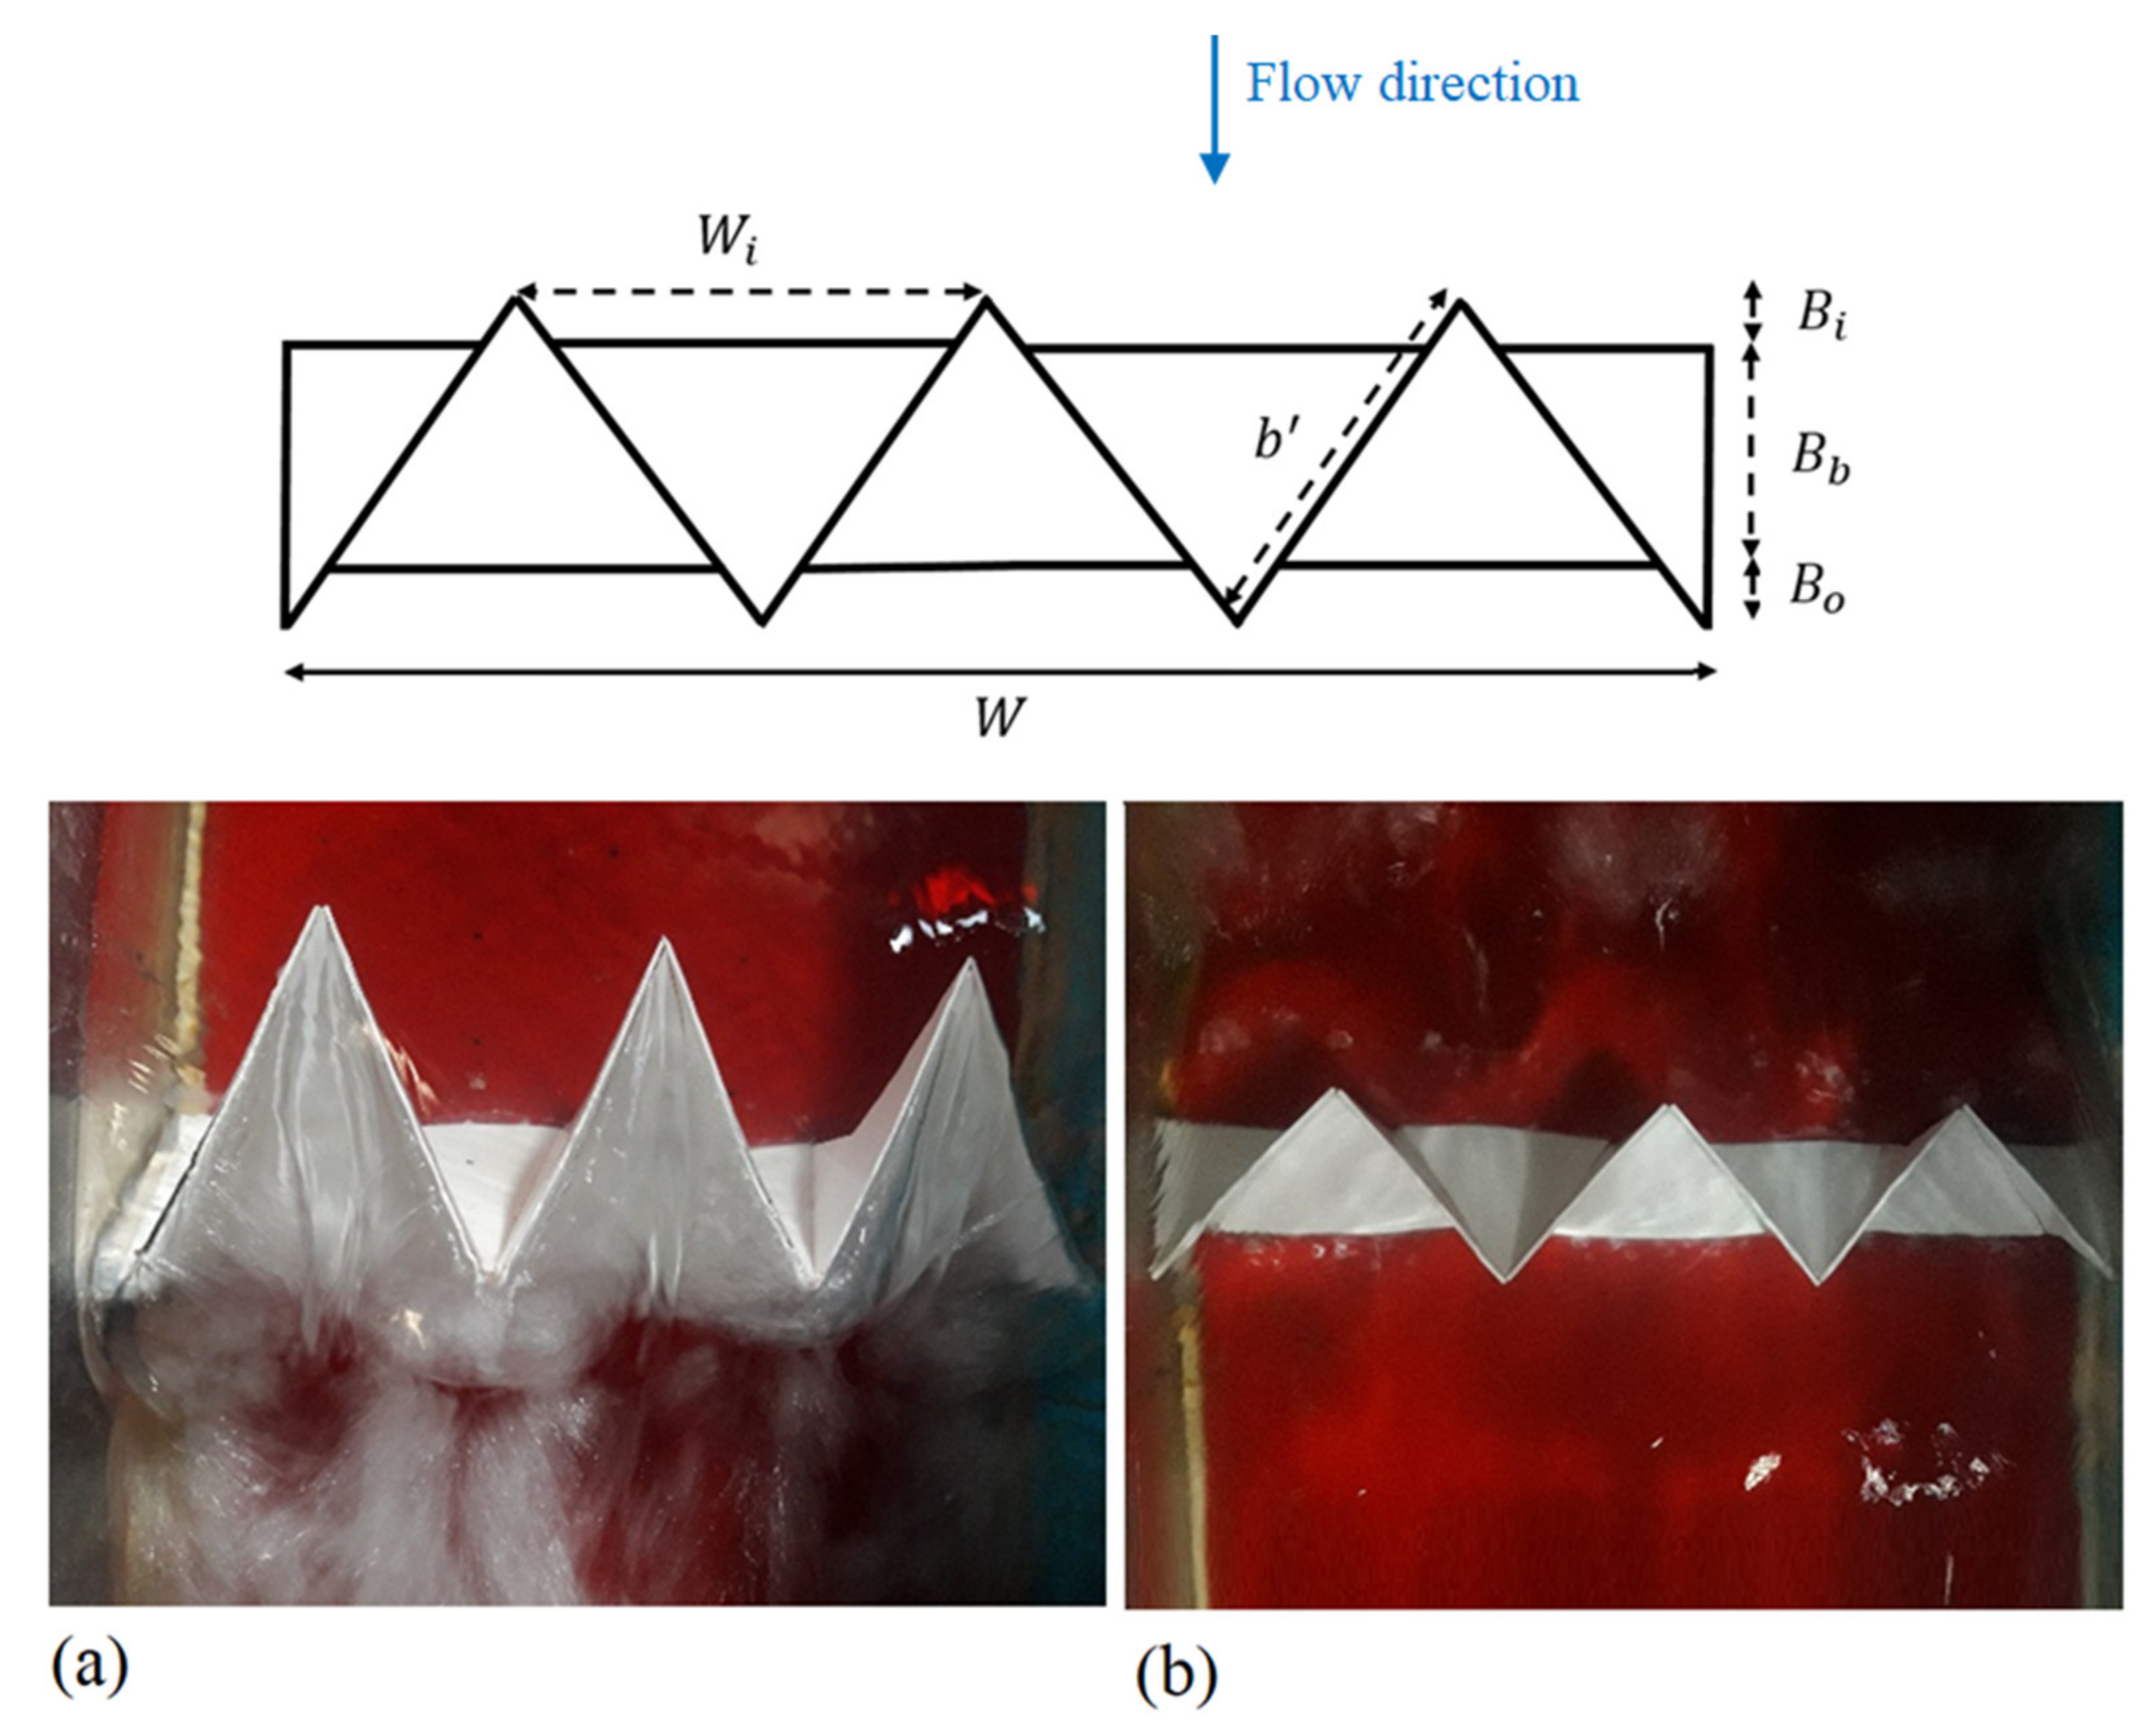
2.1. Dimensional Analysis

In order to calculate the PKW discharge coefficient, the weir’s general relationship (Equation (1)) was used as follows [24]:
Q = 2 3 C d L h 1.5 2 g
C d = Q 2 3 L h 1.5 2 g
where Q (m3/s) is the flow discharge, Cd is the discharge coefficient, L (m) is total weir length, h (m) is water head over the weir and g (m/s2) is the gravitational acceleration. Equation (2) expresses the independent parameters affecting the PKW discharge coefficient.
f W i ,   W o ,   W ,   B , B i ,   B o ,   L e ,   P ,   N ,   h ,   V ,   C d ,   g ,   μ ,   ρ ,   σ = 0
here input key width (Wi), output key width (Wo), total weir width (W), weir side crest length (B), downstream overhang length (Bi), upstream overhang length (Bo), effective weir crest length (Le), weir height (P), and the number of cycles (N). Parameters related to flow characteristics are water head over weir crest (h), upstream velocity (V), gravitational acceleration (g), dynamic viscosity (μ), density (ρ), and surface tension (σ). Using the dimensional analysis technique and integrating the parameters of Equation (4), the dimensionless parameters one can derive are:
C d = f ( W i W o , L e W , h L e , P W , B i B o , h P , P L e , L e B , P B , N , W e = σ ρ V 2 h , Re = ρ V h μ , F r = V g h )
Here, We, Re, and Fr are the Weber, Reynolds, and Froude numbers of the approach flow, respectively. Re is removed from the equation because the viscosity effects are significantly less in turbulent flow (turbulent flow with Re > 25,000) [25]. To avoid the influence of surface tension on the head–discharge relationship of PKWs, Pfister et al. [26], Daneshfaraz et al. [27], and Erpicum et al. [28] expressly recommended h ≥ 0.03 m. The above recommendations were satisfied in the current study, and so, surface tension was neglected. Additionally, the Froude number was less than 1 in all models, satisfying the subcritical flow conditions at the weir upstream. Additionally, the geometric parameters Wi/Wo, Bi/Bo, Le/B, and N were constants in this study. The final relation between the dimensionless parameters affecting the discharge coefficient is given by Equation (5):
C d = ( L e W , h L e , P W u , h P , P L e , P B , F r )
For multiple nonlinear regression, the following formula is used:
C d = a ( h P ) b ( h L e ) c ( L e W ) d ( F r ) e ( P L e ) f ( P W u ) g ( P B ) h

2.2. Regression Method

RMSE (root mean square error), MSE (mean square error), and R2 (regression coefficient) were calculated between computed and observed values to evaluate the accuracy of fit.
R 2 = 1 i = 1 N O i t i 2 i = 1 N O i p i 2
M S E = 1 n i = 1 n O i t i 2
R M S E = i = 1 N O i t i 2 N
where Oi and ti are the measured and estimated values, respectively. pi is the mean of the measured values, and N is the total number of experiments considered for the regression. A perfect model has an RMSE that tends to zero and an R2 that tends to 1 [29].

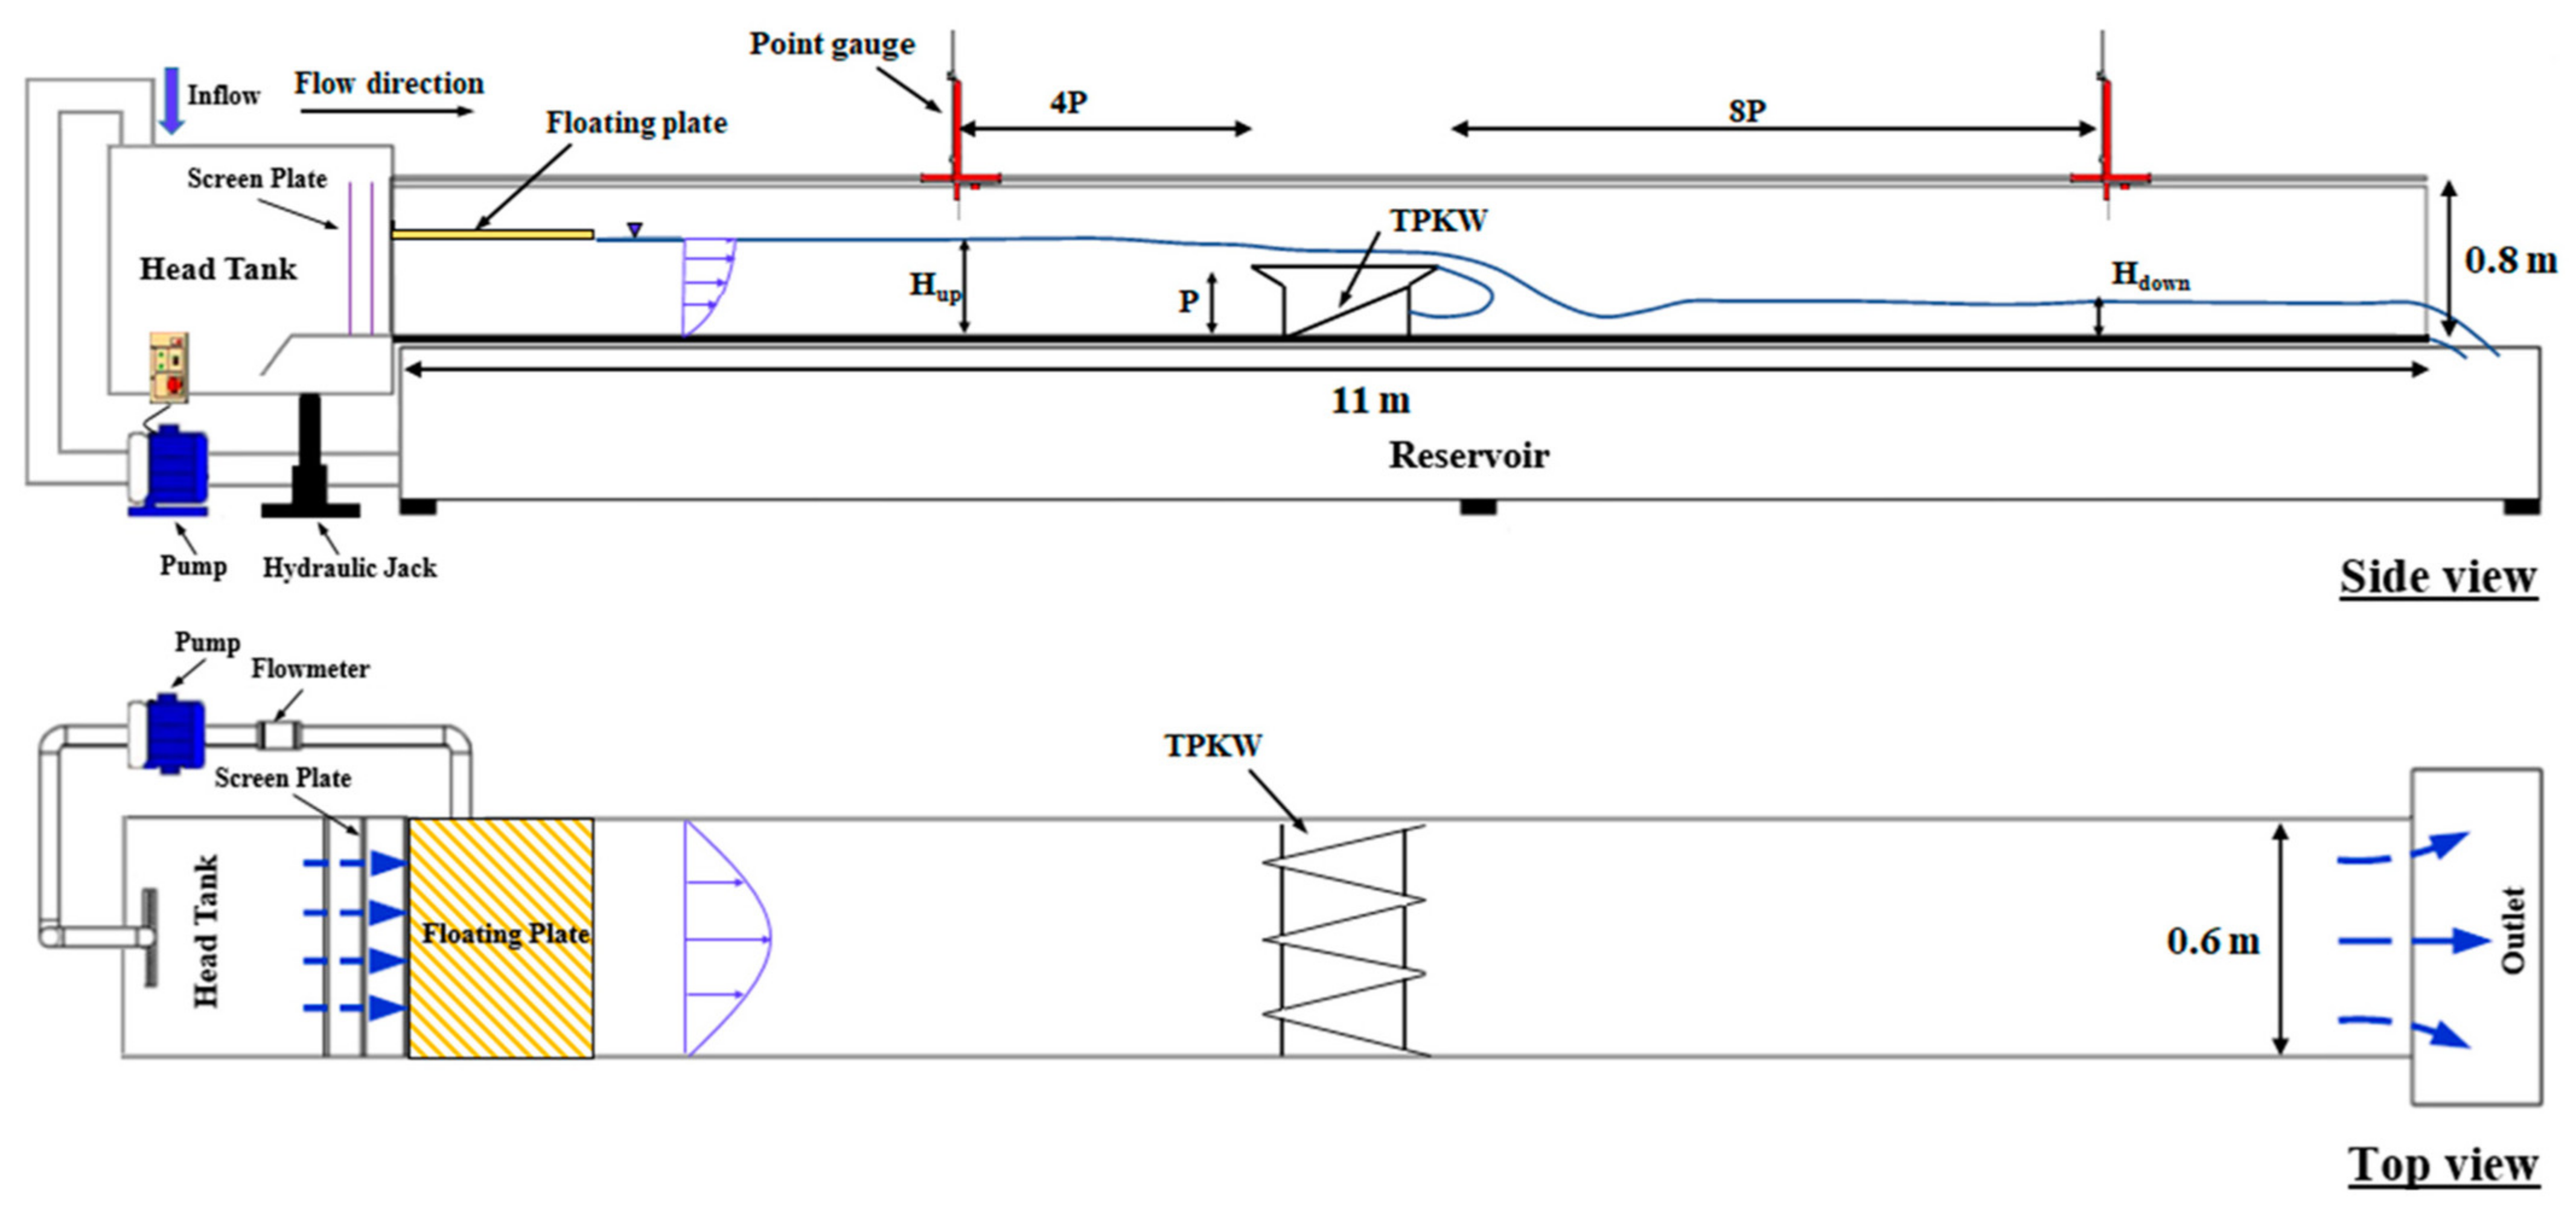
2.3. Experimental Setup

The experimental TPKW physical models were constructed at at the laboratory of Soil Conservation and Watershed Management Research Institute and installed within an open channel of length of 11 m, width of 0.6 m, height of 0.8 m and bed slope of 0.0001. The flume contained plexiglass sidewalls with 10 mm thickness and negligible sidewall effects (to enhance flow visibility and decrease friction) [30]. The flume’s flow was supplied by a pump that can also convey a maximum of 0.080 m3/s of water into the head tank. A gauge point determined the flow depth for upstream at a distance of 4P times the weir height, and at 8P downstream of each TPKWs with an accuracy of ±1 mm. Figure 3 demonstrates a schematic view of the laboratory setup.
Given the limitations of the laboratory, the PKWs were designed with three design cycles (see Figure 4). Nine A-type triangular piano key weirs (TPKW) and three linear weir (LW) model geometries were investigated for 0.11 ≤ P/B ≤ 0.25, 0.18 ≤ h/P ≤ 1.54 with three different weir heights (i.e., 0.07, 0.1, and 0.15 m) and three different weir side crest lengths (i.e., 0.15, 0.20, and 0.25 m), comprising 130 tests in total. The range of discharge was between 0.003 and 0.045 m3/s. The geometric characteristics of TPKW models and hydraulic parameters considered in this study are detailed in Table 1 and Table 2, respectively.

3. Results

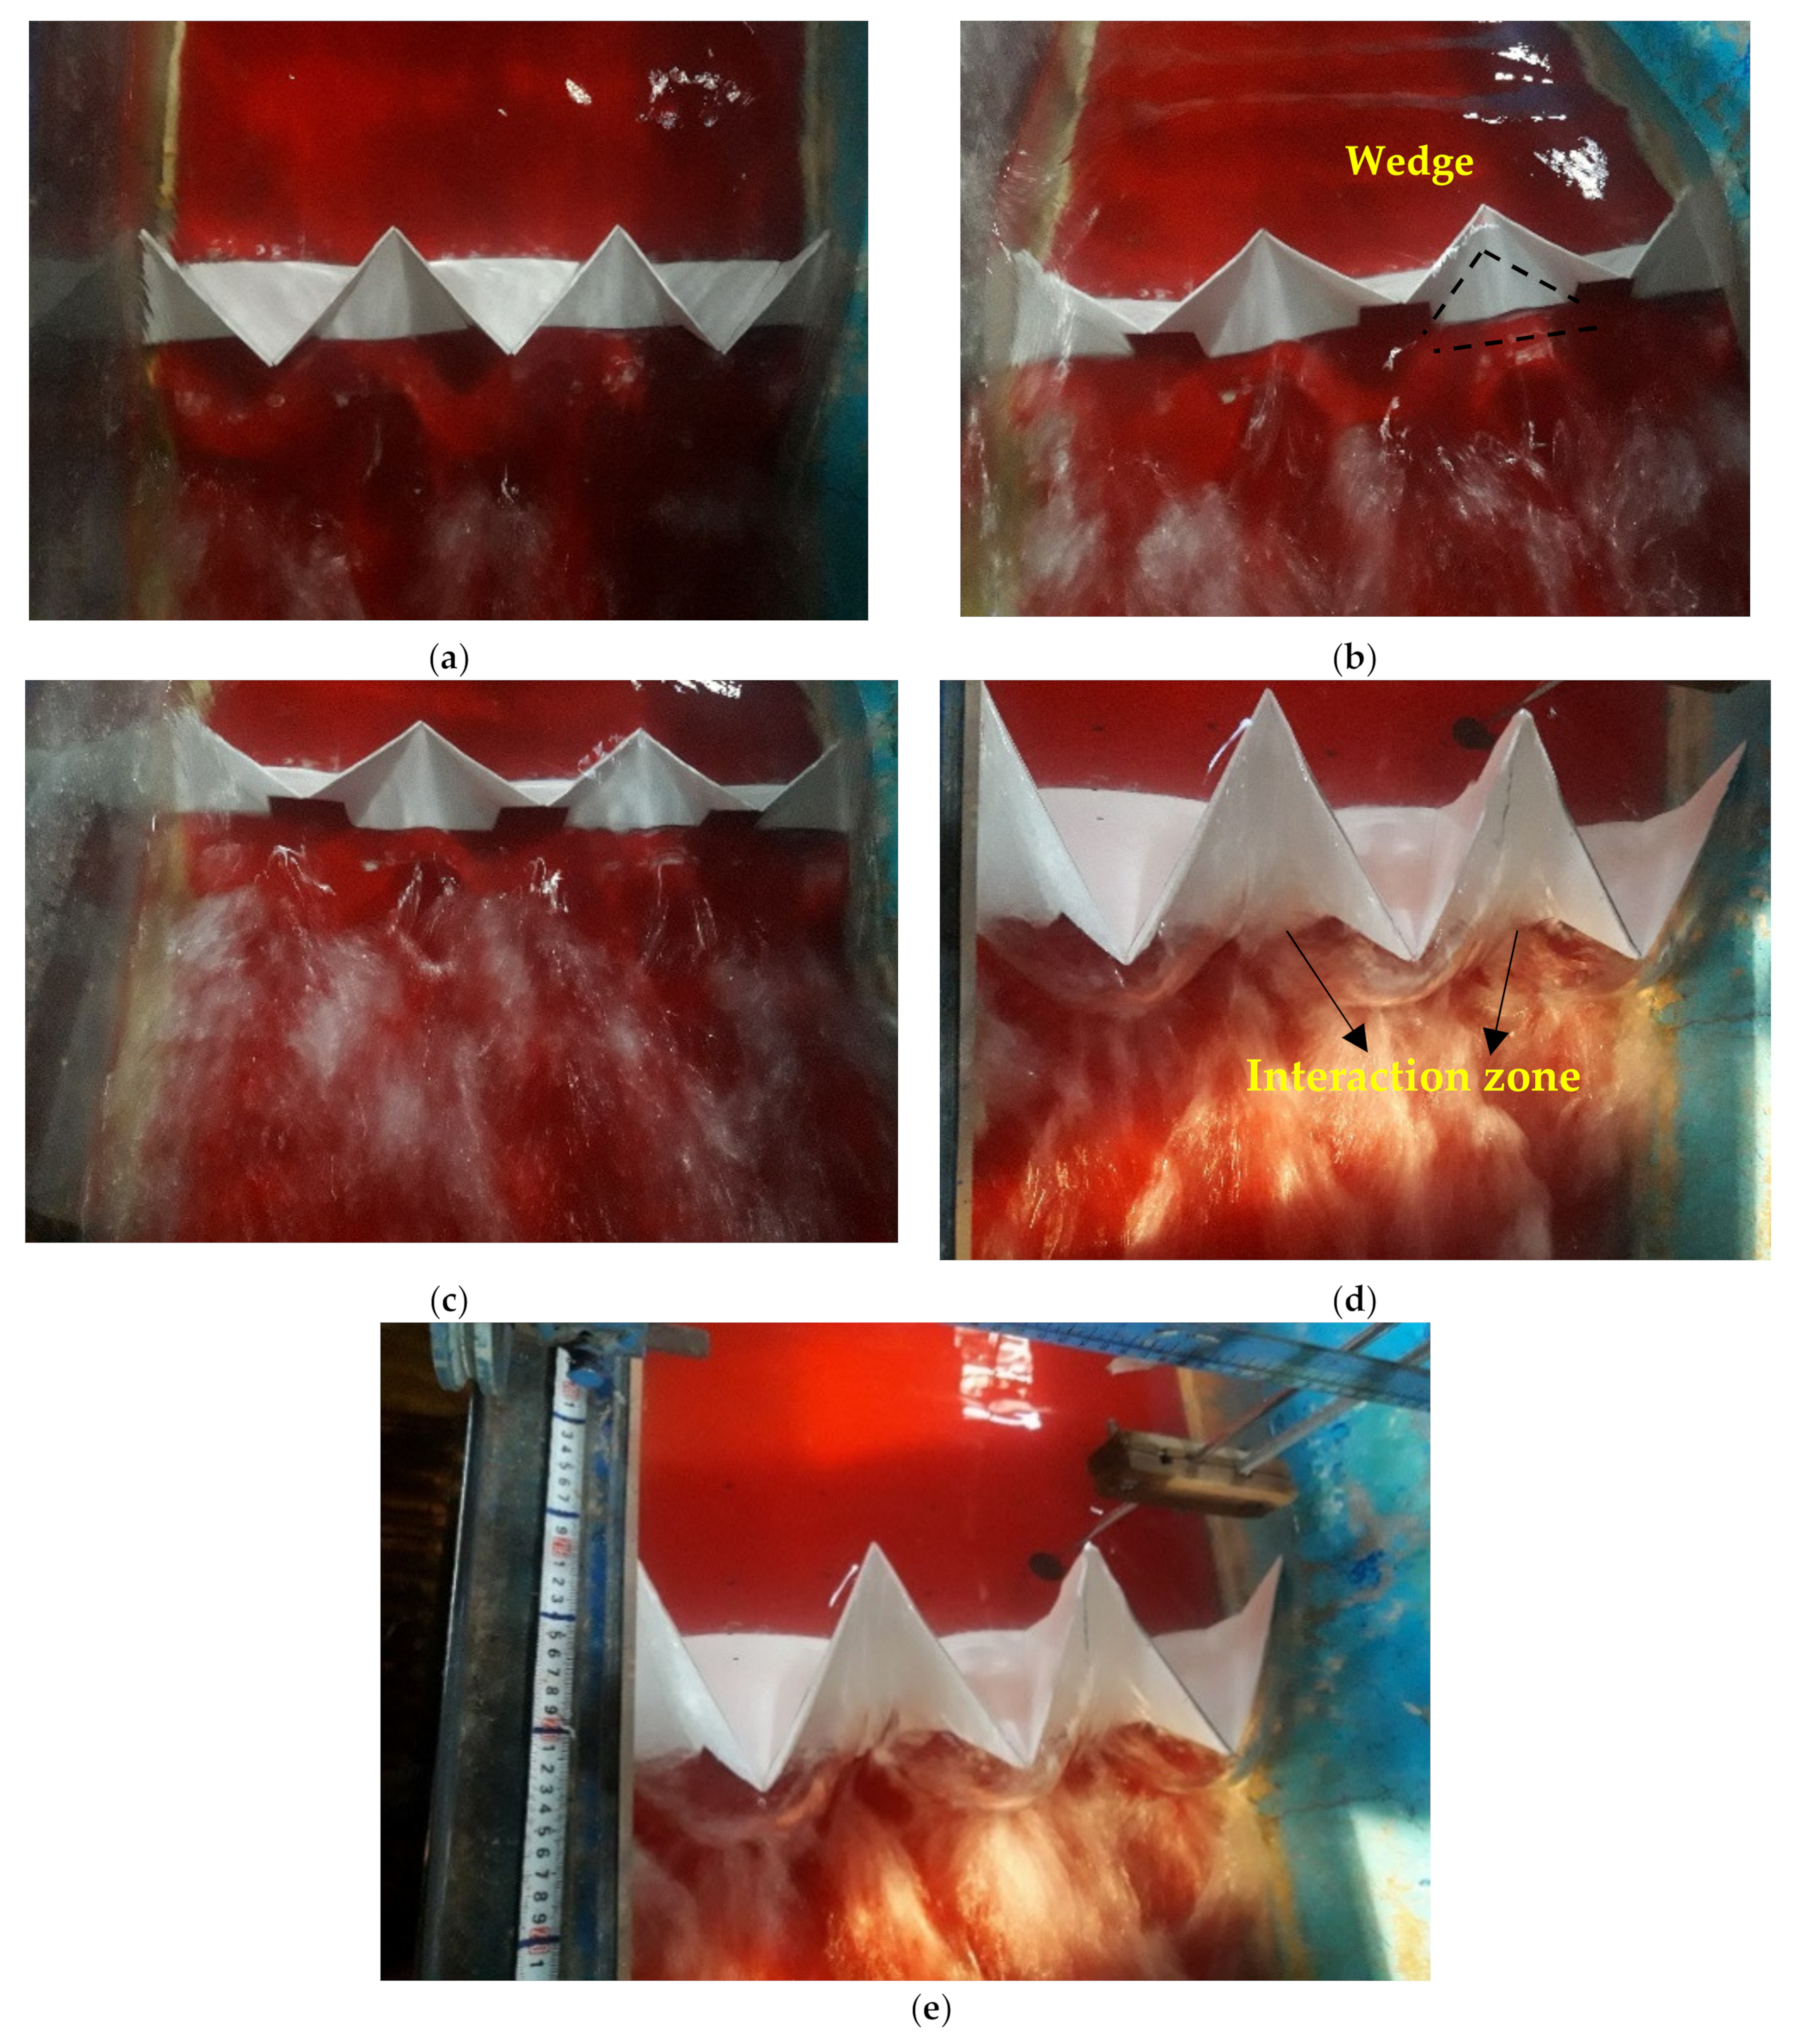
3.1. Flow Behavior and Stage–Discharge Relationship for A-Type TPKW

The flow passing the labyrinth weir is generally divided into three categories [13,31,32]: (1) nappe flow, which includes three phases of clinging flow, leaping flow, and springing flow; (2) transition flow, and (3) suppressed flow. As illustrated in Figure 5, when h/P < 0.05, the water flow was completely attached to the crest wall due to the surface tension. For 0.05 < h/P < 0.1, the flow was of the clinging type and did not have enough energy to detach from the crest. If 0.1 < h/P < 0.2, then the flow is of springing type and has enough energy to detach from the structure (Figure 5a). For the transition flow, the condition was 0.2 < h/P < 0.35 and the flow collision occurred at the corners of the weir crest, resulting in a wedge formation (Figure 5b). Accordingly, increasing the head to h/P < 0.35 led to a pressurized flow, meaning that the wedge grew larger and occupied a larger part of the key (Figure 5c). Figure 6d depicts the interference zone of the flow and vortex in the keys. A similar classification was performed to determine the flow regime of piano key weirs by [1,8,9,13], which is presented in Table 3.
The flow passing the PKW depends on the weir geometry [6,33]. As shown in Figure 6, the effective lengths for the TPKW were 0.9, 1.2, and 1.5 m, and the effective length for the linear weir (LW) was 0.6 m. Based on the produced graphs, the relationship between discharge and water depth was nonlinear, consistent with Anderson’s study [3]. In addition, by increasing the effective length of TPKW, the water head over the weir for a given flow discharge decreased. The maximum and minimum water depths at a given discharge were tested for lengths of 0.9 and 1.5 m, respectively. At a discharge of 0.025 m3/s, the water head for the linear weir with h = 0.15 m was 0.093 m, whereas for the TPKWs with effective lengths of 1.5, 1.2, and 0.9 m (M9, M8, and M7 models) and the same weir height, the water heads were 0.047, 0.05, and 0.059 m, respectively. Therefore, it can be inferred that TPKW models had a lower water head than the linear weir one, which is true for all Le (effective length) values considered in this study.

3.2. Effect of Weir Height on the Discharge Coefficient for A-Type TPKW

Figure 7 illustrates the variations of the dimensionless h/P (water head to weir height ratio) against the discharge coefficient (Cd) at three different weir heights (i.e., 0.07, 0.1, and 0.15 m). As shown, the discharge coefficient had a decreasing trend with increasing the water head over the weir for a given weir height ratio, which is consistent with the results of Machiels et al. [34] and Norouzi [10]. At a given h/P ratio, the discharge coefficient for the TPKW with a length of 1.5 m was higher than that for other lengths. Thus, it can be concluded that an increase in the effective weir length increases the flow discharge, resulting in a higher discharge coefficient at a constant weir height. In addition, in all models with different weir heights, TPKW had a higher discharge coefficient than the LW one. The increase in the discharge coefficient in TPKW compared to LW in all models varied between 15 and 25 percent. Figure 8 illustrates the variation of Cd as a function of h/P for a weir length of 1.5 m and three different weir heights of 0.15, 0.1, and 0.07 m. As shown, for a given h/P ratio, the weir discharge coefficient with a height of 0.07 m was higher than the other two heights. This decrease with increasing weir height may be due to increased nappe interaction in the downstream of the weir which caused the formation of local submerged in this area.

3.3. Effect of Length of Weir and Froude Number on the Discharge Coefficient for A-Type TPKW

The variation of h/Le against the discharge coefficient for different weir lengths is presented in Figure 9. The discharge coefficient decreased with increasing h/Le. This trend was relatively linear when h/Le < 0.04 and it was non-linear when h/Le > 0.04. For a given water head, despite the decreased discharge coefficient, with an increase in weir length, discharge increased, which is considered one of the important factors for the operation of PKWs during flood events.
Figure 10 shows the Froude number variations compared to discharge coefficients at different weir heights and weir lengths. As shown, the increase in the Froude number reduced the discharge coefficient for all TPKW models considered in this research. Furthermore, at a given Froude number, Cd for TPKW with Le = 1.5 m was higher than for other models due to its greater effective length. On the other hand, Cd in TPKW models was in the range of 0.76–2, while the linear weir (LW) had a lower Cd value in the range of 0.47–0.67 for the same hydraulic conditions. This was an indication the better performance of the TPKWs at flow discharge passage compared to the LW. Figure 11 illustrates the variation of the Froude number versus the discharge coefficient for TPKWs at constant length. As expected, at a constant Froude number, TPKW with a low weir height had a higher Cd compared to the other weir heights.
Table 4 represents a summary of the geometric characteristics of the PKW models with the laboratory channel of Machiels et al. [34] Oerte [35] and Safarzadeh et al. [14], who studied the modified rectangular PKW, the modified A-Type PKW, and the D-Type rectangular PKW. Despite the fact that their discharge coefficients were in the range of 0.33 < Cd < 0.62 and 0.2 < Cd < 0.57, respectively. The present study found a higher discharge coefficient for the TPKW, which varied in the range of 0.76 < Cd < 2.

3.4. Regression Equation

The process of modelling and estimating the coefficient of discharge in the weir is an essential part of hydraulic engineering for developing and assessing the performance of water projects and irrigation networks. To fit data from effective parameters of discharge coefficient, one can use fitting techniques such as the ADM technique (Adomian decomposition method) [36] and non-linear regression. Multiple nonlinear regressions were used to adapt a nonlinear function to the measured values of discharge coefficient based on dimensionless parameters, independent variables (h/Le), (Le/W), (Fr), (Le/B), (P/Le), (P/Wu), (P/B), and (h/P), and the dependent variable Cd. The range of dimensionless parameters were 0.053 < h/P < 1.27, 0.004 < h/Le < 0.098, 1.5 < Le/W < 2.5, 0.029 < Fr < 0.383, 0.046 < P/Le< 0.166, 0.233 < P/Wu < 0.5, and 0.28 < P/B < 1. The resulting equation is given by:
C d = 0.772 h P 0.036 h L e 1.019 L e W 0.187 F r 0.805   P   L e 0.643 P W u 0.156 P B 0.41
The minimum R2 of 0.96 and the maximum errors of RMSE = 0.09 and MSE = 0.008 indicate that the measured and calculated Cd values (plotted in Figure 12) were in close agreement. The equation shows that Cd is directly proportional to (Le/W), (Fr), (P/Le), and (P/B) and inversely proportional to dimensionless parameters (h/P), (h/Le), and (P/Wu). Since Fr had a higher power, Cd was more sensitive to this parameter compared to other parameters. Using 80% of the laboratory data, the proposed equation was developed, while the remaining 20% was used to validate the formulas. Additionally, a 45-degree line containing 20% error lines was drawn. From a technical point of view, the fact that all of the data fell within the 20% error lines demonstrated its high accuracy.

3.5. Sensitivity Analysis

Sensitivity allows to quantify the influence of different input parameters on the output of the model. We calculated the model output (Cd) when all input parameters were set to the mean of the data to perform sensitivity analysis (Table 5). However, one parameter was disturbed by a small value. The change in the output divided by the change in the input parameter was reported as the sensitivity of the model. This was calculated by:
S i = C d x 1 , , x i , , x n C d x 1 , , x i + Δ x i , , x n Δ x i
wherein Si represents the sensitivity of the formula to the input parameter xi, and ∆xi represents the change in said input parameter. Usually, this involves the elimination of terms with “small” effectiveness.
In order to perform sensitivity analysis, parameters were eliminated from the regression power equation and the error rates were monitored. It was observed that Cd is insensitive to several parameters, as the model accuracy remained virtually unchanged when these variables were removed. The variable elimination was carried out in a forward manner, meaning that once the parameter with the least effect on accuracy was removed, it was not added back to the model, and another variable was eliminated next without considering the effect of returning the previous removed variable. The results of the sensitivity analysis revealed that Cd was only sensitive to h/Le, Fr, and P/Le, while it was insensitive to h/P, Le/w, P/Wu, and P/B. In the end, the following model was fitted to the data:
C d = 1.522 × F r 0.798 h L e 0.97 P L e 0.835
This equation is superior to Equation (10) because it retains the same mean squared error while reducing the number of inputs from seven to only three variables. Figure 13 shows the variations of percent error of Cd for Equation (12), which has a standard deviation of about 7%.

4. Conclusions

The present research work investigated the hydraulic performance of A-type triangular PKW. For this purpose, 130 experiments were conducted on twelve models including nine TPKWs and three linear weirs (LW) to introduce and describe the general structure of the flow, stage–discharge relationship, and discharge coefficient under different geometrical and hydraulic conditions. The key findings from this study were as follows:
  • By examining the flow regimes on A-type TPKW, it was determined that the flow regime is clinging for h/P < 0.05, leaping for 0.05 < h/P< 0.1, springing for 0.1 < h/P < 0.2, transition flow for 0.2 < h/P < 0.35 and suppressed flow for 0.35 < h/P (h is upstream water head and P is the weir height).
  • At a given h/P ratio and weir length, an increase in the weir height decreased the discharge coefficient, although it was increased by increasing the weir length at a constant h/P and weir height.
  • The discharge coefficient has a declining trend by increasing the water head over the weir at the same constant weir height. At a constant h/P ratio, an increase in effective weir crest length increased the discharge coefficient, so that TPKW with an effective weir crest length of 1.5 m was greater than that of other lengths.
  • By increasing the Froude number and h/Le (h is the water head and Le is the effective weir crest length), the decreasing trend of the discharge coefficient is revealed. At a given Froude number, the discharge coefficient for TPKW with a higher effective weir crest length is greater than that of the other lengths.
Although this study was limited to PKWs with the plan shape of an A-type triangular PKW, the research focused on the flow behavior and hydraulic characteristics, including the stage–discharge relationship and discharge coefficient, with the approach of identifying parameters affecting them in free flow conditions and their comparison with the liner weir. Additional research comparing the hydraulic performance of different types of TPKW is recommended. This may include additional geometries such as TPKW weir types B, C, and D. Although separate laboratory studies were carried out for the B and D types of TPKW in studies by Alizadeh Sanami et al. [19] and Alizaded Sanami et al. [20]. In addition, more studies are also needed to examine how different TPKW design layouts affect energy dissipation. Future studies should consider TPKW design configurations as well as a broader range of laboratory-scale tests with the approach of examining the impact of the size-scale effect.

Author Contributions

Conceptualization, F.A.S. (Forough Alizadeh Sanami) and A.G.; methodology, F.A.S. (Forough Alizadeh Sanami); software, F.A.S. (Forough Alizadeh Sanami) and A.G.; validation, F.A.S. (Forough Alizadeh Sanami), A.G. and P.M.; formal analysis, F.A.S. (Forough Alizadeh Sanami), A.G. and P.M.; investigation, F.A.S. (Forough Alizadeh Sanami), A.G. and P.M.; resources, F.A.S. (Forough Alizadeh Sanami) and A.G.; data curation, F.A.S. (Forough Alizadeh Sanami), A.G. and P.M.; writing—original draft preparation, F.A.S. (Forough Alizadeh Sanami), A.G. and P.M.; writing—review and editing, F.A.S. (Forough Alizadeh Sanami), A.G., P.M. and S.D.F.; visualization, F.A.S. (Forough Alizadeh Sanami), A.G. and F.A.S. (Fardin Alizadeh Sanami); supervision, A.G. and S.D.F.; project administration, A.G. All authors have read and agreed to the published version of the manuscript.

Funding

This research received no external funding.

Institutional Review Board Statement

Not applicable.

Informed Consent Statement

Not applicable.

Data Availability Statement

Data are contained within the article.

Conflicts of Interest

The authors declare no conflict of interest.

References

  1. Machiels, O.; Erpicum, S.; Dewals, B.J.; Archambeau, P.; Pirotton, M. Experimental observation of flow characteristics over a Piano Key Weir. J. Hydraul. Res. 2011, 49, 359–366. [Google Scholar] [CrossRef]
  2. Anderson, R.M.; Tullis, B. Influence of Piano Key Weir geometry on discharge. In Labyrinth and Piano Key Weirs; CRC Press: Boca Raton, FL, USA, 2011; pp. 75–80. [Google Scholar]
  3. Anderson, R.M. Piano Key Weir Head Discharge Relationships; Utah State University: Logan, UT, USA, 2011. [Google Scholar]
  4. Leite Ribeiro, M.; Pfister, M.; Boillat, J.L.; Schleiss, A.; Laugier, F. Piano Key Weirs as efficient spillway structure. In Proceedings of the 24th Congress of CIGB–ICOLD, Kyoto, Japan, 2–8 June 2012; pp. 176–186. [Google Scholar]
  5. Sangsefidi, Y.; Tavakol-Davani, H.; Ghodsian, M.; Mehraein, M.; Zarei, R. Hydrodynamics and Free-Flow Characteristics of Piano Key Weirs with Different Plan Shapes. Water 2021, 13, 2108. [Google Scholar] [CrossRef]
  6. Bhukya, R.K.; Pandey, M.; Valyrakis, M.; Michalis, P. Discharge Estimation over Piano Key Weirs: A Review of Recent Developments. Water 2022, 14, 3029. [Google Scholar] [CrossRef]
  7. Anderson, R.M.; Tullis, B.P. Comparison of piano key and rectangular labyrinth weir hydraulics. J. Hydraul. Eng. 2012, 138, 358–361. [Google Scholar] [CrossRef]
  8. Kabiri-Samani, A.; Javaheri, A. Discharge coefficients for free and submerged flow over Piano Key weirs. J. Hydraul. Res. 2012, 50, 114–120. [Google Scholar] [CrossRef]
  9. Mehboudi, A.; Attari, J.; Hosseini, S.A. Experimental study of discharge coefficient for trapezoidal piano key weirs. Flow Meas. Instrum. 2016, 50, 65–72. [Google Scholar] [CrossRef]
  10. Norouzi, B. Experimental and Numerical Study on Hydraulics of the Piano key Weirs with Modified Keys. J. Dam Hydroelectr. Powerpl. 2018, 5, 36–47. [Google Scholar]
  11. Ghanbari, R.; Heidarnejad, M. Experimental and numerical analysis of flow hydraulics in triangular and rectangular piano key weirs. Water Sci. 2020, 34, 32–38. [Google Scholar] [CrossRef] [Green Version]
  12. Crookston, B.M.; Anderson, R.M.; Tullis, B.P. Free-flow discharge estimation method for Piano Key weir geometries. J. Hydro-Environ. Res. 2018, 19, 160–167. [Google Scholar] [CrossRef]
  13. Karimi, M.; Attari, J.; Saneie, M.; Jalili Ghazizadeh, M.R. Side weir flow characteristics: Comparison of piano key, labyrinth, and linear types. J. Hydraul. Eng. 2018, 144, 04018075. [Google Scholar] [CrossRef]
  14. Safarrazavi Zadeh, M.; Esmaeili Varaki, M.; Biabani, R. Experimental study on flow over sinusoidal and semicircular labyrinth weirs. ISH J. Hydraul. Eng. 2021, 27, 304–313. [Google Scholar] [CrossRef]
  15. Karimi, M.; Ghazizadeh, M.J.; Saneie, M.; Attari, J. Flow characteristics over asymmetric triangular labyrinth side weirs. Flow Meas. Instrum. 2019, 68, 101574. [Google Scholar] [CrossRef]
  16. Saghari, A.; Saneie, M.; Hosseini, K. Experimental study of one-and two-cycle trapezoidal piano-key side weirs in a curved channel. Water Supply 2019, 19, 1597–1603. [Google Scholar] [CrossRef] [Green Version]
  17. Guo, X.; Liu, Z.; Wang, T.; Fu, H.; Li, J.; Xia, Q.; Guo, Y. Discharge capacity evaluation and hydraulic design of a piano key weir. Water Supply 2019, 19, 871–878. [Google Scholar] [CrossRef]
  18. Kadia, S.; Pummer, E.; Kumar, B.; Rüther, N.; Ahmad, Z. A reformed empirical equation for the discharge coefficient of free-flowing type—A piano key weirs. J. Irrig. Drain. Eng. 2023, 149, 04023003. [Google Scholar] [CrossRef]
  19. Dabling, M.R.; Tullis, B.P. Piano Key Weir Submergence in Channel Applications. J. Hydraul. Eng. 2012, 138, 661–666. [Google Scholar] [CrossRef]
  20. Torre-Gómez, G.; Erpicum, S.; Pugliese, F.; Giugni, M. Hydraulic Behavior Assessment of Type A and Type B Piano Key Weirs from Experimental and Numerical Results. Environ. Sci. Proc. 2022, 21, 84. [Google Scholar]
  21. Alizadeh Sanami, F.; Saneie, M.; Afshar, M.H. Experimental Study of the Hydraulic Performance of D-Type Triangular Piano Key Weirs. Int. J. Civ. Eng. 2021, 19, 1209–1220. [Google Scholar] [CrossRef]
  22. Alizadeh Sanami, F.; Afshar, M.H.; Saneie, M. Experimental study on the discharge coefficient of triangular piano key weir. Irrig. Drain. 2022, 71, 333–348. [Google Scholar] [CrossRef]
  23. Bekheet, A.A.; AboulAtta, N.M.; Saad, N.Y.; El-Molla, D.A. Effect of the shape and type of piano key weirs on the flow efficiency. Ain Shams Eng. J. 2022, 13, 101620. [Google Scholar] [CrossRef]
  24. Ghaderi, A.; Daneshfaraz, R.; Abbasi, S.; Abraham, J. Numerical analysis of the hydraulic characteristics of modified labyrinth weirs. Int. J. Energy Water Resour. 2020, 4, 425–436. [Google Scholar] [CrossRef]
  25. Ghaderi, A.; Daneshfaraz, R.; Dasineh, M.; Di Francesco, S. Energy dissipation and hydraulics of flow over trapezoidal–triangular labyrinth weirs. Water 2020, 12, 1992. [Google Scholar] [CrossRef]
  26. Pfister, M.; Battisacco, E.; De Cesare, G.; Schleiss, A.J. Scale effects related to the rating curve of cylindrically crested Piano Key weirs. In Labyrinth and Piano Key Weirs II; CRC Press: Boca Raton, FL, USA, 2013; p. 73. [Google Scholar]
  27. Daneshfaraz, R.; Bagherzadeh, M.; Ghaderi, A.; Di Francesco, S.; Asl, M.M. Experimental investigation of gabion inclined drops as a sustainable solution for hydraulic energy loss. Ain Shams Eng. J. 2021, 12, 3451–3459. [Google Scholar] [CrossRef]
  28. Erpicum, S.; Tullis, B.P.; Lodomez, M.; Archambeau, P.; Dewals, B.J.; Pirotton, M. Scale effects in physical piano key weirs models. J. Hydraul. Res. 2016, 54, 692–698. [Google Scholar] [CrossRef] [Green Version]
  29. Daneshfaraz, R.; Ghaderi, A.; Abraham, J.; Torabi, M. Effect of different channels on discharge coefficient of labyrinth weirs. Tek. Dergi 2020, 32, 11081–11096. [Google Scholar] [CrossRef] [Green Version]
  30. Daneshfaraz, R.; Aminvash, E.; Bagherzadeh, M.; Ghaderi, A.; Kuriqi, A.; Najibi, A.; Ricardo, A.M. Laboratory investigation of hydraulic parameters on inclined drop equipped with fishway elements. Symmetry 2021, 13, 1643. [Google Scholar] [CrossRef]
  31. Johnson, M.C. Discharge coefficient analysis for flat-topped and sharp-crested weirs. Irrig. Sci. 2000, 19, 133–137. [Google Scholar] [CrossRef]
  32. Falvey, H.T. Hydraulic Design of Labyrinth Weirs; ASCE Press (American Society of Civil Engineers): Reston, VA, USA, 2003. [Google Scholar]
  33. Crookston, B.M.; Tullis, B.P. Arced labyrinth weirs. J. Hydraul. Eng. 2012, 138, 555–562. [Google Scholar] [CrossRef]
  34. Machiels, O.; Erpicum, S.; Archambeau, P.; Dewals, B.; Pirotton, M. Large scale experimental study of piano key weirs. In Proceedings of the 33rd IAHR Congress 2009, Vancouver, BC, Canada, 9–14 August 2009. [Google Scholar]
  35. Oertel, M. Discharge coefficients of piano key weirs from experimental and numerical models. In Proceedings of the 36th IAHR World Congress, Hague, The Netherlands, 28 June–3 July 2015. [Google Scholar]
  36. Turkyilmazoglu, M. Accelerating the convergence of Adomian decomposition method (ADM). J. Comput. Sci. 2019, 31, 54–59. [Google Scholar] [CrossRef]
Figure 1. Types of PKW (A, B, C, and D) [6].
Water 15 02124 g001
Figure 2. Scheme of geometric parameters of PKW; (a) plan view; (b) section view A-A [5].
Water 15 02124 g002
Figure 3. Descriptive scheme of laboratory flume.
Water 15 02124 g003
Figure 4. Geometric overview of A-Type TPKW; (a): P = 0.15 m, B = 0.25 m, and (b): P = 0.07 m, B = 0.15 m.
Water 15 02124 g004
Figure 5. Flow over the A-type TPKW; (a) TPKW (P = 0.07 m; B = 0.15 m and h/P = 0.15); (b) TPKW (P = 0.07 m; B = 0.2 m and h/P = 0.25); (c) TPKW (P = 0.1 m; B = 0.2 m and h/P = 0.36); (d) TPKW (P = 0.1 m; B = 0.25 m and h/P = 0.4); (e) (P = 0.1 m; B = 0.25 m and h/P = 0.4).
Water 15 02124 g005
Figure 6. Stage–discharge curves and discharge variation against water depth over TPKW. (a): P = 0.07 m; (b): P = 0.10 m and (c): P = 0.15 m.
Water 15 02124 g006aWater 15 02124 g006b
Figure 7. Variation of discharge coefficient (Cd) with h/P for each TPKW. (a): P = 0.07 m; (b): P = 0.10 m and (c): P = 0.15 m.
Water 15 02124 g007aWater 15 02124 g007b
Figure 8. Cd versus h/P at different weir heights.
Water 15 02124 g008
Figure 9. Variation in h/Le against discharge coefficient for different heights and lengths. (a): Le = 1.5 m; (b): Le = 1.2 m and (c): Le = 0.9 m.
Water 15 02124 g009
Figure 10. Cd versus Froude number at different heights and lengths weir. (a): P = 0.07 m; (b): P = 0.10 m and (c): P = 0.15 m.
Water 15 02124 g010
Figure 11. Cd versus Fr at different weir heights.
Water 15 02124 g011
Figure 12. Comparing the results of observed and computational discharge coefficients for A-type TPKW.
Water 15 02124 g012
Figure 13. Variations of percent error of Cd from Equation (12) versus h/Le values after performing sensitivity analysis.
Water 15 02124 g013
Table 1. Test A-Type TPKWs geometric dimensions.
ModelA-Type TPKWLW
M1M2M3M4M5M6M7M8M9M10M11M12
P (m)0.070.070.070.10.10.10.150.150.150.070.10.15
Wi (m)0.150.150.150.150.150.150.150.150.15---
Wo (m)0.150.150.150.150.150.150.150.150.15---
W (m)0.60.60.60.60.60.60.60.60.60.60.60.6
B (m)0.150.20.250.150.20.250.150.20.25---
Bb (m)0.0750.10.1250.0750.10.1250.0750.10.125
Bi, Bo (m)0.03750.050.06250.03750.050.06250.03750.050.0625---
Le (m)0.91.21.50.91.21.50.91.21.50.60.60.6
Table 2. The range of hydraulic parameters in the present study.
Water Head over the Weir, h (m)Upstream Water Depth, Hup (m)Downstream Depth, Hdown (m) Froude Number, FrReynolds Number, ReFlow Discharge, Q (m3/s)
0.035–0.090.105–0.230.009–0.070.04–0.3879,946–690,0000.003–0.045
Table 3. Flow regime over the PKW.
FlowReferenceFlow Condition
NappePresent study (A-type TPKW)
[1]
[8]
[9]
[13]
h/P < 0.2
h/P < 0.18
h/P < 0.15
h/P < 0.18
h/P < 0.2
TransitionPresent study (A-type TPKW)
[8]
[9]
[13]
0.2 < h/P < 0.35
0.15 < h/P < 0.2
0.18 < h/P < 0.35
0.2 < h/P < 0.3
SuppressedPresent study (A-type TPKW)
[8]
[9]
[13]
h/P > 0.35
h/P > 0.2
h/P > 0.35
h/P > 0.3
Table 4. Comparative table between the discharge coefficient ranges in the literature.
ReferenceTest RangeChannel Dimensions
Height (m)Width (m)Length (m)Q (m3/s)B/PWi/WoBi, Bo (m)Cd
[29]7.21.21.20.31.210.1840.4–0.8
[30]9.90.80.80.005- 0.11.171.250.1290.33–0.62
[14]4.50.810.005–0.0532–41.50.1010.2–0.57
Present study110.60.80.003–0.0451.6–3.7510.037–0.0620.76–2
Table 5. Sensitivity analysis.
VariableQuantitative SensitivityQualitative Sensitivity
h/P−1.10Medium
h/Le−8.28High
Le/W0.03Low
Fr4.55High
P/Le5.59High
P/Wu−0.79Medium
P/B0.07Low
Disclaimer/Publisher’s Note: The statements, opinions and data contained in all publications are solely those of the individual author(s) and contributor(s) and not of MDPI and/or the editor(s). MDPI and/or the editor(s) disclaim responsibility for any injury to people or property resulting from any ideas, methods, instructions or products referred to in the content.

