Article

Effect of Time and Temperature on SARS-CoV-2 in Municipal Wastewater Conveyance Systems

by
Melissa K. Schussman
1,2 and
Sandra L. McLellan
1,*
1
School of Freshwater Sciences, University of Wisconsin-Milwaukee, Milwaukee, WI 53204, USA
2
Department of Civil and Environmental Engineering, University of Wisconsin-Milwaukee, Milwaukee, WI 53211, USA
*
Author to whom correspondence should be addressed.
Water 2022, 14(9), 1373; https://doi.org/10.3390/w14091373
Submission received: 11 March 2022 / Revised: 12 April 2022 / Accepted: 19 April 2022 / Published: 23 April 2022
(This article belongs to the Special Issue SARS-CoV-2 in Wastewater: Methods, Epidemiology and Future Goals)

Abstract

:
Wastewater surveillance for SARS-CoV-2 is becoming a widespread public health metric, but little is known about pre-analytical influences on these measurements. We examined SARS-CoV-2 loads from two sewer service areas with different travel times that were within the same metropolitan area. Throughout the one-year study, case rates were nearly identical between the two service areas allowing us to compare differences in empirical concentrations relative to conveyance system characteristics and wastewater treatment plant parameters. We found time did not have a significant effect on degradation of SARS-CoV-2 when using average transit times (22 vs. 7.5 h) (p = 0.08), or under low flow conditions when transit times are greater (p = 0.14). Flow increased rather than decreased SARS-CoV-2 case-adjusted concentrations, but this increase was only significant in one service area. Warmer temperatures (16.8–19.8 °C) compared with colder (8.4–12.3 °C) reduced SARS-CoV-2 case-adjusted loads by ~50% in both plants (p < 0.05). Decreased concentrations in warmer temperatures may be an important factor to consider when comparing seasonal dynamics. Oxygen demand and suspended solids had no significant effect on SARS-CoV-2 case-adjusted loads overall. Understanding wastewater conveyance system influences prior to sample collection will improve comparisons of regional or national data for SARS-CoV-2 community infections.

1. Introduction

SARS-CoV-2 wastewater surveillance has proven to be a cost-effective, non-invasive, and comprehensive tool for estimating changes in community COVID-19 burdens [1,2,3,4,5,6,7,8]. Nationwide efforts to establish a coordinated approach to wastewater surveillance are underway; however, empirical values for SARS-CoV-2 RNA measurements vary significantly across the country, state lines, or even laboratories due to differences in equipment, resources, methodology, and evaluation of data [9,10]. The National Wastewater Surveillance System (NWSS) is envisioned to ultimately cover all 50 states within the US, encompassing many different types of wastewater systems [11]. Multiple analytical methods are being employed to quantify SARS-CoV-2 RNA, with differences in recovery and efficiency in detecting the viral signal encompassing more than an order of magnitude [12]. As this program expands, interpretations of empirical data across different systems can be more feasible if we understand the magnitude of influence of sewer system parameters compared with post-sampling analytical differences.
The goals of this study were to obtain an accurate residence time of two sewer networks to examine travel time effects on decay and to determine how wastewater parameters may affect SARS-CoV-2 RNA concentrations entering wastewater treatment plants (WWTPs). Because SARS-CoV-2 is an enveloped positive-sense single-stranded RNA virus [13] its outer lipid layer may render it more sensitive than other viruses to temperature, organic solvents, and other constituents encountered in the wastewater treatment cycle [10]. High-priority research opportunities cited by the Water Research Foundation include furthering our understanding of the effect of wastewater pretreatment on genetic signal, and dilution or persistence of the genetic signal in the sewer collection system [14]. Specific parameters in the sewer collection system that have a known influence on viral RNA and are assumed to have an impact on SARS-CoV-2 detection in wastewater, include pH, temperature, organic matter, solids content, residence time in the sewer, sampling, and microbial antagonism [15,16,17]. While various studies have performed analysis on the decay of SARS-CoV-2 RNA in wastewater influent in a laboratory setting, they are often performed with surrogate enveloped virus spikes [15,18,19,20,21,22] which have been shown to behave differently than authentic in situ SARS-CoV-2 found within the wastewater matrix [23,24]. A major barrier to performing in situ studies and comparing real wastewater systems is that the true input of SARS-CoV-2 virus from the population is unknown and likely different for individuals depending on the severity of disease, stage of infection, and other factors [25].
This study utilized two wastewater service areas, one surrounded by a second larger one, that serve a single large metropolitan area. The similar case rates and close geographic proximity allowed us to analyze how various parameters can affect SARS-CoV-2 concentration during the residence time within each sewer network. In this study, the approximate travel time at different flow rates (average, maximum, and minimum) for two service areas were determined. Once we established the different travel times of the two conveyance systems, we assessed the loss of SARS-CoV-2 signal associated with the longer travel times. We also examined the effect of flow rate, temperature, BOD, and TSS on SARS-CoV-2 (N1 and N2 targets) in both WWTPs. Additionally, to gain insight into dilution effects, we analyzed the flow rate, and human fecal (PMMoV) concentration. It was determined that within typical residence times (up to 100 h) of SARS-CoV-2 within the wastewater conveyance system, temperature was the only parameter that had a significant influence on SARS-CoV-2 concentrations.

2. Materials and Methods

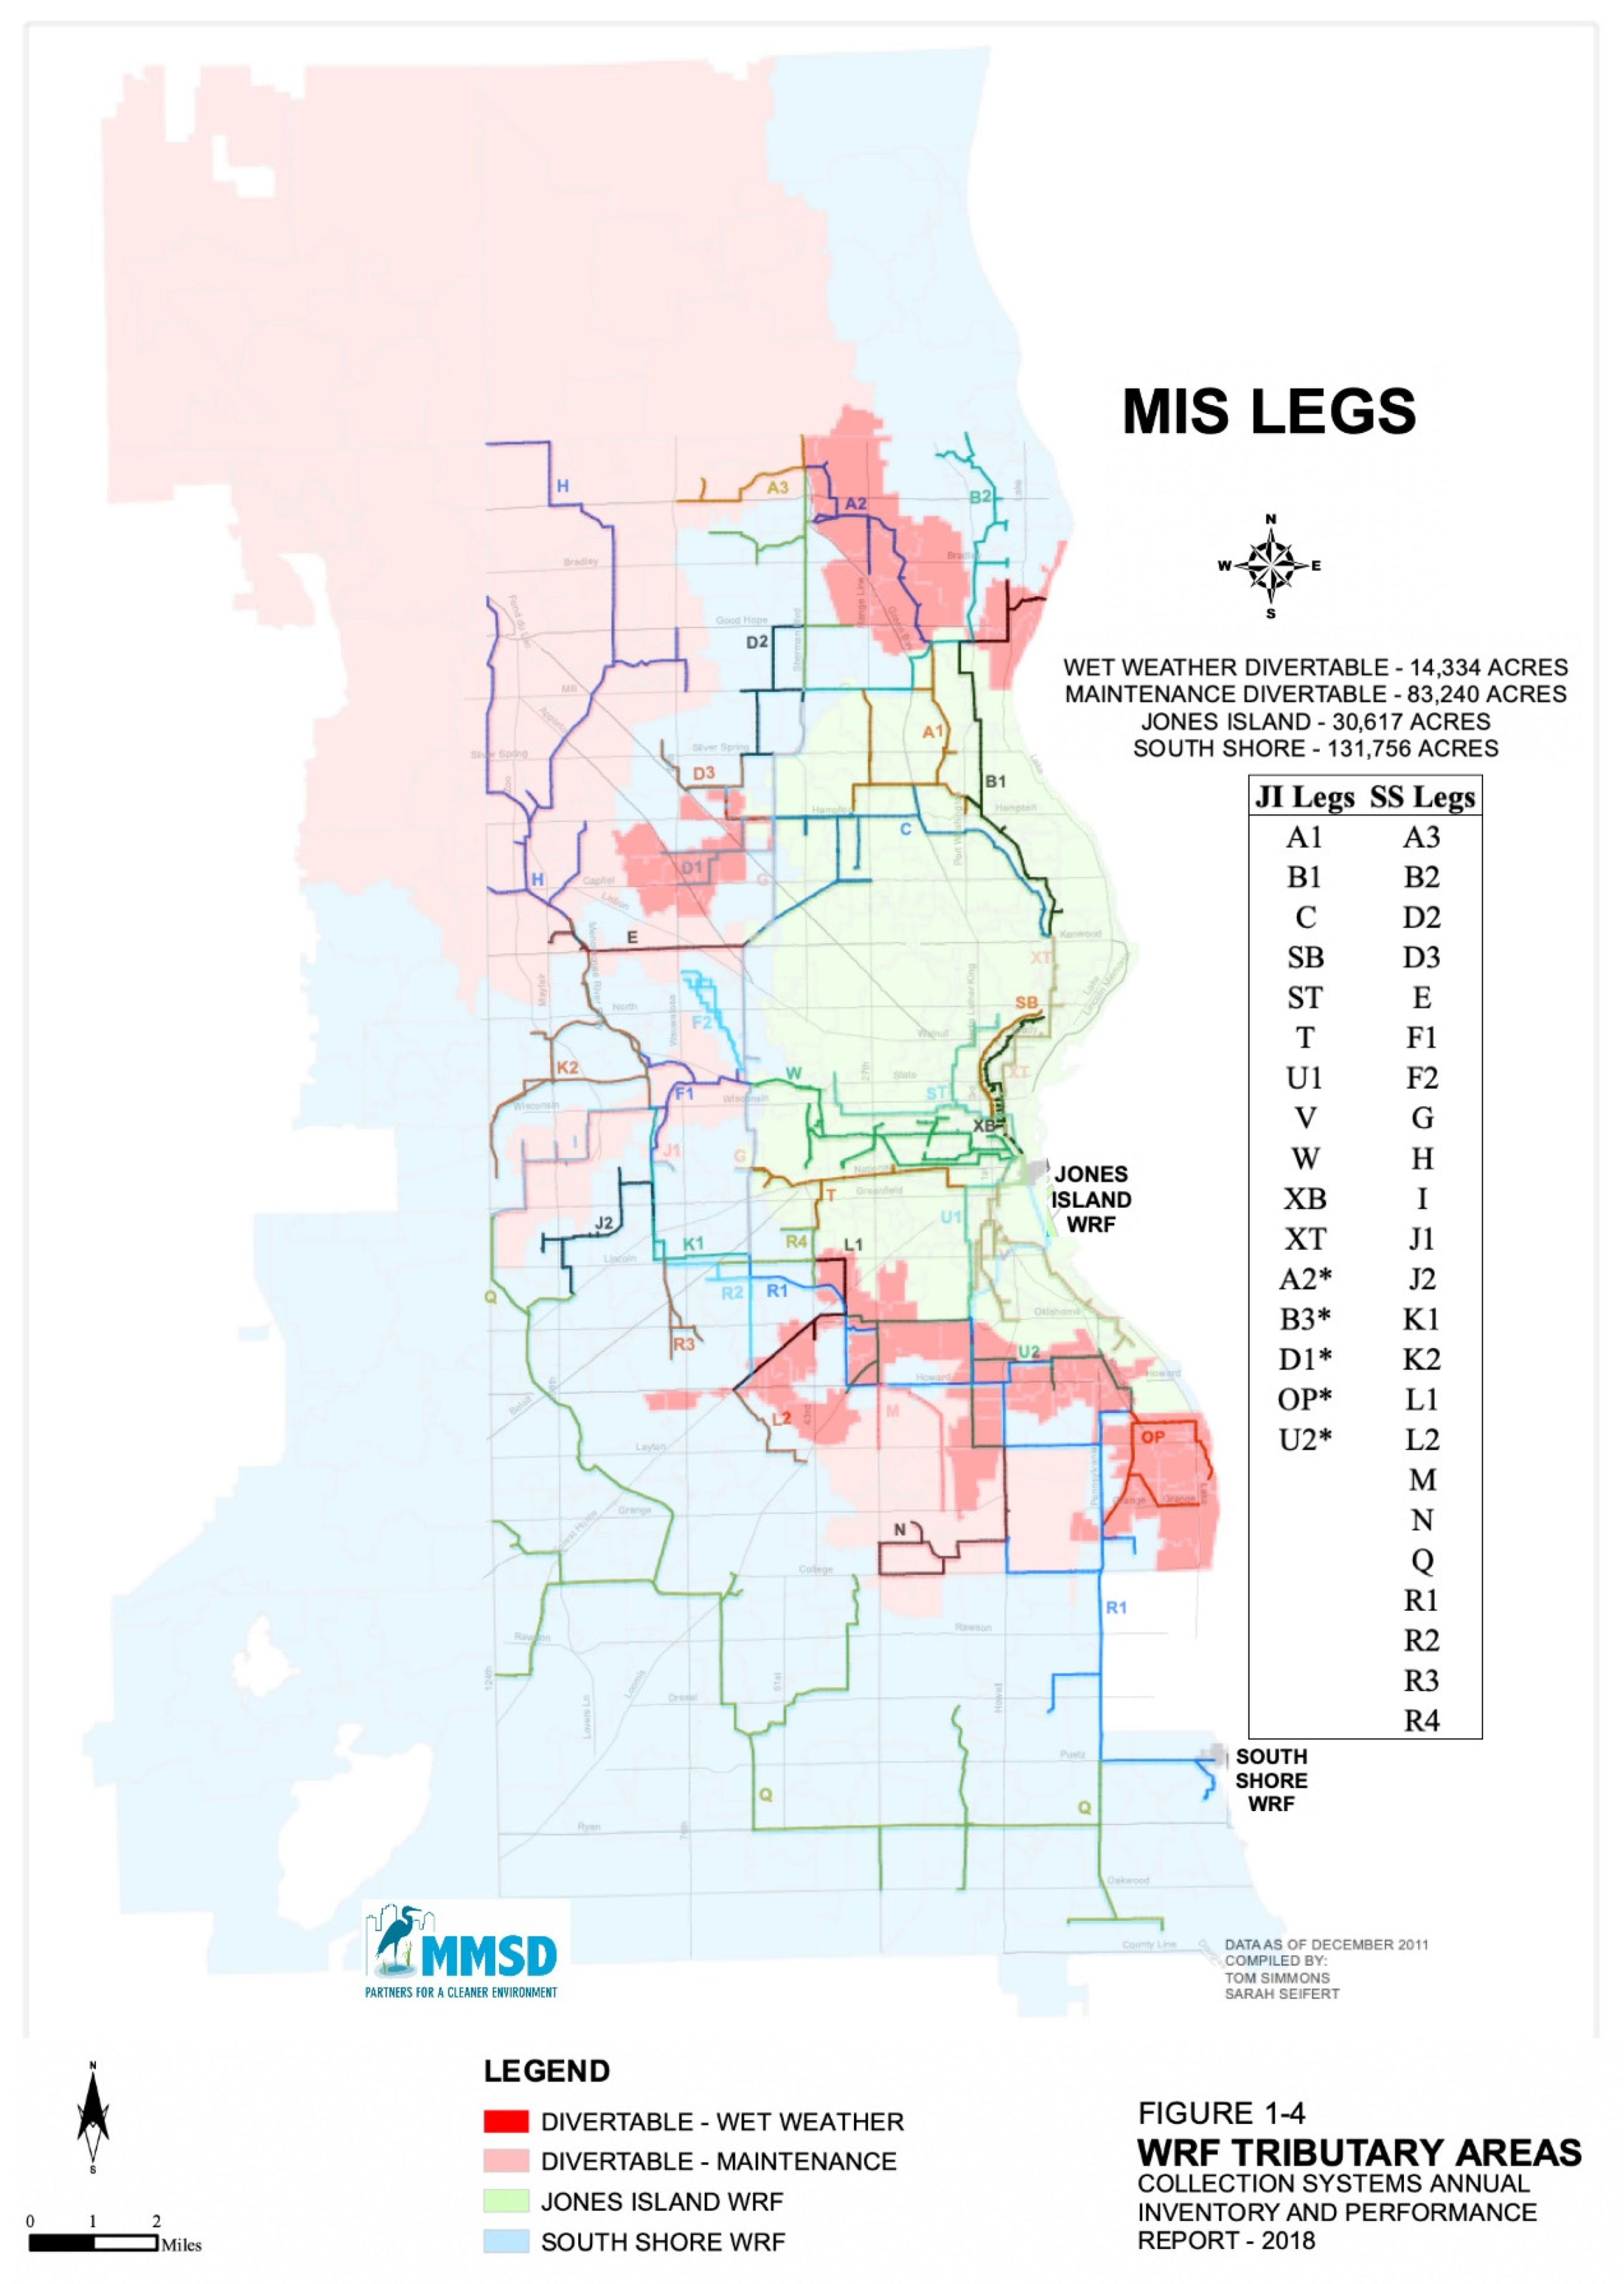
2.1. Study Area and Engineered Parameters

The Milwaukee Metropolitan Sewage District (MMSD) is comprised of two separate WWTPs: Jones Island Water Reclamation Facility (JI) which serves a population of 470,007 residents; and South Shore Water Reclamation Facility (SS) which serves a population of 615,934 residents in Milwaukee County, Wisconsin, USA (Figure 1). A portion of JI services (37%) a combined sewer system, meaning that industrial, urban, residential, and environmental run-off all contribute unique factors to the wastewater matrix. SS serves a much larger area, and its sewer network is better equipped for larger flows (average pipe diameter SS = 43.6 in, average divertible pipe diameter from JI = 32.8 in). Under high flow conditions, 47% of JI sewers can be diverted to SS (Figure 1) to avoid sewer backups. This diversion occurs rarely and only increases the SS sewer network by 11%. Overall, the SS conveyance system is comprised of a larger surface area and has longer travel times.

2.2. Sampling

Our analysis included a total of 186 samples that were collected biweekly between 26 August 2020, and 22 August 2021, from JI and SS WWTPs. Flow-weighted composite samples were collected twice per week over a 24 h period according to the plant standard collection procedures and were stored at 4 °C prior to in-person collection from the WWTP. Upon arrival at the laboratory, samples were stored at 4 °C before processing within 24 h. Influent chemical and physical measurements were taken by WWTP operators employing their routine procedures. The average parameter values confirmed that both conveyance systems had similar conditions except for BOD (Table 1).

2.3. Wastewater Sample Processing and RNA Extraction

A volume of 25 mL of each well-mixed influent wastewater sample was spiked with 250 μL magnesium chloride solution (25 mM) to enhance viral amplification, and approximately 100,000 copies/μL of BCoV to act as an internal control for RNA recovery. The sample was filtered on an HA filter (MF-Millipore, Carrigtwohill, Ireland) and stored at −80 °C for a minimum of 2 h prior to viral RNA extraction to help complete lysis and improve RNA yield [26]. The samples were removed from the −80 °C, spiked with 6.5 μL of β- mercaptoethanol to denature RNAses (Sigma-Aldrich, St. Louis, MO, USA), and allowed to thaw on ice. Once thawed, the samples were bead-beat, and RNA extracted using a PowerMicrobiome kit following the manufacturer’s instructions (Qiagen, Hilden, Germany). For more detailed information on the sample filtration and extraction processes, see the protocols.io: https://www.protocols.io/researchers/m4ule122t1s4ule1/protocols (accessed on 10 March 2022).

2.4. ddPCR Analyses

The CDC’s 2019-nCoV Real-Time RT-PCR primers and probes were used in ddPCR to quantify the RNA of the N1 and N2 regions SARS-CoV-2 on a twice per week basis [27]. The primers and probe sequences are shown in Table S1 [27,28,29,30]. All ddPCR assays were performed in 22 μL reaction mixtures using the one-step RT-ddPCR Advanced Kit for Probes (Bio-Rad, Hercules, CA, USA). The ddPCR assays were amplified using the Mastercycler pro (Eppendorf, Hamburg, Germany) and were read using the Bio-Rad QX200 Droplet Digital System. The limit of detection (LOD) and limit of quantification (LOQ) thresholds and other quality control parameters are described in Section 2.7. Raw droplet amplification data were extracted from the Bio-Rad QuantaSoft Analysis software and processed using R package twoddpcr (version 1.11.0). See Feng et. al. for detailed description ddPCR analysis [3].

2.5. Fecal Markers and Quality Control

The fecal strength of untreated wastewater was determined by quantifying the human marker, PMMoV, in each sample [28]. A 1:10 dilution of each sample was made, and the assay was performed according to the one-step ddPCR procedure as described in Section 2.4. Inhibition effects due to the wastewater sample matrix on ddPCR amplifications of SARS-CoV-2 were determined using a known amount of Bovine Respiratory Syncytial Virus (BRSV) added to the sample matrix and BCoV was quantified to assess RNA recovery according to previously published methods [3]. No inhibition was observed for any sample tested (Supplemental Data Set S1). Two no template controls (NTCs) using nuclease-free water were run for each assay. For the N1/N2 duplex assay, an additional positive control using a 1:8 diluted Exact Diagnostics SARS-CoV-2 standard (Bio-Rad) in duplicate was included in each run. All assays were confirmed to have two standards within an acceptable range of 100 droplets, and two NTCs below the LOD. The limit of detection (LOD) and the limit of quantification (LOQ) were determined for the N1 and N2 assays (LOD ≈ 13,299, LOQ ≈ 40,007 copies per case). All samples used for this analysis were above the LOD. See Feng et. al. for detailed description of limits of blank, detection, and quantification [3].

2.6. Travel Time Calculation

The MMSD sewer system is a complex network composed of 39 separate legs of large pipes comprising a municipal interceptor system that eventually flow to either JI or SS WWTP. Each leg was assigned a different letter or letter combination (Figure 1). The approximate minimum, maximum, and average travel times were calculated for both JI and SS using Equation (1).
T h = ( L / B ) V .
where the travel time in hours ( T h ) is equal to the total leg length in meters (L), divided by the number of branches within a leg that lead to the same outfall (B), divided by the metered velocity in meters per second (V), which was measured hourly. A total of 56.5% of the velocity values fell below the average and 43.5% above the average.
MMSD provided hourly velocity data captured from meters throughout 33 of the 39 legs, excluding B1, R4, ST, U1, XB, and XT, for the entire timeline of our sample collection. Additional information used to complete the calculation included the location of each meter within the treatment system, the length, diameter, and slope of each pipe, the inlet and outlet pipes of each leg, and the direction of flow. Velocity from four representative subsewersheds in SS and three representative subsewersheds in JI are displayed in Figure 2.
Various instances of negative velocity values were collected at each meter, which indicates the sensor was not measuring accurately at that time. This can result from a variety of issues including fouling, debris, equipment failure, poor flow conditions, or levels below necessary minimums. For this analysis, all negative values were removed from the data set. Using only the positive values from the 13,128 hourly readings for each meter between 1 January 2020 and 1 July 2021, the minimum, maximum, and average velocities were calculated in R-Studio for each metered section. For the six legs mentioned above in which were not metered, approximate velocity values were estimated using an average of the most similar pipes according to slope, length, diameter, and location (Table S2).
To simulate high flow travel times, the maximum velocity for each leg was used to determine the travel time of that leg, then all legs leading to each specific WWTP were summed. To simulate low flow travel times, the minimum positive velocity for each leg was used to determine the travel time of that leg, then all legs leading to each specific WWTP were summed. For the average travel time estimate, the arithmetic average velocity for each meter was used. While the sewer system is designed to divert an additional 10% of acreage to SS under severe high flow-weather conditions, diversions were not considered because they are rare events. Further, flows to each respective WWTP during diversions only minimally affects travel times (Table S3).

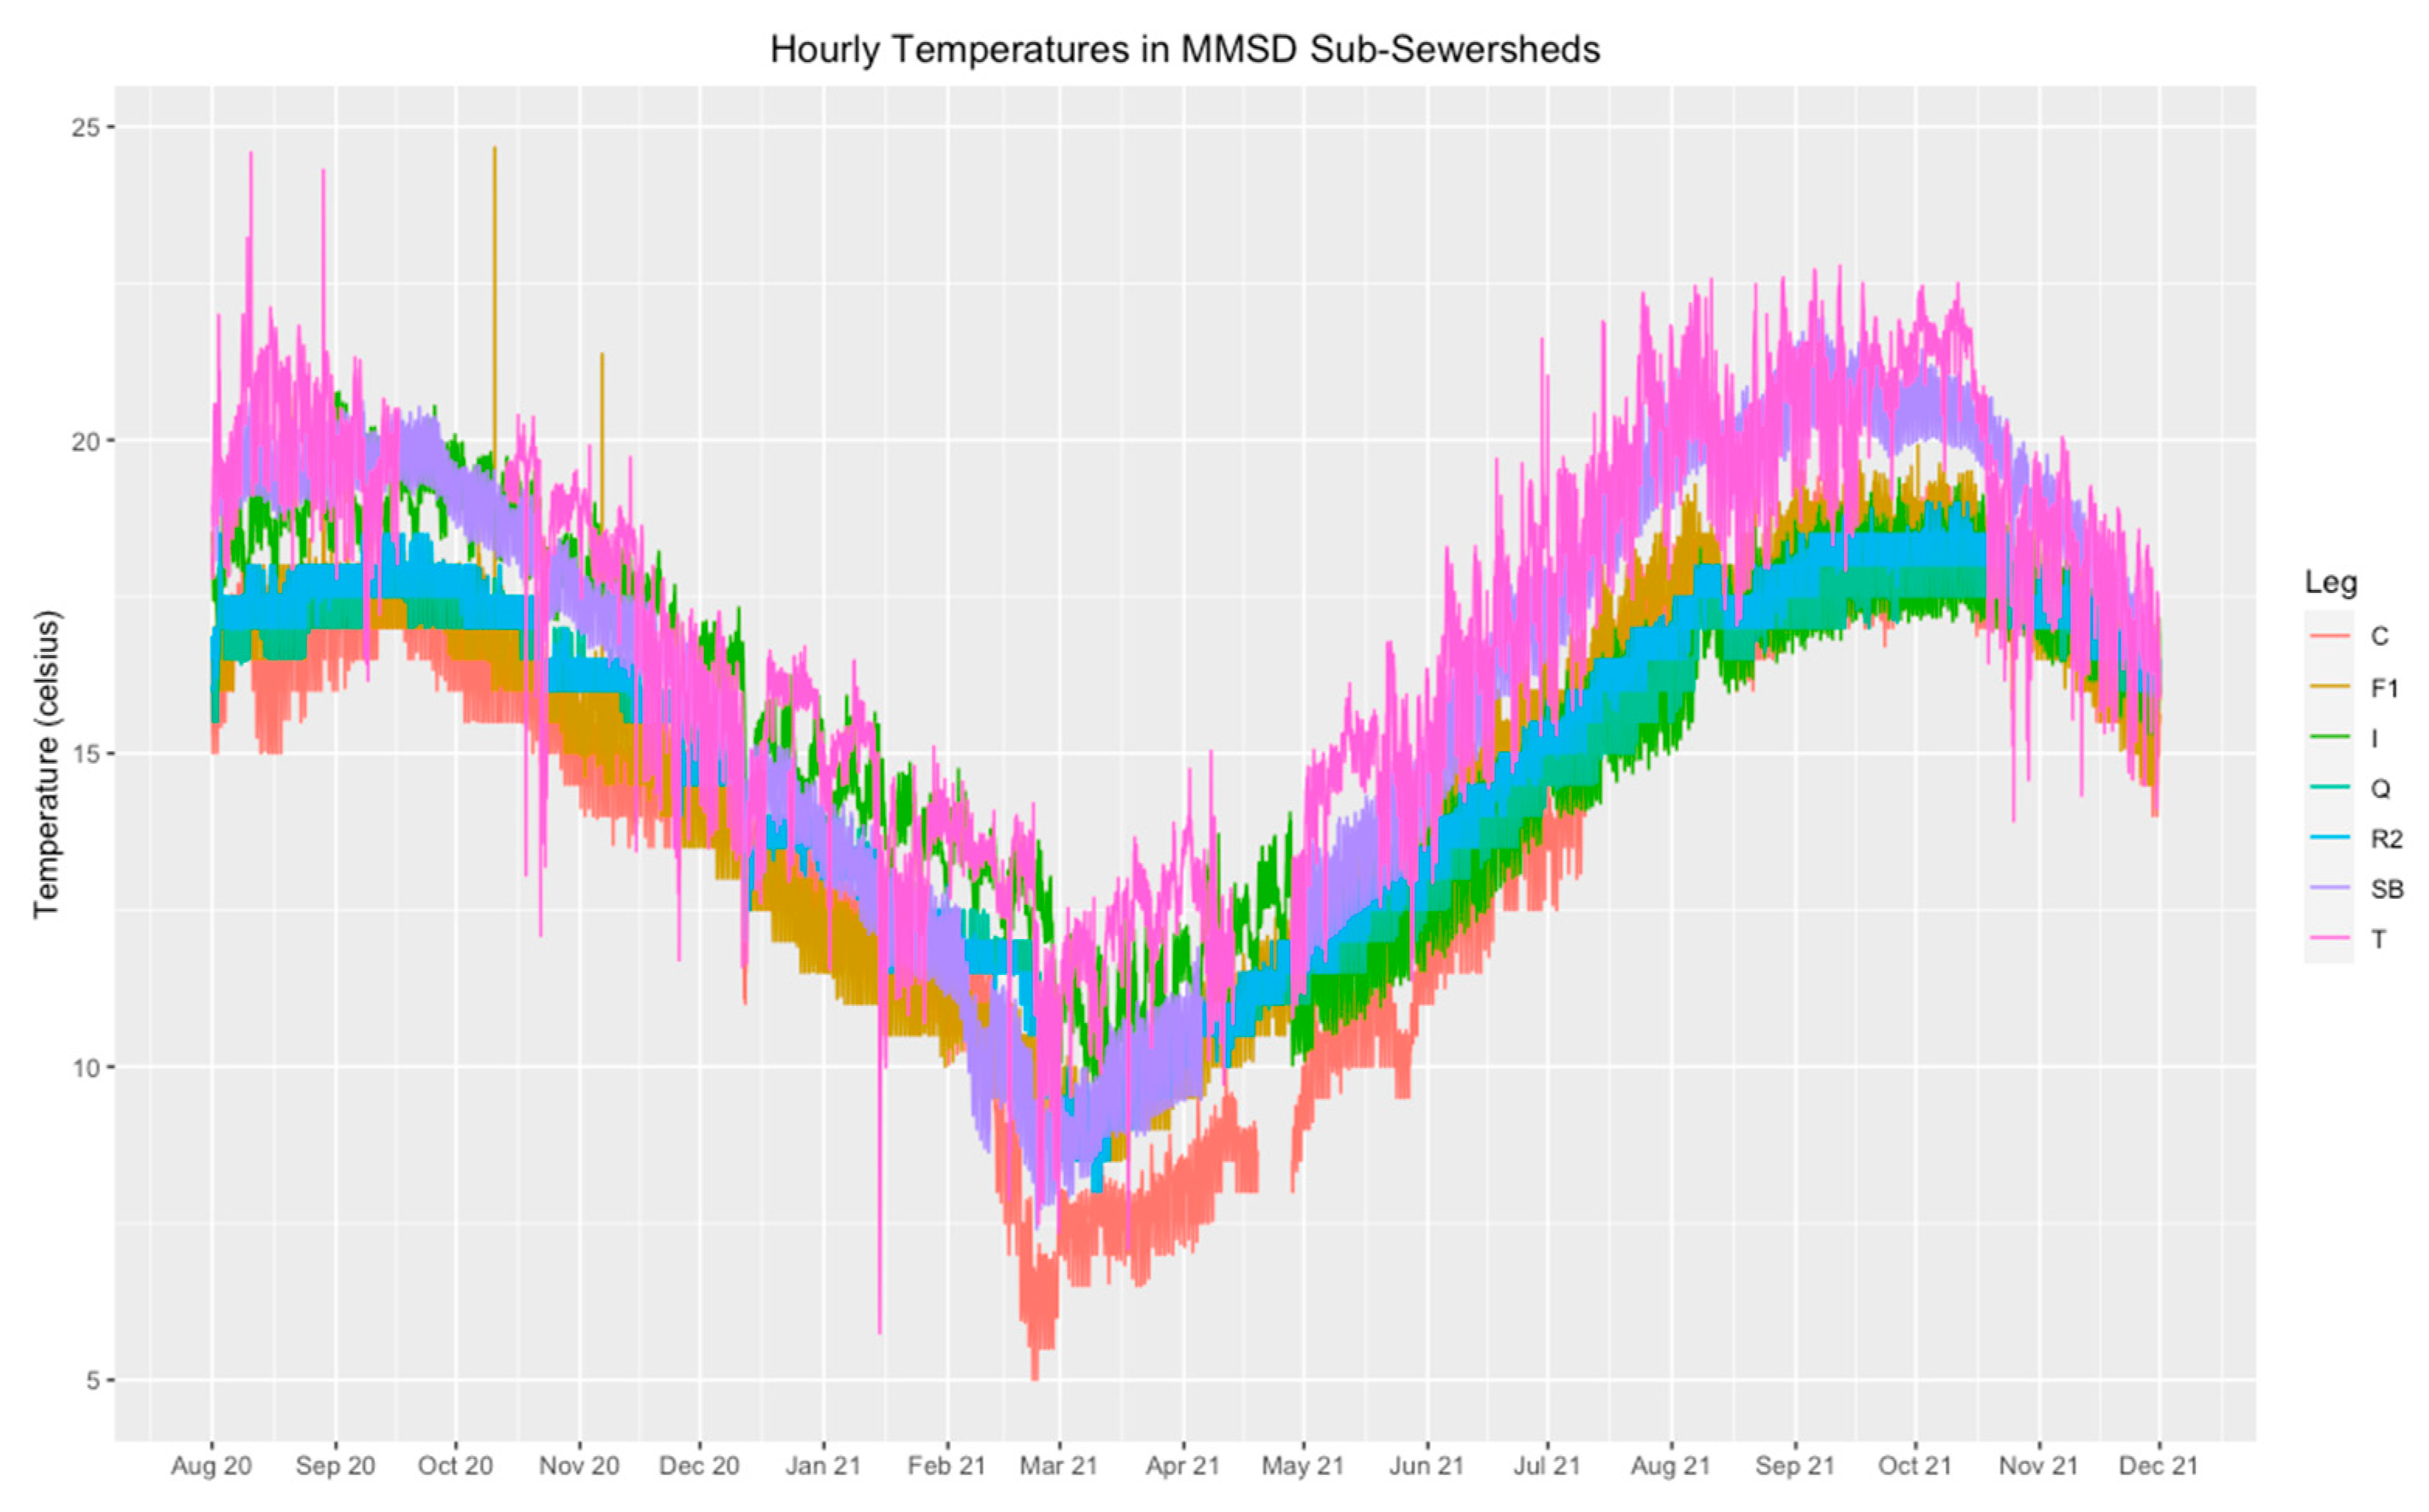
2.7. Temperature Analysis

The temperature analysis was performed using hourly metered temperature data from four representative subsewersheds in SS and three representative subsewersheds in JI provided by MMSD (Figure 3). The daily temperature was calculated for each sample collection data using the arithmetic average temperature for each meter. Then, the arithmetic average of all four SS and all three JI values were calculated to apply to the data set. Over the course of the year, the lowest recorded temperature was 6.05 °C and the warmest was 21.73 °C. To compare how much of an effect temperature had on SARS-CoV-2 case-adjusted concentration, data from the warmest (August, September, October), and coldest (February, March, April) months were compared.

2.8. Time and Temperature Analysis

After determining JI has a shorter travel time than SS depending on flow conditions, we hypothesized that SARS-CoV-2 copies per diagnosed case should be equal for the two service areas if travel time did not affect measured concentrations. We assumed that the amount of case under-reporting would be similar for the two populations. We confirmed that the case rate was equal in both sewersheds (paired t-test, p = 0.81), supporting our assumption. The difference in copies per case reflects the influences of the conveyance system environment such as effects of temperature, or decay during longer travel time.
To normalize between JI and SS service areas, quantified ddPCR SARS-CoV-2 RNA concentrations were expressed as copies per case per day ( C p ) using the Equation (2)
C p = ( C × Q ) R .
where C is SARS-CoV-2 RNA copies (in millions) per liter of wastewater, Q is the flow of the sewershed (in million liters per day), and R is the number of reported clinical cases (day of collection) on the day of wastewater sampling. All clinical data were obtained from the Office of Health Informatics and the Bureau of Information Technology Services at the Wisconsin Department of Health Services (DHS) and were reported as the date of sample collection. The date of the clinical sample result from each WWTP service area can be downloaded from https://www.dhs.wisconsin.gov/covid-19/wastewater.htm#wastewater (accessed on 10 March 2022). When determining how flow diluted the signal, flow was removed from this equation, resulting in SARS-CoV-2 concentration ( C f ) being calculated using Equation (3).
C f = ( C ) R .

2.9. Statistical Analysis

Statistics were computed using R programing language (version 4.0.3 GUI 1.73). Nonparametric Kendall’s tau was used to test hypotheses regarding correlations between variables and SARS-CoV-2 copies per case, and t-tests were used to test hypotheses regarding relationships and trends with the data. Comparing two interrelated WWTPs; one with a long travel time (up to 109 h), and one with a short travel time (as low as 4 h), we used a paired t-test to determine if time impacts SARS-CoV-2 copies per case within the wastewater treatment system.
Welch’s t-test was used to analyze how each parameter (temperature flow, BOD, TSS) impacts SARS-CoV-2 copies per case. We further examined the temperature data for significant outliers using a one-way analysis of variance (ANOVA), and post hoc Tukey Honestly Significant Difference (HSD) analysis in R-Studio to compare each month within the warm (August, September, October) versus cold months (February, March, April) data sets (Figure 3). We further analyzed how much flow can dilute the fecal matter in the wastewater using Kendall’s rank coefficient to compare PMMoV and the average daily flow rate.

3. Results

3.1. Travel Time Determinations and Influences on SARS-CoV-2 Decay

The average travel time for SS was approximately three times longer than JI (Table 2), and the ratio scaled similarly when comparing high and low flow conditions. Using the maximum velocity to simulate high flow conditions, SS transit was approximately 2.5 times longer than JI. Moreover, when using the minimum velocity to simulate low flow conditions, the difference in travel time rose to four times longer. The simulated low flow travel times (using the minimum velocity) within a WWTP lengthen the average residence time in the sewer network up to 12 times longer than high flow conditions simulated with maximum velocity.
In general, travel time had little effect on SARS-CoV-2 concentrations entering the WWTP. An increase from approximately 8 to 22 h only resulted in a 10% decrease in average copies per case when comparing JI and SS travel times. While there was not a significant difference in the SARS-CoV-2 copies per case detected from the WWTPs, there was a trend shifting towards significance (paired t-test, t = 1.741, p = 0.08) indicating that there is minimal difference in decay within the first ~24 h of travel time. We further examined the difference in the SARS-CoV-2 copies per case (i.e., case-adjusted loads) under high flow and low flow conditions (Figure 4). We expected under high flow conditions, there would be no difference in copies per case between the WWTPs since travel time differs by only ~6 h, which was confirmed by our analysis (Figure 4). When simulating low flow conditions by considering minimum flow in all legs, there is up to an 80 h difference in travel time; however, we also did not observe a difference in JI vs. SS case-adjusted loads, suggesting that the SARS-CoV-2 signal is not affected by travel time.

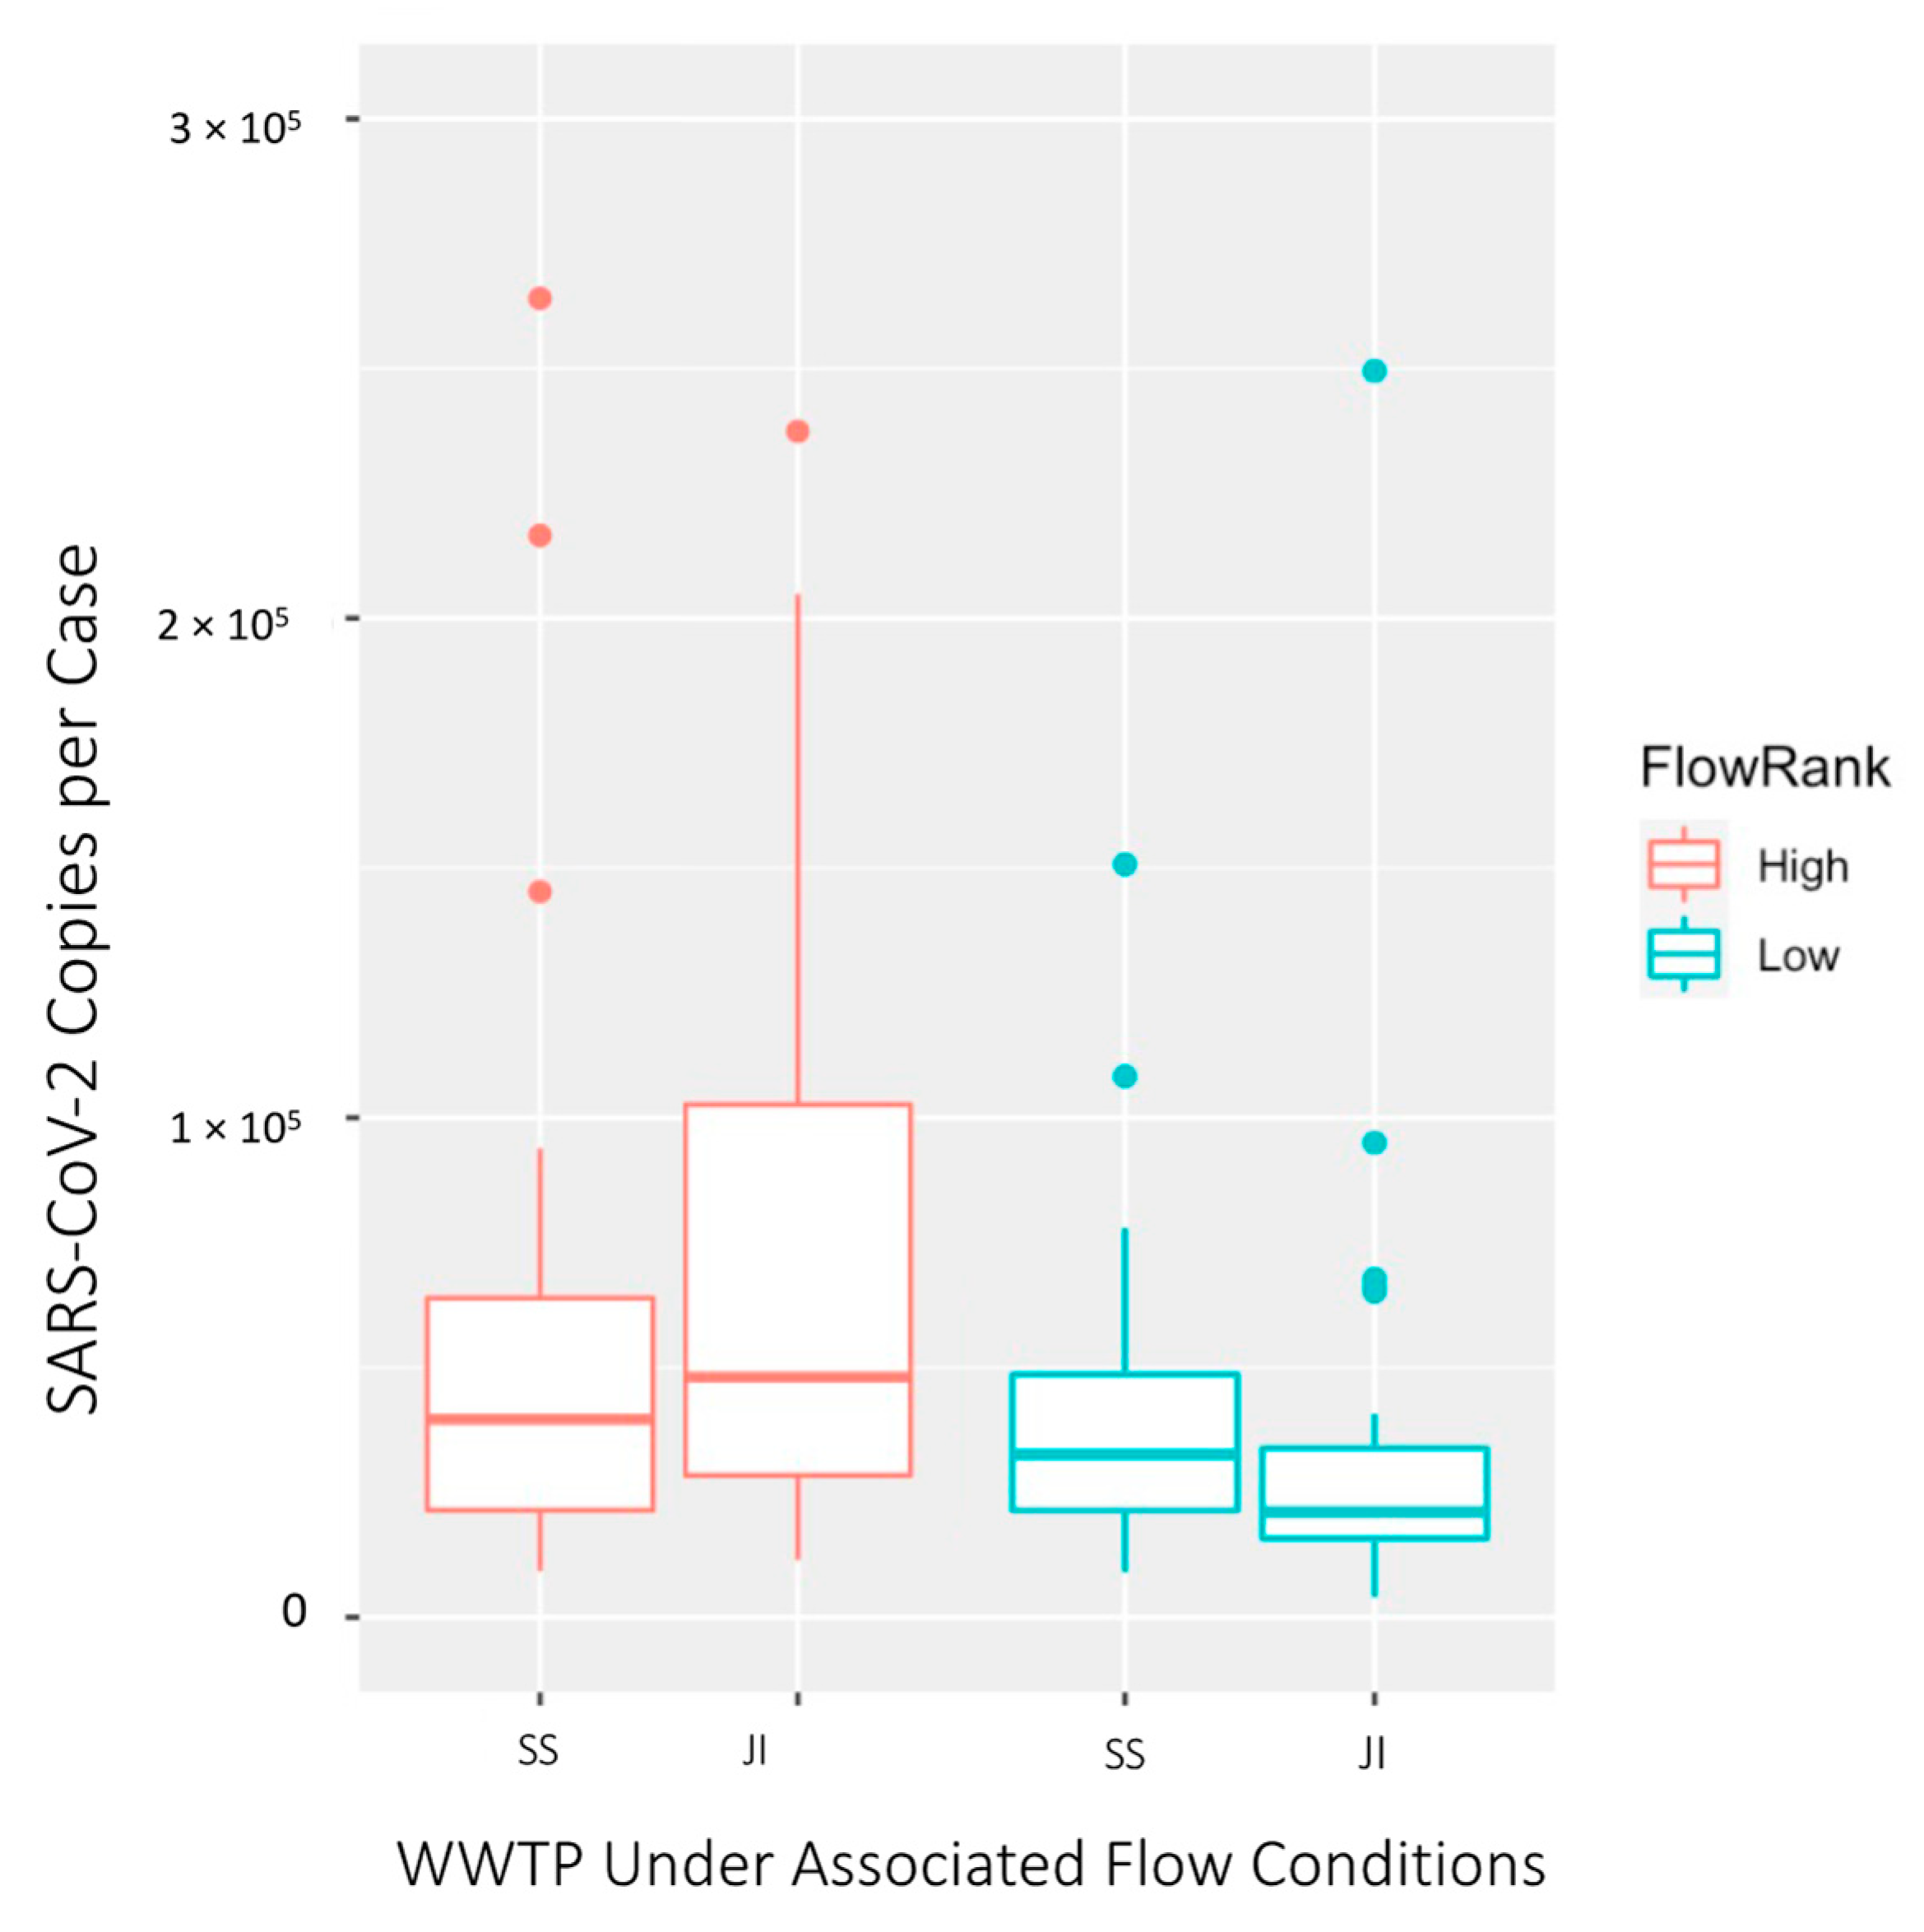
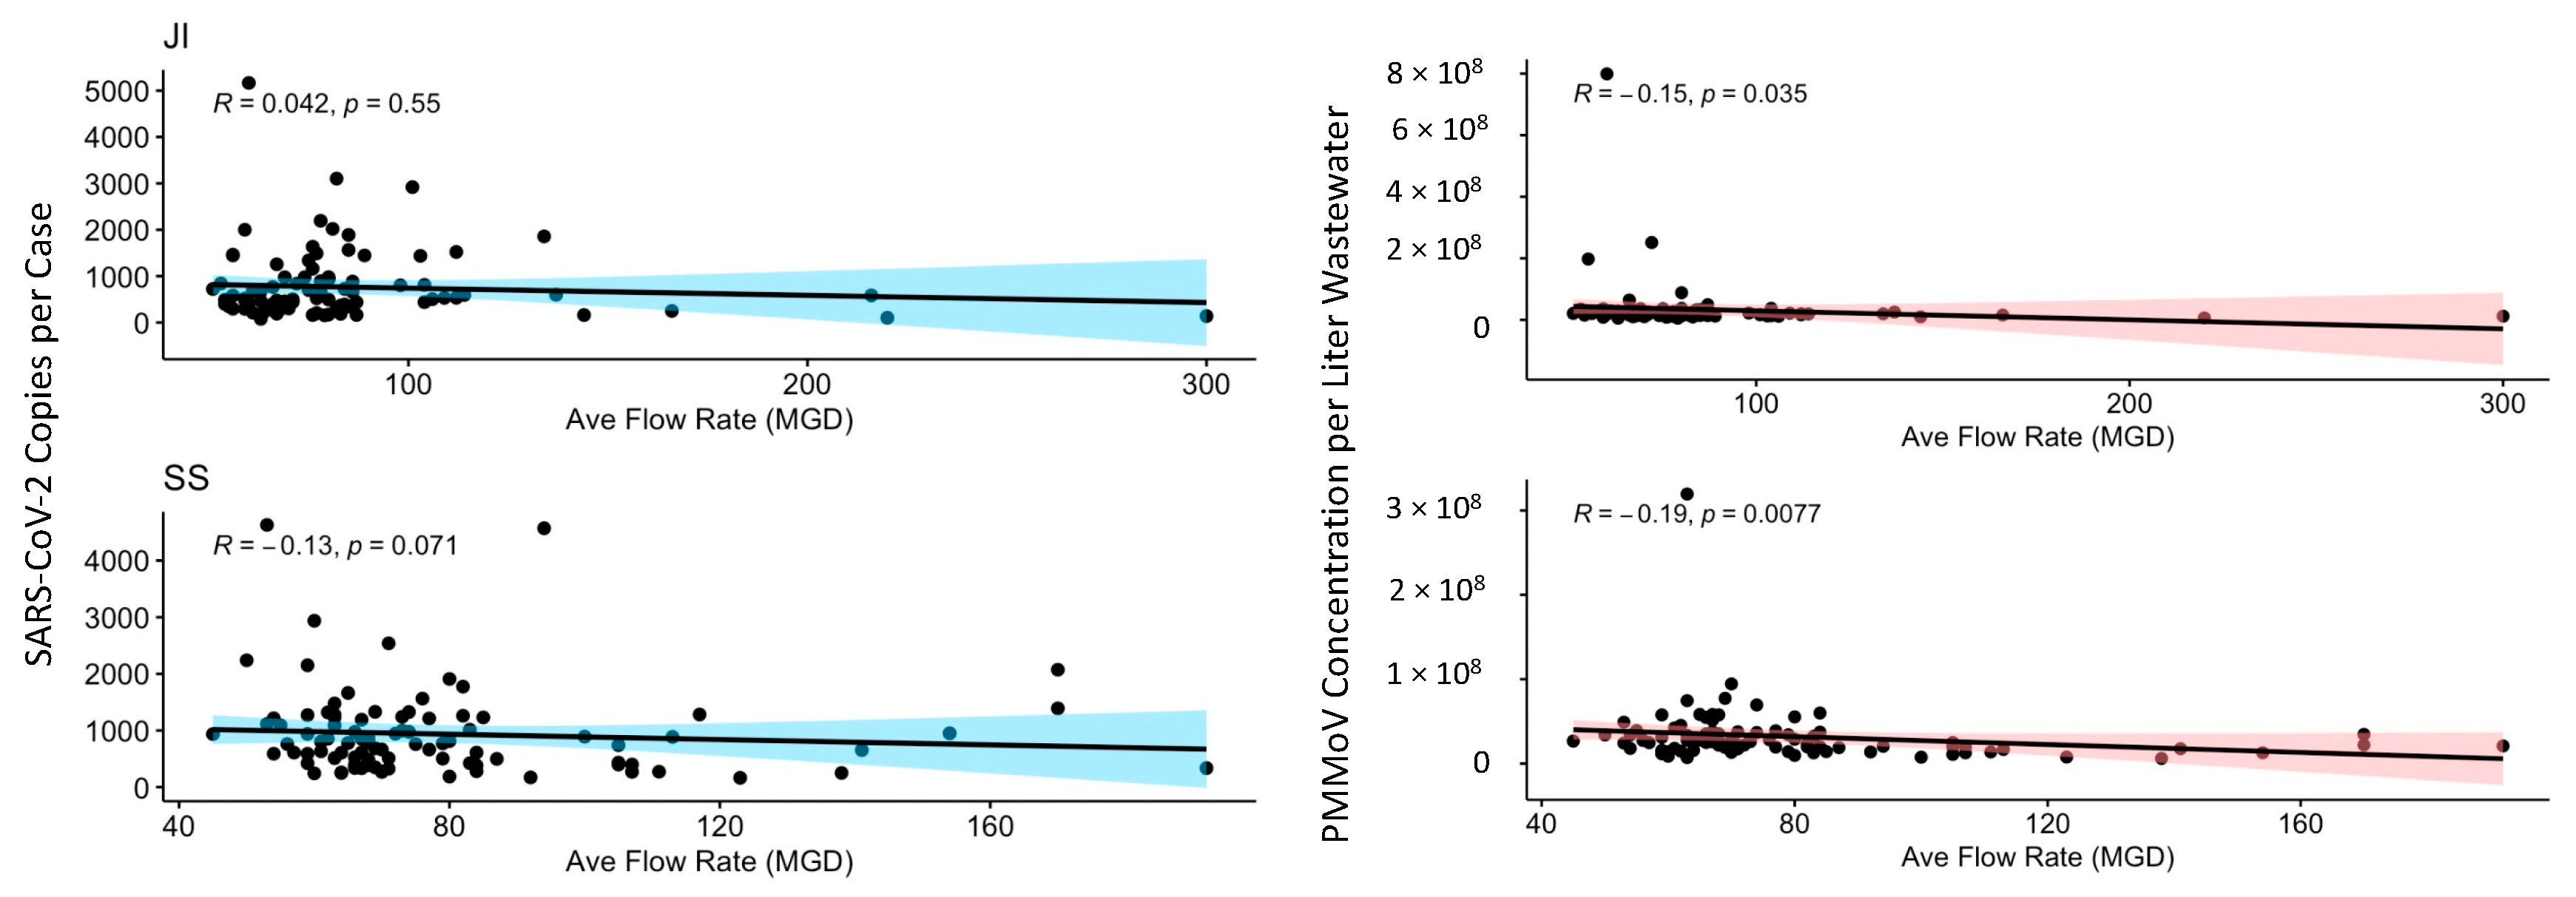
3.2. Influence of Flow

We investigated how flow might affect concentrations beyond the effect of the shorter travel times. Therefore, we examined if higher flows had a proportional reduction (i.e., dilution) in case-adjusted concentrations and of PMMoV. PMMoV is a human fecal marker that is widely present in the human population, that acts as a measure of fecal contribution. SARS-CoV-2 case-adjusted concentrations were on average 50% higher in high flows compared with low flows in JI (Welch’s t-test, p = 0.01). This might be suggestive of the addition of SARS-CoV-2 due to scouring with high velocities, as opposed to a dilution effect. SS case-adjusted concentrations were slightly higher with high flows, but this was not significant (Welch’s t-test, p = 0.14) (Figure 5).
The percentage of human fecal contribution had a low but significant, correlation to flow in both WWTPs (Figure 5) (Kendall’s tau, p < 0.05). Unlike SARS-CoV-2, PMMoV decreased slightly with increasing flows, but not to the extent expected if dilution was occurring.

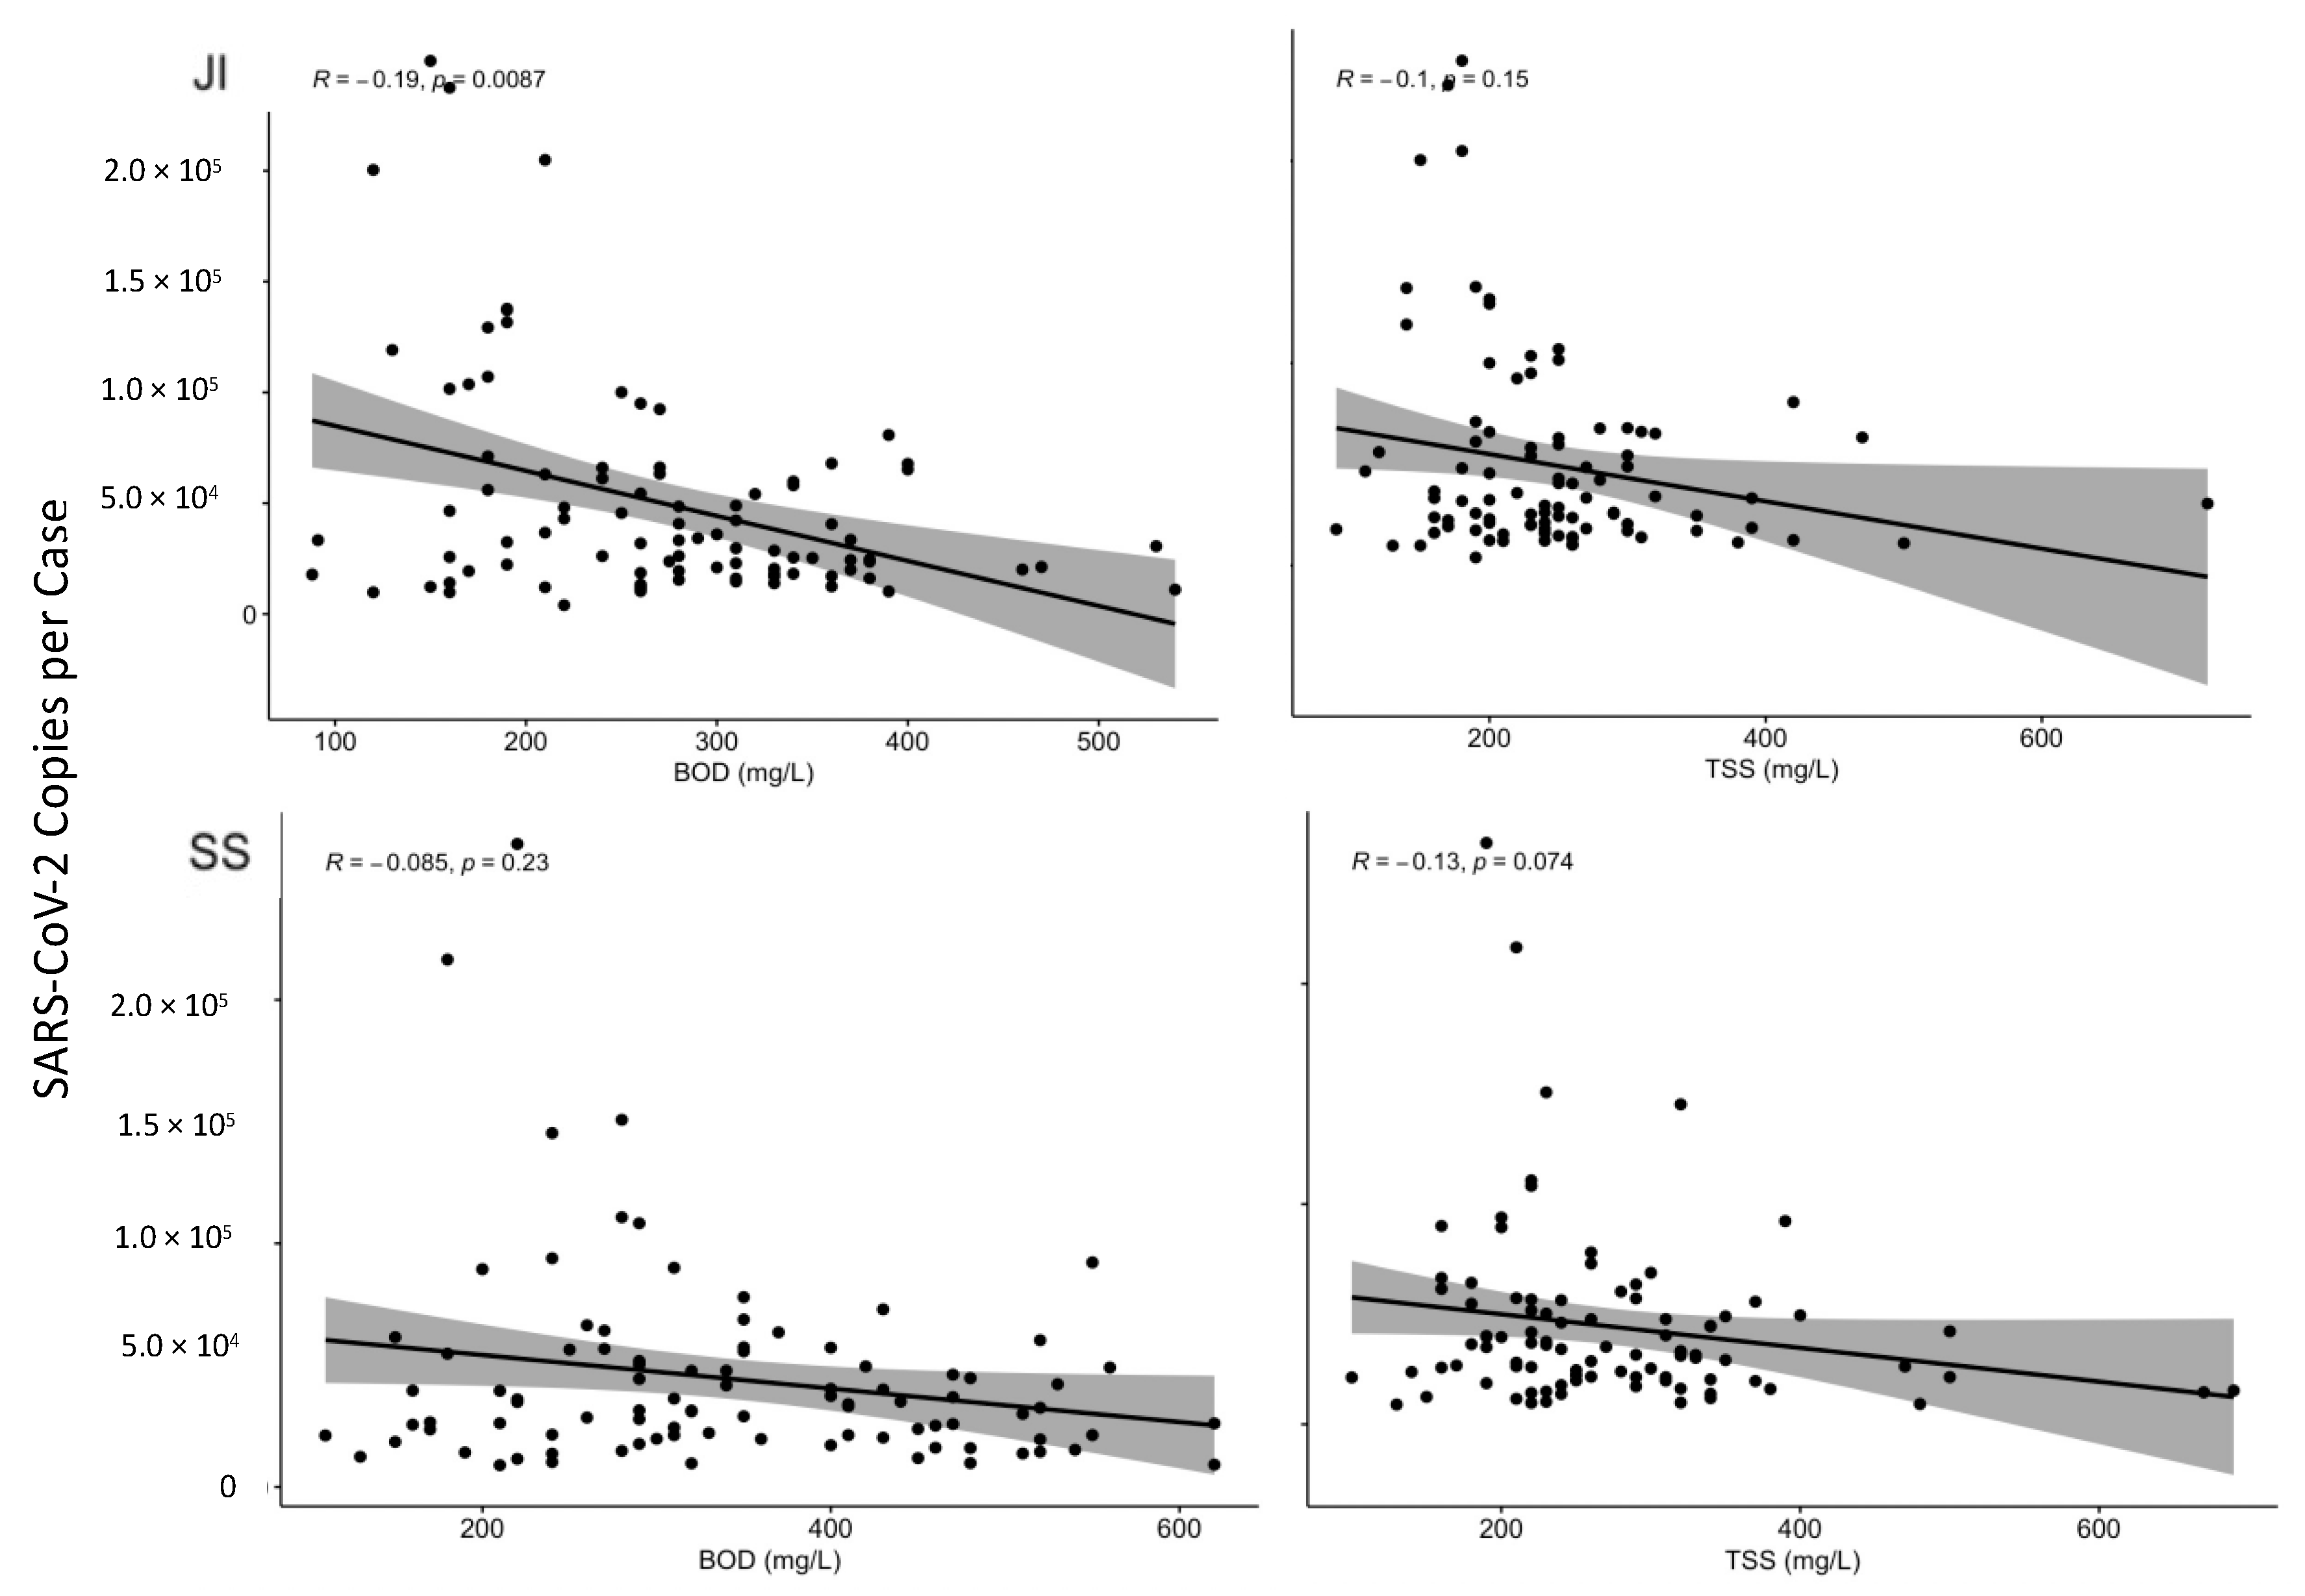
3.3. Influence of BOD and TSS

Overall, there was either no or very low correlation between BOD or TSS and case-adjusted loads. The low negative correlation in JI of BOD to case-adjusted loads was deemed significant (Figure 6), but considering JI had overall higher case-adjusted loads and lower BOD than SS WWTP (Table 1), we can infer that BOD does not have a substantial effect on SARS-CoV-2 concentrations entering the plant.

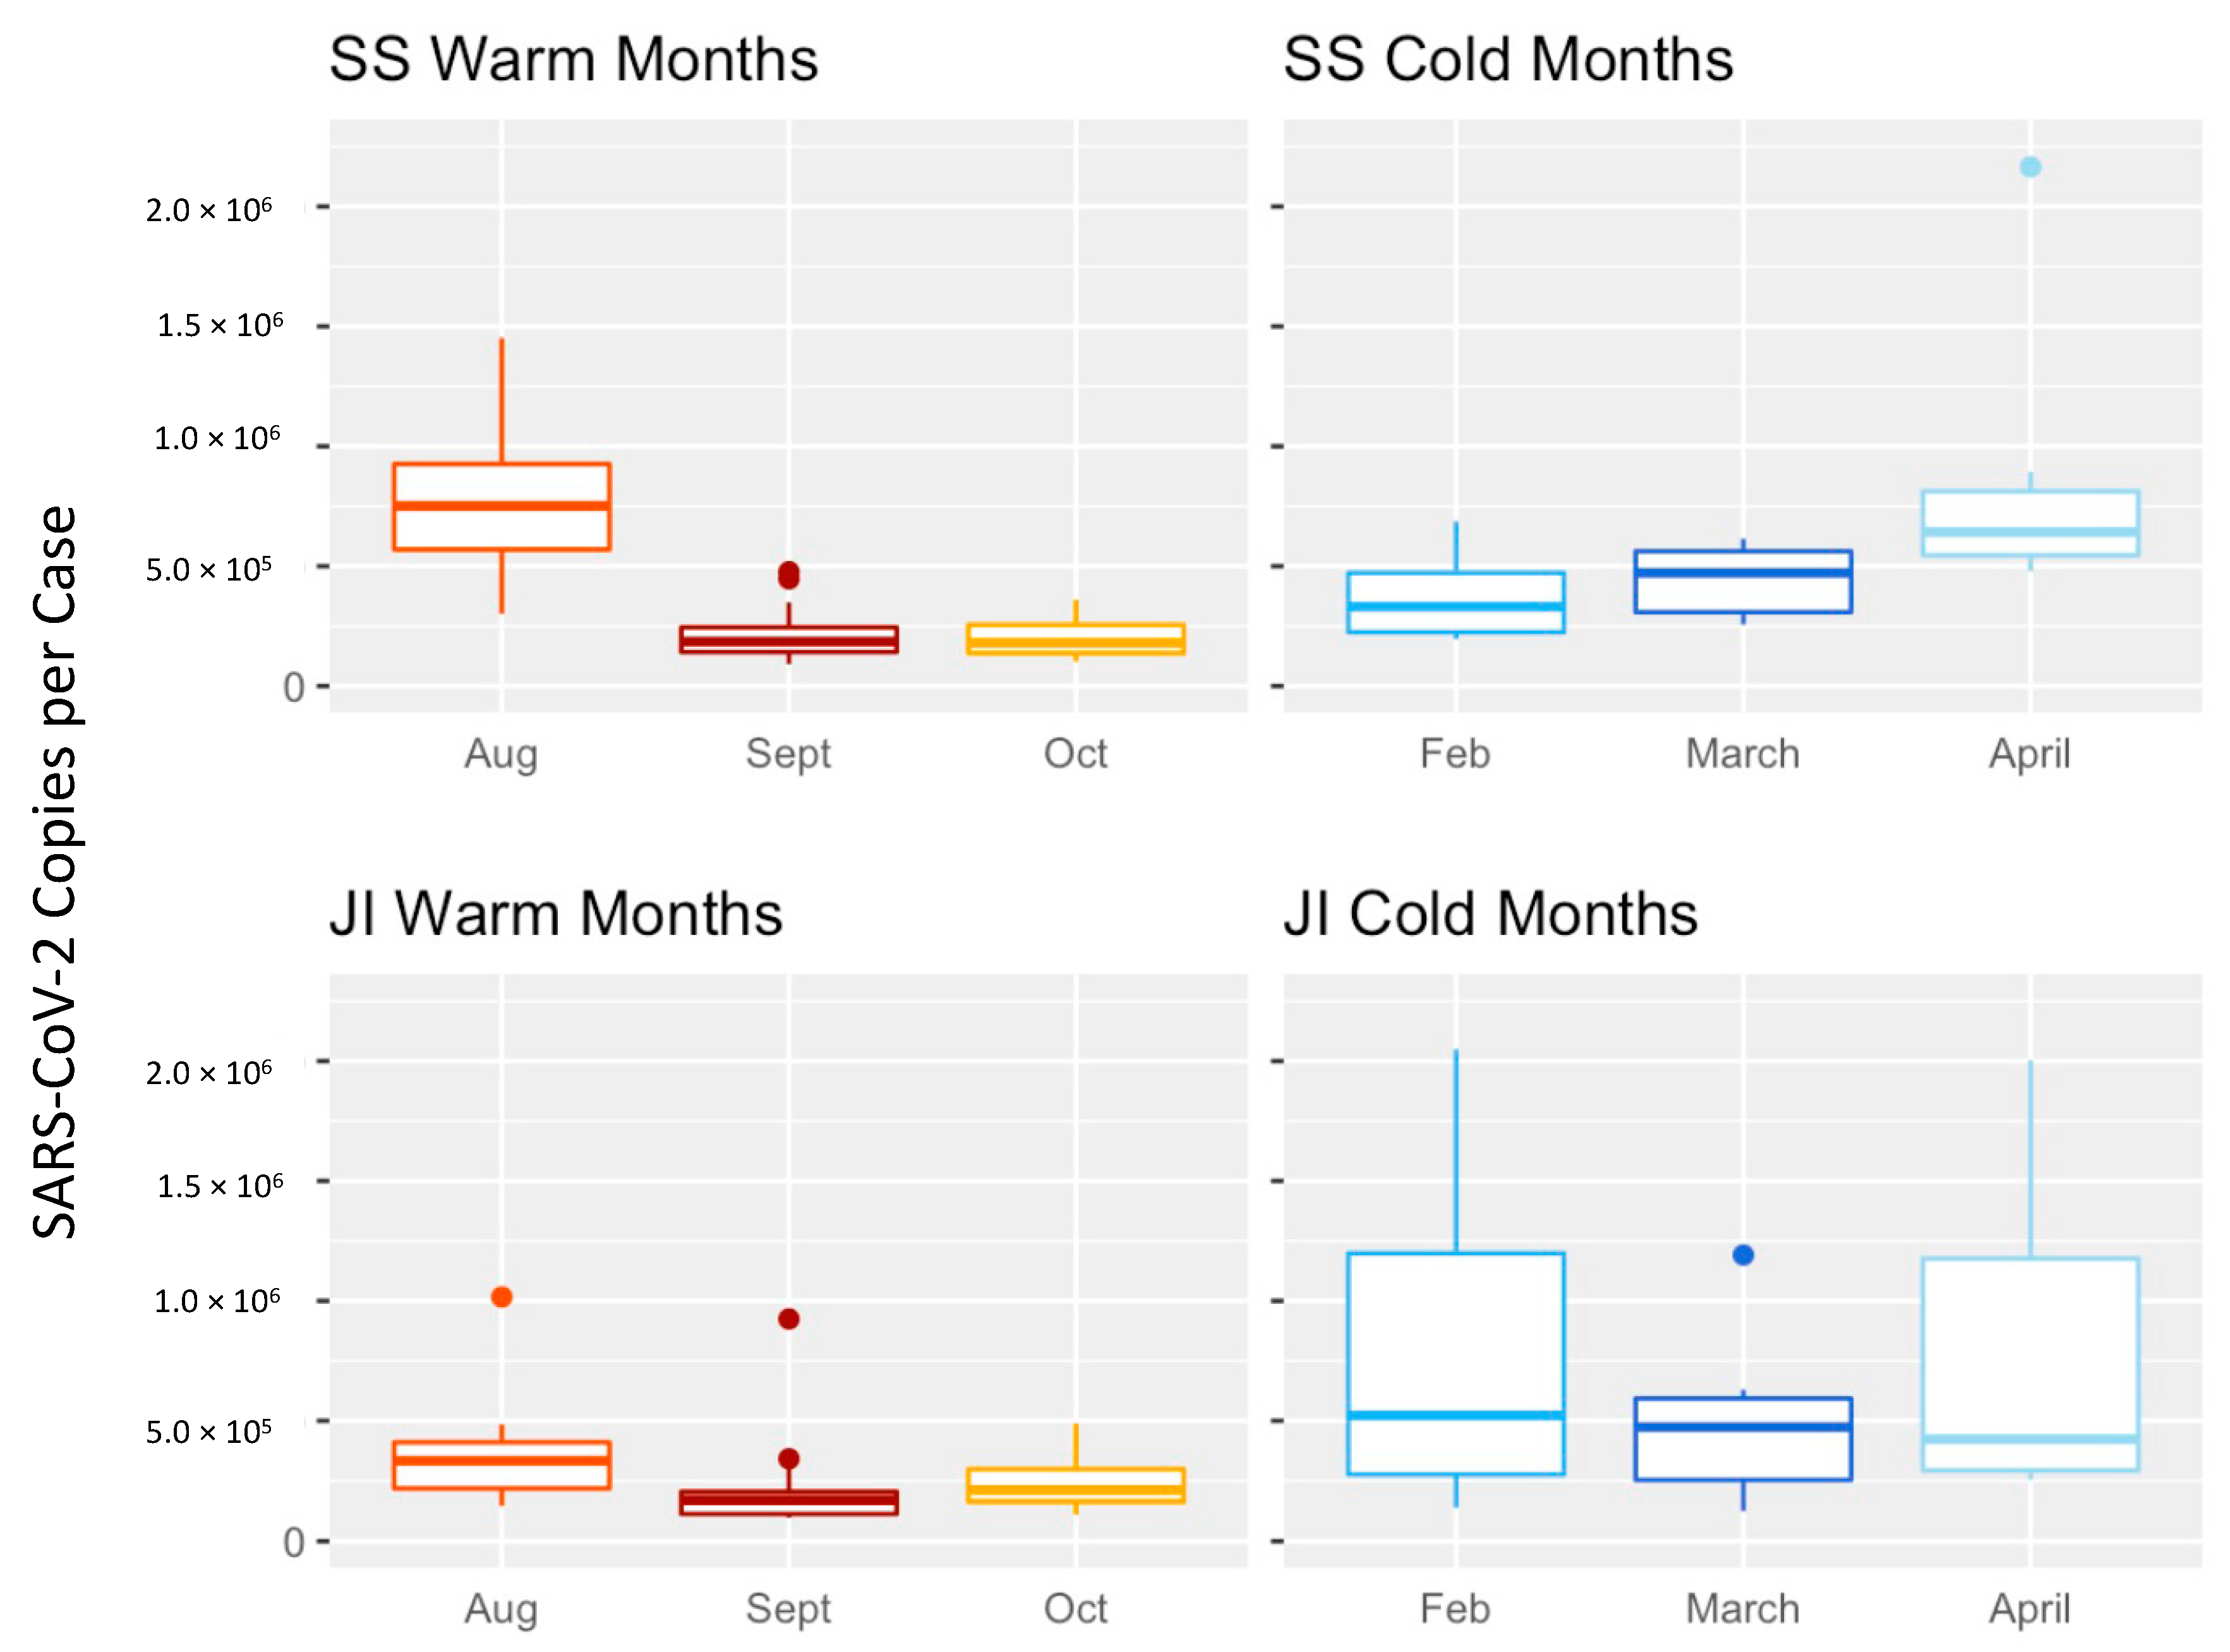
3.4. Influences of Temperature

SARS-CoV-2 case-adjusted loads were on average 40–55% higher in colder months compared with warmer months in both SS (Welch’s t-test, p = 0.04) and JI (Welch’s t-test, p = 0.02) suggesting there is less decay in JI and SS conveyance systems in cooler temperatures (Figure 7). These temperature effects occurred despite the short travel time in the JI service area that would subject SARS-CoV-2 to temperature effects. We further examined that temperature was significantly negatively correlated to SARS-CoV-2 copies per case in both plants (Kendall’s tau, p < 0.05). August was the only significant outlier in any grouping for both WWTPs (ANOVA, p < 0.05); August also had the highest flow of all warm months (Figure S1).

4. Discussion

Wastewater surveillance is increasingly being used by public health officials to monitor COVID-19 prevalence and respond accordingly to help contain and mitigate outbreaks in specific communities [11]. Researchers across the country are implementing this tool, despite critical gaps in the knowledge on how SARS-CoV-2 recovery is affected within untreated wastewater entering WWTPs [15,31,32,33]. While laboratory-based studies have been performed to determine viral decay under certain temperatures over time [15,18], our study has the benefit of access to a wastewater system that is highly instrumented for flow and temperature. Both JI and SS fall under the supervision of MMSD which allows comparison of two treatment plants with different travel times with nearly identical data collection, maintenance, treatment, and supervisory standards. This enabled us to evaluate the impact of various parameters on SARS-CoV-2 concentration within the residence time of a sewer conveyance system. The paired design of the study allowed us to control for common parameters such as temperature or rainfall (increasing flow) when comparing travel times since both systems were subjected to similar environmental conditions.
We hypothesized that under high flow conditions when travel times are shortest, there would be no difference in copies per case between the two plants. Under low flow conditions, when travel times are the longest and there is the greatest difference between JI and SS, we would expect to observe a difference in SARS-CoV-2 case-adjusted loads. Overall, we found that there was minimal SARS-CoV-2 decay with travel time, suggesting this is not an important parameter to consider in comparisons of different sewer systems.
Wastewater surveillance programs generally use measured concentrations multiplied times the flow to calculate load. Since approximately the same number of people in the service area contribute biological material to the sewer system in high flow or low flow conditions, we expect that SARS-CoV-2 or fecal markers such as PMMoV would be proportionally diluted with the flow. However, we found no effect where SARS-CoV-2 case-adjusted concentrations were not proportionally reduced. The same analysis with PMMoV also showed no proportional dilution; however, there were slight decreases in PMMoV concentrations in high flow conditions. Higher flows can result in shorter travel times and less decay which can account for this pattern, but our time travel analysis suggests differences in decay over typical residence times are minimal.
Previous work found calculating loads using flow did not increase the correlation between cases and SARS-CoV-2 concentrations compared with simply using concentrations [3]. High flows result in scouring, which can inject residual SARS-CoV-2 into the waste stream; however, this explanation was also not supported as we did not observe an increased TSS with increased flow. Additional studies are needed to examine how reservoirs might accumulate and be mobilized in conveyance systems, which can span thousands of miles of pipes in urban areas. While most reporting is normalized to flow [7], the practice to include flow in assessing SARS-CoV-2 trends needs further consideration.
We determined that TSS had a negligible effect on SARS-CoV-2 case-adjusted copies detected in wastewater, which is comparable to other literature [34]. Moreover, while BOD was significantly higher in SS than in JI, we can conclude that there was no direct impact of SARS-CoV-2 from BOD because the copies per case were not significantly higher in either plant despite significant BOD levels. Further negating significance, JI illustrated a low but significant negative correlation with BOD, but had overall lower BOD levels and higher SARS-CoV-2 case-adjusted copies. In addition, BOD is known to be tightly correlated to temperature [35], so this low correlation may be a direct result of temperature.
Temperature had the strongest effect on SARS-CoV-2 viral concentration (Kendall’s tau, p < 0.05), significantly reducing observed concentration exposed to warmer conditions in JI (paired t-test, p = 0.02), and SS (paired t-test, p = 0.046). Temperature posing a significant effect on SARS-CoV-2 decay is consistent with other studies that indicate coronaviruses, and specifically SARS-CoV-2, are sensitive to warmer temperatures [15,36,37,38,39] where decay rates for similar temperature windows ranged between 0.021–2.16 k/day [15,20,21,39]. Increasing temperatures reduce RNA stability, and make it more difficult for any virus to survive [40]. Previous studies have shown that increasing the temperature from 4 °C to 10 °C can more than double the decay rate of SARS-CoV-2 RNA, measured through detection of the N1 and N2 gene [38].
In all, temperature is the only parameter crucial to consider when interpreting empirical values for SARS-CoV-2 concentrations in wastewater, especially when combined with longer residence times due to low flow weather conditions and extensive sewer networks. The residence time of a sewer conveyance system can change vastly on any given day due to weather conditions; it is important to take this into account when determining or applying the decay rate within a sewer network.

5. Conclusions

Wastewater surveillance is one of several innovative approaches to understand the spread of COVID-19 in the community beyond traditional public health testing [35,39]. This study quantified the influence of time, flow, and temperature, which contextualizes the magnitude of these influences compared with method variability. Methods can vary more than an order of magnitude [12]; however, travel time, flow, and temperature differences were within an order of magnitude. While it is difficult to calculate the total loss of SARS-CoV-2 in the conveyance system, influences that are different between systems (travel time), changes day-to-day (flow), or over seasons (temperature) can diminish the relationships between SARS-CoV-2 and infection in the community. Understanding how wastewater treatment systems can alter SARS-CoV-2 detection prior to sample collection can aid in the interpretation and comparison of wastewater surveillance values being reported.

Supplementary Materials

The following supporting information can be downloaded at: https://www.mdpi.com/article/10.3390/w14091373/s1, Sample Data Set S1: Sample and Parameter information; Table S1: Primer/Probe Sequences for ddPCR [41]; Table S2: Estimated travel times using approximation of most similar legs; Table S3: Estimated travel times accounting for pipe diversions; Figure S1: The daily average flow measurements matching the date of sample collection in SS and JI.

Author Contributions

Conceptualization, M.K.S. and S.L.M.; methodology, M.K.S. and S.L.M.; formal analysis, M.K.S.; investigation, M.K.S. and S.L.M.; writing—original draft preparation, M.K.S. and S.L.M.; writing—review and editing, M.K.S. and S.L.M.; visualization, M.K.S.; supervision, S.L.M.; funding acquisition, S.L.M. All authors have read and agreed to the published version of the manuscript.

Funding

This research was funded by a grant awarded to the Wisconsin State Laboratory of Hygiene (subcontract to UW-Milwaukee) from the Wisconsin Department of Health Services (DHS) administered, CDC-funded, ELC (Epidemiology and Laboratory Capacity) Enhanced Detection Expansion program, and through Student Fellowship funds from the Milwaukee Metropolitan Sewerage District.

Institutional Review Board Statement

Not applicable.

Informed Consent Statement

Not applicable.

Data Availability Statement

All data sets available in Supplementary Materials. R codes used for statistical analysis can be found on GitHub at https://github.com/schussm2/Effect-of-time-and-temperature-on-SARS-CoV-2-in-wastewater (accessed on 11 March 2022).

Acknowledgments

The authors thank Nathan Kloczko and Mathew Schinwald at Office of Health Informatics and the Bureau of Information Technology Services at the Wisconsin Department of Health Services for their contributions mapping COVID-19 case data and making information accessible to the public through the DHS COVID-19 Wastewater Monitoring website. The authors thank Adelaide Roguet, and Shuchen Feng from the McLellan lab for early stages development, method evaluation, and data generation, and Brooke Dinan from the McLellan lab and Angela Schmoldt from the Great Lakes Genomics Center for contributing to method evaluation and data generation. The authors also thank MMSD for providing samples and sharing expertise about individual systems, and specifically Tom Simmons, Emily Herda and Joe Lesczynski for compiling, providing, and helping to interpret data used in the travel-time analysis.

Conflicts of Interest

The authors declare no conflict of interest.

Abbreviations

ANOVAAnalysis of variance
BCoVBovine Coronavirus
BODBiological oxygen demand
CDCU.S. Centers for Disease Control and Prevention
COVID-19Coronavirus disease 2019
DHSDepartment of Health Services
JIJones Island Water Reclamation Facility
LODLimit of detection
LOQLimit of quantification
MGMillion gallons
MGDMillion gallons per day
MMSDMilwaukee Metropolitan Sewage District
NTCNo template control
NWSSNational Wastewater Surveillance System
PMMoVPepper Mild Mottle Virus
RNARibonucleic acid
RT-ddPCRReverse transcription droplet digital PCR
SARS-CoV-2Severe acute respiratory syndrome coronavirus 2
SSSouth Shore Water Reclamation Facility
TSSTotal suspended solids
WWTPWastewater treatment plant

References

  1. Safford, H.R.; Shapiro, K.; Bischel, H.N. Wastewater analysis can be a powerful public health tool—if it’s done sensibly. Proc. Natl. Acad. Sci. USA 2022, 119, e2119600119. [Google Scholar] [CrossRef] [PubMed]
  2. Daughton, C. The international imperative to rapidly and inexpensively monitor community-wide Covid-19 infection status and trends. Sci. Total Environ. 2020, 726, 138149. [Google Scholar] [CrossRef] [PubMed]
  3. Feng, S.; Roguet, A.; McClary-Gutierrez, J.S.; Newton, R.J.; Kloczko, N.; Meiman, J.G.; McLellan, S.L. Evaluation of Sampling, Analysis, and Normalization Methods for SARS-CoV-2 Concentrations in Wastewater to Assess COVID-19 Burdens in Wisconsin Communities. ACS EST Water 2021, 1, 1955–1965. [Google Scholar] [CrossRef]
  4. Foladori, P.; Cutrupi, F.; Segata, N.; Manara, S.; Pinto, F.; Malpei, F.; Bruni, L.; La Rosa, G. SARS-CoV-2 from faeces to wastewater treatment: What do we know? A review. Sci. Total Environ. 2020, 743, 140444. [Google Scholar] [CrossRef] [PubMed]
  5. Gerrity, D.; Papp, K.; Stoker, M.; Sims, A.; Frehner, W. Frehner, Early-pandemic wastewater surveillance of SARS-CoV-2 in Southern Nevada: Methodology, occurrence, and incidence/prevalence considerations. Water Res. X 2021, 10, 100086. [Google Scholar] [CrossRef]
  6. Graham, K.E.; Loeb, S.K.; Wolfe, M.K.; Catoe, D.; Sinnott-Armstrong, N.; Kim, S.; Yamahara, K.M.; Sassoubre, L.M.; Grijalva, L.M.M.; Roldan-Hernandez, L.; et al. SARS-CoV-2 RNA in Wastewater Settled Solids Is Associated with COVID-19 Cases in a Large Urban Sewershed. Environ. Sci. Technol. 2021, 55, 488–498. [Google Scholar] [CrossRef]
  7. Medema, G.; Heijnen, L.; Elsinga, G.; Italiaander, R.; Brouwer, A. Presence of SARS-Coronavirus-2 RNA in Sewage and Correlation with Reported COVID-19 Prevalence in the Early Stage of the Epidemic in The Netherlands. Environ. Sci. Technol. Lett. 2020, 7, 511–516. [Google Scholar] [CrossRef]
  8. Peccia, J.; Zulli, A.; Brackney, D.E.; Grubaugh, N.D.; Kaplan, E.H.; Casanovas-Massana, A.; Ko, A.I.; Malik, A.A.; Wang, D.; Wang, M.; et al. Measurement of SARS-CoV-2 RNA in wastewater tracks community infection dynamics. Nat. Biotechnol. 2020, 38, 1164–1167. [Google Scholar] [CrossRef]
  9. Li, X.; Zhang, S.; Shi, J.; Luby, S.P.; Jiang, G. Uncertainties in estimating SARS-CoV-2 prevalence by wastewater-based epidemiology. Chem. Eng. J. 2021, 415, 129039. [Google Scholar] [CrossRef]
  10. Polo, D.; Quintela-Baluja, M.; Corbishley, A.; Jones, D.L.; Singer, A.C.; Graham, D.W.; Romalde, J.L. Making waves: Wastewater-based epidemiology for COVID-19—approaches and challenges for surveillance and prediction. Water Res. 2020, 186, 116404. [Google Scholar] [CrossRef]
  11. Kirby, A.E.; Walters, M.S.; Jennings, W.C.; Fugitt, R.; LaCross, N.; Mattioli, M.; Marsh, Z.A.; Roberts, V.A.; Mercante, J.W.; Yoder, J.; et al. Using Wastewater Surveillance Data to Support the COVID-19 Response—United States, 2020–2021. MMWR Morb. Mortal. Wkly. Rep. 2021, 70, 1242–1244. [Google Scholar] [CrossRef] [PubMed]
  12. Pecson, B.M.; Darby, E.; Haas, C.N.; Amha, Y.M.; Bartolo, M.; Danielson, R.; Dearborn, Y.; Di Giovanni, G.; Ferguson, C.; Fevig, S.; et al. Reproducibility and sensitivity of 36 methods to quantify the SARS-CoV-2 genetic signal in raw wastewater: Findings from an interlaboratory methods evaluation in the U.S. Environ. Sci. Water Res. Technol. 2021, 7, 504–520. [Google Scholar] [CrossRef] [PubMed]
  13. Adedokun, K.A.; Olarinmoye, A.O.; Mustapha, J.O.; Kamorudeen, R.T. A close look at the biology of SARS-CoV-2, and the potential influence of weather conditions and seasons on COVID-19 case spread. Infect. Dis. Poverty 2020, 9, 77. [Google Scholar] [CrossRef] [PubMed]
  14. The Water Research Foundation (WRF). Wastewater Surveillance of the COVID-19 Genetic Signal in Sewersheds: Recommendations from Global Experts; The Water Research Foundation: Alexandria, VA, USA, 2020; Available online: https://www.waterrf.org/sites/default/files/file/2020-06/COVID-19_SummitHandout-v3b.pdf (accessed on 11 March 2022).
  15. Ahmed, W.; Bertsch, P.M.; Bibby, K.; Haramoto, E.; Hewitt, J.; Huygens, F.; Gyawali, P.; Korajkic, A.; Riddell, S.; Sherchan, S.P.; et al. Decay of SARS-CoV-2 and surrogate murine hepatitis virus RNA in untreated wastewater to inform application in wastewater-based epidemiology. Environ. Res. 2020, 191, 110092. [Google Scholar] [CrossRef]
  16. Yang, S.; Dong, Q.; Li, S.; Cheng, Z.; Kang, X.; Ren, D.; Xu, C.; Zhou, X.; Liang, P.; Sun, L.; et al. Persistence of SARS-CoV-2 RNA in wastewater after the end of the COVID-19 epidemics. J. Hazard. Mater. 2022, 429, 128358. [Google Scholar] [CrossRef]
  17. Achak, M.; Bakri, S.A.; Chhiti, Y.; Alaoui, F.E.M.; Barka, N.; Boumya, W. SARS-CoV-2 in hospital wastewater during outbreak of COVID-19: A review on detection, survival and disinfection technologies. Sci. Total Environ. 2021, 761, 143192. [Google Scholar] [CrossRef]
  18. Gundy, P.M.; Gerba, C.P.; Pepper, I.L. Survival of Coronaviruses in Water and Wastewater. Food Environ. Virol. 2009, 1, 10. [Google Scholar] [CrossRef] [Green Version]
  19. Gudbjartsson, D.F.; Helgason, A.; Jonsson, H.; Magnusson, O.T.; Melsted, P.; Norddahl, G.L.; Saemundsdottir, J.; Sigurdsson, A.; Sulem, P.; Agustsdottir, A.B.; et al. Spread of SARS-CoV-2 in the Icelandic Population. N. Engl. J. Med. 2020, 382, 2302–2315. [Google Scholar] [CrossRef]
  20. Hokajärvi, A.-M.; Rytkönen, A.; Tiwari, A.; Kauppinen, A.; Oikarinen, S.; Lehto, K.-M.; Kankaanpää, A.; Gunnar, T.; Al-Hello, H.; Blomqvist, S.; et al. The detection and stability of the SARS-CoV-2 RNA biomarkers in wastewater influent in Helsinki, Finland. Sci. Total Environ. 2021, 770, 145274. [Google Scholar] [CrossRef]
  21. Roldan-Hernandez, L.; Graham, K.E.; Duong, D.; Boehm, A.B. Persistence of Endogenous SARS-CoV-2 and Pepper Mild Mottle Virus RNA in Wastewater-Settled Solids. ACS EST Water 2022. [Google Scholar] [CrossRef]
  22. Ye, Y.; Ellenberg, R.M.; Graham, K.E.; Wigginton, K.R. Survivability, Partitioning, and Recovery of Enveloped Viruses in Untreated Municipal Wastewater. Environ. Sci. Technol. 2016, 50, 5077–5085. [Google Scholar] [CrossRef] [PubMed]
  23. Chik, A.H.; Glier, M.B.; Servos, M.; Mangat, C.S.; Pang, X.-L.; Qiu, Y.; D’Aoust, P.M.; Burnet, J.-B.; Delatolla, R.; Dorner, S.; et al. Comparison of approaches to quantify SARS-CoV-2 in wastewater using RT-qPCR: Results and implications from a collaborative inter-laboratory study in Canada. J. Environ. Sci. 2021, 107, 218–229. [Google Scholar] [CrossRef] [PubMed]
  24. Kantor, R.S.; Nelson, K.L.; Greenwald, H.D.; Kennedy, L.C. Challenges in Measuring the Recovery of SARS-CoV-2 from Wastewater. Environ. Sci. Technol. 2021, 55, 3514–3519. [Google Scholar] [CrossRef]
  25. Zhang, Y.; Cen, M.; Hu, M.; Du, L.; Hu, W.; Kim, J.J.; Dai, N. Prevalence and Persistent Shedding of Fecal SARS-CoV-2 RNA in Patients With COVID-19 Infection: A Systematic Review and Meta-analysis. Clin. Transl. Gastroenterol. 2021, 12, e00343. [Google Scholar] [CrossRef] [PubMed]
  26. Sharma, S.; Mann, R.; Kumar, S.; Mishra, N.; Srivastava, B.; Valecha, N.; Anvikar, A.R. A Simple and Cost-Effective Freeze-Thaw Based Method for Plasmodium DNA Extraction from Dried Blood Spot. Iran. J. Parasitol. 2019, 14, 29–40. [Google Scholar] [CrossRef] [PubMed]
  27. Centers for Disease Control (CDC). Research Use Only 2019-Novel Coronavirus (2019-nCoV) Real-Time RT-PCR Primers and Probes; CDC National Center for Immunization and Respiratory Diseases (NCIRD), Division of Viral Diseases: Atlanta, GA, USA, 2020.
  28. Zhang, T.; Breitbart, M.; Lee, W.H.; Run, J.-Q.; Wei, C.L.; Soh, S.W.L.; Hibberd, M.; Liu, E.T.; Rohwer, F.; Ruan, Y. RNA Viral Community in Human Feces: Prevalence of Plant Pathogenic Viruses. PLoS Biol. 2005, 4, e40003. [Google Scholar] [CrossRef] [PubMed] [Green Version]
  29. Decaro, N.; Elia, G.; Campolo, M.; Desario, C.; Mari, V.; Radogna, A.; Colaianni, M.L.; Cirone, F.; Tempesta, M.; Buonavoglia, C. Detection of Bovine Coronavirus Using a TaqMan-Based Real-Time RT-PCR Assay. J. Virol. Methods 2008, 151, 167–171. [Google Scholar] [CrossRef] [PubMed]
  30. Kishimoto, M.; Tsuchiaka, S.; Rahpaya, S.S.; Hasebe, A.; Otsu, K.; Sugimura, S.; Kobayashi, S.; Komatsu, N.; Nagai, M.; Omatsu, T.; et al. Development of a One-Run Real-Time PCR Detection System for Pathogens Associated with Bovine Respiratory Disease Complex. J. Vet. Med. Sci. 2017, 79, 517–523. [Google Scholar] [CrossRef] [Green Version]
  31. La Rosa, G.; Della Libera, S.; Iaconelli, M.; Ciccaglione, A.R.; Bruni, R.; Taffon, S.; Equestre, M.; Alfonsi, V.; Rizzo, C.; Tosti, M.E.; et al. Surveillance of hepatitis A virus in urban sewages and comparison with cases notified in the course of an outbreak, Italy 2013. BMC Infect. Dis 2014, 14, 419. [Google Scholar] [CrossRef] [Green Version]
  32. Silverman, A.I.; Boehm, A.B. Systematic Review and Meta-Analysis of the Persistence and Disinfection of Human Coronaviruses and Their Viral Surrogates in Water and Wastewater. Environ. Sci. Technol. Lett. 2020, 7, 544–553. [Google Scholar] [CrossRef]
  33. Carrillo-Reyes, J.; Barragán-Trinidad, M.; Buitrón, G. Surveillance of SARS-CoV-2 in sewage and wastewater treatment plants in Mexico. J. Water Process. Eng. 2021, 40, 101815. [Google Scholar] [CrossRef]
  34. Flegal, T.M.; Schroeder, E.D. Temperature Effects on BOD Stoichiometry and Oxygen Uptake Rate. Water Pollut. Control Fed. 1976, 48, 2700–2707. Available online: https://www.jstor.org/stable/25040084 (accessed on 8 March 2022).
  35. Ijaz, M.K.; Sattar, S.A.; Johnson-Lussenburg, C.M.; Springthorpe, V.S. Springthorpe, Comparison of the airborne survival of calf rotavirus and poliovirus type 1 (Sabin) aerosolized as a mixture. Appl. Environ. Microbiol. 1985, 49, 289–293. [Google Scholar] [CrossRef] [PubMed] [Green Version]
  36. Bivins, A.; Greaves, J.; Fischer, R.; Yinda, K.C.; Ahmed, W.; Kitajima, M.; Munster, V.J.; Bibby, K. Persistence of SARS-CoV-2 in Water and Wastewater. Environ. Sci. Technol. Lett. 2020, 7, 937–942. [Google Scholar] [CrossRef]
  37. de Oliveira, L.C.; Torres-Franco, A.F.; Lopes, B.C.; da Silva Santos, B.S.A.; Costa, E.A.; Costa, M.S.; Reis, M.T.P.; Melo, M.C.; Polizzi, R.B.; Teixeira, M.M.; et al. Viability of SARS-CoV-2 in river water and wastewater at different temperatures and solids content. Water Res. 2021, 195, 117002. [Google Scholar] [CrossRef]
  38. Weidhaas, J.; Aanderud, Z.T.; Roper, D.K.; VanDerslice, J.; Gaddis, E.B.; Ostermiller, J.; Hoffman, K.; Jamal, R.; Heck, P.; Zhang, Y.; et al. Correlation of SARS-CoV-2 RNA in wastewater with COVID-19 disease burden in sewersheds. Sci. Total Environ. 2021, 775, 145790. [Google Scholar] [CrossRef]
  39. Chi, Y.; Wang, Q.; Chen, G.; Zheng, S. The Long-Term Presence of SARS-CoV-2 on Cold-Chain Food Packaging Surfaces Indicates a New COVID-19 Winter Outbreak: A Mini Review. Front. Public Health 2021, 9, 650493. [Google Scholar] [CrossRef]
  40. Budd, J.; Miller, B.S.; Manning, E.M.; Lampos, V.; Zhuang, M.; Edelstein, M.; Rees, G.; Emery, V.C.; Stevens, M.M.; Keegan, N.; et al. Digital technologies in the public-health response to COVID-19. Nat. Med. 2020, 26, 1183–1192. [Google Scholar] [CrossRef]
  41. Centers for Disease Control (CDC). Research Use Only 2019-Novel Coronavirus (2019-nCoV) Real-time RT-PCR Primers and Probes. 2020. Available online: https://signagen.com/blog/2020/10/07/research-use-only-2019-novel-coronavirus-2019-ncov-real-time-rt-pcr-primers-and-probes/ (accessed on 10 March 2022).
Figure 1. MMSD sewer tributary areas consisting of 162,373 acres of land divided between JI and SS sewer systems. Collectively 131,756 acres goes to SS WWTP (blue), and 30,617 acres goes to JI WWTP (green). A total of 14,334 acres of JI service area can be diverted to SS under high flow conditions (dark red). Divertible maintenance pipes are indicated by light red. The legend indicates which legs (labeled on map) flow to which WWTP. Legs with an * indicate legs that are diverted to SS under high flow conditions and corresponds to 11% of the SS service area. Map provided by MMSD.
Water 14 01373 g001
Figure 2. Hourly metered velocity readings from four representative subsewersheds in SS WWTP (within legs Q, R2, SB, T), and three representative subsewersheds in JI WWTP (within legs C, F1, I) over the course of this study.
Water 14 01373 g002
Figure 3. Hourly metered temperature readings from four representative subsewersheds in SS WWTP (within legs Q, R2, SB, T), and three representative subsewersheds in JI WWTP (within legs C, F1, I) over the course of this study.
Water 14 01373 g003
Figure 4. Case-adjusted loads (daily) among the highest and lowest third of average daily flow rates from 62 pairs of samples from JI and SS WWTPs.
Water 14 01373 g004
Figure 5. Kendall’s rank correlation of case-adjusted concentration (copies/L/case) (left) and PMMoV concentration (right) to daily average flow rate (MGD) in JI (top) and SS (bottom).
Water 14 01373 g005
Figure 6. Kendall’s rank correlation of BOD (mg/L), and TSS (mg/L) to SARS-CoV-2 copies per case in JI (top) and SS (bottom) WWTPs.
Water 14 01373 g006
Figure 7. SARS-CoV-2 copies per case during warmest (17.41–19.75 °C) and coldest months (8.60–12.27 °C) in SS and JI WWTPs.
Water 14 01373 g007
Table 1. Comparison of JI and SS parameters across all samples (n = 186), and in warmest (n = 70) versus coldest (n = 38) months. Samples were collected from an automated samplers at MMSD reclamation facility, aliquots were removed by WWTP operators.
ParameterSS AverageJI Average
Warmest temperatures (°C)17.8618.54
Coldest temperatures (°C)10.9710.35
Annual temperature (°C)14.915.30
Warmest Daily Average Flow Rate (MGD)82.2989.69
Coldest Daily Average Flow Rate (MGD)92.5886.32
Annual daily average flow rate (MGD)79.0083.30
Warmest Total Suspended Dolids (TSS) (mg/L)267.71247.69
Coldest TSS (mg/L)253.16233.16
Annual TSS (mg/L)273.00245.00
Warmest Biological Oxygen Demand (BOD) (mg/L)331.43 *271.40
Coldest BOD (mg/L)314.74248.95
Annual BOD (mg/L)343.00 *273.00
* Significant difference between the JI and SS measurements.
Table 2. Average, and simulated low flow (maximum), and high flow (minimum) travel times in hours in JI and SS WWTPs. The data were compiled using the length of each pipe, and the average velocity from 33 metered sites across 39 legs in the MMSD sewer network.
PlantMinimum Travel Time (h)Average Travel Time (h)Maximum Travel Time (h)
JI3.747.4527.64
SS9.1922.16109.13
Publisher’s Note: MDPI stays neutral with regard to jurisdictional claims in published maps and institutional affiliations.

