Article

Assessment of Concentration Levels of Contaminants in Groundwater of the Soutpansberg Region, Limpopo Province, South Africa

by
Lindelani Lalumbe
1,* and
Thokozani Kanyerere
2
1
Department of Water and Sanitation, Pretoria 0001, South Africa
2
Department of Earth Sciences, University of the Western Cape, Bellville 7535, South Africa
*
Author to whom correspondence should be addressed.
Water 2022, 14(9), 1354; https://doi.org/10.3390/w14091354
Submission received: 31 March 2022 / Revised: 16 April 2022 / Accepted: 19 April 2022 / Published: 21 April 2022
(This article belongs to the Special Issue Groundwater Management in a Changing World: Challenges and Endeavors)

Abstract

:
Groundwater contributions towards improved food security and human health depend on the level of contaminants in groundwater resources. Many people in rural areas use groundwater for drinking purposes without treatment and knowledge of contaminant levels in such waters, owing to parachute research in which research outputs are not shared with communities. This study argues that parachute research exposes groundwater users to health hazards and threatens the food security of communities. Concentration levels of contaminants were measured to ascertain suitability of groundwater for drinking and irrigation purposes. A total of 124 groundwater quality samples from 12 boreholes and 2 springs with physiochemical data from 1995 to 2017 were assessed. This study found high concentration levels of contaminants, such as F, NO3, Cl, and total dissolved solids, in certain parts of the studied area. In general, groundwater was deemed suitable for drinking purposes in most parts of the studied area. Combined calculated values of sodium adsorption ratios, Na%, magnesium hazards, the permeability index, residual sodium carbonate, and total dissolved solids determined that groundwater was suitable for irrigation purposes. The discussion in this paper shows that scientific knowledge generated on groundwater quality is not aimed at developing skills and outputs for improved human health and food security but rather for scientific publication and record keeping, leaving communities where such data has been gathered devoid of knowledge about groundwater quality. In this study, it is recommended that research outputs on groundwater quality should be shared with groundwater users through various initiatives.

1. Introduction

Availability of water in general is declining, owing to climatic variations such as drought in arid and semi-arid regions, and it is increasing in demand, owing to socio-economic activities. Groundwater has become the main or only source of freshwater for various activities, such as irrigation and domestic uses across the world [1,2,3,4], and this is especially common in rural areas where there is a lack of or no alternative water supply. Increasing reliance on groundwater can lead to other ecological factors, such as decreasing groundwater level, pollution, and deterioration of water quality [5]. Globally, it is being reported that groundwater that was previously considered fresh is increasingly being contaminated or polluted, and this can have a negative impact on the livelihood of vulnerable people relying on groundwater for various uses [6,7]. There are various factors that influence groundwater quality and that determine the concentration levels of contaminants in rural areas, including anthropogenic activities (irrigation and pit-latrines), leaching, regional geology, as well as climatic conditions [8,9,10,11]. High concentration levels of some contaminants in groundwater result from natural geological processes [12]. The authors of [12,13] show the role of geogenic pollution on groundwater resources. For groundwater to contribute towards food security and improved rural livelihood through irrigation and domestic use, concentration levels of contaminants should be determined to ensure groundwater is suitable for various uses. The challenge is that a majority of groundwater users in many rural areas, such as the Soutpansberg, use groundwater without treatment or knowledge of the concentration levels of contaminants, a situation which poses a huge threat to food security, human health, and their livelihoods. Understanding and communicating concentration levels of contaminants and groundwater quality in general are important, as they ensure that people use groundwater that is safe for consumption [14]. Various studies globally [1,2] and regionally [15,16,17,18,19] assessed groundwater quality data to determine suitability for human consumption. They evaluated major cations (Ca2+, Mg2+, Na+, K+) and anions (Cl, HCO3, SO42−, F). These studies compared groundwater quality data with drinking water standards, such as in [20], and with various local standards, such as in [21] in South Africa. Suitability of groundwater for irrigation contributes towards food security [22]. Groundwater that is not suitable for irrigation may reduce crop yields and damage soil structure [23]. Studies conducted by the authors of [9,17,24,25,26,27] assessed the suitability of groundwater for irrigation purposes, using methods such as SAR, PI, RSC, Na%, and MH, and they found contrasting results from the applied methods. Using a combined multiple parameters and hydro-chemical characterisation approach is an advantage when evaluating potential pollutants in groundwater and suitability for irrigation and drinking purposes, as has been illustrated in studies such as [28,29,30] in China. Contaminants are input of foreign and possibly toxic materials into the environment, and pollutants are described as substances that are anthropogenically introduced that may be harmful to the environment [31]. It is not simple to distinguish between contaminants and pollutants, as it is not always possible to define the concentration level at which contaminants become pollutants [31]. However, it has become a norm with various authors to compare concentration levels of contaminants in groundwater to various standards that are largely for surface water or drinking water to determine if contaminants in groundwater are pollutants. This practice may be misleading, as some aquifers are highly concentrated in some contaminants in nature and are not polluted. This study taps into the subject of comparing contaminants in groundwater to various international and local standards. The purpose of this study is to determine the concentration levels and spatial distributions of contaminants and to evaluate the suitability of groundwater for domestic and irrigation purposes using long-term data. This study also discusses parachute research that does not share output and skills on groundwater quality with affected communities.

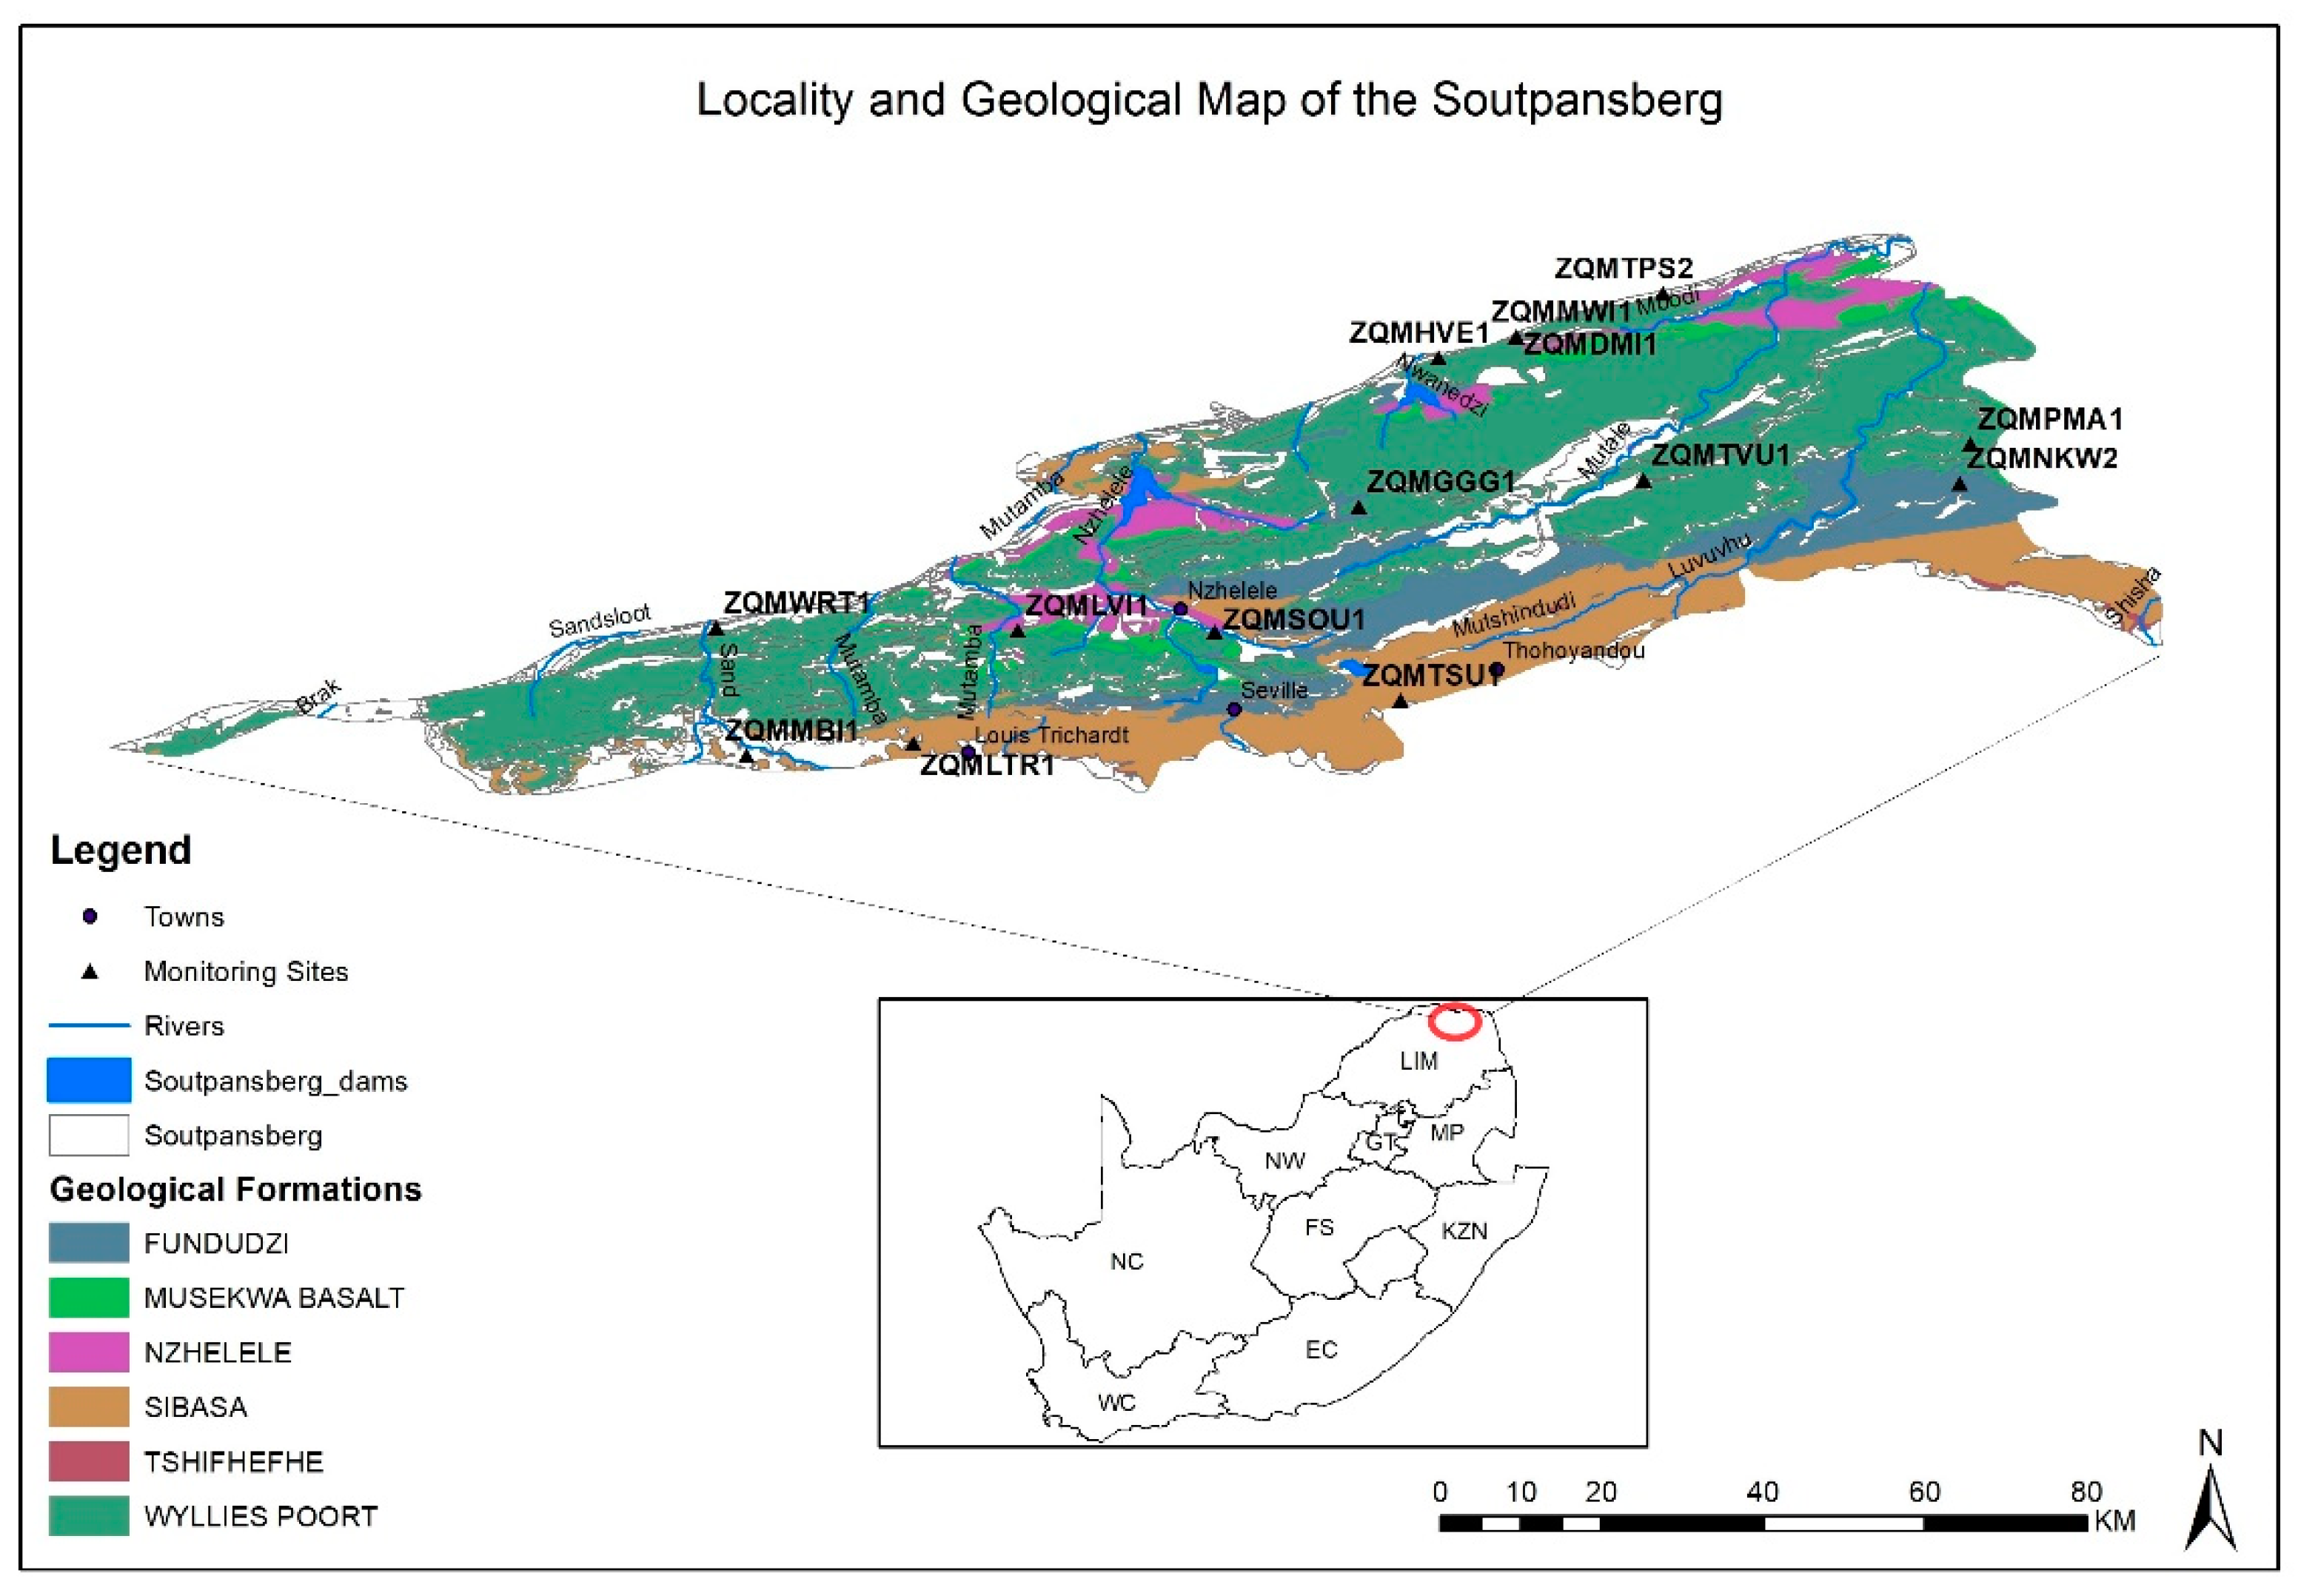
2. Description of the Study Area

The Soutpansberg region is in the far northern part of the Limpopo Province in South Africa (Figure 1). The total area of the region is about 3099.6 km2 and lies between 250 to 1719 m above mean sea level. There are 12 boreholes and 2 springs that are part of the groundwater quality monitoring programme in the area. In terms of groundwater level, 19 groundwater monitoring boreholes indicated that groundwater levels ranged from 1.5 to 36 m below ground level. There are 994 registered groundwater users, with an allocation of 148.3 Mm3/a for various uses in the area. Although this study focuses on groundwater, other main waterbodies include rivers such as the Sandsloot and Mutamba, which are in the western side of the Soutpansberg region. In the central part, there are rivers such as the Mutshedzi, Nzhelele, and Nwanedi. The Mutshindudi, Luvuvhu, Mutale, Mbodi, and Shisha rivers are in the eastern side of the Soutpansberg region. There are also several dams in the Soutpansberg region, such as the Nzhelele, Nwanedi, Mutshedzi, and Vondo. The Soutpansberg region covers towns such as Louis Trichardt, Makhado, and Thohoyandou (Figure 1). In terms of land coverage in the Soutpansberg region, 27.5% of the area is covered by woodlands, cultivated land covers about 25.5%, 25.3% is covered by bushland, 13% is covered with forest plantation, 7.4% is covered by residential/ built-up area, water bodies cover 0.9%, and 0.4% is covered by natural rocks and soils. The spatial distribution of land cover is provided as supplementary material.
In terms of climatic condition, the area is in an arid region, with an average minimum temperature of 11 °C and an average maximum temperature of 32 °C, based on the seven South African Weather Services (SAWS) stations with data from 1980 to 2020. The Soutpansberg region experiences dry winter seasons (May–August) and wet summer seasons (December–February) with an average precipitation of 497.7 mm/a. The dominant geology that supports groundwater is the volcanic–sedimentary unit of the Soutpansberg Group, deposited as an east-west-gravitating asymmetrical rift beside the Palala Shear Belt about 1800 million years ago [32,33]. The Soutpansberg basin was formed between the Limpopo belt in the north and the Kaapvaal craton in the south. This volcanic–sedimentary Soutpansberg Group mainly outcrops in the Soutpansberg Mountains, stretching from Punda Maria at the eastern side to Vivo at the western side [34,35]. The Soutpansberg Group is subdivided into five formations (Figure 1), which are the Tshifhefhe, Sibasa, Fundudzi, Wyllie’s Poort, and Nzhelele Formations [36]. The dominant aquifer type in the Soutpansberg region is the fractured aquifer, with an average borehole yield ranging between 0 and 0.5 l/s. Some small part of this fractured aquifer average borehole yield can reach 2 l/s. The southern part of the Soutpansberg is underlain by intergranular and fractured aquifers, with an average borehole yield between 0 and 0.2 l/s.

3. Material and Methods

3.1. Sampling

There is an active groundwater quality monitoring network in the study area, comprising 12 boreholes and 2 geothermal springs where sampling has been taking place since 1995 twice a year (wet and dry seasons). The monitoring network was designed to monitor any influence on groundwater resources in the Soutpansberg region. The monitoring points are spatially distributed in the region. To evaluate the concentration levels of contaminants in the groundwater, 124 samples of physio-chemical parameters were analysed. These parameters include magnesium (Mg2+), calcium (Ca2+), sodium (Na+), potassium (K+), bicarbonate (HCO3), chloride (Cl), nitrate (NO3), sulphate (SO42−), and fluoride (F). Total dissolved solids (TDS) were calculated based on in situ measurements of electrical conductivity (EC) using Equation (1) [37]. In situ measurements of pH and temperature were taken at each sampling point using a handheld multi-parameter probe. Groundwater samples were collected using the methods proposed by [37], by which samples were collected after purging the borehole until electrical conductivity (EC), pH, and temperature stabilised. Purging of the borehole is important, as it allows a representative sample of the aquifer to be collected. Groundwater from the spring was collected directly from the eye of the spring. The groundwater was collected using 500 mL polyethylene sampling bottles. The samples between 1995 and 2017 (124 samples) were analysed at the Department of Water and Sanitation laboratory. Cations were analysed using Inductively Coupled Plasma Mass Spectrometry (ICP-MS), and anions were analysed using Ion Chromatography. The results are available as records reviewed from the Department of Water and Sanitation’s Water Management System database. To ensure that there are no uncertainties with the data, ion balance error was determined to be between 0.0 and 9%, which is lower than the allowable range of 10% [38].
TDS = 6.3 × EC   ( mS m )

3.2. Evaluation of the Chemical Composition of Groundwater

The analysed 124 samples of major ions and physical parameters were statistically assessed using Microsoft Excel to determine the concentration levels of contaminants in the Soutpansberg region. The statistical analysis tool was used to determine the mean, minimum, maximum, and standard deviation of various contaminants. The ArcGis inverse distance weighting (IDW) tool was used to map the spatial distribution of the concentration levels of contaminants. The determined concentration levels of contaminants in the groundwater were used to compare ambient groundwater quality to various standards. Mean values from the 14 monitoring sites were used to plot Piper tri-linear diagrams [39] to understand the water type and hydro-geochemical facies in the Soutpansberg region.

3.3. Evaluation of Groundwater Quality for Domestic and Irrigation Purposes

To evaluate the suitability of groundwater for domestic use in the Soutpansberg region, 124 samples of major ions and physical parameters were compared to [20,21] drinking water standards. The suitability of groundwater for irrigation purposes was evaluated by using Equations (2)–(6), which are expressed below. The sodium adsorption ratio (SAR), sodium percentage (Na%), permeability index (PI), residual sodium carbonate (RSC), and magnesium hazard (MH) were calculated in meq/L from the 124 samples. The subject of parachute research and the sharing of knowledge with groundwater users was discussed based on the outcome of these methods.
SAR = Na + / ( Ca 2 + + Mg 2 + ) / 2
Na% = [(Na+ + K+)/(Ca2+ + Mg2+ + Na+ + K+)] × 100
PI = [(Na+ + HCO3)/(Ca2+ + Mg2+ + Na+)] × 100
RSC = ( CO 3 2 + HCO 3 ) ( Ca 2 + + Mg 2 + )
MH = (Mg2+ × 100)/(Ca2+ + Mg2+)

4. Results and Discussions

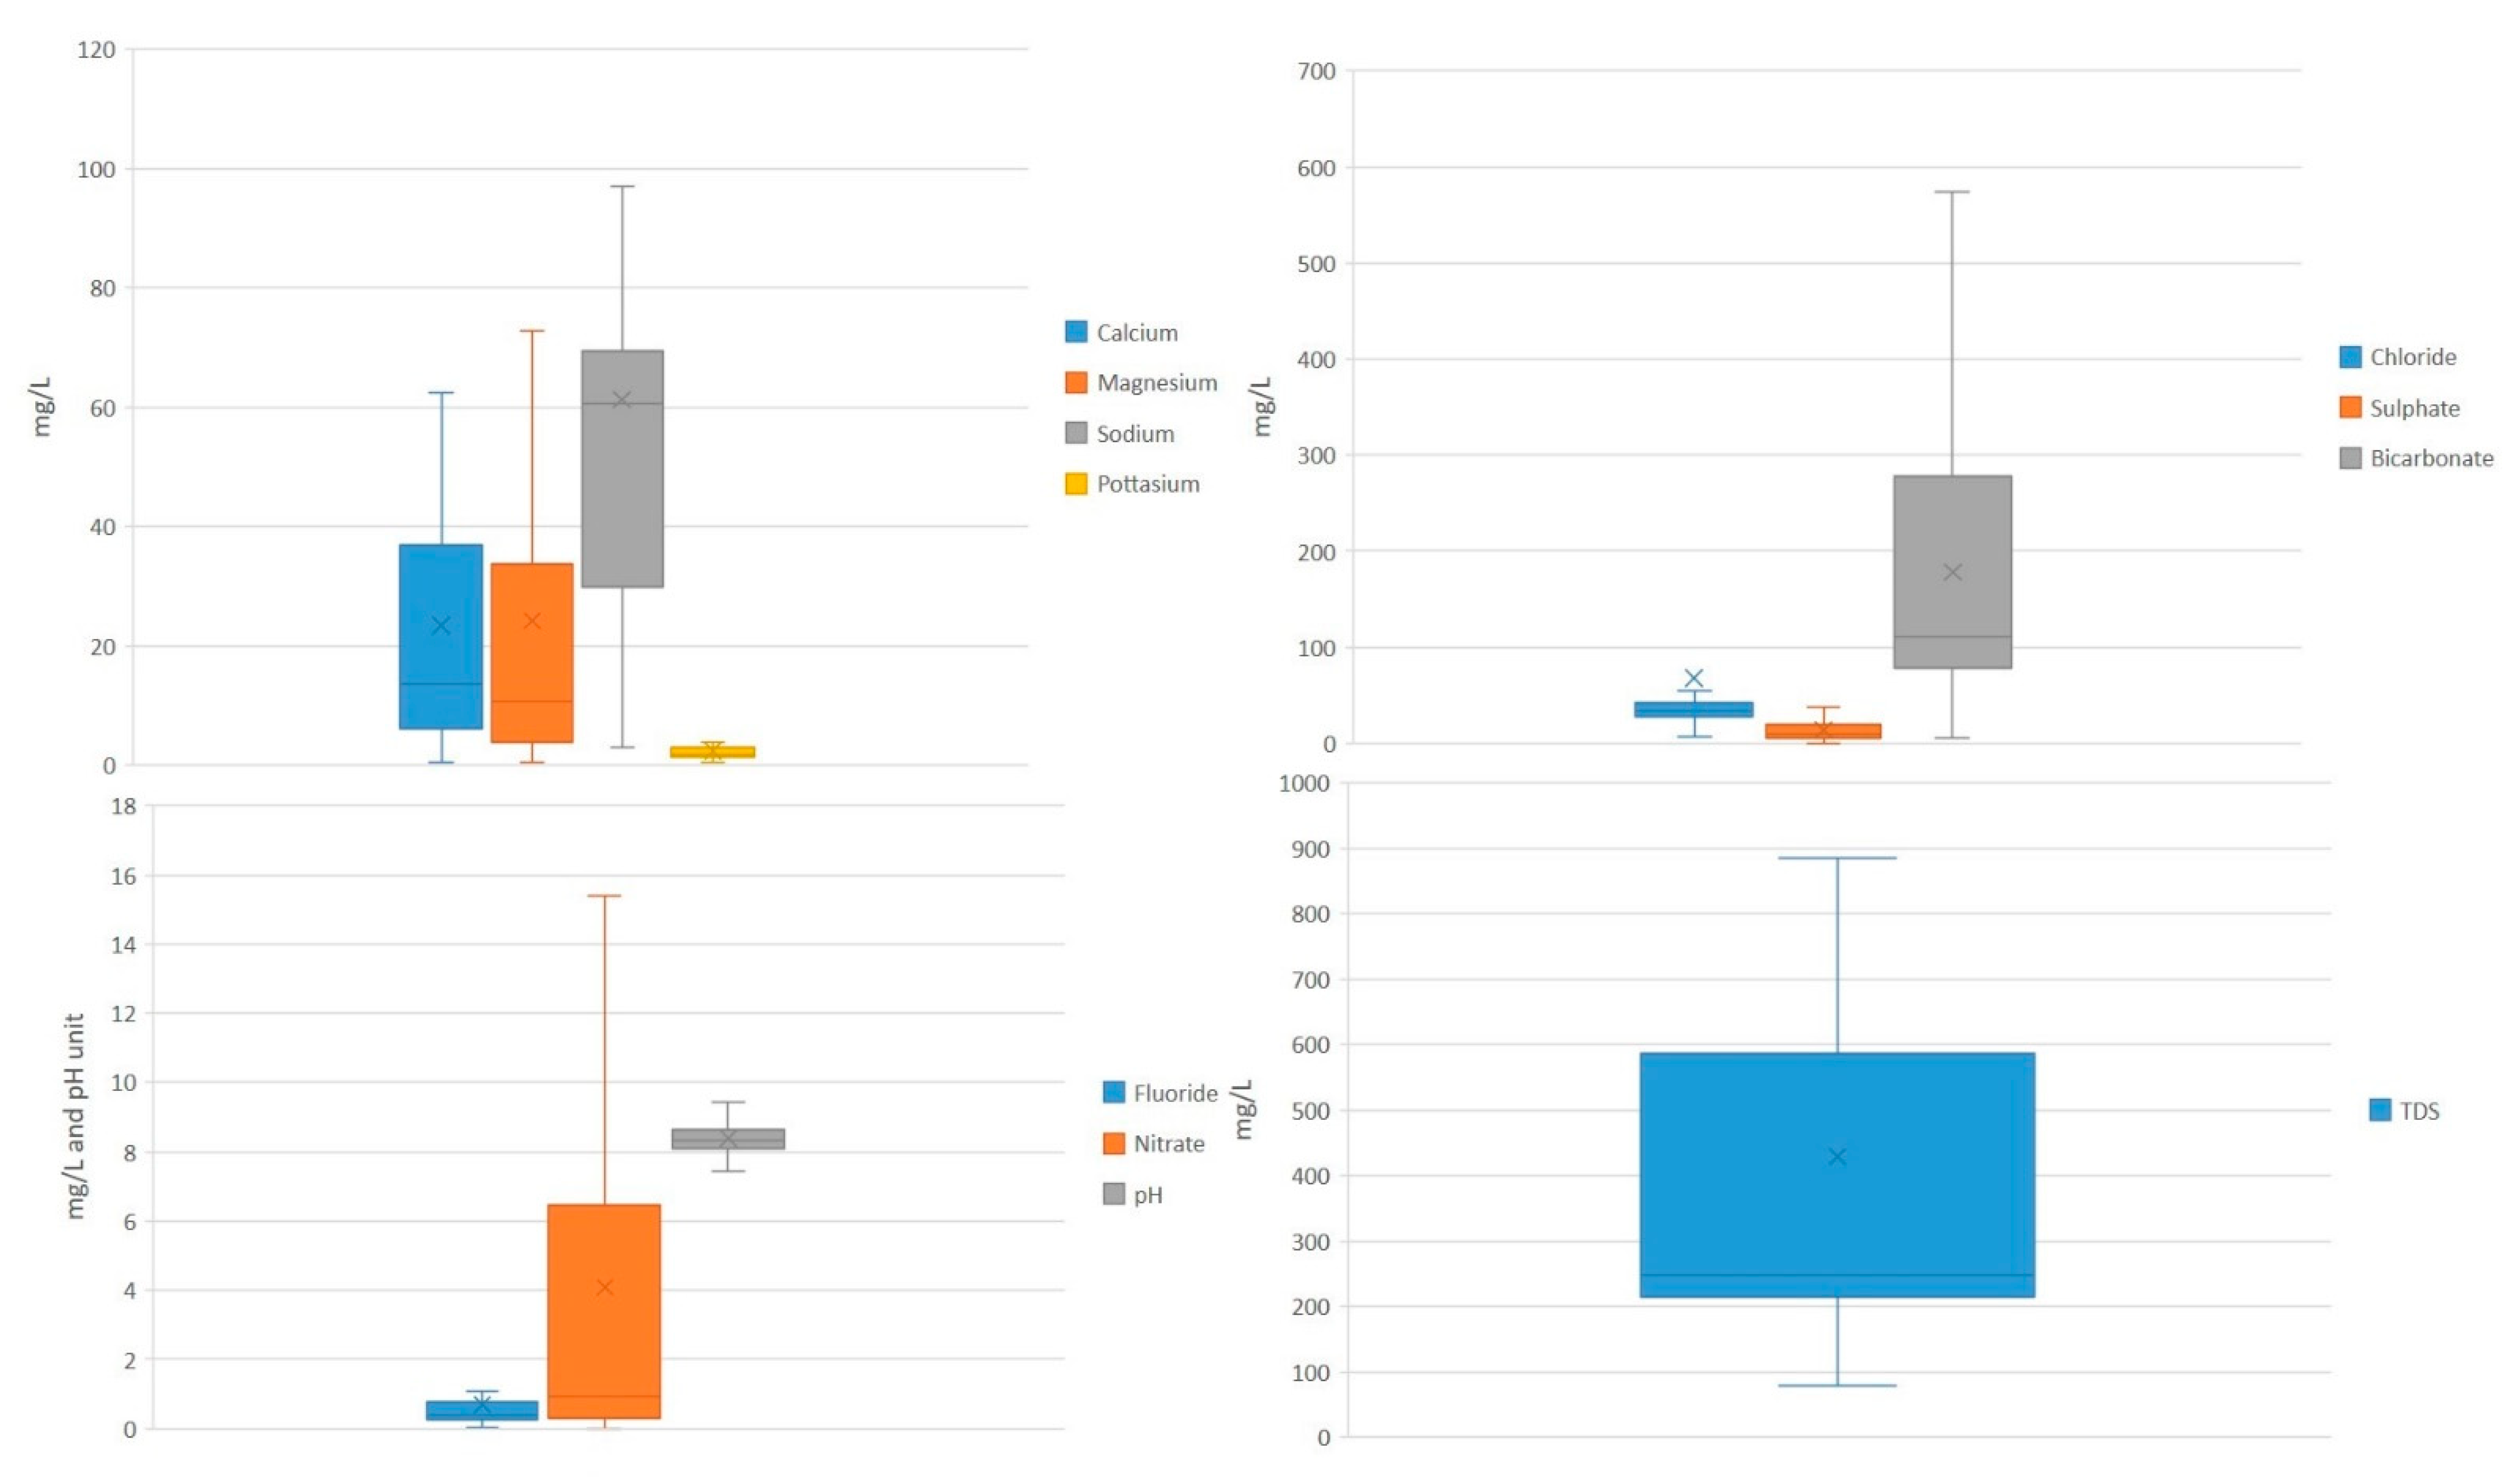
4.1. Chemical Composition of Groundwater

The descriptive statistical analysis of chemical constituents of the 124 samples of the Soutpansberg region is presented in Table 1 and Figure 2. The correlation matrix of the parameters is tabulated in Table 2. It is commonly accepted that pH is the primary parameter that is used to measure water quality in nature if it is acidic (pH < 7), Neutral (pH = 7), or alkaline (pH > 7) [40]. Groundwater in the Soutpansberg region is slightly acidic to alkaline, as the pH ranges from 6.7 to 9.6. The mean pH in groundwater of the area is 8.4, which indicates that groundwater is more alkaline (Table 1). High alkalinity in the Soutpansberg area is linked with high concentrations of sodium, magnesium, calcium, and bicarbonate ions, owing to the mafic–ultramafic igneous rocks dominant in the area. These ions are commonly known to increase the value of pH [41]. In terms of seasonal variation, there is not much difference in pH between dry and wet seasons in the Soutpansberg region.
Salinity as TDS in the region ranged from 32 to 1808 mg/L, with a mean of 327 mg/L. The spatial distribution of TDS is presented in Figure 3, where mean concentrations of 1418 and 1784 mg/L at Maebane and Punda Maria villages were recorded, respectively. Groundwater in these areas is considered to be brackish, according to TDS classification in Table 3 [42]. There is a strong correlation between the spatial distributions of Cl and TDS (Figure 3 and Figure 4), and this suggests that salinity in the groundwater is high in the Maebane and Punda Maria villages. There is a correlation between salinity and human settlements (including irrigated area) in the Soutpansberg region, and this observation is common, as activities in such areas are associated with various types of anthropogenic factors such as fertilisers and pit-latrines. Geogenic sources can also contribute to high salinity in groundwater. A study by the authors of [43] found that spatial variation of groundwater quality correlates with agricultural activities. Seasonal variation does not affect salinity in the area, as there is no difference between wet (378 mg/L) and dry (372 mg/L) season mean TDS. In general, 91.1% of groundwater in the Soutpansberg region is classified as fresh, and 8.9% is classified as brackish (Table 3). The classification of groundwater based on TDS in this study is similar to findings made by the author of [17], who determined that groundwater in the Soutpansberg region is fresh to brackish.
The concentration levels of various contaminants are presented in Table 1, where the cation dominance order is Na+ > Mg2+ > Ca2+ > K+, and that of the anions is HCO3 > Cl > SO42−> NO3 > F. In terms of water types classified by a Piper diagram [39], a study by the authors of [43] used this diagram to deduce anthropogenic and geogenic sources of contaminants in groundwater. The dominant water types in the Soutpansberg were Ca-HCO3 (35.7%) and mixed Ca-Mg-Cl (35.7%), as presented in Figure 8. Ca-HCO3 is classified as typical shallow, fresh, and recently recharged water. Bicarbonate ion (HCO3) concentrations in groundwater ranged from 5 to 612 mg/L, with a mean of 170 mg/L. In terms of seasonal variation, a mean HCO3 concentration of 141 and 178 mg/L were recorded in wet and dry seasons, respectively, indicating a seasonal variation difference of 37 mg/L (20.8%). The majority of samples and mean concentrations of HCO3 are within the [20,21] standards (in the absence of groundwater quality standards). Concentration levels of Cl ranged from 5 to 755 mg/L, with a mean of 75 mg/L. The spatial distribution of mean Cl concentrations in groundwater of the Soutpansberg region indicates that it is highly concentrated where TDS concentrations are high (Figure 4). The mean concentrations of Cl in groundwater are slightly higher in the wet season (99 mg/L) compared to those in the dry the season (68 mg/L). Monitoring sites with high salinity were associated with mixed Ca-Mg-Cl (ZQMMBI1-Maebane) and Na-Cl (ZQMPMA1- Punda Maria) water types (Figure 8), indicating possibilities of mixing between fresh and recently recharged water with saline water. Mean concentration levels of SO42− in groundwater in the wet season (15 mg/L) were slightly above the dry season (14 mg/L) concentrations. NO3 concentration levels in groundwater of the area ranged between 0.01 and 37 mg/L, with a mean of 4 mg/L. NO3 is highly concentrated in villages, such as Maebane (22.3 mg/L), Gogogo (15 mg/L), and Tshitavha Sambandou (15 mg/L), as presented in Figure 5. Water from these villages where NO3 concentration levels were high was classified as mixed Ca-Mg-Cl types. A study by the authors of [24] found that NO3 levels were 8.8 times the recommended limit, and they stated that NO3 occurrences and distributions in groundwater are mostly associated with applications of fertilisers, leakage from septic tanks/sewage, and leachate from landfill sites. In the Soutpansberg area, high NO3 concentration levels can be associated with leaching from pit-latrines and applications of fertilisers in the fractured aquifer. There is a difference of 1.5 mg/L in mean NO3 concentrations in groundwater between the wet (2.5 mg/L) and dry (4 mg/L) seasons. NO3 concentration is 67% higher in the dry season as compared to that of the wet season. Spatial distributions of F are presented in Figure 6, showing where it is highly concentrated around the Nzhelele (ZQMSOU1) area, with a mean of 2.5 mg/L. The mean concentration levels of F in the Nzhelele area are over the prescribed limit of 1.5 mg/L [20,21]. Groundwater from the geothermal spring in the Nzhelele is highly concentrated with F. The range of F concentration levels in the groundwater of the Soutpansberg region was from 0.03 to 2.9 mg/L, with a mean of 0.7 mg/L. Seasonal variation did not have any impact on F concentrations of groundwater, as geothermal springs are associated with deep ancient groundwater. The determined concentration of F is similar with the findings of [44], which indicates that mean F in the Nzhelele (Siloam) is above allowable standards [20,21]. The source of F in groundwater in this area results from the fluorite mineral associated with sedimentary and igneous rocks that are found in the Soutpansberg area [45,46]. In groundwater of Na-HCO3 type, dissolution of fluorite and precipitation of calcite result in the enrichment of F in groundwater [46]. Water from this geothermal spring was classified as Ca-Na-HCO3, indicating possibilities of mixing between fresh water and deep ancient water influenced by ion exchange (Figure 8).
In the absence of defined groundwater quality guidelines, a majority of samples contain cation concentration levels that are within the [20,21] prescribed limits for drinking water. High concentration levels of various parameters do not necessarily mean the aquifer is polluted, as it could be the quality of natural ambient groundwater. Mean wet and dry season concentration levels of cations are below the prescribed limit (Table 1). Cation concentration levels in groundwater of the Soutpansberg region are not highly influenced or affected by seasonal variations, as there is a slight difference in concentration levels between wet and dry season samples. Concentration levels of Na+, being the dominant cation, ranged from 3 to 440 mg/L, with a mean concentration of 65 mg/L. Na+ concentration is slightly higher in the wet season (76 mg/L) than in the dry season (61 mg/L). Na+ is highly concentrated in Maebane and Punda Maria, where concentrations of TDS and Cl are high. Salinity in groundwater seems to be a problem in these areas due to high concentrations of TDS, Cl, and Na+. Salinity in the Maebane and Punda Maria settlements is high in all seasons. Mg2+ concentration levels in groundwater ranged from 1 to 154 mg/L, with a mean of 23 mg/L. The spatial distribution of Mg2+ concentrations in groundwater is presented in Figure 7, showing that it is highly concentrated in the Maebane and Gogogo villages. Mean Mg2+ concentration levels of 77 and 118 mg/L were measured in the Gogogo and Maebane villages, respectively, and these concentration levels are above the prescribed limit of 70 mg/L [20,21]. Concentration levels of Ca2+ in groundwater of the Soutpansberg region ranged from 1 to 99 mg/L, with a mean of 22 mg/L. In terms of seasonal variation, mean Ca2+ concentration levels of 19 and 23 mg/L were recorded in wet and dry seasons, respectively. Concentration levels of K+ as the least dominant cation ranged from 0.2 to 10 mg/L with a mean of 2 mg/L, which is within the prescribed limit [20,21]. Comparing ambient groundwater with standards designed largely for surface and treated water such as in [21] can be misleading, as it may be perceived that the groundwater resource is polluted. For instance, TDS in the Maebane area have been over 1500 mg/L since 1994, and it has been steady at that concentration level for over 22 years. Some contaminants in groundwater are naturally high, owing to the geochemistry and geological setting (geogenic source) of the host aquifer, so there is a need to develop groundwater quality standards guided by historical data and geochemistry of aquifers (Figure 8). In cases where anthropogenic activities are determined to be contaminating a groundwater resource, sharing concentration levels of contaminants and research outcomes can assist communities to manage and protect the resource.

4.2. Suitability of Groundwater for Drinking Purposes

Groundwater should be free from pathogens and toxic chemicals in order to be deemed suitable for domestic uses, such as cooking and drinking [17]. Concentrations of various parameters from the 124 samples are compared with [20,21] standards in Table 1. These samples are also compared to TDS classifications [42] in Table 3 and [47] in Table 4. In terms of seasonal variations, 62.1% of the wet season and 74.7% of the dry season samples were suitable for drinking purposes in the Soutpansberg region. Even though there is no major difference in concentration levels, groundwater seems to be more suitable for drinking purposes in the dry season. This can be associated with the lack of mechanisms to enhance leaching/transport of contaminants in the dry season. Overall, groundwater in 73.4% of the samples was deemed suitable for drinking purposes, as all parameters were within the prescribed limits [20,21]. According to the Department of Water and Sanitation’s Water Authorization and Registration Management System (WARMS), 3.7 Mm3/a of groundwater is allocated for drinking purposes in the Soutpansberg region. This can become a challenge, as groundwater in 26.6% (37.9% and 25.3% in wet and dry seasons, respectively) of the samples was deemed not suitable for drinking purposes due to high concentrations of F, NO3, Mg2+, and salinity (TDS and Cl) in areas such as Maebane, Punda Maria, Tshitavha Sambandou, Gogogo, Nzhelele, and surrounding villages as presented in Figure 3, Figure 4, Figure 5, Figure 6 and Figure 7. These contaminants are high in boreholes/springs in residential settlements and irrigated areas. A majority of groundwater users in the Soutpansberg region are most likely not aware of the type of groundwater they are drinking on a daily basis. It is a basic human right to drink safe water to ensure good health [48]. The authors of [49] estimated that almost 80% of diseases result from polluted water and poor sanitation. For instance, concentrations of TDS in Punda Maria (ZQMPMA1) and Maebane (ZQMMBI1) areas were recorded at 1784 mg/L and 1418 mg/L, respectively, and, according to [50], water with elevated dissolved solids has the potential to affect individuals suffering from heart and kidney diseases as well to cause constipation and laxative effects. NO3, as one of the common disease-causing contaminants, can expose infants to baby blue syndrome [20,21]. F, which is highly concentrated in the Nzhelele area (Siloam), can cause dental fluorosis, according to [20]. A study by the authors of [45] found that, of the 87% of households that use groundwater for drinking purposes in the Siloam area, 85% of the members already have mottled teeth/ dental fluorosis. Based on the TDS classification by Freeze and Cherry [42], 91.1% of the samples were classified as fresh water, and 8.9% of the samples were classified as brackish (Table 3). Classification of TDS by [47] indicates that 72.6% of groundwater samples were desirable for drinking purpose. Additionally, 18.5% of groundwater samples in the Soutpansberg region were permissible for drinking purposes. Only 8.9% of the samples were not suitable for drinking purposes (Table 4). The main challenge is how the status of groundwater with respect to suitability for drinking purposes can be shared with groundwater users. Communicating with users that groundwater is not suitable for drinking purposes without treatment can protect them from possible water-borne diseases, improving their health and livelihood. For instance, rainfall and temperature are forecasted by weather services globally as an early warning system and are shared on various digital and print media. Groundwater custodians should start sharing groundwater quality statuses with groundwater users through various digital and print platforms and also with traditional authorities in rural areas. The situation discussed in [45], in which 85% of groundwater users had dental fluorosis in the Siloam area, can be avoided by sharing research outcomes with users while also accelerating the achievement of SDG 3 dealing with good health and well-being.

4.3. Suitability of Groundwater for Irrigation Purposes

High concentrations of salt in irrigation water can increase solution osmotic pressure and can also negatively affect the structure of soils, aeration, and permeability rate [51,52]. The suitability of groundwater of the Soutpansberg region for irrigation was assessed by estimating a number of parameters, such as Na%, SAR, MH, PI, RSC (Table 5), and TDS (Table 4). The major ions used are expressed in milliequivalents per litre (meq/L).

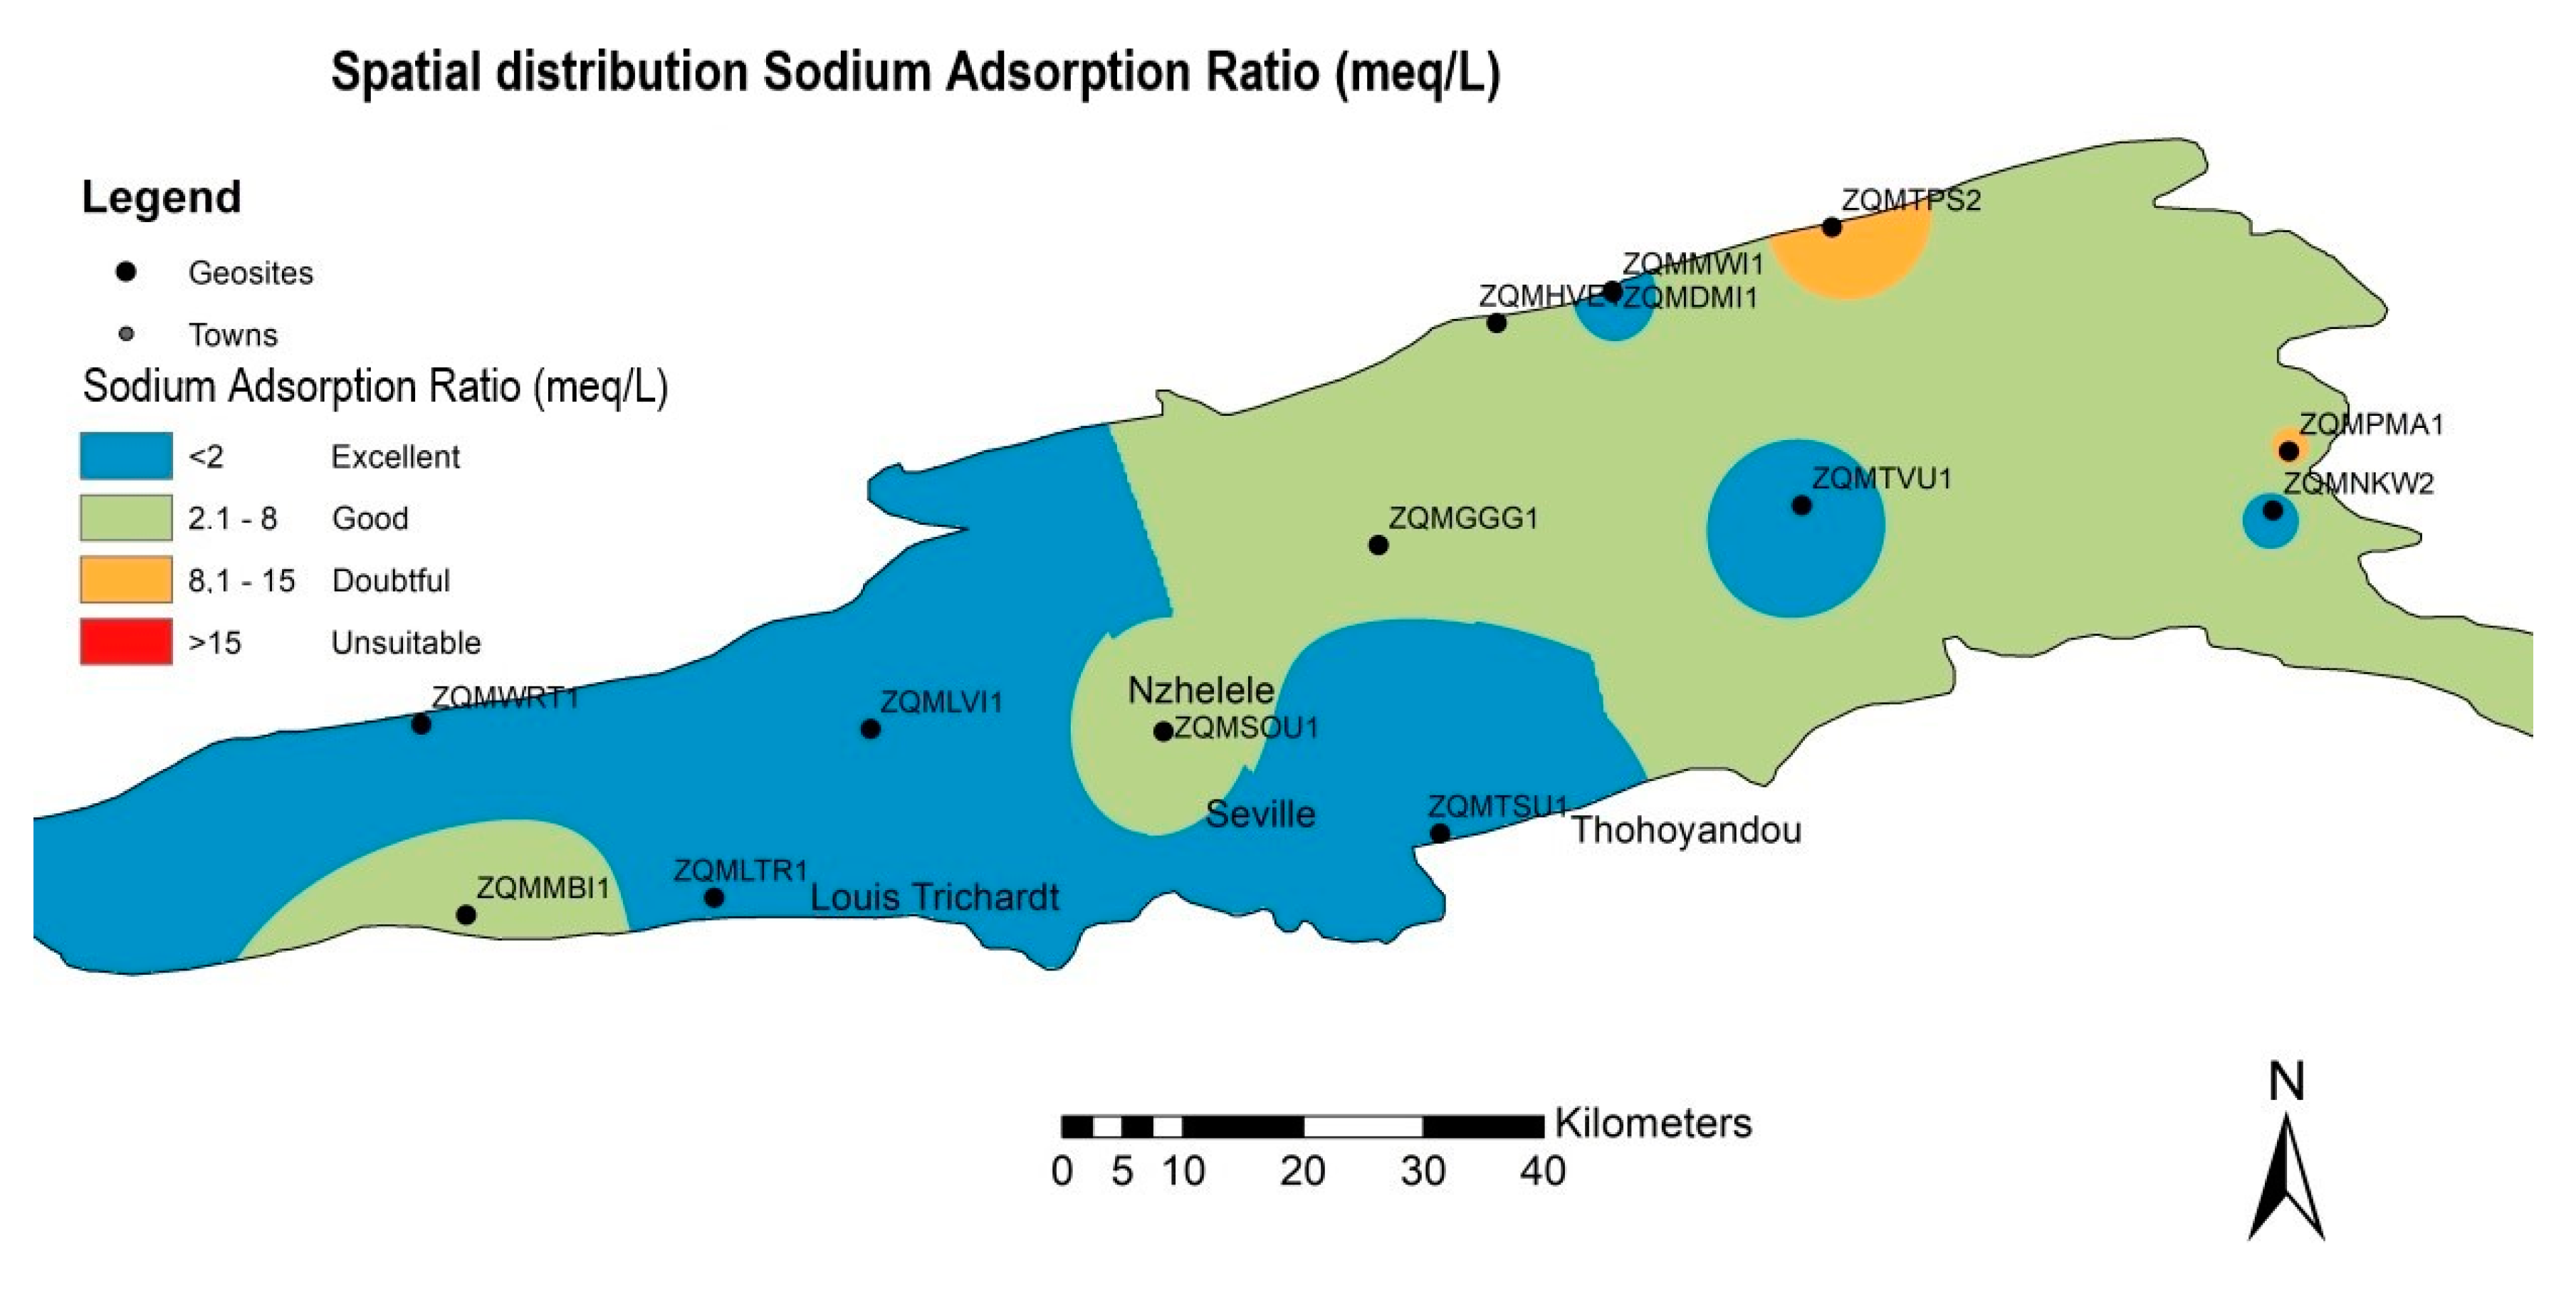
4.3.1. Alkali and Salinity Hazard (SAR)

The sodium adsorption ratio (SAR) is useful for determining the suitability of groundwater for irrigation purposes, as it measures both sodium and alkali hazards for plants [23]. High concentrations of sodium in irrigation water may have harmful effects in most soils as hardness is increased and permeability is reduced [53]. High concentrations of bicarbonate and relatively low calcium are also hazardous for irrigation water [54]. A high content of sodium relative to calcium and magnesium may cause sodicity in irrigation water. SAR calculations (Equation (2)) in the Soutpansberg region indicate that 75% of the samples were classified as excellent to good for irrigation purposes (Table 5). Additionally, 24.2% of the samples were doubtful, and 0.8% of the samples were unsuitable for irrigation purposes. Groundwater from Tshipise (geothermal spring) and Punda Maria were doubtful for irrigation purposes, as presented in Figure 9. Samples that were unsuitable for irrigation purposes (0.8%) are from the Tshipise geothermal spring (ZQMTPS2), where low mean concentrations of Ca2+ (2 mg/L) and Mg2+ in relation to Na+ (66 mg/L) are responsible for the unsuitability of groundwater for irrigation purposes, as low calcium is hazardous for irrigation [54]. Similar to suitability for drinking status, the communities and farmers that are using groundwater for irrigation purposes are deprived of this information, as most researchers and custodians of water publish research outputs and do not share them with the affected communities, which can have a negative impact on livelihood and food security in general.

4.3.2. Sodium Percentage (Na%)

Concentrations of sodium in groundwater are important in the classification of irrigation water. Na% was calculated using Equation (3), and results are presented in Table 5. The majority of groundwater samples in the study area were classified as excellent (3.2%), good (33.9%), and permissible (34.7%) for irrigation purposes. A Na% of over 60 can cause destruction of the structures of soil and negatively affects the growth of plants [53]. In the Soutpansberg region, 4.8% of the samples were doubtful (Na% = 60–80), and 23.4% (Na% > 80) were unsuitable for irrigation purposes. Samples with a Na% > 80 contain very low concentrations of Ca2+ (<3 mg/L), and this is hazardous for irrigation water according to [54]. Groundwater from the Tshipise geothermal spring is not suitable for irrigation purposes due to a low Ca2+ concentration.

4.3.3. Magnesium Hazard (MH)

Magnesium in groundwater influences the quality of soil by making it alkaline and reducing crop yield [55]. The magnesium hazard is calculated using Equation (6), as proposed by [56]. An MH of above 50 is deemed to be unsuitable for irrigation purposes. Groundwater in 75.8% of the samples was unsuitable for irrigation, as the MH was calculated to be over 50 (Table 5). The unsuitability of groundwater based on MH is a concerning issue, as 125.4 Mm3/a has been allocated for irrigation use in the Soutpansberg region. The MH in groundwater was below 50 in 24.2% of the samples, which are mostly from Tshipise (geothermal spring: ZQMTPS2). Samples that were not suitable for irrigation purposes based on MH resulted from a Ca2+ > Mg2+ ratio. Therefore, groundwater in most parts of the Soutpansberg region is not suitable for irrigation purposes based on magnesium hazard. To ensure food security, this information should be shared with the farming community and everyone using groundwater for irrigation purposes. Various digital and media platforms can be used to share the status of groundwater for irrigation uses; therefore, precautions can be taken before irrigating.

4.3.4. Permeability Index (PI)

The permeability index is based on Equation (4) and is used to classify irrigation water, as proposed by [57]. Water from class I (PI > 75) and class II (PI 75–25) is considered to be suitable for irrigation, whereas class III is considered to be unsuitable. The PI results from the study area are tabulated in Table 5, in which 2.4% of the samples are good (Class I) and 85.5% of the samples are permissible (Class II) for irrigation purposes. Only 12.1% of the samples were not suitable (Class III, PI < 25), resulting from high concentrations of HCO3 and relatively low Ca2+ concentrations in groundwater, which is hazardous for irrigation water [54].

4.3.5. Residual Sodium Carbonate (RSC)

High concentrations of carbonate and bicarbonate ions relative to calcium and magnesium (alkaline earth) can result in the complete precipitation of calcium and magnesium [58]. Residual sodium carbonate (RSC) calculated using Equation (5) was measured in the Soutpansberg region to understand the effects of bicarbonate and carbonate on groundwater. High RSC values in water result in an increase of adsorption of sodium in soil [59]. Water with RSC of less than 2.5 is considered suitable for irrigation purposes. All 124 groundwater samples were suitable for irrigation purposes, as the RSC was less than 2.5 (Table 5).

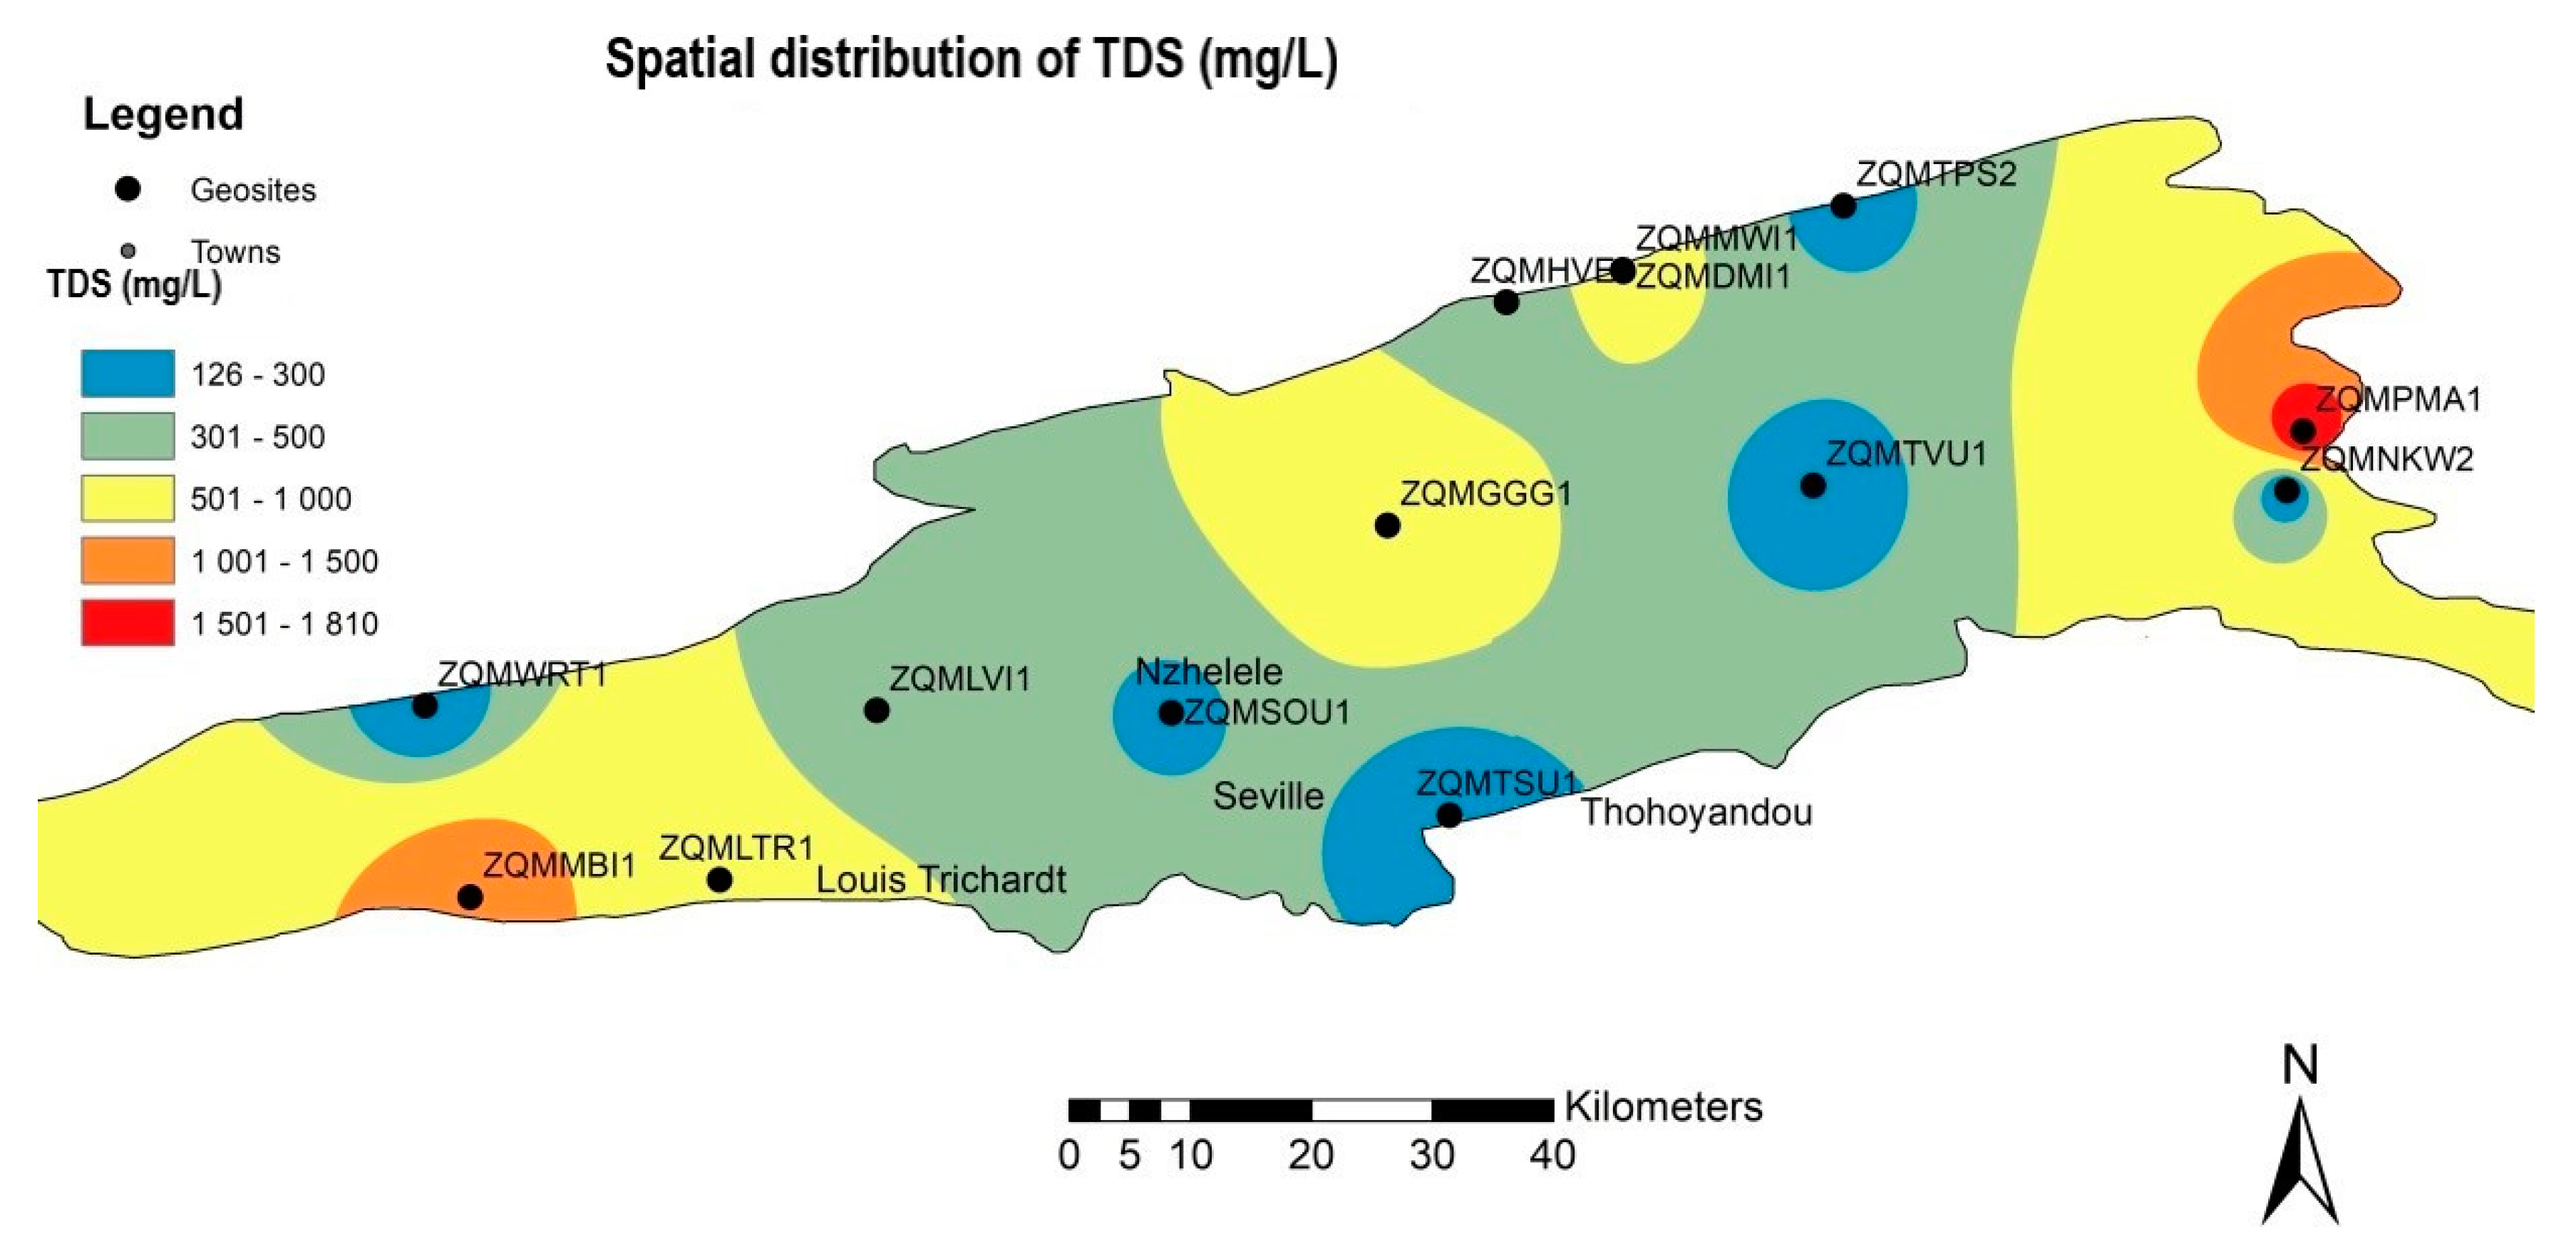
4.3.6. Total Dissolved Solids (TDS)

Suitability of groundwater for irrigation can be determined by using [47] TDS classification (Table 4). Irrigation water with TDS of less than 3000 mg/l is considered suitable/useful for irrigation purposes. TDS concentration levels in groundwater ranged from 32 to 1808 mg/L, which is within the useful limit for irrigation. Therefore, groundwater in the Soutpansberg region is suitable for irrigation based on TDS.

5. Conclusions

Groundwater in the Soutpansberg region was slightly acidic to alkaline and was classified as fresh to brackish in nature. Concentration levels of parameters such as F, NO3, Cl, and TDS were high and above the prescribed limit in various areas and villages in the study area. Seasonal variation did not influence the concentration levels of the parameters identified, as there is no significant difference in both wet and dry season samples. There is a correlation between high concentration levels of contaminants such as NO3 and TDS and human settlements areas. Concentration levels of these contaminants were high in settlements such as Gogogo, Maebane, Nzhelele, Punda Maria, and Tshitavha Sambandou, where groundwater was not suitable for drinking purposes. Overall groundwater was suitable for drinking purposes in most parts of the Soutpansberg region based on the physiochemical analysis. Various methods used to determine the suitability of groundwater for irrigation purposes gave contrasting results. TDS, Na%, SAR, PI, and RSC determined that groundwater was suitable for irrigation purposes. MH determined that groundwater was not suitable for irrigation purposes due to low Ca2+ in the groundwater. Considering all methods combined, groundwater seemed suitable for irrigation purposes in the Soutpansberg region. The presence of contaminants such as F, NO3, and salinity in groundwater poses a health risk to communities using groundwater for drinking purposes without any form of treatment. This study recommends that the status of groundwater quality in relation to suitability for drinking and irrigation purposes should be shared on digital and print media and, if possible, to community leaders by researchers and custodians of groundwater. Sharing information with affected communities is important, as it can stop parachute research. There is also a need to develop groundwater quality guidelines for various aquifers to avoid comparing groundwater quality with treated water standards. This study further recommends that there is a need to determine hydro-geochemical-influencing groundwater quality in the Soutpansberg region. There is also a need to monitor groundwater for biological parameters in the area due to excessive usage of pit-latrines and livestock farming. Consequently, proper management of groundwater and remediation should be considered before utilizing groundwater for drinking purposes.

Supplementary Materials

The following supporting information can be downloaded at: https://www.mdpi.com/article/10.3390/w14091354/s1, Figure S1. The spatial distribution of land cover.

Author Contributions

L.L. was responsible for data collection, data analysis, and drafting of the manuscript. T.K. was responsible for conceptualisation of the research problem, interpretation of the results, and reviewing of the manuscript. T.K. is the academic supervisor of the corresponding author. All authors have read and agreed to the published version of the manuscript.

Funding

This research was funded by the Department of Water and Sanitation (South Africa).

Data Availability Statement

Not Applicable.

Acknowledgments

This paper is a part of the Ph.D. project of the corresponding author. The authors gratefully acknowledge the Department of Water and Sanitation (DWS) and South Africa Weather Services (SAWS) for their assistance with historical data.

Conflicts of Interest

The authors declare no conflict of interest.

References

  1. Raheli-Namin, S.; Mortazavi, M.; Mobinifar, M.A. Groundwater quality probability mapping and assessment for domestic and irrigation purposes in Ghara-Su Basin of Golestan Province. Iran. J. Mater. Environ. Sci. 2016, 7, 259–271. [Google Scholar]
  2. Li, P.; He, S.; Yang, N.; Xiang, G. Groundwater quality assessment for domestic and agricultural purposes in Yan’an City, northwest China: Implications to sustainable groundwater management on the Loess Plateau. Environ. Earth. Sci. 2018, 77, 775. [Google Scholar] [CrossRef]
  3. Wu, J.; Zhou, H.; He, S.; Zhong, Y. Comprehensive understanding of groundwater quality for domestic and agricultural purposes in terms of health risks in a coal mine area of the Ordos basin, north of the Chinese Loess Plateau. Earth. Sci. 2019, 78, 446. [Google Scholar] [CrossRef]
  4. He, X.; Li, P.; Ji, Y.; Wang, Y.; Su, Z.; Elumalai, V. Groundwater arsenic and fluoride and associated arsenicosis and fluorosis in China: Occurrence, distribution and management. Expo. Health 2020, 12, 355–368. [Google Scholar] [CrossRef]
  5. Jalees, M.I.; Farooq, M.U.; Anis, M. Hydrochemistry modelling: Evaluation of groundwater quality deterioration due to anthropogenic activities in Lahore, Pakistan. Environ. Dev. Sustain. 2020, 23, 3062–3076. [Google Scholar] [CrossRef]
  6. Selvakumar, S.; Chandrasekar, N.; Kumar, G. Hydrogeochemical characteristics and groundwater contamination in the rapid urban development areas of Combatore, India. Water Resour. Urban Ind. J. 2017, 17, 26–33. [Google Scholar] [CrossRef]
  7. Aladejana, J.A.; Kalin, R.M.; Sentenac, P.; Hassan, I. Assessing the impact of climate change on groundwater quality of the shallow coastal aquifers of Eastern Dahomey Basin, Southwestern Nigeria. Water 2020, 12, 224. [Google Scholar] [CrossRef] [Green Version]
  8. Napacho, A.; Manyele, V. Quality assessment of drinking water in Temeke district (Part II): Characterization of chemical parameters. Afr. J. Environ. Sci. Technol. 2010, 4, 775–789. [Google Scholar]
  9. Li, P.; Wu, J.; Qian, H. Hydrochemical appraisal of groundwater quality for drinking and irrigation purposes and the major influence factors: A case study in and around Hua County, China. Arab. J. Geosci. 2016, 9, 15. [Google Scholar] [CrossRef]
  10. Hwang, J.Y.; Park, S.; Kim, H.-K.; Kim, M.-S.; Jo, H.-J.; Kim, J.-I.; Lee, G.-M.; Shin, I.-K.; Kim, T.-S. Hydrochemistry for the assessment of groundwater quality in Korea. J. Agric. Chem. Environ. 2017, 6, 1–29. [Google Scholar] [CrossRef] [Green Version]
  11. Wu, J.; Wang, L.; Wang, S.; Tian, R.; Xue, C.; Feng, W.; Li, Y. Spatiotemporal variation of groundwater quality in an arid area experiencing long-term paper wastewater irrigation, northwest China. Environ. Earth Sci. 2017, 76, 460. [Google Scholar] [CrossRef]
  12. Coomar, P.; Mukherjee, A. Global geogenic groundwater pollution. In Global Groundwater; Elsevier: Amsterdam, The Netherlands, 2021; pp. 187–213. [Google Scholar] [CrossRef]
  13. Apollaro, C.; Fuoco, I.; Brozzo, G.; De Rosa, R. Release and fate of Cr (VI) in the ophiolitic aquifers of Italy: The role of Fe (III) as a potential oxidant of Cr (III) supported by reaction path modelling. Sci. Total Environ. 2019, 660, 1459–1471. [Google Scholar] [CrossRef] [PubMed]
  14. Prasanna, M.V.; Chidambaram, S.; Gireesh, T.V.; Ali, T.V.J. A study on hydrochemical characteristics of surface and subsurface water in and around Perumal Lake, Cuddalore District, Tamilnadu, South India. Environ. Earth Sci. 2010, 63, 31–47. [Google Scholar] [CrossRef]
  15. Mangoua, M.J.; Gone, D.L.; Kouassi, K.A.; N’guettia, K.G.; Douagui, G.A.; Savane, I.; Biemi, J. Hydrogeochmical assessment of groundwater quality in the Baya watershed (Eastern of Cote d’Ivoire). Afr. J. Agric. Res. 2015, 10, 4477–4489. [Google Scholar] [CrossRef] [Green Version]
  16. Taiwo, A.M.; Towolawi, A.T.; Olanigan, A.A.; Olujimi, O.O.; Arowolo, T.A. Comparative assessment of groundwater quality in rural and urban areas of Nigeria. In Research and Practices in Water Quality; Lee, T.S., Ed.; IntechOpen: London, UK, 2015; pp. 179–191. [Google Scholar] [CrossRef] [Green Version]
  17. Malaza, N. Hydrogeochemical assessment of groundwater quality in the Soutpansberg basin around Tshikondeni, Limpopo Province, South Africa. Geochem. Explor. Environ. Anal. 2017, 17, 35–41. [Google Scholar] [CrossRef]
  18. Brhane, G.K. Characterization of hydro chemistry and groundwater quality evaluation for drinking purpose in Adigrat area, Tigray, Northern Ethiopia. Water Sci. 2018, 32, 213–229. [Google Scholar] [CrossRef] [Green Version]
  19. Mokoena, P.; Kanyerere, T.; van Bever Donker, J. Hydrogeochemical characteristics and evaluation of groundwater quality for domestic and irrigation purposes: A case study of the Heuningnes Catchment, Western Cape Province, South Africa. Appl. Sci. 2020, 2, 1–12. [Google Scholar] [CrossRef]
  20. WHO. Guidelines or Drinking-Water Quality, 4th ed.; World Health Organization: Geneva, Switzerland, 2011. [Google Scholar]
  21. South African National Standard 241-1; 2015 Drinking Water, Part 1: Microbiological, Physical, Aesthetic and Chemical Determinands. 241-2: 2015 Drinking Water, Part 2: Application of SANS 241-1. SABS (South African Bureau of Standards): Pretoria, South Africa, 2015.
  22. Eyinla, D.S.; Oladunjoye, M.A. Improving quality agricultural practices in tropical environments through integrated geophysical methods. IOSR J. Appl. Geol. Geophys. 2014, 2, 128–139. [Google Scholar] [CrossRef]
  23. Ntanganedzeni, B.; Elumalai, V.; Rajmohan, N. Coastal aquifer contamination and geochemical processes evaluation in Tugela catchment, South Africa—Geochemical and statistical approaches. Water 2018, 10, 687. [Google Scholar] [CrossRef] [Green Version]
  24. Chande, M.M.; Mayo, A.W. Assessment of groundwater vulnerability and water quality of Ngwerere sub-catchment urban aquifer in Lusaka, Zambia. Phys. Chem. Earth 2019, 112, 113–124. [Google Scholar] [CrossRef]
  25. Papazotos, P.; Koumantakis, I.; Vasileiou, E. Hydrogeochemical assessment and suitability of groundwater in a typical Mediterranean coastal area: A case study of the Marathon basin, NE Attica, Greece. Hydro Res. 2019, 2, 49–59. [Google Scholar] [CrossRef]
  26. Adimalla, N.; Taloor, A.K. Hydrogeochemical investigation of groundwater quality in the hard rock terrain of South India using Geographic Information System (GIS) and groundwater quality index (GWQI) techniques. Groundw. Sustain. Dev. 2019, 10, 100288. [Google Scholar] [CrossRef]
  27. Egbueri, J.C. Groundwater quality assessment using pollution index of groundwater (PIG), ecological risk index (ERI) and hierarchical cluster analysis (HCA): A case study. Groundw. Sustain. Dev. 2019, 10, 100292. [Google Scholar] [CrossRef]
  28. Zhou, Y.; Li, P.; Xue, L.; Dong, Z.; Li, D. Solute geochemistry and groundwater quality for drinking and irrigation purposes: A case study in Xinle City, North China. Geochemistry 2020, 80, 125609. [Google Scholar] [CrossRef]
  29. Xia, C.; Liu, G.; Xia, H.; Jiang, F.; Meng, Y. Influence of saline intrusion on the wetland ecosystem revealed by isotopic and hydrochemical indicators in the Yellow River Delta, China. Ecol. Indic. 2021, 133, 108422. [Google Scholar] [CrossRef]
  30. Xu, P.; Feng, W.; Qian, H.; Zhang, Q. Hydrogeochemical Characterization and Irrigation Quality Assessment of Shallow Groundwater in the Central-Western Guanzhong Basin, China. Int. J. Environ. Res. Public Health 2019, 16, 1492. [Google Scholar] [CrossRef] [Green Version]
  31. Stengel, D.B.; O’Reilly, S.; O’Halloran, J. The Ecology of Transportation: Managing Mobility for the Environment. Environmental Pollution; Davenport, J., Davenport, J.L., Eds.; Springer: Dordrecht, The Netherland, 2006; Volume 10. [Google Scholar] [CrossRef]
  32. Brandl, G. The geology of the Tzaneen area. Explanation sheet. Geol. Surv. S. Afr. 1987, 2330, 55. [Google Scholar]
  33. Brandl, G. Soutpansberg Group: Catalogue of South African Lithostratigraphic units. SA Committee for stratigraphy. Counc. Geosci. 1999, 6, 39–41. [Google Scholar]
  34. Cheney, E.S.; Barton, J.M.; Brandl, G. Extent and age of the Soutpansberg sequences of southern Africa. S. Afr. J. Geol. 1990, 93, 664–675. [Google Scholar]
  35. Barton, J.M., Jr.; Pretorius, W. Soutpansberg age (1.85 Ga) magmatism and metallogenesis in southern Africa: A result of regional rifting. In Abstract: International Symposium on Plumes, Plates and Mineralization; University of Pretoria: Pretoria, South Africa, 1997. [Google Scholar]
  36. Barker, O.B. A proposed geotectonic model for the Soutpansberg Group within the Limpopo Mobile Belt, South Africa. Spec. Publ. Geol. Soc. S. Afr. 1983, 8, 181–190. [Google Scholar]
  37. Weaver, J.M.C.; Cave, L.; Talma, A.S. Groundwater Sampling, 2nd ed.; WRC Report No. TT303/07; Water Research Commission: Pretoria, South Africa, 2007. [Google Scholar]
  38. Weight, W.D. Hydrogeology Field Manual, 2nd ed.; McGraw-Hill Companies Inc.: New York, NY, USA, 2008. [Google Scholar]
  39. Piper, A.M. A graphical procedure in the geochemical interpretation of water analysis. A.M. Geophys. Union. Trans. 1944, 25, 914–928. [Google Scholar] [CrossRef]
  40. Kokkat, A.; Jegathambal, P.; James, E.J. Spatial and temporal variation in groundwater quality and impact on sea water in the Cauvery delta, South India. Int. J. Earth Sci. 2016, 9, 383–392. [Google Scholar]
  41. Deshpande, S.M.; Aher, K.R. Evaluation of groundwater quality and its suitability for drinking and agriculture use in parts of Vaijapur, District Aurangabad, MS, India. Res. J. Chem. Sci. 2012, 2, 25–31. [Google Scholar]
  42. Freeze, R.A.; Cherry, J.A. Groundwater; Prentice-Hall Inc.: Englewood Cliffs, NJ, USA, 1979. [Google Scholar]
  43. Apollaro, C.; Di Curzio, D.; Fuoco, I.; Buccianti, A.; Dinelli, E.; Vespasiano, G.; Castrignanò, A.; Rusi, S.; Barca, D.; Figoli, A.; et al. A multivariate non-parametric approach for estimating probability of exceeding the local natural background level of arsenic in the aquifers of Calabria region (Southern Italy). Sci. Total Environ. 2022, 806, 150345. [Google Scholar] [CrossRef]
  44. Odiyo, J.O.; Makungo, R.; Muhlarhi, T.G. The impacts of geochemistry and agricultural activities on groundwater quality in the Soutpansberg fractured aquifer. WIT Trans. Ecol. Environ. 2014, 182, 121–132. [Google Scholar] [CrossRef] [Green Version]
  45. Odiyo, J.O.; Makungo, R. Fluoride concentrations in groundwater and impact on human health in Siloam Village, Limpopo Province, South Africa. Water SA 2012, 38, 731–736. [Google Scholar] [CrossRef] [Green Version]
  46. Fuoco, I.; Marini, L.; De Rosa, R.; Figoli, A.; Gabriele, B.; Apollaro, C. Use of reaction path modelling to investigate the evolution of water chemistry in shallow to deep crystalline aquifers with a special focus on fluoride. Sci. Total Environ. 2022, 830, 154566. [Google Scholar] [CrossRef]
  47. Davis, S.N.; DeWiest, R.J. Hydrogeology; Wiley: New York, NY, USA, 1966. [Google Scholar]
  48. Jackson, R.B.; Carpenter, S.R.; Dahm, C.N.; McKnight, D.M.; Naiman, R.J.; Postel, S.L.; Running, S.W. Water in changing world, issues in Ecology. Ecol. Soc. Am. 2001, 11, 1027–1045. [Google Scholar] [CrossRef]
  49. WHO. Basic Environmental Health; World Health Organisation: Geneva, Switzerland, 1997. [Google Scholar]
  50. Sasikaran, S.; Sritharan, K.; Balakumar, S.; Arasaratnam, V. Physical, chemical and microbial analysis of bottled drinking water. J. Ceylon Med. 2012, 57, 775–789. [Google Scholar] [CrossRef] [Green Version]
  51. Thorne, D.W.; Peterson, H.B. Irrigated Soils; Constable and Company: London, UK, 1954. [Google Scholar]
  52. Hussain, M.; Rao, D.P. Assessment of the ground water quality and its suitability for drinking and irrigation purposes: A case study of Patancheru, Andhra Pradesh, India. Arch. Appl. Sci. Res. 2013, 5, 232–238. [Google Scholar]
  53. Bhat, M.A.; Wani, A.S.; Vijay, K.; Jyotirmaya, S.; Dinesh, T. An overview of the assessment of groundwater quality for irrigation. J. Agric. Sci. Food Res. 2018, 9, 209. [Google Scholar]
  54. Richards, L.A. Diagnosis and improvement of saline and alkali soils. In US Department of Agriculture, Agriculture Hand Book, 6th ed.; IBH Publishing Co.: Washington, DC, USA, 1954; p. 60. [Google Scholar]
  55. Gowd, S.S. Assessment of groundwater quality for drinking and irrigation purpose: A case study of Pedavanka Watershed. Anantapur District, Andhra Pradesh, India. Environ. Geol. 2005, 48, 702–712. [Google Scholar] [CrossRef]
  56. Szaboles, I.; Darab, C. The influence of irrigation water of high sodium carbonate content of soils. In Proceedings of 8th ISSS, Transaction 1964. Volume 2, pp. 802–812. Available online: https://www.scirp.org/(S(lz5mqp453edsnp55rrgjct55))/reference/ReferencesPapers.aspx?ReferenceID=1894382 (accessed on 20 March 2022).
  57. Doneen, L.D. Water Quality for Agriculture; Department of Irrigation, University of California: Davis, CA, USA, 1964; p. 48. [Google Scholar]
  58. Raghunath, H.M. Ground Water Hydrology; Second Reprint; Wiley: New Dehli, India, 2000. [Google Scholar]
  59. Eaton, F.M. Significance of Carbonates in irrigation waters. Soil Sci. 1950, 69, 123–134. [Google Scholar] [CrossRef]
Figure 1. Locality and geological map of the Soutpansberg region with existing groundwater monitoring stations.
Water 14 01354 g001
Figure 2. Box and whisker plots of various parameters.
Water 14 01354 g002
Figure 3. Spatial distribution of TDS in the Soutpansberg region.
Water 14 01354 g003
Figure 4. Spatial distribution of chloride in the Soutpansberg region.
Water 14 01354 g004
Figure 5. Spatial distribution of nitrate in the Soutpansberg region.
Water 14 01354 g005
Figure 6. Spatial distribution of fluoride in the Soutpansberg region.
Water 14 01354 g006
Figure 7. Spatial distribution of magnesium in the Soutpansberg region.
Water 14 01354 g007
Figure 8. Piper diagram [39] indicating water types in the Soutpansberg region.
Water 14 01354 g008
Figure 9. Spatial distribution of suitability of groundwater for irrigation based on SAR.
Water 14 01354 g009
Table 1. Descriptive statistical analysis of physiochemical parameters.
pHTDSCa2+Mg2+Na+K+ClHCO3NO3FSO42−
Wet Season N = 29
Min6.7331130.2560.010.031
Max9.41869831374601075545518.82.871
Mean8.44151920762991412.50.815
SD1.49694374246540823110.21.437
Dry Season N = 95
Min7.1801131750.010.031
Max9.61856991544151064661237368
Mean8.44302324612681784114
SD1.39415183223535231320236
All Seasons N = 124
Mean8.43722223652751704114
WHO (2011)6.5–8.510002001002001225050010
SANS 241 (2015)5–9.712001507020050300 111.5250
All units expressed in mg/L except pH. SD: standard deviation.
Table 2. Correlation coefficients of major physiochemical parameters in the Soutpansberg region.
pHECTDSCa2+Mg2+Na+K+ClSO42−HCO3FNO3
pH1
EC−0.21
TDS−0.11.01
Ca2+−0.20.90.91
Mg2+−0.10.80.80.81
Na+−0.20.90.90.80.61
K+0.00.60.60.60.90.31
Cl−0.21.01.00.90.71.00.41
SO42−0.20.60.70.60.80.40.90.51
HCO3−0.10.90.90.90.90.80.80.80.71
F0.2−0.1−0.1−0.2−0.20.010.05−0.10.03−0.11
NO32−−0.20.30.40.30.70.10.80.20.60.4−0.31
Bold = strong correlation (r > 0.7).
Table 3. Classification of groundwater based on TDS [42].
ClassificationTDS (mg/L) RangeNo. of Samples (%)
Fresh<1000113 (91.1%)
Brackish1000–10,00011 (8.9%)
Saline10,000–100,0000
Brine>100,0000
Table 4. Groundwater classification based on TDS [47].
TDS (mg/L)ClassificationNo. of Samples (%)
<500Desirable for drinking90 (72.6%)
500–1000Permissible for drinking23 (18.5%)
1000–3000Useful for irrigation11 (8.9%)
>3000Unfit for drinking and irrigation0
Table 5. Classification of groundwater samples for suitability for irrigation.
ParameterRangeWater ClassNo. of Samples(%)
Na%<20Excellent43.2
20–40Good4233.9
40–60Permissible4334.7
60–80Doubtful64.8
>80Unsuitable2923.4
SAR (meq/L)<2Excellent5746
2–8Good3629
8–15Doubtful3024.2
>15Unsuitable10.8
MH (%)<50Suitable3024.2
>50Unsuitable9475.8
PI (%)Class I (>75)Good32.4
Class II (75–50)Permissible10685.5
Class III (<25)Unsuitable1512.1
RSC (meq/L)<2.5Suitable124100
>2.5Unsuitable00
Publisher’s Note: MDPI stays neutral with regard to jurisdictional claims in published maps and institutional affiliations.

