Article

Greek Wine Quality Assessment and Relationships with Climate: Trends, Future Projections and Uncertainties

by
Georgios C. Koufos
1,
Theodoros Mavromatis
1,*,
Stefanos Koundouras
2,
Nikolaos M. Fyllas
3,
Serafeim Theocharis
2 and
Gregory V. Jones
4
1
Department of Meteorology and Climatology, School of Geology, Aristotle University of Thessaloniki, 54124 Thessaloniki, Greece
2
Laboratory of Viticulture, School of Agriculture, Aristotle University of Thessaloniki, 54124 Thessaloniki, Greece
3
Department of Environment, University of the Aegean, 81100 Mytilene, Greece
4
Abacela Vineyards and Winery, Roseburg, OR 97471, USA
*
Author to whom correspondence should be addressed.
Water 2022, 14(4), 573; https://doi.org/10.3390/w14040573
Submission received: 7 January 2022 / Revised: 4 February 2022 / Accepted: 8 February 2022 / Published: 14 February 2022

Abstract

:
Grapevine phenology is particularly sensitive to temperature variations, with changes in climate shifting events earlier and advancing berry maturation into a hotter part of the growing cycle. Consequently, serious concerns regarding the negative influences of climate change on global wine quality have been raised, with the scientific community focusing on documenting these changes to better understand and address the impacts. This study adds to this knowledge by investigating air temperature and precipitation trends over the last 40 years (i.e., 1980–2019). Over the most recent period of records (i.e., 2000–2019), minimum air temperatures significantly increased at a higher rate than maximum temperatures. On the other hand, precipitation showed the least significant trends over time. In addition, wine quality assessment and identification of the most significant weather variables and climatic indices that correlate with wine quality rating scores have also been performed. To serve this purpose, data of wine quality ratings for nine white (W) and two red (R) indigenous winegrape varieties (Vitis vinifera L., cvs) grown in Greece were obtained from the database of Thessaloniki International Wine and Spirits Competition. The results showed a statistically significant upward trend over the recent past in the majority of the varieties studied. To examine future periods, mixed-effect model outputs for Greek wine-producing regions combining an ensemble dataset using RCP4.5 and RCP8.5 emission pathways during two future periods (i.e., 2041–2065 and 2071–2095) predicts wines of higher quality, especially during the latter time period. These results reveal that Greek wine quality rating variations are mainly driven by higher maximum temperatures and drier conditions during the growing season of the grapevines. However, two important issues need to be more fully explored in Greece and elsewhere; (1) non-linear responses to warming where wine quality could suffer above varietally specific optimum temperature thresholds and (2) a better understanding of how other non-climate-related factors (e.g., canopy management, winemaking innovations) affect wine quality in the face of a changing climate.

1. Introduction

It is widely acknowledged that the combination of abiotic factors (climatic and edaphic), biotic factors, and human interventions (a notion internationally known as terroir) are considered essential to producing the desired wine style that reflects its distinctive characteristics according to origin [1]. It is also known that the world’s best winegrape regions have historically been located in relatively narrow geographic boundaries (between the 35th and the 50th parallels in the Northern Hemisphere and 30th and 45th parallels in the Southern Hemisphere), where physical terroir components perfectly interact to produce exceptional wines, preserving their unique reputation [2]. Within these limits, aspects of climate (i.e., mainly air temperature but also precipitation, solar radiation, wind, etc.) are some of the most critical environmental factors that together control the vegetative cycle, berry biochemistry, and ultimately wine quality [3].
The phenological calendar for grapevines starts in the spring with mean air temperature exceeding a specific threshold (from 0–10 °C, depending on the variety) triggering budburst from which temperatures, often measured via accumulated heat, determines the onset of flowering, véraison, and harvest [4,5]. With a warming climate, the phenology of many winegrape varieties within renowned wine-producing regions have shown a significant advancement over the last several decades [6]. The strong relationships between air temperature and phenology allow flowering and véraison events to be modelled with great accuracy, providing valuable tools to vine growers to adjust their viticultural techniques to the changing climate [7,8]. Moreover, air temperature affects berry chemical composition related to wine organoleptic properties [9]. Increasing temperatures can accelerate sugar accumulation and acid degradation in fruit [10,11], while too much warmth during the night may impair the synthesis of secondary metabolites such as anthocyanins and volatile compounds, leading to wines lacking aromatic expression and colour [12].
Regarding future conditions, it is very likely that climate change will expand the current limits of viable viticulture and add pressure to the traditional European areas located at lower latitudes [13,14]. As such, the suitability of a region to produce high-quality wines needs to be evaluated within the framework of wine-climate relationships. However, understanding how well weather conditions explain wine quality variation from year to year (i.e., vintage effect) is a challenging task [15]. On one hand, the contribution of other factors such as management, innovation techniques, tradition, and consumers’ preferences are not easily quantified. On the other hand, large datasets with vintage ratings around the world have shown that better vintages were characterized by fewer weather extremes (e.g., spring frost, heat waves, etc.), warmer conditions during the flowering and véraison phases, and a ripening period with a mild water deficit and limited temperature variability between day and night [16,17,18,19,20]. However, there is likely an upper growing season temperature threshold for many varieties within specific regions, beyond which the general rule of thumb “the warmer the better” is being questioned [15].
Winemaking is an important sector in many economies around the world. Greece, as part of the traditional “Old World” winegrape regions, has produced wine for centuries and ranks as the ninth-highest wine producing country in Europe [21]. The cultural and economic importance of the viticultural sector in Greece is mainly highlighted by: (i) total wine production reaching 2,200,000 hL in 2018 [21], (ii) the wide range of indigenous varieties (>300), currently cultivated across the Greek territory, representing approximately 100,000 ha of land under the protected designation of origin (Koufos et al. 2020), and (iii) wine exports that reached 274,000 hL in 2016 [22]. Two recent studies [23,24] categorised Greek winegrape areas using bioclimatic indices and investigated the relationships between harvest dates and berry composition (potential alcohol and acid levels) with the climate during critical periods of the vegetative cycle. The results showed that: (i) most of the areas were characterised as hot and very hot, (ii) harvest dates shifted significantly earlier in most of the varieties studied, and most importantly, (iii) the indigenous varieties appeared better adapted to recent and future warmer conditions by responding less than the respective international varieties. The latest study adds knowledge on the response of native varieties which might be heat tolerant enough to become the key adaptation measure to climate change to preserve the production of high-quality wines [25].
Therefore, this study focused on Greek wine quality trends and responses of the most important and yet rare indigenous grapevine varieties grown in Greece. Despite the importance of the viticultural sector to the Greek economy, the relationship between wine quality and climate is largely unexplored. Thus, the objectives of this study were: (i) to update the climate database from previous studies and examine air temperature and precipitation trends by adding the most recent period of record (i.e., 2011–2019), (ii) assess wine quality evolution of indigenous varieties grown in viticultural areas throughout the Greek territory, (iii) identify the most significant weather variables and climatic indices that correlate with wine quality ratings, and (iv) examine potential overall Greek wine quality due to future warming under different representative concentration pathways (i.e., RCP4.5 and RCP8.5) for two future periods (i.e., 2041–2065 and 2071–2095) using an ensemble dataset.

2. Materials and Methods

2.1. Wine Quality Ratings

While wine quality is inherently subjective and there is no one universal measure used to assess individual wines or vintages from a region, many have used vintage ratings as a metric (see [26]). Vintage ratings are available from various sources and compile relatively long timeseries over numerous winegrape regions around the world [20]. Practically, vintage ratings provide a wine score on a year/vintage basis for a given variety or an aggregate score for an entire region. A variety of ratings (i.e., wine quality scores) exist varying in scales according to their source (e.g., 1–5, 0–20 and more often 0–100) and/or categorical structure (e.g., “Superb”, “Exceptional” etc.) but originate under the same objective of providing a wine classification (derived from a wine expert or a panel of experts) based on flavour, aroma (typicity, persistence and intensity), clarity, sight, and total harmony evaluation [27].
To facilitate this study, data of wine quality ratings for nine white (W) and two red (R) winegrape varieties (Vitis vinifera L., cvs) grown in Greece, covering a period of approximately 14 years on average, were obtained from the database of the Thessaloniki International Wine and Spirits Competition (TIWC). The wine quality dataset consisted of 10 indigenous (Assyrtiko, Agiorgitiko, Athiri, Debina, Malagouzia, Moschofilero, Robola, Savatiano, Vilana and Xinomavro) and one widely cultivated international variety (Muscat of Alexandria). The majority of varieties are cultivated in specific regions, except for the indigenous varieties of Assyrtiko, Malagouzia, and Xinomavro, which are cultivated across multiple regions (Table 1), creating a total number of 14 wine quality timeseries. These varieties were previously classified as Early (E), mid-season (M), and late-ripening varieties (L) [24] and the respective abbreviations are used here in order to compare the wine scores from the produced wines in each class. The vast majority of the wine-producing locations belong to areas of protected designation of origin (PDO, hereafter), while the rest are simple geographical indications (GI, hereafter). This database was provided based upon anonymity and hence is not freely available. Details of wine quality time series along with the respective variety abbreviations and region locations are summarized in Table 1 and Figure 1. Wine quality rating scores for each variety were derived from a panel of wine experts, whose selection was based on their ability to recognise specific characteristics of a given variety in the evaluated wines. Wine rating scores (ranging from 0 to 100) greater than 84 corresponded to a medal category (i.e., 84–86 Bronze, 87–89 Silver, and >90 Gold medal). Lower scores (<70), although rarely appeared (in less than 1% of the cases) were excluded from the analysis. More than 4000 wines (international and indigenous varieties included) were obtained from the archive of TIWC. However, for the purposes of this study, a subset (approximately 2000 evaluated wines produced solely (except for Muscat of Alexandria, an international variety but with high importance in Greece) from indigenous varieties was used due to its importance in the Greek wine sector and economy.
The timeseries of each region was constructed as follow:
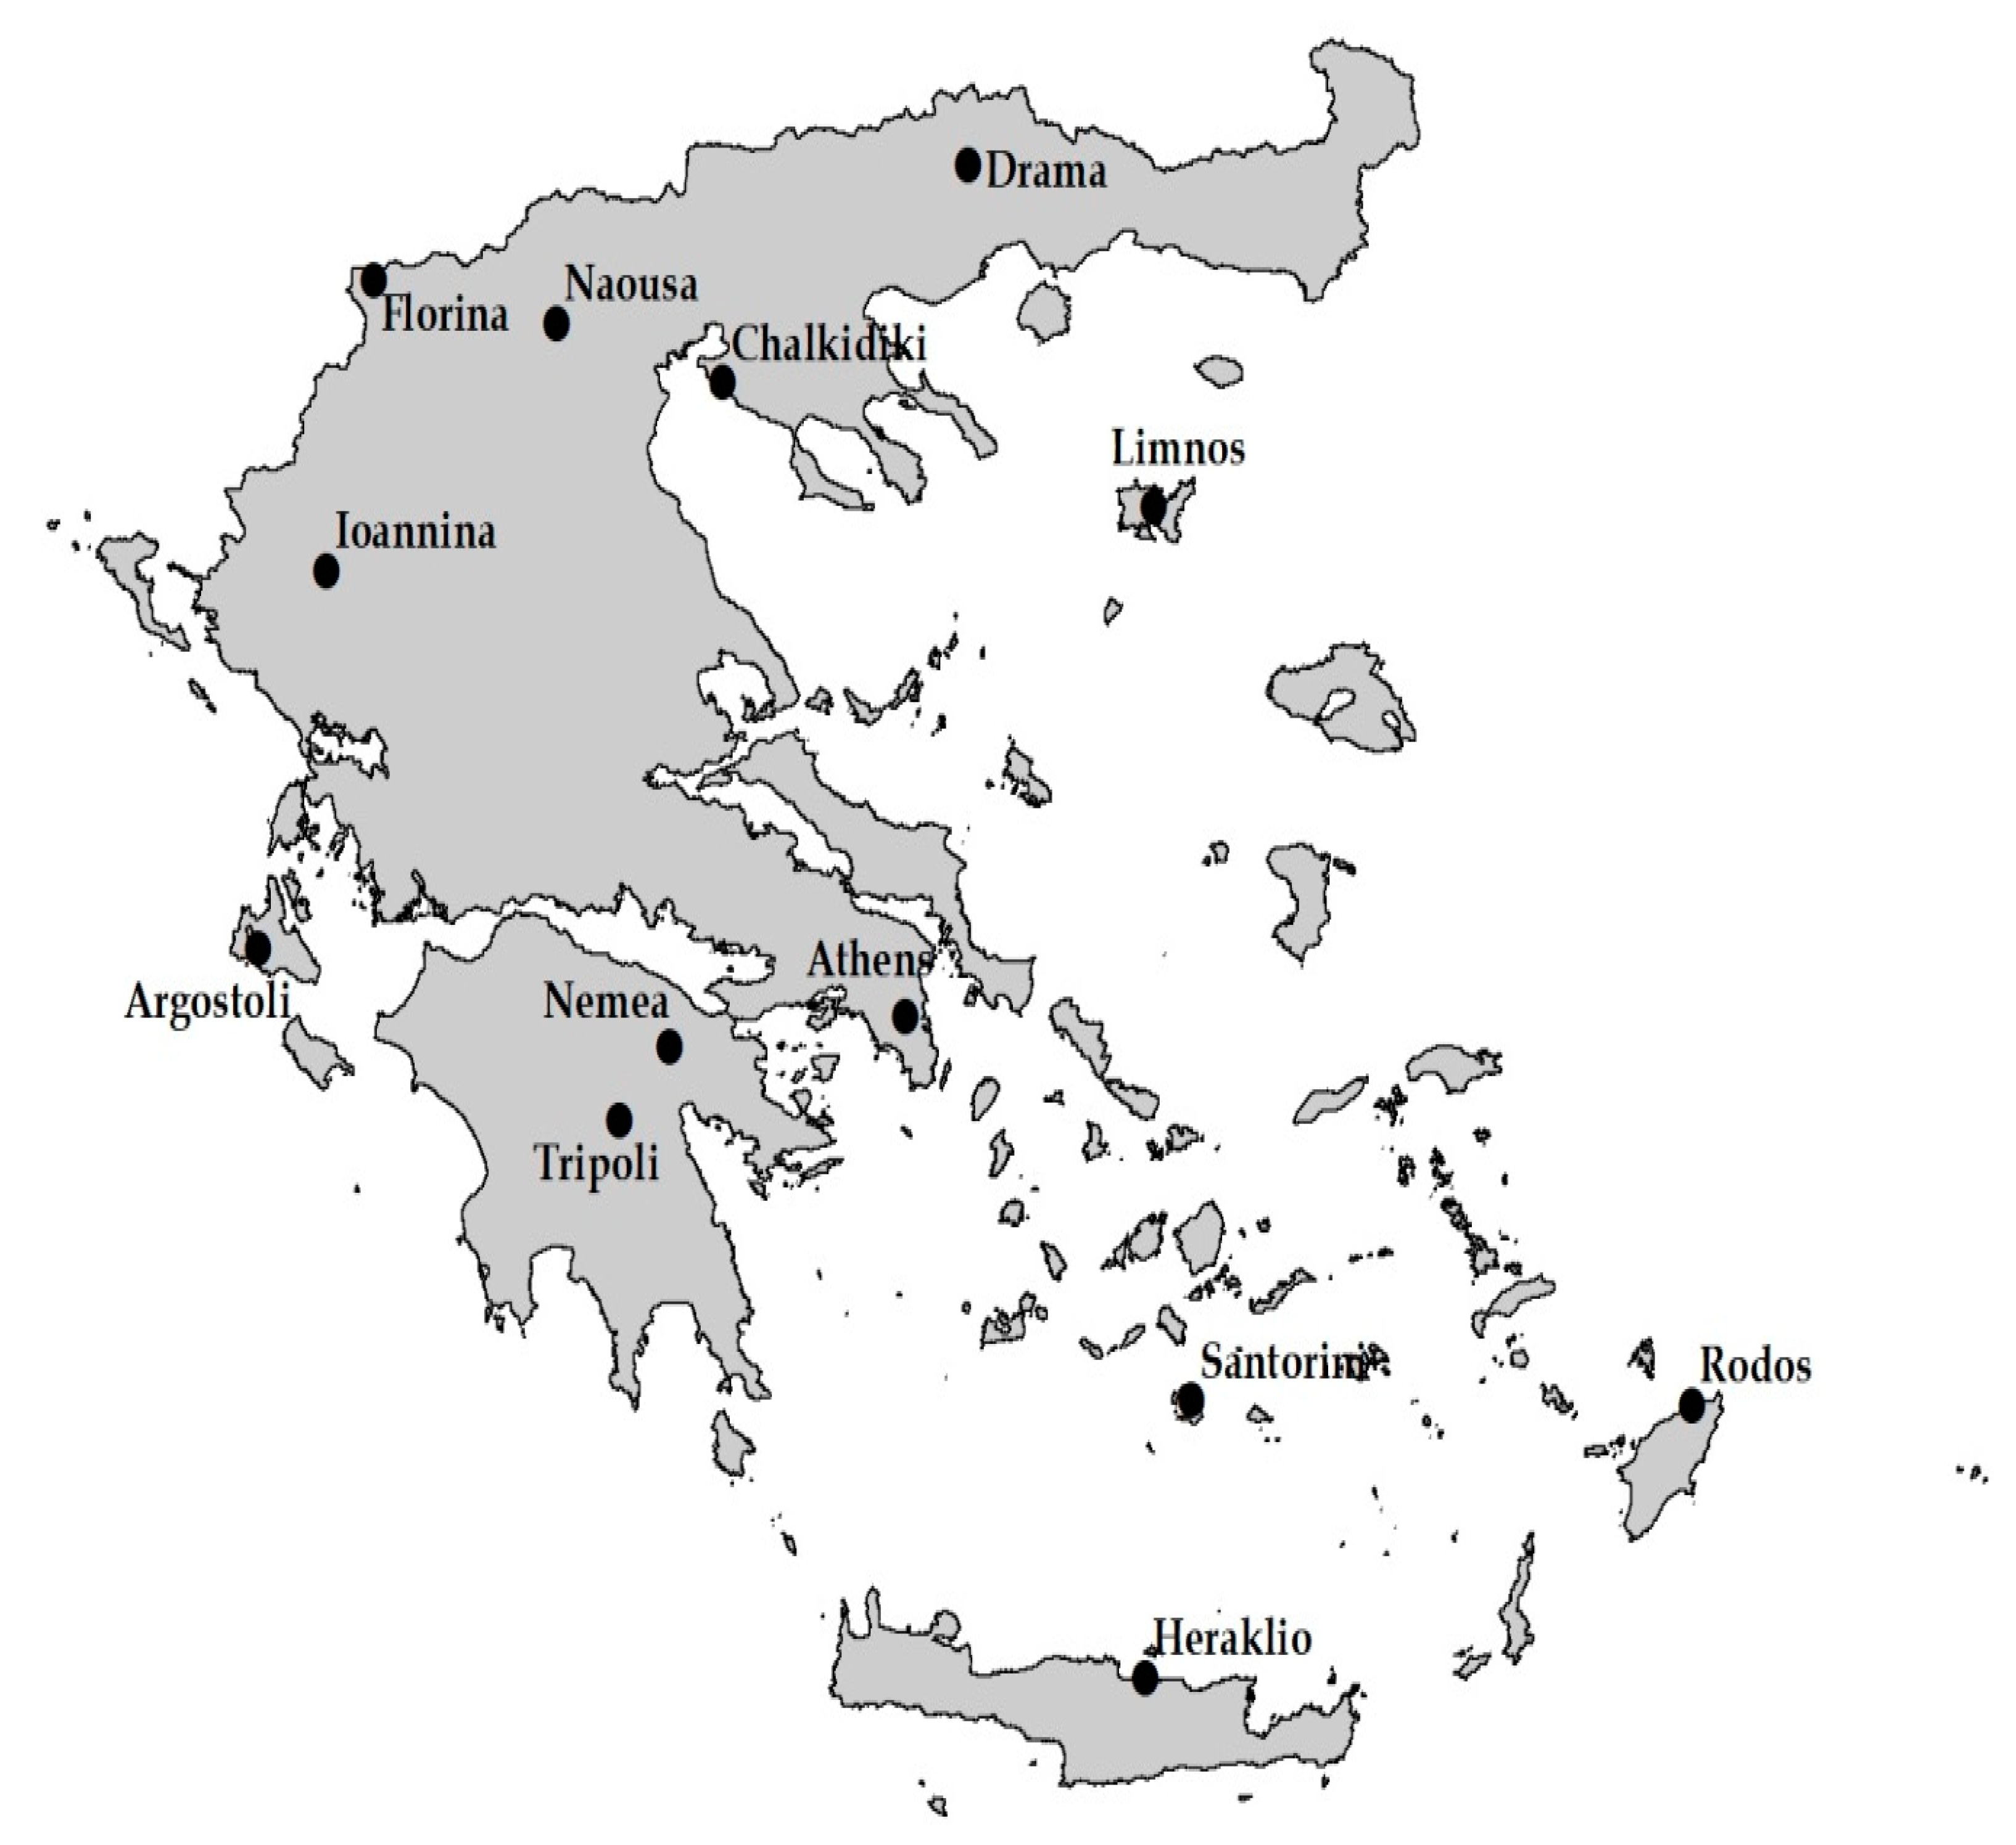
  • All wines produced from the same winegrape region were grouped together providing an average region-wide wine rating score per year for the specific variety. For example, although Agiorgitiko variety is currently cultivated across different areas in Greece, only wines produced within Nemea region (PDO) were considered to create the longest available timeseries. However, two representative areas for the indigenous varieties Assyrtiko (i.e., Drama and Santorini), Malagouzia (Athens and Chalkidiki), and Xinomavro (Amyndeon and Naoussa) were selected due to their importance.
  • Wines that age in oak barrels from 12 to 24 months (matured process) were grouped together and characterised as “aged wines”. This label was adopted only for the later ripening red varieties of Agiorgitiko and Xinomavro (3 cases in total).
  • Wines that appeared in the competition for evaluation one year after their production were grouped together and characterised as “young wines”.

2.2. Climate Data Collection and Procedures

The temporal evolution of the commonly used climatic variables and indices, for the period 1981–2010 for the main wine-producing areas of Greece was recently investigated [23]. The present study extends the above-mentioned period to 2019 for a sub-group of these areas (11 out of 23 locations) and divides it into two data periods (i.e., HP1: historical period 1980–1999 and HP2: historical period 2000–2019) to examine any differences between the periods. The Hellenic National Meteorological Service (HNMS) provided daily observations of maximum (TX) and minimum (TN) air temperature (°C) as well as daily precipitation (PRCP, mm). Weather stations are on average within 15 km to the principal viticultural areas, providing a good reference of the air temperature and precipitation trends of the PDO and GI areas. Statistical and visual checks for errors have been already performed for the period 2011–2017 [24], while additional data (i.e., 1980 and 2018–2019) were subjected to a similar quality control adopted in previous studies [24,28] using the RClimDex software [29]. Averages of TX, TN and PRCP totals during the calendar year (CY, hereafter), growing season (GS, hereafter—April to October), and ripening period (RP, hereafter—45 days before harvest) were then calculated for HP1 and HP2, respectively. It is important to note that averages of climate variables during RP (i.e., 45 days before harvest) were calculated using harvest dates from each one of the varieties studied. Harvest dates were recorded when, according to the producers, optimum sugar–acid levels were reached.
In addition, TX, TN, and PRCP were used to calculate: (i) the diurnal temperature range index (DTR, hereafter) which is calculated as TX–TN on a daily, monthly or yearly basis [30], (ii) the extreme heat index which is the total number of days with TX above 30 °C on a given period [3] and (iii) the dryness index (DI) using the following formula [31]:
W = W o + P T v E s
This index estimates the water soil reserve of a given period (W) by calculating precipitation (P), potential transpiration (Tv) and direct evaporation (Es) from the soil by assuming an initial useful water reserve (Wo = 200 mm). Tv and Es were then used to calculate potential evapotranspiration (ETP) which in this study was estimated during the period April to September using the Hargreaves formula then DI = W at the final moment. The statistical R package ‘SPEI’ was used to calculate the ETP [32]. Finally, a sensitivity analysis was carried out in order to test the validity of the results from the model used, the magnitude of fixed components and model performance in terms of explained variance. More specifically, we conducted a leave-one-out sensitivity analysis by variety to test the model’s performance. The results are summarized in the Supplementary Materials (Table S5), showing no substantial changes in model performance.
To calculate future conditions, the DEAR-Clima database was used (http://meteo3.geo.auth.gr:3838/, accessed on 11 December 2021). This is a reliable, user-friendly online platform providing climate data (on a daily, monthly and yearly basis) from high-resolution (0.11° × 0.11°) regional climate models from the Coordinated Regional Downscaling Experiment (CORDEX) programme. In this study, future wine region projections were performed using daily simulations of TX, TN and PRCP from 10 regional climate models (Table 2). The raw data from the regional climate models was not biased corrected and this could potentially be a limitation of the study. The representative concentration pathways (RCP4.5 and RCP8.5) were employed to project future Greek wine quality in the near future (FPn: 2041–2065) and far future (FPf: 2071–2095) periods. The TX and TN scenarios for FPn and FPf were then constructed by adjusting the historical timeseries of the models with the mean monthly changes estimated between the control period (CP: real observations during 1981–2005) and FPn, FPf [24]. The respective mean monthly per cent changes were used in the case of precipitation.

2.3. Statistical Analysis

The temporal evolution of climate parameters (i.e., TX, TN and PRCP) and wine quality rating scores (i.e., WQRS) were explored using the basic linear regression model (Y = a + bX). Statistical significance was evaluated at p-value < 0.05 and < 0.10 using the non-parametric test Spearman’s rho. Potential differences in medians between the two historical periods (i.e., HP1 and HP2) were further explored using the non-parametric Wilcoxon test (Table S4). The relative contribution of climate variables on each winegrape variety and eventually wine quality was tested using a mixed effect modelling approach. The mixed-effects model was performed using the lme4 R package. Initially, a linear mixed-effects model was set according to the following equation:
W Q R S = T X + T N + P R C P + E x t r e m e   H e a t + D T R + D I + ( 1 | v a r i e t y )
where WQRS: wine quality rating scores, TX: maximum air temperature, TN: minimum air temperature, PRCP: total precipitation amount, Extreme Heat: total number of days with TX ≥ 30 °C, DTR: diurnal temperature range, which is calculated as TXTN, and DI: dryness index. WQRS was considered as the response variable while the set of climate variables (i.e., TX, TN, PRCP, Extreme Heat, DTR and DI) and (1|variety) as fixed and random effect, respectively [33].
In addition, we suppose that climate variables may differ between areas where each of the studied varieties are cultivated and for this reason, an interaction term between each one the selected climate variables and variety was introduced to the initial model as follow:
W Q R S = T X + T N + P R C P + E x t r e m e   H e a t + D T R + D I + ( C l i m V a r | v a r i e t y )
where the ClimVar|variety component specifies the interaction between each climate variable and variety.
If one of the selected variables had a p-value greater than >0.01, it was removed from the analysis and the procedure repeated with the remaining variables until all variables showed a high level of statistical significance (i.e., p-value < 0.01); then, the optimal model was reached. In this study, the final model used for further analysis was:
W Q R S = T X + T N + P R C P + D I + ( 1 | v a r i e t y )
The above-mentioned equations were calculated on CY, GS (April–October) and RP (that was assumed to be the 45 days, on average, before harvest). It is important here to say that harvest commenced after two consecutive measurements where sugar and acid levels remained stable, and thus, the targeted ratio according to producers’ decision was achieved. Overall, 15 different mixed-effects models were constructed and tested for their accuracy in explaining Greek wine quality ratings. Akaike’s Information Criterion (AIC) was undertaken to test the goodness of the model fit, and the model with lower AIC was selected. Between the total number of mixed-effects models used in this analysis, a mixed-effects model during the GS proved to be the most accurate one according to the following equation:
W Q R S = T X _ G S + T N _ G S + P R C P _ G S + D I + ( 1 | v a r i e t y )
This was used to project Greek wine quality ratings for the two future periods (i.e., 2041–2065 and 2071–2095) using an ensemble dataset derived from 10 regional climate models. All statistical analyses were performed using the R statistical software and the respective packages [34] while figures were created using ArcGIS software.

3. Results

3.1. Historical Climate Overview for the Period during 1980–2019 over the Growing Season (Averages and Trends)

The direction and magnitude of trends on each climate variable (i.e., TX, TN, PRCP and DI) along with the statistical significance are shown in Table 3 and Figure 2.
Upward trends for TX and TN across all locations, were identified (42 out 44 cases) during the GS considering the 1980–2019 period (Table 3). Mainland locations generally exhibited warmer daily (higher TX values) and wetter conditions, while the highest TN means were more pronounced at island locations presenting a general coherence (18.3 °C versus 14.1 °C, on average). Overall, TX and TN increased in almost every location (21 out of 22 statistically significant cases), except for TX in Tripoli (Table 3). The magnitude of TN trends was greater than the respective TX trends in 9 out of 11 cases (the only exceptions being Athens and Kephalonia). On the other hand, PRCP exhibited upward trends during the same period with the least statistically significant cases (2 out of 11, Table 3). Finally, analysis regarding the DI showed negative trends in all cases with only one location being statistically significant. An overview of the climatic conditions during CY and RP over the two historical periods (i.e., HP1 and HP2) are summarized in the Supplementary Materials Section (i.e., Tables S1–S3 and Figure S1).

3.2. Greek Wine Quality Evolution

Wine quality rating statistics and trends per studied variety are presented in Table 4. Overall, the analysis showed an average Greek wine quality score of 82.7 on a 100-scaling rate and a standard deviation of 2.9. White dry wines are rated slightly lower than the overall country average (i.e., 82.4 points) while red dry wines achieved a higher score on average (+1.0). The variety with the lowest ranking is the international variety Muscat of Alexandria (i.e., 81.2 points), while the white variety with the highest ranking is the indigenous variety Assyrtiko, cultivated in the Drama region (i.e., 85.3 points). Early maturing varieties achieved slightly lower average scores than mid- and late-season ripening varieties (82.3 vs. 82.6 and 83.0 points, respectively). Finally, the wines produced on mainland locations appeared to be rated slightly higher than the respective wines produced on the islands (83.0 versus 82.2 points/year−1, respectively).
The overall trend analysis revealed positive trends in all cases (14 cases) with nine statistically significant at p-value <0.05 and two at <0.10 while three cases presented insignificant positive trends (Table 4). Overall quality ratings for wines from red varieties increased at a higher rate than the respective wines from white varieties (0.51 points/year−1 versus 0.39 points/year−1). Wine quality rating scores for the early maturing varieties increased by 0.46 points/year−1 while wines from mid- and late-season ripening varieties increased by 0.38 and 0.43 points/year−1, respectively. Finally, the quality rating scores of wines produced on mainland locations increased by +0.19 points/year−1 higher than the respective wines produced on island locations (Table 4). Greek wine quality rating scores overall increased by 0.41 points/year−1.

3.3. Relationships between Climate and Wine Quality

The mixed-effects model analysis of the response variable (i.e., WQRS) during GS with a set of climate variables gave a highly significant effect (Table 5). The positive contribution of TX was the most important predictor of Greek wine quality ratings followed by a negative, but to a lesser degree, effect of TN. Regarding DI and total precipitation amounts, the analysis revealed a significant positive impact of DI and a negative of PRCP during GS. This means that overall, during the GS, warmer TX, cooler TN and drier conditions lead to the highest WQRS. Three out of four climate variables appeared to be statistically significant at p-value < 0.001 while PRCP_GS was significant at p-value = 0.01 (Table 5).
The projections of Greek wine quality response, based on the selected mixed-effects model to an ensemble future climate with two representative concentration pathways (i.e., RCP4.5 and RCP8.5), derived from 10 regional climate models (Table 2) are presented in Table 6. For the FPn period (i.e., 2041–2065) and under the lower representative concentration pathway (i.e., RCP4.5), the overall Greek WQRS remained stable at 82.7 points while during FPf (i.e., 2071–2095), Greek wine ratings slightly increased (by +0.7 points) compared to the reference period. The higher representative concentration pathway (i.e., RCP8.5) led to more noticeable increases in Greek WQRS, especially during FPf (Table 6). Overall, Greek WQRS is projected to be +0.8 points higher than the baseline period (83.5 versus 82.7 points, on average, respectively) over FPn and by a further +1.8 points by the end of the century (85.3 versus 82.7 points, on average, respectively).
Finally, wines produced from white and early maturing indigenous varieties responded less than those derived from indigenous mid- and late-season ripening red varieties (Table 6). WQRS of wines produced from the early maturing varieties increased at a lower rate than those from mid- and late-season ripening varieties. The early indigenous variety Malagouzia showed the lowest increase in wine quality rating, while late-maturing variety Xinomavro presented the highest increase (Table 6).

4. Discussion

This research provides additional knowledge to the domestic and international growing interest regarding the evolution and the relationships between Greek wine production, wine quality and climate [23,24]. The analyses were carried out over key mainland and island locations during the historical climate conditions and future climate projections.
The majority of winegrape areas in Greece are recently categorized as warm to hot, while regional climate simulations suggest even warmer and drier conditions in the future [24]. The statistically significant increasing GS trends of TN identified during 1981–2010 were higher than these of TX in most of the cases (Koufos et al. 2017). These results are in line with previous research in the majority of the European winegrape regions [6]. However, two relevant studies conducted in three principal winegrape areas in Spain [35] and the Veneto in Italy [36] showed that TX increased at a higher rate compared to the TN. Furthermore, ref. [37], in a similar study in Alsace, reported that trends in TN were significantly higher only during Autumn. These results indicate that air temperature does not affect every region in the same way. For example, ref. [15] showed that winegrape regions located in the Northern hemisphere (which is more covered by land) faced proportionally warmer conditions compared to the areas located in the Southern hemisphere. In this study, mainland areas experienced higher mean TX, while TN was more pronounced on island locations. The higher TX trends over the last decade (i.e., 2011–2019) compared with these of TN imply a turning point at which TX increases at a higher rate than the respective TN (Tables S1 and S2). However, additional spatially distributed temperature records are required to confirm this result. PRCP showed the least significant changes over the studied periods. In particular, the total amount of rainfall during the GS was significantly reduced when the analysis was based on the HP2 compared to HP1, suggesting relative wetter conditions (Tables S1 and S2). In addition, future projections indicate drier conditions, on average, for the locations studied, especially during the far future period and under the RCP8.5 (data not shown). On the other hand, DI showed upward trends in the majority of the studied regions during the 1980–2019 period. However, since this index is calculated from April to September, the frequently dry periods during the summer period along with higher TX and TN resulted in lower water availability during the months prior to harvest.
Air temperature is highly correlated with grapevine phenology, development and wine quality around the globe [2]. The majority of grapevine varieties are currently grown in regions with favourable climatic-edaphic conditions which were considered essential, over several decades, for producing balanced wines. Nevertheless, as temperature increases, grape maturity is very likely to take place during summer months where, in general, warmer and drier conditions prevail [24], and consequently, wine balance may be negatively affected [38]. Although increasing temperatures might lead to changes in phenological timing, vineyard management practices, water-nutrient stress and/or pest disease control [2], it may be either beneficial or detrimental depending on the specific variety and wine style being produced. In fact, a sufficient number of studies have reported that climate variation is very likely to be highly regional and variety-specific [15]. For example, Koufos et al. [24] found that even though air temperature significantly increased across the Greek territory resulting in earlier harvest occurrence, a wide range of indigenous varieties responded less compared to international varieties, on average. Moreover, mid- and late-season ripening indigenous varieties were found to be more resilient to further warming than the respective early ripening varieties.
However, warmer growing season conditions resulting in earlier harvest dates do not necessarily lead to lower wine quality. Using large datasets with vintage ratings and climate over numerous winegrape regions around the world, ref. [15] found that better vintages were frequently associated with earlier harvest dates and higher growing season temperatures. In addition, Davis et al. [20] reported that top-ranked vintages in the Burgundy region were highly linked with warmer growing season temperatures and drier conditions. Lebon et al. [39] reported similar results in Saint Emillion (France) where better vintages were identified under higher water deficit and warmer conditions. Similarly, Canova et al. [40] showed that grapes of higher quality occurred under higher temperatures for three Italian wines. This study adds to the abovementioned results as the Greek WQRS improved with increasing water deficits because of the warmer (the magnitude of the positive coefficient of TX_GS was larger than the respective negative of TN_GS in the mixed effect model analysis (see Table 5)) and drier conditions. This may be a surprising finding given the fact that flavour compounds of grapes and wines are negatively affected by increased temperatures [41,42]. Even though there are recent reports that Greek indigenous varieties may be more resilient to thermal stress [43], the positive relationship of Greek wines produced from late-ripening indigenous varieties with temperature is mostly the result of a shift in harvest time towards earlier dates placing the late stages of ripening under more consistently favourable weather conditions. In addition, WQRS of wines produced from the early maturing varieties and on-island locations appeared to increase at a lower rate compared to mid- and late-season ripening varieties and mainland locations. Moreover, this study investigated the relationships between WQRS and climate by using a linear mixed-effects model. The use of a non-linear model might alter the outcomes regarding Greek WQRS. For example, warmer conditions in the near future might be beneficial for Greek wines, most likely for later ripening indigenous varieties due to their higher resilience to warmer conditions and potentially due to advancements in oenological techniques. However, further temperature increases, especially during the far future period (i.e., 2071–2095) and under the more severe scenario (i.e., RCP8.5), could lead to a WQRS upper threshold whereby any additional warming would likely lower quality [15]. However, more data regarding WQRS for Greece would be needed to adequately test this impact.
This study does not account for the upper-temperature limits regarding variety tolerances as well as their adaptive capacity to warmer conditions. For example, the red indigenous variety of Xinomavro is currently cultivated in the northern winegrape regions of Amyndeon (near Florina) and Naoussa. These regions presented different growing season averages (17.6 °C in Florina versus 19.4 °C in Naoussa) which in turn placed them in different classes according to growing season temperature index (warm versus hot, [23]). As a result, total heat requirements to reach harvest significantly differs between regions (i.e., growing degree-days of 1700 in Florina versus 2069 in Naoussa, on average). However, this wine quality rating analysis revealed positive trends for the wines produced from these regions. Further warming seems to be beneficial for maintaining high-quality wines in both regions. More specifically, wines produced in Florina exhibited higher wine quality score increases at a higher rate than the respective wines produced in the Naoussa region. One explanation might be that temperature-based indices placing Florina at lower classes with milder temperatures, and thereby lower target sugar/acid ratios, achieved these targets more frequently over the years as a result of warming. On the other hand, the Naoussa region seems to be getting closer to the varietal upper-temperature limit, beyond which maintaining the production of high-quality wines might be an increasingly challenging task.
In addition, vintage quality ratings might not be the appropriate indicator for assessing wine quality. A recent study from Gambetta and Kurtural [44] that investigated the relationships between warming and fruit ripening, including wine quality ratings, in the Napa Valley (USA) and Bordeaux (France), reported that warmer conditions resulted in higher wine quality. The same study also reported that measurement of specific secondary metabolites might be a better approach to set an upper limit for a specific variety to produce quality fruits. For example, Jones et al. [15] predicted an optimum growing season temperature threshold of 17.3 °C for the Bordeaux region, above which wine quality tended to decline, a limit that is already surpassed over the last decades [44].
Furthermore, several studies reported that climate-related parameters exert a major control on wine prices and thus represent a good indicator associated with wine quality (see [45], for a good review). For example, Ashenfelter [46] showed that growing season temperature, total precipitation during August and September, total precipitation of the preceding year along with the age of the vintage can explain almost 80% of the variation in Bordeaux prices. Similarly, Ramirez [47], using a large dataset of wine ratings from the variety Cabernet Sauvignon cultivated in the Napa Valleys, reported that weather had a stronger correlation with wine prices than wine ratings.
Moreover, this study does not take into consideration possible adaptations of grape growers to climate change (i.e., resistant rootstocks, delayed pruning, modifications of canopy management, etc.) as well as advancements in winemaking equipment and biotechnology, which could have a significant contribution to the rise of wine quality in Greece over the study period. However, since this was also true for international varieties without the same trend in WQRS, the overall positive response of Greek indigenous varieties to warming conditions most probably indicates a higher resilience of the latter to current and future climate conditions. Recent research by Santos et al. [48] has detailed how future climates will be challenging for optimum grape growth and wine production from most varieties worldwide. The work also identified many current and future adaptations to changes in climate, including a better understanding of the cultivar limits to climate conditions, changes in vineyard management strategies, winemaking refinements, developments in soil–rootstock compatibility and continued plant breeding and genetic research.

5. Conclusions

The present study provides valuable information regarding the temporal evolution of air temperature (TX and TN) and precipitation (PRCP) over two different periods using an extension of a previously studied climatic database. In addition, this research presents for the first time, the evolution of Greek wine quality (based on vintage ratings) and the relationships with climate parameters. Overall, TN is shown to be increasing at a faster rate than the respective TX during the HP2 while PRCP exhibited the least significant cases over the studied periods. These trends have been linked with warmer annual and growing season conditions in almost every winegrape region throughout the Greek territory and resulting in earlier harvest dates in the vast majority of the varieties studied (both indigenous and international) [20].
Furthermore, this study focused on Greek wine quality rating trends over the last several years, with the results showing that under higher TX, lower TN and drier conditions that overall Greek WQRS trended higher. The latter is in line with previous research (e.g., [15,20]) indicating that higher growing season temperatures and a mild water deficit are correlated with better vintages. Furthermore, future wine quality rating projections applied on the outcome of the mixed-effects model, using two representative concentration pathways (i.e., RCP4.5 and RCP8.5) showed that WQRS are projected to trend upward under warmer conditions. However, these results do not consider other climatic factors that might interfere with wine quality and berry biochemical synthesis (e.g., solar radiation). In addition, husbandry practices, vineyard management, winemaking equipment and techniques, have clearly also contributed to better vintages as well as potential variety resilience to climate change. Therefore, these results are considered as the starting point of an overview of potential climate change impacts on Greek wines that may be beneficial for the Greek wine sector.
Regardless of wine quality rating trends detailed in this study, it is of high importance for the Greek wine industry to continue their research on the cultivation and vinification of the indigenous varieties that seemed to be better adapted and likely have more tolerance to current and future warmer conditions [20].

Supplementary Materials

The following supporting information can be downloaded at: https://www.mdpi.com/article/10.3390/w14040573/s1: Figure S1: Directions and magnitudes of trends of mean maximum (TX, red bars) and minimum (TN, blue bars) air temperature (°C) and precipitation (PRCP, mm, green bars) for two historical time windows. Top graphs referred to the calendar year (CY) while bottom graphs referred to ripening period (RP), respectively; Table S1: Annual (CY) descriptive statistics for climate variables for two historical time windows [first row of each weather station corresponds to mean values and standard deviation in parenthesis while slope b (trends year−1) of the linear equation (Y = a + bX) for each variable are presented in the second row respectively] for 11 principal winegrape areas in Greece; Table S2: Ripening period (RP: 45 days before harvest) descriptive statistics for climate variables for two historical time windows [first row of each weather station corresponds to mean values and standard deviation in parenthesis while slope b (trends year−1) of the linear equation (Y = a + bX) for each variable are presented in the second row respectively] for 11 principal winegrape areas in Greece; Table S3: Descriptive statistics for dryness index (DI) for two historical time windows during the period of April to September [first row of each weather station corresponds to mean values and standard deviation in parenthesis while slope b (trends year−1) of the linear equation (Y = a + bX) for each variable are presented in the second row respectively] for 11 principal winegrape areas in Greece; Table S4: Differences in the medians (Wilcoxon test) for climate variables for two historical time windows (1980–1999 and 2000–2019) during the growing season (GS: April-October) for 11 principal winegrape areas in Greece. Bold letters indicate statistically significant trends (p-value < 0.05), while italicized bold letters indicate lower statistical significance (p-value < 0.10); Table S5: Results of mixed effect model analysis of Greek wine quality ratings with climate.

Author Contributions

Conceptualization, G.C.K., T.M., S.K. and N.M.F.; methodology, G.C.K.; software, G.C.K.; validation, G.C.K.; formal analysis, G.C.K.; investigation, G.C.K.; resources, G.C.K. and S.T.; data curation, G.C.K.; writing—original draft preparation, G.C.K.; writing—review and editing, G.V.J.; visualization, G.C.K. and N.M.F.; supervision, T.M. and S.K. All authors have read and agreed to the published version of the manuscript.

Funding

This research received no external funding.

Data Availability Statement

Not applicable.

Conflicts of Interest

The authors declare no conflict of interest.

References

  1. van Leeuwen, C.; Seguin, G. The concept of terroir in viticulture. J. Wine Res. 2006, 17, 1–10. [Google Scholar] [CrossRef]
  2. van Leeuwen, C.; Darriet, P. The impact of climate change on viticulture and wine quality. J. Wine Econ. 2016, 11, 150–167. [Google Scholar] [CrossRef] [Green Version]
  3. Jones, G.V.; Davis, R.E. Climate influences on grapevine phenology, grape composition, and wine production and quality for Bordeaux, France. Am. J. Enol. Vitic. 2000, 51, 249–261. [Google Scholar]
  4. Mullins, M.G.; Bouquet, A.; Williams, L.E. Biology of the Grapevine; Cambridge University Press: Cambridge, UK, 1992. [Google Scholar]
  5. García de Cortázar-Atauri, I.; Brisson, N.; Gaudillere, J.-P. Performance of several models for predicting budburst date of grapevine (Vitis vinifera L.). Int. J. Biometeorol. 2009, 53, 317–326. [Google Scholar] [CrossRef] [PubMed]
  6. Jones, G.V.; Duchene, E.; Tomasi, D.; Yuste, J.; Braslavksa, O.; Schultz, H.R.; Martinez, C.; Boso, S.; Langellier, F.; Perruchot, C.; et al. Changes in European Winegrape Phenology and Relationships with Climate; GESCO: Wuppertal, Germany, 2005. [Google Scholar]
  7. Parker, A.K.; Garcia de Cortazar-Atauri, I.; van Leeuwen, C.; Chuine, I. General phenological model to characterise the timing of flowering and veraison of Vitis vinifera L. Aust. J. Grape Wine Res. 2011, 17, 206–216. [Google Scholar] [CrossRef]
  8. Parker, A.; Garcia de Cortazar-Atauri, I.; Chuine, I.; Barbeau, G.; Bois, B.; Boursiquot, J.M.; Cahurel, J.Y.; Claverie, M.; Dufourcq, T.; Gény, L.; et al. Classification of varieties for their timing of flowering and veraison using a modeling approach. a case study for the grapevine species Vitis vinifera L. Agric. For. Meteorol. 2013, 180, 249–264. [Google Scholar] [CrossRef]
  9. Coombe, B.G. Influence of temperature on composition and quality of grapes. In Symposium on Grapevine Canopy and Vigor Management; ISHS Acta Horticulturae: Davis, CA, USA, 1987; pp. 23–35. [Google Scholar]
  10. Bock, A.; Sparks, T.H.; Estrella, N.; Manzel, A. Climate-Induced Changes in Grapevine Yield and Must Sugar Content in Franconia (Germany) between 1805 and 2010. PLoS ONE 2013, 8, e69015. [Google Scholar] [CrossRef]
  11. Neethling, E.; Barbeau, G.; Bonnefoy, C.; Quénol, H. Change in climate and berry composition for grapevine varieties cultivated in the Loire Valley. Clim. Res. 2012, 53, 89–101. [Google Scholar] [CrossRef] [Green Version]
  12. Jackson, D.I.; Lombard, P.B. Environmental and Management-Practices Affecting Grape Composition and Wine Quality—A Review. Am. J. Enol. Vitic. 1993, 44, 409–430. [Google Scholar]
  13. Moriondo, M.; Jones, G.V.; Bois, B.; Dibari, C.; Ferrise, R.; Trombi, G.; Bindi, M. Projected shifts of wine regions in response to climate change. Clim. Chang. 2013, 119, 825–839. [Google Scholar] [CrossRef]
  14. Fraga, H.; Garcia de Cortazar-Atauri, I.; Malheiro, A.C.; Santos, J.A. Modelling climate change impacts on viticultural yield, phenology and stress conditions in Europe. Glob. Chang. Biol. 2016, 22, 3774–3788. [Google Scholar] [CrossRef] [PubMed]
  15. Jones, G.V.; White, M.A.; Cooper, O.R.; Storchmann, K. Climate change and global wine quality. Clim. Chang. 2005, 73, 319–343. [Google Scholar] [CrossRef]
  16. Nemani, R.R.; White, M.A.; Cayan, D.R.; Jones, G.V.; Running, S.W.; Coughlan, J.C.; Peterson, D.L. Asymmetric warming over coastal California and its impact on the premium wine industry. Clim. Res. 2001, 19, 25–34. [Google Scholar] [CrossRef] [Green Version]
  17. White, M.A.; Diffenbaugh, N.S.; Jones, G.V.; Pal, J.S.; Giorgi, F. Extreme heat reduces and shifts United States premium wine production in the 21st century. Proc. Natl. Acad. Sci. USA 2006, 103, 11217–11222. [Google Scholar] [CrossRef] [Green Version]
  18. Webb, L.B.; Whetton, P.H.; Barlow, E.W.R. Climate change and winegrape quality in Australia. Clim. Res. 2008, 36, 99–111. [Google Scholar] [CrossRef]
  19. Baciocco, K.A.; Davis, R.E.; Jones, G.V. Climate and Bordeaux wine quality: Identifying the key factors that differentiate vintages based on consensus rankings. J. Wine Res. 2014, 25, 75–90. [Google Scholar] [CrossRef]
  20. Davis, R.E.; Dimon, R.A.; Jones, G.V.; Bois, B. The effect of climate on Burgundy vintage quality rankings. OENO One 2019, 1, 59–73. [Google Scholar] [CrossRef] [Green Version]
  21. 2019 Statistical Report on World Vitiviniculture. Available online: https://www.oiv.int/public/medias/6782/oiv-2019-statistical-report-on-world-vitiviniculture.pdf (accessed on 6 January 2022).
  22. 2016 World Vitiviniculture Situation. OIV Statistical Report on World Vitiviniculture. Available online: https://www.oiv.int/public/medias/5029/world-vitiviniculture-situation-2016.pdf (accessed on 6 January 2022).
  23. Koufos, G.; Mavromatis, T.; Koundouras, S.; Jones, G.V. Response of viticulture-related climatic indices and zoning to historical and future climate conditions in Greece. Int. J. Climatol. 2017, 38, 2097–2111. [Google Scholar] [CrossRef]
  24. Koufos, G.C.; Mavromatis, T.; Koundouras, S.; Jones, G.V. Adaptive capacity of winegrape varieties cultivated in Greece to cliamte change: Current trends and future projections. OENO One 2020, 4, 1201–1219. [Google Scholar] [CrossRef]
  25. Schultz, H.R.; Jones, G.V. Climate induced historic and future changes in viticulture. J. Wine Res. 2010, 21, 137–145. [Google Scholar] [CrossRef]
  26. Jones, G.V. Vintage Ratings: Applications of a Ranking Procedure to Facilitate a Better Understanding of Climate’s Role in Wine Quality. Int. Vitic. Enol. Soc. Tech. Rev. 2020. [Google Scholar] [CrossRef]
  27. Corsi, A.; Ashenfelter, O. Predicting Italian Wine Quality from Weather Data and Expert Ratings. J. Wine Econ. 2019, 14, 234–251. [Google Scholar] [CrossRef]
  28. Koufos, G.; Mavromatis, T.; Koundouras, S.; Fyllas, M.N.; Jones, G.V. Viticulture–climate relationships in Greece: The impact of recent climate trends on harvest dates variation. Int. J. Climatol. 2014, 34, 1445–1459. [Google Scholar] [CrossRef]
  29. Zhang, X.; Yang, F. RClimDex (1.0) User Guide; Climate Research Branch Environment Canada: Downsview, ON, Canada, 2004; Available online: http://etccdi.pacificclimate.org/software.shtml (accessed on 13 October 2017).
  30. Gladstones, J. Viticulture and Environment; Winetitles: Underdale, Australia, 1992; p. 310. [Google Scholar]
  31. Tonietto, J.; Carbonneau, A. A multicriteria classification system for grape-growing regions worldwide. Agric. For. Meteorol. 2004, 124, 81–97. [Google Scholar] [CrossRef] [Green Version]
  32. Beguería, S.; Vicente-Serrano, S.M. SPEI: Calculation of the Standardized Precipitation Evapotranspiration Index; R Package Version 1.6; 2013. Available online: http://CRAN.R-project.org/package=SPEI (accessed on 13 October 2017).
  33. Zuur, A.F.; Ieno, E.N.; Walker, N.J.; Saveliev, A.A.; Smith, G.M. Mixed Effects Models and Extensions in Ecology with R; Springer: Berlin/Heidelberg, Germany, 2009. [Google Scholar]
  34. R Core Team. R: A Language and Environment for Statistical Computing; R Foundation for Statistical Computing: Vienna, Austria, 2014; Available online: http://www.R-project.org/ (accessed on 13 August 2019).
  35. Ramos, M.C.; Jones, G.V.; Martinez-Casasnovas, J.A. Structure and trends in climate parameters affecting winegrape production in northeast Spain. Clim. Res. 2008, 38, 1–15. [Google Scholar] [CrossRef] [Green Version]
  36. Tomasi, D.; Jones, G.V.; Giust, M.; Lovat, L.; Gaiotti, F. Grapevine phenology and climate change: Relationships and trends in the Veneto Region of Italy for 1964–2009. Am. J. Enol. Vitic. 2011, 62, 329–339. [Google Scholar] [CrossRef]
  37. Duchêne, E.; Schneider, C. Grapevine and climatic changes: A glance at the situation in Alsace. Agron. Sustain. Dev. 2005, 25, 93–99. [Google Scholar] [CrossRef]
  38. Van Leeuwen, C.; Garnier, C.; Agut, C.; Baculat, B.; Barbeau, G.; Besnard, E.; Bois, B.; Boursiquot, J.-M.; Chuine, I.; Dessup, T.; et al. Heat requirements for grapevine varieties are essential information to adapt plant material in a changing climate. In Proceedings of the 7th International Terroir Congress, Changins, Switzerland, 14–18 June 2008; pp. 222–227. [Google Scholar]
  39. Lebon, E.; Dumas, V.; Pieri, P.; Schultz, H. Modelling the seasonal dynamics of the soil water balance of vineyards. Funct. Plant Biol. 2003, 30, 699–710. [Google Scholar] [CrossRef]
  40. Canova, L.; Marini, G.; Chernyavskaya, M.; Mattei, M.D.E. In vino qualitas: Climate change effects on Italian wine production. Enometrica 2012, 5, 7–25. [Google Scholar]
  41. Tarara, J.M.; Lee, J.; Spayd, S.E.; Scagel, F. Berry temperature and solar radiation alter acylation, proportion and concentration of anthocyanin in Merlot grapes. Am. J. Enol. Vitic. 2008, 59, 235–247. [Google Scholar]
  42. Torres, N.; Martínez-Lüscher, J.; Porte, E.; Kurtural, S.K. Optimal Ranges and Thresholds of Grape Berry Solar Radiation for Flavonoid Biosynthesis in Warm Climates. Front. Plant Sci. 2020, 11, 931. [Google Scholar] [CrossRef] [PubMed]
  43. Alatzas, A.; Theocharis, S.; Miliordos, D.E.; Leontaridou, K.; Kanellis, A.K.; Kotseridis, Y.; Hatzopoulos, P.; Koundouras, S. The effect of water deficit on two Greek Vitis vinifera L. cultivars: Physiology, Grape Composition and Gene Expression during berry development. Plants 2021, 10, 1947. [Google Scholar] [CrossRef] [PubMed]
  44. Gambetta, G.; Kurtural, S.K. Global warming and wine quality: Are we close to the tipping point? OENO One 2021, 3, 353–361. [Google Scholar] [CrossRef]
  45. Oczkowski, E. The effect of weather on wine quality and prices: An Australian spatial analysis. J. Wine Econ. 2016, 11, 48–65. [Google Scholar] [CrossRef]
  46. Ashenfelter, O. Predicting the Quality and Prices of Bordeaux Wine. Econ. J. 2008, 118, 174–184. [Google Scholar] [CrossRef]
  47. Ramirez, C.D. Wine quality, wine prices and the weather: Is Napa “different”? J. Wine Econ. 2008, 3, 114–131. [Google Scholar] [CrossRef]
  48. Santos, J.A.; Fraga, H.; Malheiro, A.C.; Moutinho-Pereira, J.; Dinis, L.-T.; Correia, C.; Moriondo, M.; Leolini, L.; Dibari, C.; Costafreda-Aumedes, S.; et al. A Review of the Potential Climate Change Impacts and Adaptation Options for European Viticulture. Appl. Sci. 2020, 10, 3092. [Google Scholar] [CrossRef]
Figure 1. Map of Greece showing the locations of the wine-producing locations used in this study.
Water 14 00573 g001
Figure 2. Magnitudes of trends of mean maximum (TX, red bars) and minimum (TN, blue bars) air temperature (°C) and precipitation (PRCP, mm, green bars) during the period of records (HP1: 1980–1999 and HP2: 2000–2019) over the growing season (GS).
Water 14 00573 g002
Table 1. Details for the 11 principal winegrape varieties (10 indigenous and 1 international) cultivated in 13 principal winegrape areas in Greece. Varieties and regions are presented in the first two columns. The predominant type of wine produced per region, the period of records and the respective total number of wines used per variety, are given in the last two columns. Each variety has superscript letters indicating indigenous (a) and international varieties (b); early (E), mid (M), and late (L) season varieties [24]; and red (R) and white (W) varieties. ** correspond to two missing wine quality scores on each case.
Variety/AbbreviationRegionType of Wines ProducedPeriod of Record
Agiorgitiko L,R,aNemea–PDORed dry2009–2018 (583)
Assyrtiko M,W,aSantorini–PDOWhite dry2003–2018 (248)
Drama–GIWhite dry2009–2018 (44)
Athiri M,W,aRodos–PDOWhite dry and sparkling2003–2019 ** (89)
Debina L,W,aIoannina–PDOWhite dry and sparkling2006–2019 (55)
Malagouzia E,W,aChalkidiki–GIWhite dry2005–2019 (31)
Athens–GIWhite dry2006–2019 (45)
Moschofilero M,W,aTripoli–PDOWhite dry2003–2019 (207)
Muscat of Alexandria M,W,bLimnos–PDOWhite dry2003–2019 (100)
Robola E,W,aKephalonia–PDOWhite dry2004–2019 ** (42)
Savvatiano L,W,aAthens–GIWhite dry2004–2019 (184)
Vilana M,W,aCrete–PDOWhite dry2004–2018 (71)
Xinomavro L,R,aFlorina–PDORed dry2003–2016 (77)
Naoussa–PDORed dry2008–2017 (152)
Table 2. Summary of Global Climate/Regional Climate Model chains (GCM/RCM) used in this study over the 2041–2065 (future period 1: FP1) and 2071–2095 (future period 2: FP2) future periods.
Global Climate Model (GCM, Driver)Regional Climate Model (RCM)Scenario
CNRM-CERFACS-CNRM-CM5CLMcom-CCLM4-8-17historical
rcp45
rcp85
CNRM-CERFACS-CNRM-CM5CNRM-ALADIN53historical
rcp45
rcp85
CNRM-CERFACS-CNRM-CM5SMHI-RCA4historical
rcp45
rcp85
ICHEC-EC-EARTHKNMI-RACMO22Ehistorical
rcp45
rcp85
IPSL-IPSL-CM5A-MRIPSL-INERIS-WRF331Fhistorical
rcp45
rcp85
IPSL-IPSL-CM5A-MRSMHI-RCA4historical
rcp45
rcp85
MOHC-HadGEM2-ESCLMcom-CCLM4-8-17historical
rcp45
rcp85
MOHC-HadGEM2-ESSMHI-RCA4historical
rcp45
rcp85
MPI-M-MPI-ESM-LRCLMcom-CCLM4-8-17historical
rcp45
rcp85
MPI-M-MPI-ESM-LRMPI-CSC-REMO2009historical
rcp45
rcp85
GCM: Global Climate Model, RCM: Regional Climate Model, RCP: Representative Concentration Pathway.
Table 3. Descriptive statistics for climate variables for the historical time window 1980–2019 during the growing season (GS: April–October) [first row of each weather station corresponds to mean values and standard deviation in parenthesis while direction (↑ or ↓) and Spearman’ rho for each variable are presented in the second row, respectively] for 11 principal winegrape areas in Greece. Bold digits indicate statistically significant trends (p-value < 0.05), while italicized bold digits indicate lower statistical significance (p-value < 0.10).
Weather Stations (Winegrape Areas)TX Mean (°C)TN Mean (°C)PRCP (mm)DI
1980–20191980–20191980–20191980–2019
Alexandroupoli (Maronia)25.6 (0.9)
↑0.77
14.1 (1.1)
↑0.86
208 (80)
↑0.38
−100 (54)
↑0.16
Athens (Markopoulo)27.5 (0.9)
↑0.70
18.5 (0.8)
↑0.63
112 (48)
↑0.12
−100 (31)
↑0.05
Crete (Peza)25.8 (0.6)
↑0.66
18.5 (0.6)
↑0.75
97 (58)
↓−0.13
−41 (24)
↓−0.05
Ioannina (Ioannina)25.7 (0.9)
↑0.32
11.7 (0.7)
↑0.64
404 (152)
↑0.16
−101 (85)
↑0.17
Kephalonia (Valsamata)25.9 (0.8)
↑0.75
17.5 (0.7)
↑ 0.33
243 (94)
↑0.18
−30 (53)
↑0.10
Limnos (Limnos)24.7 (0.8)
↑0.72
16.1 (0.8)
↑0.80
161 (85)
↑0.41
−44 (47)
↑0.06
Larisa (Rapsani)28.0 (0.8)
↑0.48
13.9 (0.8)
↑0.83
212 (77)
↑0.17
−171 (53)
↑0.18
Rodos (Ebonas)26.3 (0.6)
↑0.63
20.5 (0.6)
↑0.79
107 (77)
↑0.15
−11 (28)
0.31
Santorini (Santorini)25.4 (0.8)
↑0.61
19.1 (0.9)
↑0.79
54 (43)
↑0.06
−31 (27)
↓−0.02
Thessaloniki (Epanomi)26.6 (0.8)
↑0.52
15.6 (0.9)
↑0.80
218 (72)
↑0.13
−87 (47)
↑0.40
Tripoli (Tripoli)25.7 (0.9)
0.26
10.6 (1.0)
↑0.44
256 (96)
↑0.17
−175 (56)
↑0.15
Overall:26.1 (0.7)
0.68
16.0 (0.7)
0.83
188 (49)
0.29
−81 (31)
0.24
Island25.6 (0.6)
0.75
18.3 (0.6)
0.83
132 (45)
0.29
−32 (22)
0.20
Mainland26.5 (0.7)
0.59
14.1 (0.7)
0.82
235 (60)
0.27
−122 (40)
0.26
Table 4. Wine quality rating statistics and trends for the 11 principal winegrape varieties (10 indigenous and 1 international) cultivated in 13 principal winegrape regions in Greece. Varieties and regions are presented in the first two columns. Averages and standard deviation (in parenthesis) for wine quality are given in column 3. Wine quality direction, slope and r2 given in column 4. The period of records for each variety is given in the last column.
VarietyWinegrape AreaAverage (Standard Deviation)Trend Year−1Period of Records
Malagouzia E,W,aChalkidiki81.9 (4.0)0.62 (0.48)2005–2019
Athens82.3 (2.2)0.37 (0.50)2006–2019
Robola E,W,aKephalonia82.8 (3.0)0.38 (0.39)2004–2019 **
Muscat of Alexandria M,W,bLimnos81.2 (3.2)0.21 (0.11)2003–2019
Moschofilero M,W,aTripoli81.9 (3.1)0.52 (0.74)2003–2019
Vilana M,W,aCrete82.1 (2.2)0.35 (0.48)2004–2018
Athiri M,W,aRodos82.5 (2.2)0.09 (0.05)2003–2019 **
Assyrtiko M,W,aSantorini82.6 (3.7)0.44 (0.32)2003–2018
Drama85.3 (2.9)0.66 (0.49)2009–2018
Debina L,W,aIoannina81.3 (3.3)0.40 (0.26)2006–2019
Agiorgitiko L,R,aNemea82.5 (4.8)0.71 (0.20)2009–2018
Savvatiano L,W,aAthens82.7 (1.5)0.21 (0.44)2004–2019
Xinomavro L,R,aFlorina84.2 (1.6)0.31 (0.63)2003–2016
Naousa84.6 (2.8)0.51 (0.31)2008–2017
SummaryOverall
Early
Mid
Late
Red
White
Mainland
Island
82.7 (2.9)
82.3 (3.0)
82.6 (2.9)
83.0 (2.8)
83.7 (3.1)
82.4 (2.8)
83.0 (2.9)
82.2 (2.9)
0.41
0.46
0.38
0.43
0.51
0.39
0.48
0.29
Bold digits indicate statistically significant trends (p-value < 0.05), while italicized bold letters indicate lower statistical significance (p-value < 0.10). Each variety has superscript letters indicating indigenous (a) and international varieties (b); early (E), mid (M) and late (L) season varieties; and red (R), white (W) varieties. ** correspond to two missing wine quality scores on each case.
Table 5. Results of mixed-effects model analysis of Greek wine quality ratings with climate.
ModelFixed ComponentsEstimatep-Value
WQRS = TX_GS + TN_GS + DI + PRCP_GSintercept46.41***
TX_GS1.99***
TN_GS−0.77***
DI0.03***
Prcp_GS−0.01**
Model summaryNumber of varieties: 14
Number of observations: 197
Marginal R2/Conditional R2: 0.22/0.39
Significant codes: *** < 0.001, ** < 0.01.
Table 6. Future wine quality rating statistics for the 11 principal winegrape varieties (10 indigenous and 1 international) cultivated in 13 principal winegrape regions in Greece. Varieties and regions are presented in the first two columns. Average wine quality rating scores for FPn and FPf under RCP45 and RCP85 are given in columns 3–6. Each variety has superscript letters indicating indigenous (a) and international varieties (b); early (E), mid (M) and late (L) season varieties; and red (R), white (W) varieties.
VarietyWinegrape AreaWQRS FPn rcp45WQRS FPn rcp85WQRS FPf rcp45WQRS FPf rcp85
Malagouzia E,W,aChalkidiki81.382.181.983.9
Athens81.682.482.384.2
Robola E,W,aKephalonia82.983.883.685.5
Muscat of Alexandria M,W,bLimnos82.583.383.285.1
Moschofilero M,W,aTripoli82.383.283.084.9
Vilana M,W,aCrete83.083.883.785.6
Athiri M,W,aRodos82.983.783.685.5
Assyrtiko M,W,aSantorini83.784.684.486.3
Drama83.584.384.186.0
Debina L,W,aIoannina81.482.382.184.0
Agiorgitiko L,R,aNemea81.482.282.083.9
Savvatiano L,W,aAthens82.082.882.784.6
Xinomavro L,R,aFlorina85.286.185.987.8
Naousa83.884.684.486.3
SummaryOverall
Early
Mid
Late
Red
White
Mainland
Island
82.7
81.9
83.0
82.8
83.5
82.5
82.5
83.0
83.5
82.8
83.8
84.3
84.3
83.3
83.3
83.8
83.3
82.6
83.7
83.4
84.1
83.1
83.2
83.7
85.3
84.5
85.6
85.3
86.0
85.1
85.1
85.6
Publisher’s Note: MDPI stays neutral with regard to jurisdictional claims in published maps and institutional affiliations.

