Article

Climate Change over the Mediterranean Region: Local Temperature and Precipitation Variations at Five Pilot Sites

Department of Engineering and Architecture, University of Parma, 43124 Parma, Italy
*
Author to whom correspondence should be addressed.
Water 2022, 14(16), 2499; https://doi.org/10.3390/w14162499
Submission received: 7 July 2022 / Revised: 3 August 2022 / Accepted: 9 August 2022 / Published: 13 August 2022
(This article belongs to the Special Issue Evolution of the Hydrological Regime in Relation to Climate Change)

Abstract

:
The Mediterranean region is one of the most responsive areas to climate change and was identified as a major “hot-spot” based on global climate change analyses. This study provides insight into local climate changes in the Mediterranean region under the scope of the InTheMED project, which is part of the PRIMA programme. Precipitation and temperature were analyzed in an historical period and until the end of this century for five pilot sites, located between the two shores of the Mediterranean region. We used an ensemble of 17 Regional Climate Models, developed in the framework of the EURO-CORDEX initiative, under two Representative Concentration Pathways (RCP4.5 and RCP8.5). Over the historical period, the temperature presents upward trends, which are statistically significant for some sites, while precipitation does not show significant tendencies. These trends will be maintained in the future as predicted by the climate models projections: all models indicate a progressive and robust warming in all study areas and moderate change in total annual precipitation, but some seasonal variations are identified. Future changes in droughts events over the Mediterranean region were studied considering the maximum duration of the heat waves, their peak temperature, and the number of consecutive dry days. All pilot sites are expected to increase the maximum duration of heat waves and their peak temperature. Furthermore, the maximum number of consecutive dry days is expected to increase for most of the study areas.

1. Introduction

Global climate warming is unequivocal [1] and human influence, due to the increase in concentrations of greenhouse gases (GHGs), is now clear [2]. There are regions that are more sensitive to climate change [3], where the impacts can be exceptionally evident. According to future climate model projections, one of these areas is the Mediterranean region (MED) [3,4], which has been identified as a major climate change hot-spot [5].
Caloiero et al. [6] analyzed the long-term precipitation trend in Europe and in the Mediterranean basin using a globally gridded precipitation dataset covering the period 1901–2009. On an annual scale, the authors found a prevalent negative precipitation trend for the study area; a positive trend was observed for central-north Europe. The negative trend is mainly observed for the MED with high variability at local scale. Making use of different climate models, under different scenarios and with different spatial resolutions, it is agreed that the mean temperature will increase by the end of this century over the MED, especially in summer [1,4,7,8]. Precipitation is expected to decrease throughout the area with few exceptions [9]. Giorgi and Lionello [4] using the projections of general circulation models (GCMs) and regional climate models (RCMs), under different emission scenarios (B1, A1B, A2 for the GCMs and A2 and B2 for the RCMs), pointed out that at the end of the 21st century (2071–2100) precipitation is expected to decrease (compared to 1961–1990) over the MED by up to 25–30%. The only exception is the northern part of Europe, which, especially in winter, shows a slight increase. Warming climate is expected in all seasons with maximum values in summer up to 4–5 °C. Mariotti et al. [8], according to the GCM projections of the Coupled Model Intercomparison Project-Phase 5 (CMIP5), showed a significant warming in all seasons and areas of the MED under the RCP4.5 scenario, with a maximum in summer of about 3 °C, comparing 2071–2098 to 1980–2005. In the same period, a decrease in precipitation is expected on an annual scale but with seasonal differences between the different sub-regions of the MED. The temperature signal, mainly forced by GHGs, prevails over the internal variability at decadal scale already around 2000, while for the changes in precipitation they will emerge from the decadal variability around 2050; the chance of dry decades will be likely increase. The CMIP5 simulations were also analyzed by Lionello and Scarascia [10] to identify changes in precipitation and temperature over the MED under the RCP8.5 scenario. The authors linked the changes in the MED to the global annual mean surface temperature, reporting a decrease in precipitation of 4% for each degree of increase in the global temperature and a warming rate about 20% faster than global warming (with seasonal differences), which confirm that the MED is a climate change hot-spot. Zittis et al. [11] used a multi-model, multi-scenario and multi-domain analysis to identify the future climate in the MED. In particular, the authors used the RCM projections of the Coordinate Regional Downscaling Experiment—CORDEX (https://cordex.org) (accessed on 8 August 2022), over different domains (which include the MED), under the RCP2.6, RCP4.5 and RCP8.5 scenarios. By the end of the 21st century and compared to 1986–2005, a warming of the MED of 1–5 °C is expected, with summer values that can reach 7 °C. A decrease in precipitation between 10% and 40% is also likely. Differences are expected between the northern and southern parts of the MED, where the southern regions will experience combined higher warming and drier periods. The interannual temperature variability is expected to increase, especially for the RCP8.5, indicating a possible increase in heat extremes. In this regard, Zittis et al. [12] used a single RCM (under the A2, A1B, and B2 scenarios) to analyze future heat wave changes in the eastern Mediterranean. By the end of this century, the frequency, persistency, and severity of the heat extremes are expected to increase dramatically, with negative impacts on human health and the environment. Moreover, according to the First Mediterranean Assessment Report [13], heat waves and extremes will intensify over the MED at the end of the century and the expected increase in interannual variability of the hydrological cycle is likely to lead to a longer dry spell, more clear in the southern sub-regions. An ensemble of RCMs from the EURO-CORDEX initiative was used by Molina et al. [14] to investigate future heat waves over the MED. According to the RCP4.5 and RCP8.5 scenarios, the authors report an increase in both intensity and length of heat waves in the late 21st century.
Climate models are essential tools for assessing the impacts of climate change, but their spatial resolutions remain an issue on complex domains such as the MED [10]. In fact, the MED is characterized by a complex orography, by the presence of several coastlines and by the Mediterranean Sea itself that make not only general- but also regional- and even local-processes influence the climate and its change [15]. RCMs do a better job in reproducing the climate and the MED circulation dynamics with respect to GCMs, but local inhomogeneities cannot yet be adequately represented. Furthermore, climate models are characterized by systematic model errors (bias) that should be corrected before using these projections for local impact and vulnerability assessment studies [16]. Therefore, a downscaling/bias correction of the climate model projections based on observed data is necessary to preserve local heterogeneities [17]. Many methods are available in the literature to post-process climate model data with the aim of eliminating the bias (see for example [18,19,20,21]). Among these techniques, the distribution transfer method (also referred to as statistical downscaling, distribution mapping, quantile-quantile mapping) is widely accepted in the literature [19,22]. When this method is applied at station scale, it can be seen as a combined downscaling/bias correction method [17,21].
The spatial and temporal heterogeneity of the climate in the MED underlines the need for local scale studies to better understand the local impacts of projected changes [23] and to implement effective adaptation strategies, considering that most decisions will be developed at local, regional, or national level [24].
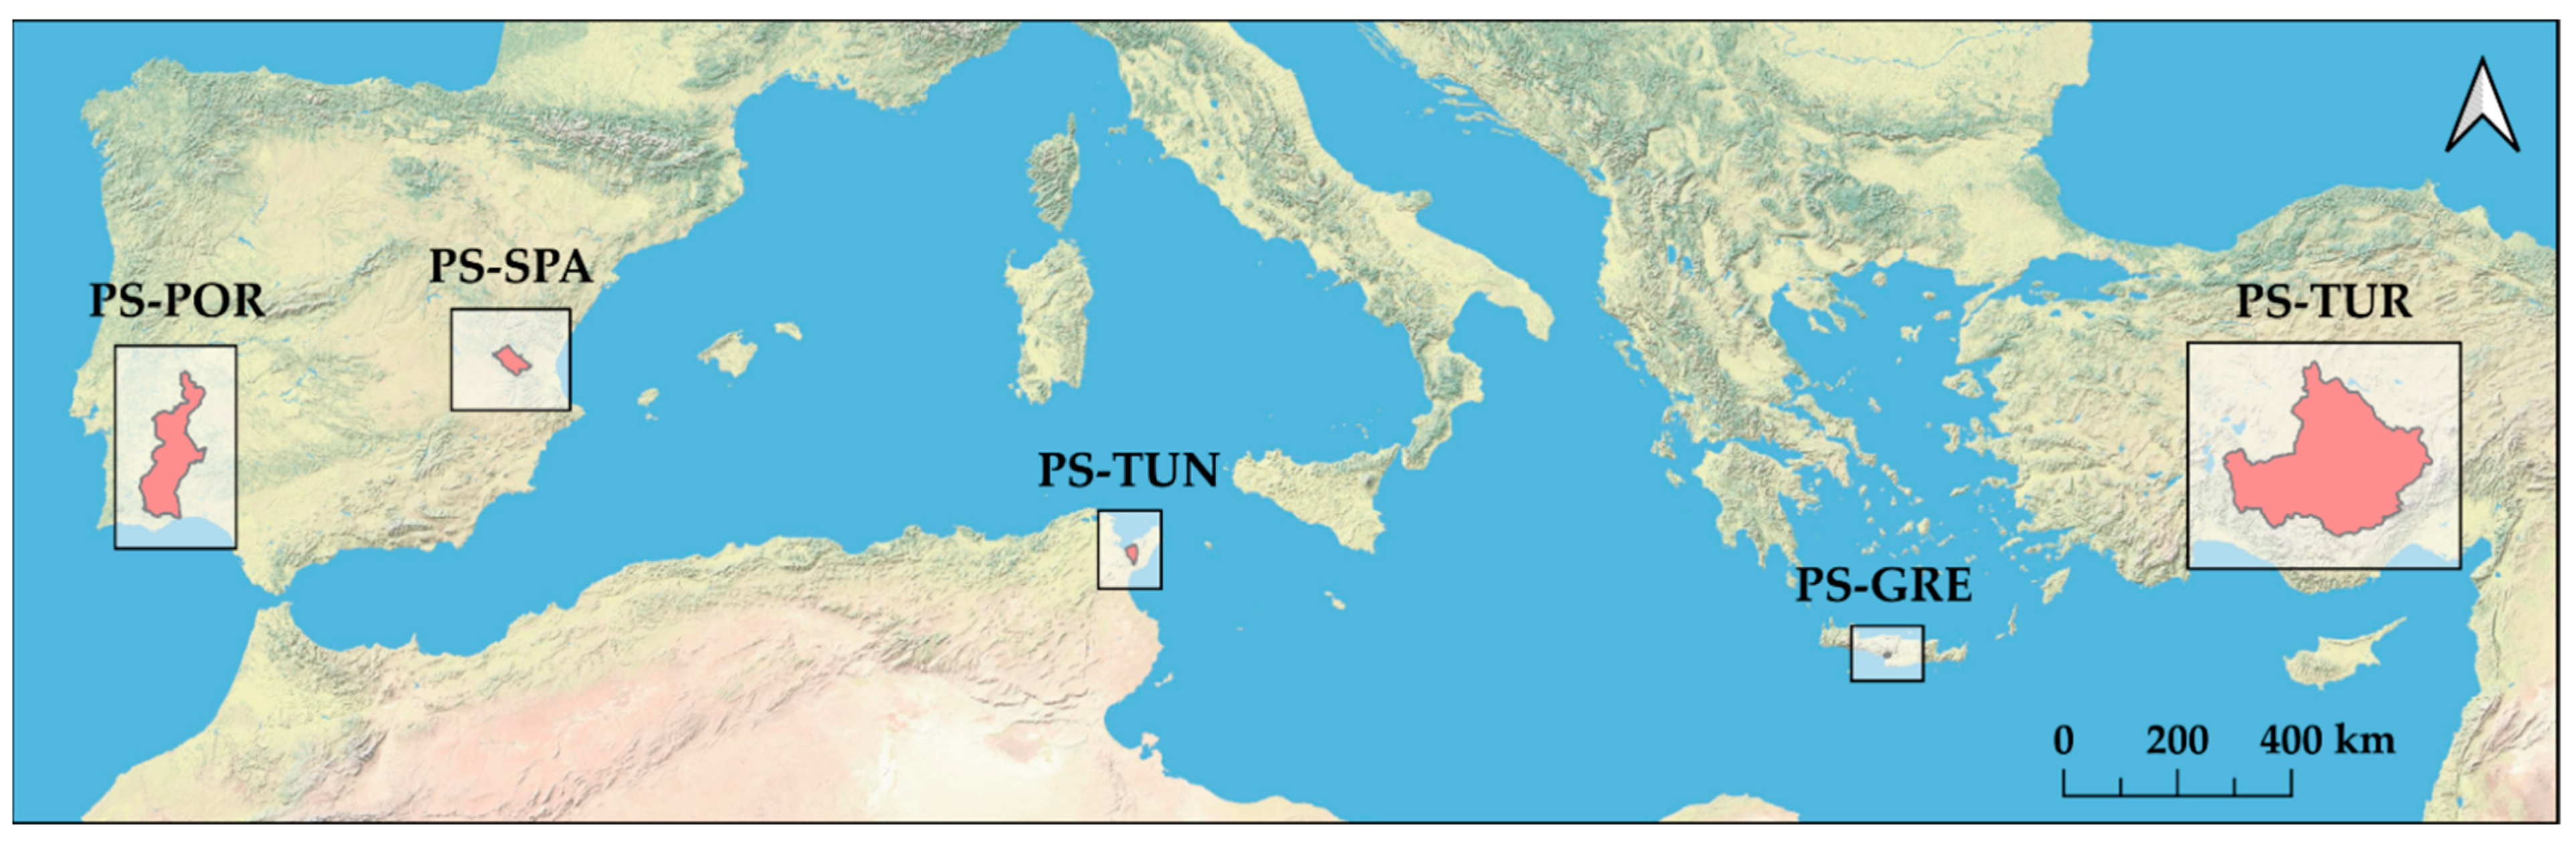
The objective of this work is to analyze the past and future local climate over five pilot sites in the MED. The pilot sites are in Portugal, Spain, Tunisia, Greece and Turkey, areas investigated within the scope of the InTheMED project (https://inthemedprima.com) (accessed on 8 August 2022), part of the PRIMA programme supported by the HORIZON 2020 research and innovation program of the European Union. InTheMED aims to develop innovative tools and methodologies for sustainable groundwater management in the MED. In this paper, we focus on climate in five study areas with the aim to identify potential changes in those drivers (precipitation and temperature) that can influence the aquifers under investigation. For each pilot site, based on precipitation and temperature records, we first investigated the presence of local trends in the observed time series. Then, the observed data were used to statistically downscale/bias correct an ensemble of 17 GCM-RCM combinations provided by the EURO-CORDEX initiative [25]. Two Representative Concentration Pathways (RCPs) or scenarios [1] were used: the RCP4.5 and the RCP8.5. Projections of greenhouse gas emissions depend on socio-economic development and climate policy. RCPs describe different pathways of GHG emissions and atmospheric concentrations, air pollutant and land-use, which by 2100 will result in an increasing in total radiative forcing, relative to pre-industrial levels. The RCP4.5 is an intermediate scenario for which is projected a radiative forcing in the year 2100 of 4.5 W/m2; the peak of emissions is around 2040 and then they decline. The RCP8.5 is the most severe scenario with GHG emissions that continue rising throughout the century; the radiative forcing reached by 2100 is 8.5 W/m2. The post-processed data were used to analyze the local future changes in precipitation and temperature at short- (2021–2040), medium- (2041–2060), and long-term (2076–2095). Changes in the number of consecutive dry days and in the maximum duration and peak temperature of heat waves were also investigated. Compared to previous studies on a global and regional scale, this work aims to provide a better understanding of the local scale climate changes over the considered study areas by accounting for observed data at station scale.
The paper is structured as following: Section 2 reports information on the pilot sites, available data and methods of analysis. The results on historical trends, the climate model projections and the changes in consecutive dry days and heat waves characteristics are shown in Section 3. Results are discussed in Section 4 and a summary and conclusions are reported in Section 5.

2. Materials and Methods

2.1. Pilot Sites and Historical Data

Five study areas, in the MED, are considered as application examples of the concepts and methodologies developed in the InTheMED project. They are located in Portugal (Guadiana Basin), Spain (Requena-Utiel), Tunisia (Grombalia), Greece (Tympaki), and Turkey (Konya). The main characteristics of the pilot sites, depicted in Figure 1, are summarized in Table 1. In the following, we will refer to the pilot sites with the abbreviations reported in Table 1.
To analyze the past climate and perform the bias correction (BC) of the climate models it was necessary to collect precipitation and temperature data at gauging stations over or in the proximity of the study areas. For the BC, we choose the period 1976–2005 (control period), during which the GCM-RCM combinations have been run to simulate the historical climate. For this period, daily records have been collected for each pilot site; the data differ in number and type of gauging stations, amount, and source of information. The temperature data refer to the mean values. Table 2 summarizes the main information on the available data; they have been mainly provided by the competent national services.
Among the available stations, only those that present time series with an amount of data higher than 70% were selected. For the PS-SPA and PS-TUN areas, temperature data at gauging stations in the control period were only sporadically available. Then, after a survey of the international web archives, we downloaded the data from the WATCH Forcing Data dataset (WFD; [26]). For each temperature station, among the time series of the four closest WATCH cells, we selected the one with the best correlation with the (few) observed data available. The gaps in the records for each station were filled according to a linear relationship with the best correlated neighboring gauge, following the guidelines provided by the Food and Agriculture Organization (FAO) of the United Nations [27] and using all available observations. In the absence of contemporary daily information, the missing data were replaced with random values extracted from a normal (for temperature) and log-normal (for precipitation) distributions, with mean and standard deviation of the recorded data. To preserve seasonality, this method was applied on monthly scale (i.e., each month of the available sample has its own mean and standard deviation). In case of precipitation, the probability of no-rain was preserved.

2.2. Climate Model Data

In this study, we considered the climate projections of the EURO-CORDEX initiative (https://www.euro-cordex.net/) (accessed on 8 August 2022). To account for the uncertainty of the climate model projections, we analyzed an ensemble of 17 GCM-RCM combinations with a grid resolution of about 12.5 km (EUR-11 grid). Table 3 reports the GCM-RCM combinations used in this work. Among the available variables, we made use of precipitation and mean temperature data on a daily scale.
The EURO-CORDEX models reproduce the historical climate from 1950/1970 until 2005. Then, they simulate the future climate conditions under different Representative Concentration Pathways (RCPs) or scenarios. In this work, we analyzed the RCP4.5 and the RCP8.5.
The models provide results on a regular grid; a downscaling procedure based on an interpolation method was then performed to obtain the climate variables at each gauging station locations. In particular, we used an inverse squared distance method by processing the values of the climate models in the nine cells closest to the location of the gauge; for details, see [17].
Climate model projections present systematic deviations from the observed data in the historical simulation. The climate model outputs must then be bias corrected (BC) to obtain more reliable projections, especially when used for hydrological impact studies [16]. In the present work, the BC was performed with the distribution mapping method [17,19,28,29], which ensures that cumulative distribution functions of the climate model data, at monthly scale, agree with the ones of the observed data in the control period. In applying the method, the Gaussian distribution function has been adopted to fit the temperature data. The Gamma distribution function has been used to model the wet-day rainfall. For precipitation, before the application of the distribution mapping method, the number of rainy days in the climate models have been adjusted identifying an RCM-specific threshold. For each RCM, the threshold grantees that the number of rainy days in the model is equal to the observed one in the control period. Then, all the projected precipitation below the threshold were set equal to zero. The transfer functions and the thresholds evaluated in the historical period, for each month, have been applied to modify the projected temperature and precipitation until the end of the simulated period.
In the presentation of the results, the historical values have been compared with the estimates evaluated over twenty-year periods so defined: reference period (1986–2005), short-term (2021–2040), medium-term (2041–2060), and long-term (2076–2095).

2.3. Data Analysis Methods

In this work, we studied the past climate and its potential future changes over the MED. For the historical data, the total annual precipitation and the annual mean temperature were analyzed in the reference period 1986–2005. The historical trends in precipitation and temperature, on an annual scale, have been evaluated in the period 1976–2005. At this aim, we used the rank-based non-parametric Mann–Kendall test (MK) [30,31]. The null hypothesis for MK is that there is no monotonic trend in the analyzed time series; this is tested against the alternative hypothesis that there is a trend in the data. Since MK assumes that the data are independent, a serial correlation in the time series can weaken the robustness of the test. For this reason, we checked for autocorrelation in the data before applying MK. For this purpose, we used the Ljung–Box statistical test (LB) [32] which verifies whether there is a serial correlation in a time series. In LB, the null-hypothesis is that the data are independently distributed, while the alternative hypothesis is that they are not independently distributed, that is a serial correlation exists. The hypotheses were tested jointly for the first two lags. To eliminate the influence of serial correlation on MK, different approaches can be used [33]; they can be based on the modification of the variance of MK or they can consist in the application of a pretreatment to the data [34]. In this work, we considered both approaches: the modified MK as proposed by Hamed and Rao (MMK-HR) [35] and the trend-free-pre-whitening approach (MMK-TFPW) as proposed by Yue et al. [36]. In MMK-HR, a theoretical or an approximate relationship is used to modify the MK variance in order to take into account autocorrelation in the data, whereas in MMK-TFPW a pre-whitening procedure is applied to the time series after removing the trend. MK was applied to all the time series considered, while MMK-HR and MMK-TFPW only to those that exhibit autocorrelation. The null hypothesis for all tests has been checked at a significance level of 5%. To quantify the tendency, a linear trend gradient was evaluated with the Theil–Sen method [37], which defines the slope as the median of the slopes computed for all possible pairs of the data considered. The method is nonparametric and it is robust respect to outliers when compared to parametric least-square linear regressions.
In addition to trend analysis, the Pettitt test [38] was used to check the stationarity of the precipitation and temperature data and to identify change points in time series. The test is rank-based and nonparametric with the null-hypothesis that no change point exists in the series and the alternative hypothesis of non-stationarity, which means that a change point can be identified. In this case, the null-hypothesis was also tested at 5% significance level. In addition to detecting the year in which the change occurs, the variation of the means of the observed variables between the two sub-series is also evaluated.
A seasonal analysis was also performed to analyze precipitation and temperature data for the reference period, and then the results have been compared with those of the climate model projections for twenty-year intervals at short-, medium- and long-term. Since we work with an ensemble of climate models, it is of interest to indicate the robustness of the change which represents the level of agreement across the 17 RCMs used. In our work, the changes in climate projections are considered robust if more than 66% of the models agree in the direction of the variation [25]. In addition, we evaluated some climate features that are referenced in the literature as having the greatest impact on anthropogenic activities in the social, agricultural and industrial fields [39,40]: the duration of the heat waves and their peak temperature, and the annual maximum number of consecutive dry days (CDDs). Heat waves define an unusual persistence of hot conditions over a specific region. However, there is no universal definition of heat waves [41]. Usually, they are defined as a set of consecutive days with temperature exceeding a specific threshold, though there is no agreement on either threshold or minimum duration. In this study, we set a temperature threshold for each pilot site equal to the 95% percentile of the June–July–August (JJA) temperature over the reference period [39]. Therefore, a heat wave occurs when this threshold is exceeded, and its duration represents the number of consecutive days exceeding the threshold. Then, for each year, we considered the maximum duration of the heat waves and the peak temperature reached within this period. The maximum number of CDDs has been defined on an annual scale, since a long period of absence of rain can have a strong impact both in summer (agriculture and social context) and in winter (due to the lack of snow or replenishment of water storages). For each twenty-year period, the results are reported in terms of median values.

3. Results

3.1. Historical Data

Table 4 reports the values of the annual mean temperature and total annual precipitation in the reference period 1986–2005 for each pilot site; the areal values were computed from the gauging station data using the Thiessen polygon method. The data highlight variations from one site to another. The warmest area is PS-TUN with an average annual mean temperature of 18.8 °C; the coldest site is PS-TUR with 11.4 °C. The temperature variability in the reference period (Min/Max) is the highest for PS-TUR (9.9/13.1 °C) and the smallest for PS-TUN (18.0/19.4 °C). Looking at the annual average precipitation, PS-TUR is also the driest pilot site (355 mm) and PS-POR is the wettest zone (545 mm). The minimum precipitation variability is observed for PS-TUR (264/458 mm) while the maximum for PS-TUN (291/1092 mm).
The historical trends of the annual mean temperature and annual precipitation were analyzed in the period 1976–2005. Before detecting the trend, the time series were tested for autocorrelation using the Ljung–Box test (LB). The Mann–Kendall test (MK) was then used for all the time series to identify any trend in the data. In addition, the modified MK as proposed by Hamed and Rao (MMK-HR) and the trend-free-pre-whitening approach (MMK-TFPW) were adopted in case of serial correlation for comparison. The Pettitt test was used to identify change points in time series. The significance level for all tests was set at 5%. The trends were quantified through the Theil–Sen estimator (TS). Table 5 reports the results for each pilot site and for temperature and precipitation. The temperature time series exhibit autocorrelation for all sites but PS-TUR; an upward trend is identified by TS for all study areas. The highest gradient is observed for PS-TUR (+0.5 °C/decade); the other MED regions investigated are warming at a rate of +0.2–+0.3 °C/decade. According to MK, the temperature trend is always significant, except for PS-GRE. The trend loses significance for PS-POR when using MMK-HR and MMK-TFPW and the tendency is not significant for PS-SPA when considering MMK-TFPW. All sites but PS-POR show a significant change point. The year of change is 1997 for PS-GRE with a step in the mean (Δ) between the two sub-series of +0.8 °C and 1986 with Δ = +0.7 °C for PS-POR; the date of change is 1993 for PS-TUN and PS-TUR with a Δ equal to +0.6 °C and +1.1 °C, respectively. Annual precipitation time series are not autocorrelated (Table 5) and the precipitation trends do not indicate remarkable variations. A downward trend is observed for PS-GRE, PS-POR, and PS-TUR, with the maximum negative for PS-POR of about −28 mm/decade; PS-SPA and PS-TUN exhibit an upward trend with a maximum gradient of +23 mm/decade for PS-TUN. For all pilot sites, the trend in total annual precipitation is not statistically significant. The Pettitt test shows stationarity in the data for all the time series investigated.

3.2. Climate Model Projections

The outputs of 17 RCM climate models, once bias corrected, have been considered to investigate the future climate over the MED under two different scenarios: RCP4.5 and RCP8.5. In this paper, although the analyses have been performed at each station location, for the sake of brevity and to give an overview of the five different regions, we report the results weighted over the entire study areas. Figure 2 and Figure 3 show the annual mean temperature and the total annual precipitation for the period 1976–2098, for each pilot site and in terms of 10-year moving average, which allows to highlight the climate change signal against natural variability. According to Figure 2, an increase in temperature is expected for the future for all pilot sites and for both scenarios. The warming of the areas is particularly evident for the RCP8.5. Regarding the precipitation, according to both scenarios, the variability between the 17 climate models is high, pointing out a large uncertainty of the climate model projections. PS-GRE and PS-POR, according to the median values, show a decrease in precipitation for the future. On the contrary, PS-SPA, PS-TUN and PS-TUR do not show significant changes.
The RCM outputs have been also analyzed for three future periods, 2021–2040 (short term, ST), 2041–2060 (medium term, MT) and 2076–2095 (long term, LT), and a reference period (1986–2005, RP) for comparison. Table 6 reports the observed and simulated (RCM ensemble median) mean temperature for the reference period on a seasonal and annual scale. The table shows also the differences between the temperature projections (RCM ensemble median) for the three future periods and those of the RP, under the two emission scenarios. In addition, Table 6 reports the robustness of the change; the change is robust if 11 out of 17 models agree in the direction of the change according to the RCM ensemble median [25]. Looking at the reference period, the RCM ensemble medians well mimic the observed data for all pilot sites, confirming the capability of the bias correction of the climate model data to lead to a good reproduction of the local thermometric regime. The analysis on the three future periods indicates a progressive warming over all the areas investigated and for both climate scenarios; the mean temperature increases in all seasons compared to the reference period and the changes are always robust. For PS-GRE, on an annual scale, the temperature increases of 1.00 °C (ST) up to 2.20 °C (LT) for the RCP4.5 and of 1.22 °C (ST) up to 4.29 °C (LT) for the RCP8.5; the maximum is expected during the summer season with a long-term increase of 4.73 °C. For PS-POR, on an annual scale, the increase is of 0.81 °C (ST) up to 1.75 °C (LT) for the RCP4.5 and of 1.00 °C (ST) up to 3.64 °C (LT) for the RCP8.5; the maximum is found in the autumn season with an increase of 4.22 °C at long-term. For PS-SPA, on an annual scale, the temperature increases of 0.97 °C (ST) up to 1.97 °C (LT) for the RCP4.5 and of 1.10 °C (ST) up to 4.04 °C (LT) for the RCP8.5; the maximum is expected during the summer season with an increase of 4.99 °C at long-term. For PS-TUN, on an annual scale, the temperature increases of 0.90 °C (ST) up to 1.89 °C (LT) for the RCP4.5 and of 0.98 °C (ST) up to 3.61 °C (LT) for the RCP8.5; the maximum is in the summer season with an increase of 4.32 °C at long-term. The highest temperature increase is expected for PS-TUR: on an annual scale, the increase is of 1.18 °C (ST) up to 2.73 °C (LT) for the RCP4.5 and of 1.62 °C (ST) up to 5.19 °C (LT) for the RCP8.5. Regarding seasonal variations, the maximum is in the winter season (3.27 °C, LT) for the RCP4.5. For the RCP8.5, the maximum increase of 5.43 °C (LT) is predicted in the spring season.
Table 7 reports the observed and simulated (RCM ensemble median) precipitation in the reference period on a seasonal and annual scale. The table shows also the percentage variations between the precipitation projections (RCM ensemble median) for the three future periods and those of the RP, under the two emission scenarios; the robustness of the changes is also reported. In the reference period, the RCM ensemble medians reproduce quite well the local precipitation regime with small deviations from the observed values. In the three future periods, the analysis indicates positive and negative variation, on a seasonal and annual scale, with respect to the reference period. For PS-GRE, on an annual scale, the precipitation variation is in the range −4.1% (ST) to −15.7% (LT) for the RCP4.5 and in the range −1.8% (ST) to −23.5% (LT) for the RCP8.5, but the change is not robust for both the scenarios. The maximum increment is detected in the autumn season (+9.9%) at short-term and for the RCP4.5, the highest decrease is expected in the winter season (−30.7%) at long-term and for the RCP8.5; both the changes are robust. The summer precipitation has been set equal to zero as the observed and estimated precipitations are always less than 1 mm. For PS-POR, the precipitation variation is almost always negative; at annual scale, the estimate is not robust: the maximum precipitation decrease is expected at long term for the RCP8.5, with a change of −22.9%. The highest decrease is in the summer season (−61.3%) at long-term for the RCP8.5; the maximum increment is detected in the winter season (+13.6%) at long-term for the RCP4.5. For PS-SPA, on an annual scale, the precipitation variation is always below 5%, except at long-term for the RCP8.5 (−18.5%, robust change). The highest precipitation decrease is expected during the summer season at long-term for the RCP8.5 (−38.1%), although this change is not robust. The highest precipitation increment is expected during the autumn season at medium-term for the RCP8.5 (+8.6%, no robust change). For PS-TUN, on an annual scale, the variations are below 6%, except for the no robust change of −16% at long-term under the RCP8.5. The highest decrease is in the summer season at long-term (−34.0% for the RCP8.5) and the maximum increment is expected in the autumn season at long-term for the RCP4.5 (+9.2%). For PS-TUR, no significant changes are expected in the future; on an annual scale, the change rates are very low. The highest decrease is found in the summer season at long-term for the RCP8.5 (−28.5%), while the maximum increment is expected in the autumn season at short-term for the RCP4.5 (+ 10.4%) and both changes are robust.
It is noteworthy that the inter-model variability of the precipitation data is high, as highlighted in Figure 3, leading to a large uncertainty about RCM precipitation projections and rarely robust changes.

3.2.1. Heat Waves: Duration and Peak Temperature

For the heat waves, we analyzed two characteristics: maximum duration and peak temperature. We evaluated the heat wave duration on an annual scale, defined as the number of consecutive days in which the mean daily temperature exceeds a threshold. The threshold has been defined at local scale as the 95% percentile of the JJA mean temperature observed in the reference period. The threshold for each pilot site is reported in Table 8. Then, for each year, we considered the maximum duration of the heat waves and the peak temperature reached within this period. Figure 4 and Table 8 report the heat wave duration for the five investigated areas in the reference period and in the short- (ST), medium- (MT) and long-term (LT), under the two RCP scenarios; the observed value is also reported for comparison. For each RCM, the median value of the annual maximum durations in the twenty-year periods has been considered. The box-whisker plots show the variability between the 17 climate models. The inter-model variability in the reference period is very small and all RCM projections well reproduce the observed values. For all pilot sites, the maximum duration of the heat waves increases over time. The durations evaluated at short- medium- and long-term are always higher than those of the reference period. For PS-GRE, PS-SPA and PS-TUR the maximum number of consecutive days with mean daily temperature above the threshold is similar: the maximum heat wave duration increases from 5 (ST) to 8–9 (LT) days under the RCP4.5 scenario and from 5–6 (ST) to 23–23.5 (LT) days for the RCP8.5. The pilot site that presents the shortest duration is PS-POR; the maximum heat wave duration is in the range 3.5 (ST) to 6.5 (LT) days for the RCP4.5 and in the range 5 (ST) to 13.5 (LT) days for the RCP8.5. The highest heat waves duration is expected for PS-TUN at long-term for the RCP8.5: the maximum number of consecutive days above the threshold, with reference to the median value, is 38 days. The inter-model variability amplifies over time; however, all climate models exhibit longer lasting heat waves in the future.
The severity of heat waves, in terms of peak temperature, is increasing over time in the MED (Figure 5, Table 8). With respect to the median values, the hottest day on the heat wave event (with maximum duration) shows a progressive temperature increase in the three future periods; the peak temperature is always higher than that of the reference period. PS-GRE, PS-TUN and PS-TUR show similar variations: compared to the reference period, the heat wave peak temperature increases of 0.7–0.9 °C (ST) up to 2 °C (LT) for the RCP4.5 and of 0.9–1.1 °C (ST) up to 4.5–4.7 °C (LT) for the RCP8.5. The minimum changes in the peak temperature are detected for PS-POR, for which the difference between the median values evaluated in the reference period and the ones estimated at long-term is 1.6 °C for the RCP4.5 and 3.5 °C for the RCP8.5. The highest changes are projected for PS-SPA: the hottest day has a temperature increase in the range 1.1 °C (ST) to 2.2 °C (LT) for the RCP4.5 and an increase of 1.4 °C (ST) up to 5.5 °C (LT) for the RCP8.5.

3.2.2. Consecutive Dry Days

The consecutive dry days (CDDs) are used to describe meteorological droughts in the investigated areas. For each year, we evaluated the maximum number of consecutive days with daily precipitation less than 1 mm. In Figure 6 and Table 9, the results are reported in terms of median values evaluated in the twenty years of the reference period, using observed and RCM data, and with regard to the three future periods, under the RCP4.5 and the RCP8.5. The box-whisker plots show the inter-model variability between the RCMs. The maximum number of CDDs evaluated in the reference period using the RCM data spans in a wide range and shows deviations from that observed in the same period. This highlights the greater uncertainty in the precipitation data of the RCMs and in their capability to correctly reproduce this climate feature. The inter-model variability remains high also for the future periods and increases over time.
The CDDs projections are different for the five pilot sites under investigation. For PS-GRE and PS-POR the maximum number of consecutive dry days for the future periods is in the range of the median value observed in the reference period, even if all climate models underestimate the maximum number of CDDs in the RP. With respect to the median values, the maximum number of CDDs exceeds the observed one only at long-term under the RCP8.5 scenario for PS-GRE, and at medium-term for the RCP8.5 and at long-term for both scenarios for PS-POR. It is noteworthy that PS-GRE and PS-POR are the areas that present the highest number of CDDs in the historical period, the medians of the observed consecutive dry days in the reference period are 151 and 86 days for PS-GRE and PS-POR, respectively. For PS-SPA, PS-TUN, and PS-TUR, the projected maximum number of CDDs is always longer than those evaluated in the reference period. The number of consecutive dry days increase over time, in particular for RCP8.5, with a high inter-model variability. According to the more severe scenario, for PS-SPA, the maximum number of CDDs is in the range from 57.5 (ST) to 64 (LT); for PS-TUN, the maximum number of CDDs is in the range from 72 (ST) to 104.5 (LT); for PS-TUR, the maximum number of CDDs is in the range from 73.5 (ST) to 93 (LT).

4. Discussion

It is worth discussing a comparison of the results of our study with the findings of other works conducted over the regions where the pilot sites of the IntheMED project are located. To this end, a review of the literature was completed aimed at identifying studies that carry out evaluations on the trend of temperature and precipitation in a period corresponding to (or closer to) our control period (1976–2005) and that report future climate analyses with a spatial scale comparable to that of our study.
In the absence of specific studies, with the desired characteristics, we referred to the Climate Change Knowledge Portal of the World Bank Group (CCKP-WBG in short) [42]. It provides a global climate analysis at national level, with details for regional areas, on both past trends and future projections of temperature and precipitation. For the future projections of the climate variables the portal reports the ensemble mean of 20 GCM models developed in the context of CMIP5 according to different RCP scenarios. Among them, the results for the RCP4.5 and RCP8.5 were considered, in accordance with our analysis.
In the following, the comparison between our results and those of other literature works is reported for each pilot site.

4.1. PS-GRE

For PS-GRE, some works are present in the literature that study past and future climate. Mamara et al. [43] analyzed the temperature trend in the historical period 1960–1976 using the observations collected at 52 stations over Greece. Positive trends are detected for those stations located in northern Greece while no significant variations have been detected in the rest of the country. For Tympaki (included in PS-GRE) a positive trend (significant) of 0.1 °C/decade is reported. These estimates were confirmed by Feidas [44] who analyzed the data collected at 20 stations over Greece up to 2013. For the station of Heraklion, which is the only station in Crete (where our study area is located), the annual temperature trend is slightly positive and not statically significant. These results are comparable with our findings at least for the sign of the trend (+0.2 °C/decade without statistical significance).
Regarding the precipitation in Crete, the CCKP-WBG reports a negative trend of −3.9 mm/decade (not significant) for the years 1971–2020 and a positive significant trend of +15.8 mm/decade for the period 1991–2020. Philandras et al. [45] analyzed the precipitation trends of several stations over the MED: they obtained for Heraklion downward trends (not significant) of −35 mm/decade for the period 1947–2010 and −40 mm/decade for 1951–2010. Similarly, our analysis gives a not significant decrease of −26 mm/decade in the period 1976–2005. These tendencies are also common in other parts of Greece. For example Kastridis et al. [46] in the period 1961–2020 found, for the eastern part of the Pindos Mountain in central continental Greece, no significant trends in precipitation. On the contrary, the mean annual temperature presented a statistically significant increase over time. The temperature remained stable until 1998; then, an abrupt increase occurred lasting until 2020. This finding is comparable with our result for PS-GRE.
The future climate projections over the island of Crete were investigated by Tsanis et al. [47], who used the outcomes of 10 GCM-RCM models developed under CMIP4 with the SRES A1B scenario until 2100. A1B provides a good mid-line scenario for carbon dioxide emissions and economic growth [46]; it is similar to the RCP6.0. The reference period for the evaluation of changes is 1970–2000. During the upcoming period 2010–2040, Tsanis et al. [47] found over Crete a reduction in precipitation of 12% and an increase in mean temperature of 1.9 °C. For the period 2040–2070, the average precipitation is expected to decrease by 20%, while average temperature is expected to increase by 3.8 °C. Although the trends agree in the sign, our results at medium-term (2041–2060), under both RCP scenarios, show a less severe decrease in precipitation (−9.3%, RCP4.5; −13.5%, RCP8.5) and lower temperature warming (+1.48 °C, RCP4.5; +2.08 °C, RCP8.5). It is noteworthy that the investigated periods are not the same and our findings are related to a specific area of Crete.
Georgoulias et al. [48] analyzed the outcomes of 11 GCM-RCM combinations from the EURO-CORDEX initiative for Greece. The authors reported the changes in climate variables for the near-future (2021–2050) and at the end-of-the-century (2071–2100) relative to the reference period 1971–2000. For Crete, in the near future, the results show a temperature increase of about 1 ÷ 1.5 °C under RCP4.5 and 1.5 ÷ 2 °C under RCP8.5. At the end of the century, the temperature is expected to increase in the range 2 ÷ 2.5 °C under RCP4.5 and 3.5 ÷ 4.5 °C under RCP 8.5. These results are fully comparable with our findings at MT and LT.
Regarding the annual precipitation, the projections in the period 2021–2050 give a decrease in the range 6 ÷ 9% under both RCP4.5 and RCP8.5. In the period 2071–2100, the precipitation is expected to decrease of 12 ÷ 15% under RCP4.5 and 21 ÷ 30% under RCP8.5. These results agree with those reported in our paper in Table 7 for PS-GRE at MT and LT.
Georgoulias et al. [48] also investigated the change in the CDD index. For the area of Crete, in the near future, with respect to the reference period, the results show an increase in CDD in the range of 4 ÷ 8 days and 6 ÷ 10 days under RCP4.5 and RCP8.5, respectively. In the period 2071–2100, the CDD are expected to increase of 8 ÷ 14 days under RCP4.5 and 18 ÷ 24 days under RCP8.5. Our results are comparable with the ones obtained by Georgoulias et al. [48] (Table 8).

4.2. PS-POR

For PS-POR, we compare our findings with those of Valverde et al. [49,50], Rodrigo and Trigo [51], and Guerriero et al. [52]. Valverde et al. [49] evaluated the tendencies of several climate parameters observed over the Guadiana river basin (where the PS-POR is located) in the period 1963–2009. Regarding the annual mean temperature, they estimated a positive trend of +0.3 °C/decade. This result is confirmed by the CCKP-WBG, which gives an upward trend of +0.3 °C/decade in the period 1971–2020. Both studies are in agreement with our results (Table 5).
Regarding annual precipitation, Valverde et al. [49] found a significant downward trend of −34 mm/decade, which is comparable with the trend estimated in our paper (−28 mm/decade, Table 5). The CCKP-WBG reports a negative trend (not significant) of about −6.5 mm/decade. Rodrigo and Trigo [51] examined trends in daily precipitation in the Iberian Peninsula in the period 1951–2002 from 22 gauging stations. Three stations are located in the Guadiana basin. The trends in the total annual precipitation result negative, but not significant, for one of the stations and significant with downward trend of −40 mm/decade for the remaining two. Our results agree only in the sign of the trend.
For the future climate analysis, the CCKP-WBG provides the temperature anomaly for different projection periods with respect to 1986–2005. In the period 2040–2059, the anomalies are in the range 1.10 ÷ 1.61 °C and 1.36 ÷ 2.15 °C for the RCP4.5 and RCP8.5, respectively. Our results, at medium-term, are within the range of the CCKP-WBG estimates (1.37 °C, RCP4.5; 1.72 °C, RCP8.5). Valverde et al. [50] analyzed the future climate change in the Guadiana river basin with the aim to evaluate its impact on irrigated agriculture. The outcomes of 16 IPCC models under three future emissions scenarios (A2, B1, A1B) of the CMIP3 were considered. In the period 2041–2070, with respect to the historical period 1961–1990 and considering the central tendency scenario, the annual mean temperature is expected to increase of 2.31 °C and the annual precipitation is projected to decrease of 15.20 mm. With respect to our projections at medium-term (2041–2060), the authors found a higher increase in temperature and a larger reduction in precipitation, but their investigated period is longer than our MT.
Guerriero et al. [52] analyzed rainfall projections from climate models for the Douro, the Tagus and the Guadiana basins; in particular, 15 GCMs developed under the CMIP5 were used. A gridded daily rainfall dataset for Iberia, covering the period from 1950 to 2003, was used to collect historical data and for downscaling the climate model projections. With reference to the period 2041–2070, a decrease in the annual precipitation is expected between 12.5% and 24%, depending on the downscaling methodology. Our results, for the period 2041–2060, give a reduction in precipitation of about 13% and 14% for the RCP4.5 and RCP8.5, respectively. They are in the range of the estimates of Guerriero et al. [52].

4.3. PS-SPA

For PS-SPA, we compare our results with those provided by the CCKP-WBG and those obtained by Mirò et al. [53]. For the historical trend analysis, in the area of Requena-Utiel, the CCKP-WBG indicates an increase in the annual mean temperature of 0.3 °C/decade in the period 1951–2020, which agrees with our results (Table 5). Mirò et al. [53] analyzed the rainfall changes in the Jucar basin where the PS-SPA is located. The historical data were analyzed in the period 1955–2016, resulting in a downward trend in the area close to PS-SPA of about −30 mm/decade. On the contrary, our study indicates a slightly positive trend (+5 mm/decade), not significant.
For the future climate projections, the CCKP-WBG indicates a temperature increase in the period 2040–2059, with respect to the period 1986–2005, of about 1.60 °C and 2.12 °C for the RCP4.5 and RCP8.5, respectively. These results agree with those reported in Table 7 for PS-SPA at MT (+1.47 °C, RCP4.5; +1.98 °C, RCP8.5). Regarding the precipitation projections, Mirò et al. [54] performed the analysis for three future periods (2021–2040, 2051–2070, 2081–2100) considering six GCMs under the RCP4.5 and RCP8.5. The projections of each GCM were analyzed separately in order to evaluate the variability of the predictions. For the period 2051–2070, with respect to the historical period 1981–2010, the annual precipitation is expected to vary in the range +5% ÷ −40% under the RCP4.5 and in the range −10% ÷ −50% under RCP8.5. The ranges are quite large because the six GCM models provide different projections. Our estimates at medium term (−2.6%, RCP4.5, not robust; +0.2%, RCP8.5, robust) are within the range provided by Mirò et al. [54] considering the RCP4.5, but differ for the RCP8.5.

4.4. PS-TUN

For PS-TUN, we compare our analysis with those provided by the CCKP-WBG and the studies of Driouech et al. [55] and Philandras et al. [45]. Driouech et al. [55] investigated the climate evolution and change in North Africa. The historical analysis in the period 1960–2009 includes the observations collected at five gauging stations located in Tunisia. For the station of Tunis, which is the closest one to our pilot site, a positive, not significant, precipitation trend of +11 mm/decade is detected in agreement, as far as the sign, with our results (+23 mm/decade). With regard to temperature, an upward trend of 0.4 °C/decade is observed. The CCKP-WBG for the Nabeul area, which is the same as the PS-TUN, reports an annual mean temperature increase of 0.3 °C/decade in the years 1951–2020, which is the same as our results (Table 5).
About the annual precipitation, Philandras et al. [45] analyzed the trends considering several stations over the MED: they determined for Tunis an upward trend (significant) of +9.8 mm/decade for the period 1900–2010 and a downward trend (not significant) of −8.2 mm/decade for the period 1951–2010. The CCKP-WBG reports, in the period 1971–2020, a negative precipitation trend of about −10.7 mm/decade (not significant). Our analysis, for the period 1976–2005, gives an increase (not significant) of +23 mm/decade.
Regarding the future climate projections, the CCKP-WBG indicates for the area of Nabeul a temperature increase in the period 2040–2059, with respect to the period 1986–2005, of 1.56 °C and 2.15 °C for the RCP4.5 and RCP8.5, respectively. Driouech et al. [55] performed future climate analysis using the General Climate Model ARPEGEClimate under the A1B scenario by comparing the historical period 1971–2000 to the future period 2021–2050. The authors indicate that the annual mean temperature is expected to increase in the range 1.2 ÷ 1.8 °C. These results agree with those reported in Table 6 at medium term (1.30 °C, RCP4.5; 1.85 °C, RCP8.5).
With respect to precipitation, in the area close to the PS-TUN, the analysis of Driouech et al. [55] shows no remarkable change in the annual precipitation, similar to our results at medium term for both scenarios.

4.5. PS-TUR

For PS-TUR, we compare our analysis with the information given by the CCKP-WBG and the results obtained by Duygu et al. [56]. CCKP-WBG indicates, in the area of Konya, where PS-TUR is located, and for the period 1970–2020, an annual temperature increase of 0.2 °C/decade, which is in discrete agreement with our result (0.3 °C/decade, Table 5). Moreover, concerning the annual precipitation, CCKP-WBG shows a downward trend of −9.2 mm/decade over the period 1971–2020, which agrees in terms of trend sign with that estimated in our study (−16 mm/decade, not significant).
For the future climate analysis, the CCKP-WBG reports for the area closest to PS-TUR, a temperature increase of 1.70 °C and 2.48 °C for the RCP4.5 and RCP8.5, respectively, in the period 2040–2059 compared to 1986–2005. Duygu et al. [56] analyzed the future precipitation and temperature variations in order to assess the potential effects of global climate change on Konya Basin and better develop drought management plans. They used the outcomes of three GCMs developed under the CMIP5 program using the RCP4.5 and RCP8.5 scenarios. The results indicate that, until 2050, the total annual precipitation is expected to decrease in the range 6 ÷ 15% and the mean temperature to increase in the range 1 ÷ 2.5 °C. Our results at medium-term (2041–2060) are in good agreement (1.86 °C, RCP4.5; 2.78 °C, RCP8.5) with these studies for the temperature, while the precipitation analysis provides different projections (−3.1%, RCP4.5; −2.7%, RCP8.5).
According to the literature review reported above, we found significant differences between the approaches adopted, such as the selection of historical or future periods, of climate models and scenarios used and of methodologies. This makes the comparison between the various studies not always straightforward. However, according to our results and the analyzed literature, a temperature increase is already underway for all pilot sites and will continue for the future, albeit with different characteristics on a local scale. Precipitation changes differ more between both the various studies and the analyzed areas, highlighting a higher variability and uncertainty of the results. Generalizing, we noticed a better agreement between our results and those reported in the literature if we refer to historical trends or climate projections of the temperature and more discordant results with reference to the precipitation. We recall that, to preserve the heterogeneity of the MED, local studies that exploit the observed data to identify tendencies but also to adjust the future climate projections are needed. This is particularly important when the data are used for impact assessment studies.

5. Summary and Conclusions

In this study, we analyzed past and future changes in precipitation and temperature at five pilot sites in the Mediterranean region. The historical trend analysis performed for the period 1976–2005 shows a positive temperature gradient for all the areas considered, statistically significant for some sites. The highest warming rate is observed for PS-TUR; the annual mean temperature has increased at a rate of 0.5 °C/decade. The precipitation observed in the same period indicates a negative gradient for PS-GRE, PS-POR and PS-TUR and positive for PS-SPA and PS-TUN, but the tendencies are never significant.
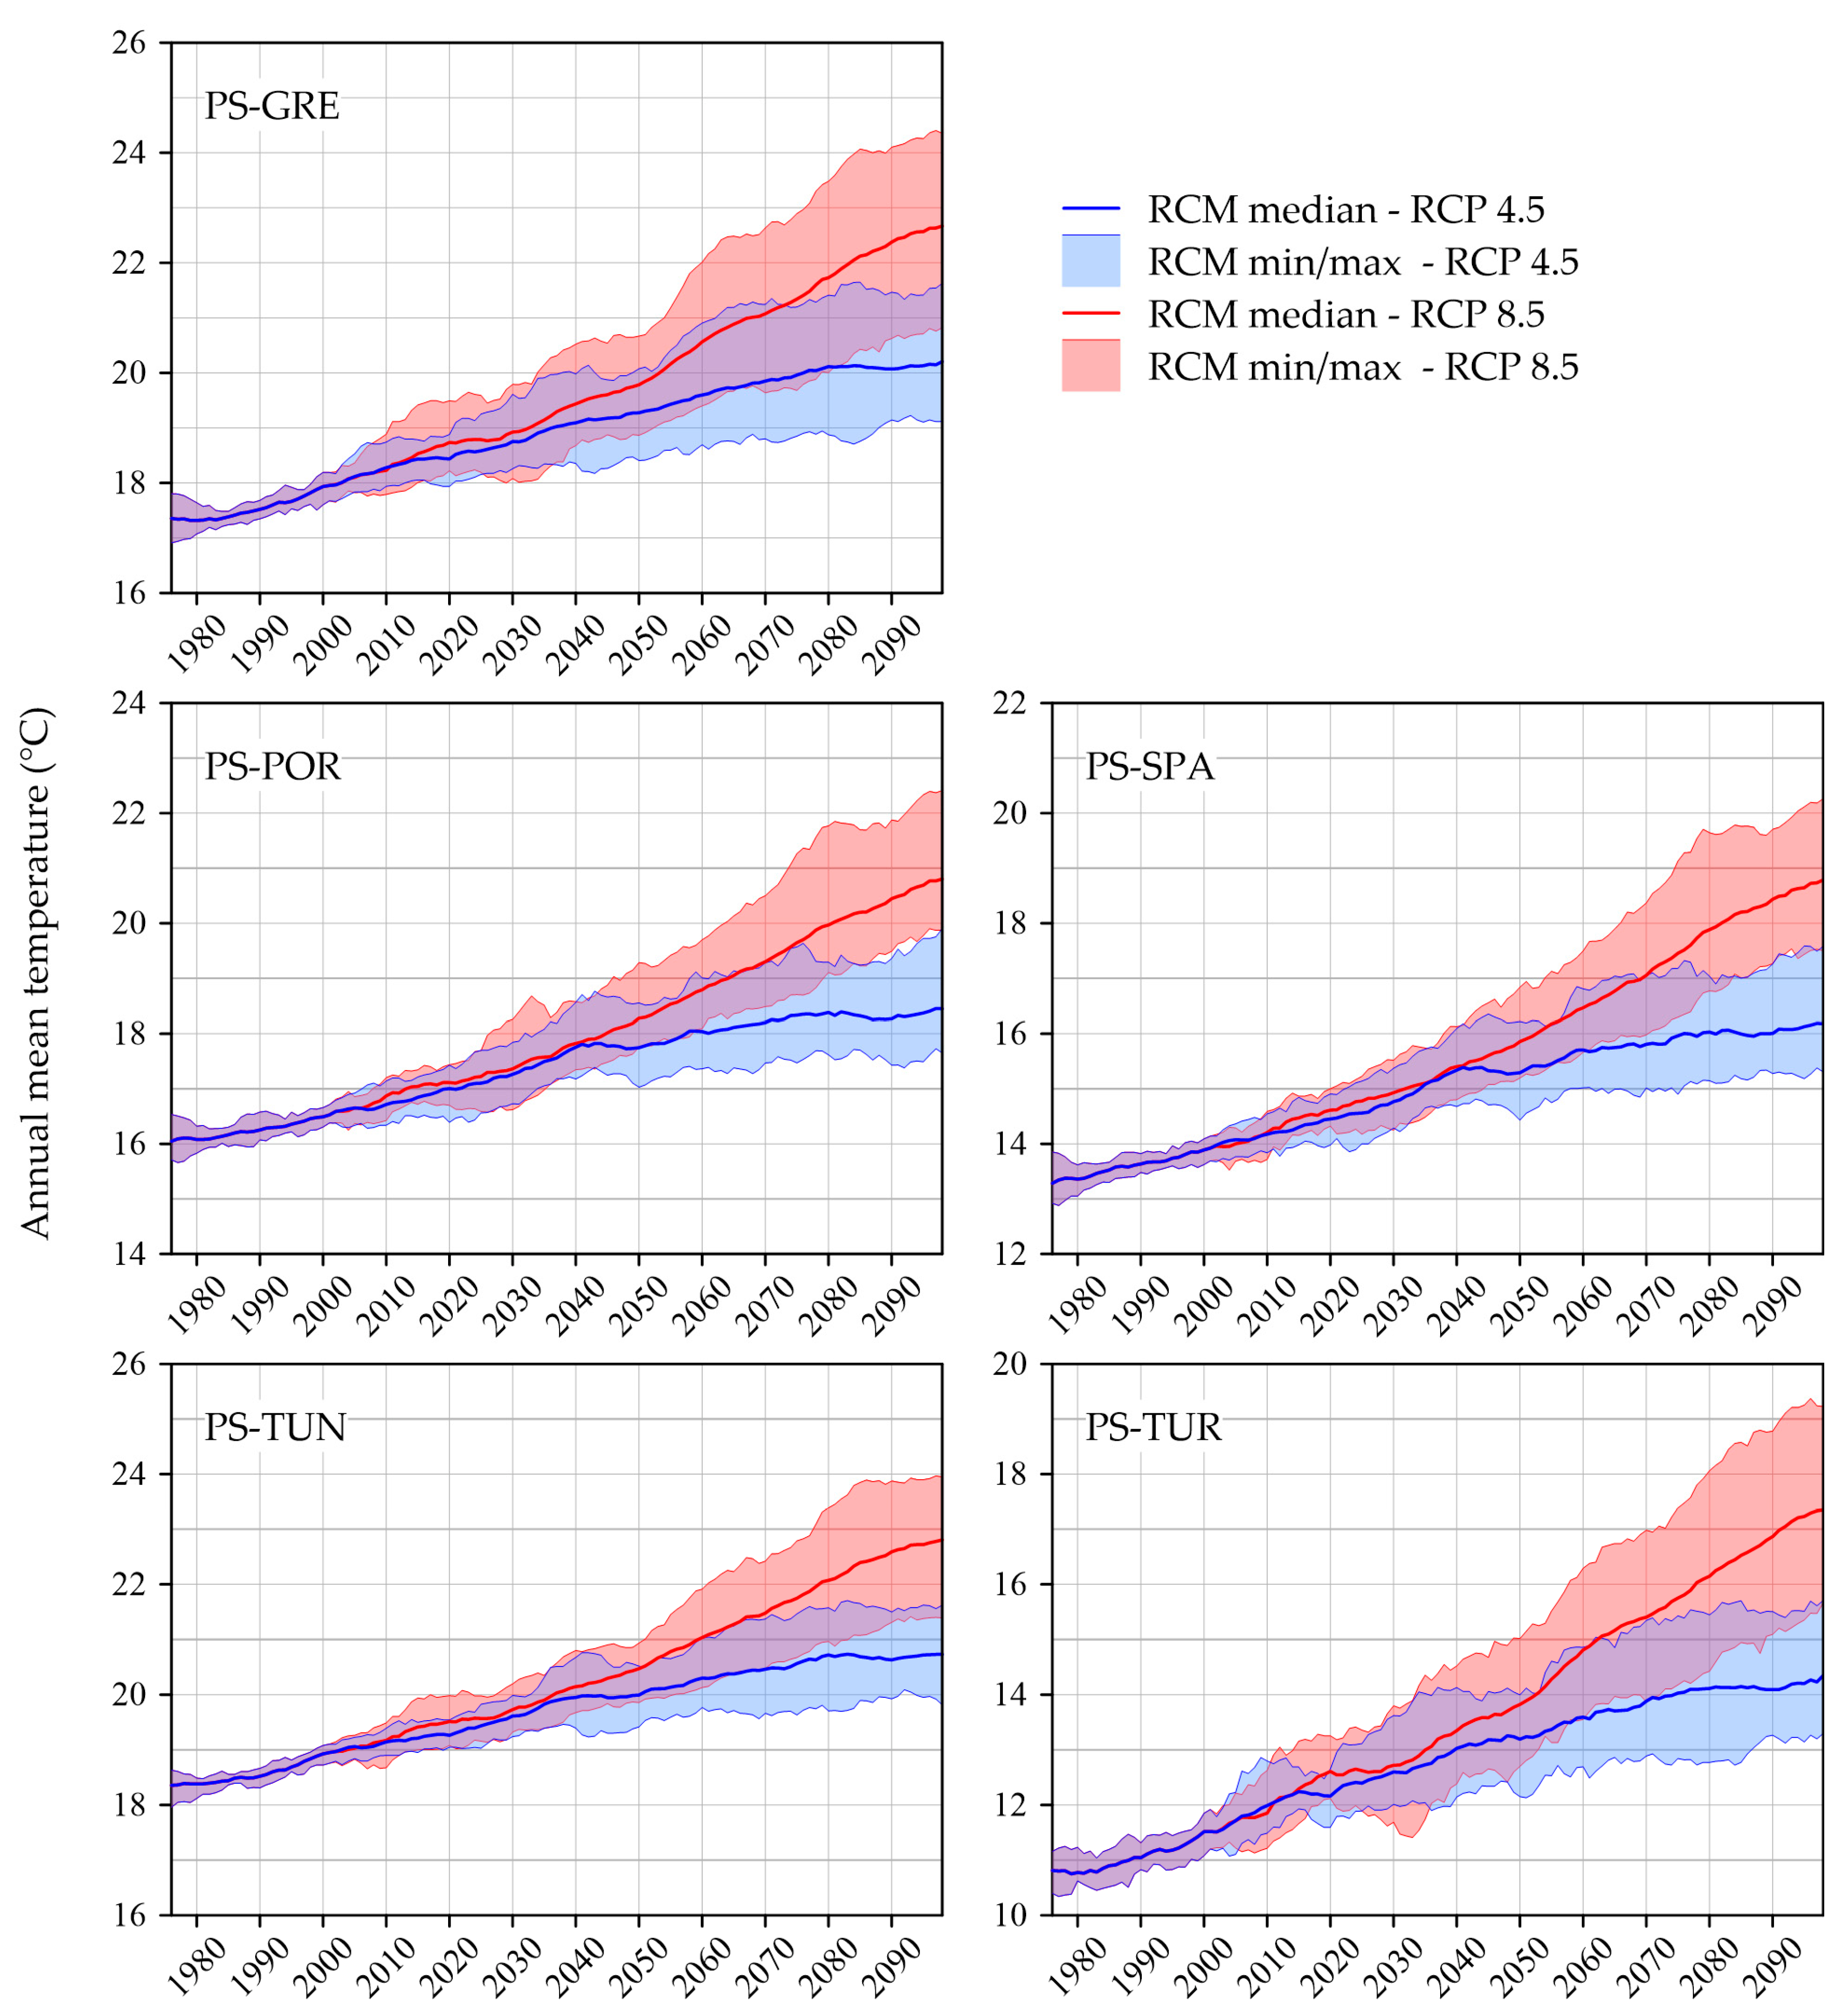
The progressive increase in temperature in the MED, already detectable in the historical period, is confirmed by the projections of the climate models until the end of this century. We used an ensemble of 17 GCM-RCM simulations from the EURO-CORDEX initiative to evaluate the future climate in the five study areas. Two different scenarios have been considered: the moderate emission scenario RCP4.5 and the highest forcing scenario RCP8.5. The precipitation and temperature variations have been analyzed in three future periods at short- (2021–2040), -medium (1941–2060), and long (2076–2095) term in comparison with a reference historical period (1986–2005). For all pilot sites, the whole RCM ensemble agrees in the gradual increase of the mean temperature; changes are always robust. The highest warming is projected for PS-TUR; compared to the reference period, the annual mean temperature at the end of the century is expected to be about 2.7 °C higher considering the RCP4.5 scenario and more than 5 °C according to the RCP8.5 scenario. The most remarkable increases are projected during the winter and spring seasons; this may lead to an alteration in the fraction of precipitation that falls in the form of snow affecting the hydrological balance of the area. For PS-GRE and PS-SPA, the annual mean temperature is expected to increase by approximately 2 °C for the RCP4.5 and 4 °C for the RCP8.5. The highest changes are projected during summer reaching increases of about 5 °C for the most severe scenario. For PS-POR and PS-TUN, the variations are about 2 °C for the RCP4.5 and 3.5 °C for the RCP8.5. The maximum temperature increase detected in PS-TUR, which is the coldest region among the investigated pilot sites, and the minimum increase in PS-TUN, which is the hottest region, suggest a reduction in the climate heterogeneity that could lead to the loss of biodiversity [57].
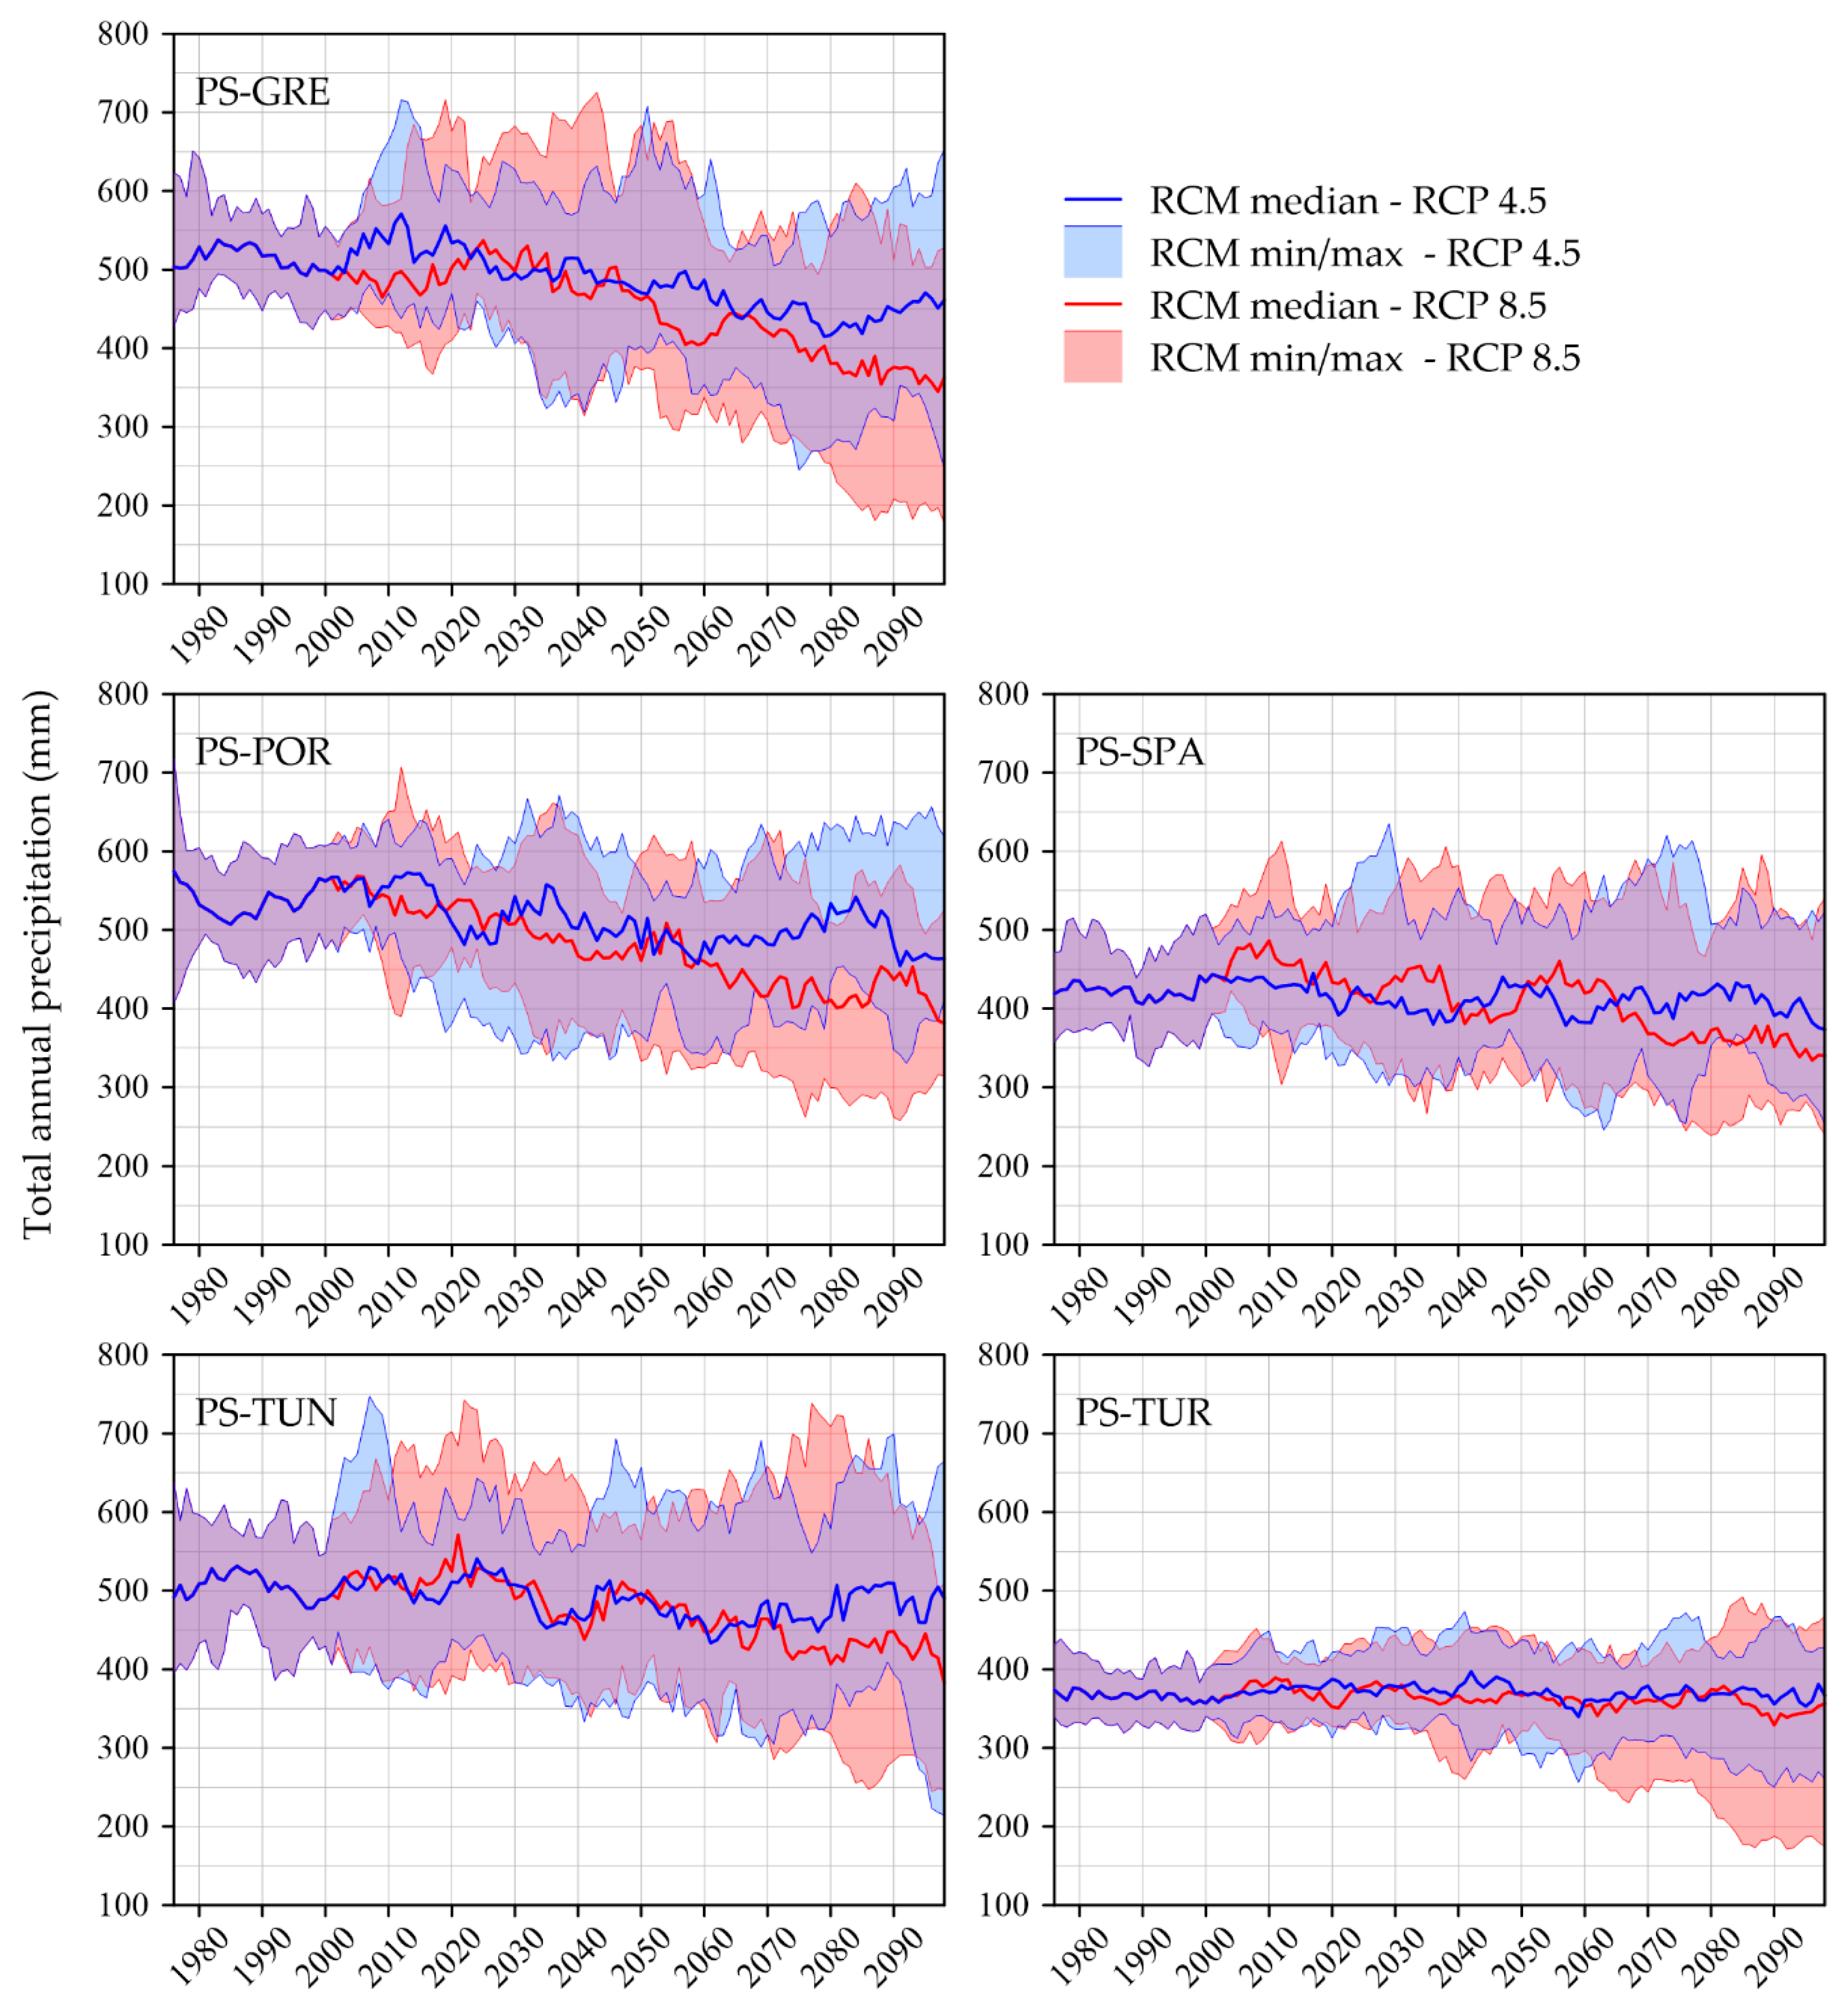
Precipitation projections are more uncertain; the variations, with respect to the reference period are rarely robust. The inter-model variability is high, increases over time, and often exceeds the future projected changes. However, systematic changes are expected for some seasons. For PS-GRE, robust decreases of the winter precipitation for almost all future periods and both scenarios are expected (−7 ÷ −31%), as well as a robust increase in autumn at short-term for the RCP4.5 (+10%) and the RCP8.5 (+5%). For PS-POR, robust precipitation decreases are projected in summer (−16 ÷ −61%) and autumn (−17 ÷ −35%) for all periods and scenarios. For PS-SPA, robust decreases in spring (−2 ÷ −24%) and autumn precipitation (−3 ÷ −10%) are estimated for almost all periods and scenarios, as well as a robust increase of the summer precipitation at short-term for the RCP4.5 (+7.5%). For PS-TUN, robust and significant decreases are expected in spring (−12 ÷ −29%) and winter precipitation (−0.3 ÷ −11%). For PS-TUR, robust summer precipitation decreases (−13 ÷ −29%) and autumn precipitation increases (+3 ÷ +10%) are estimated.
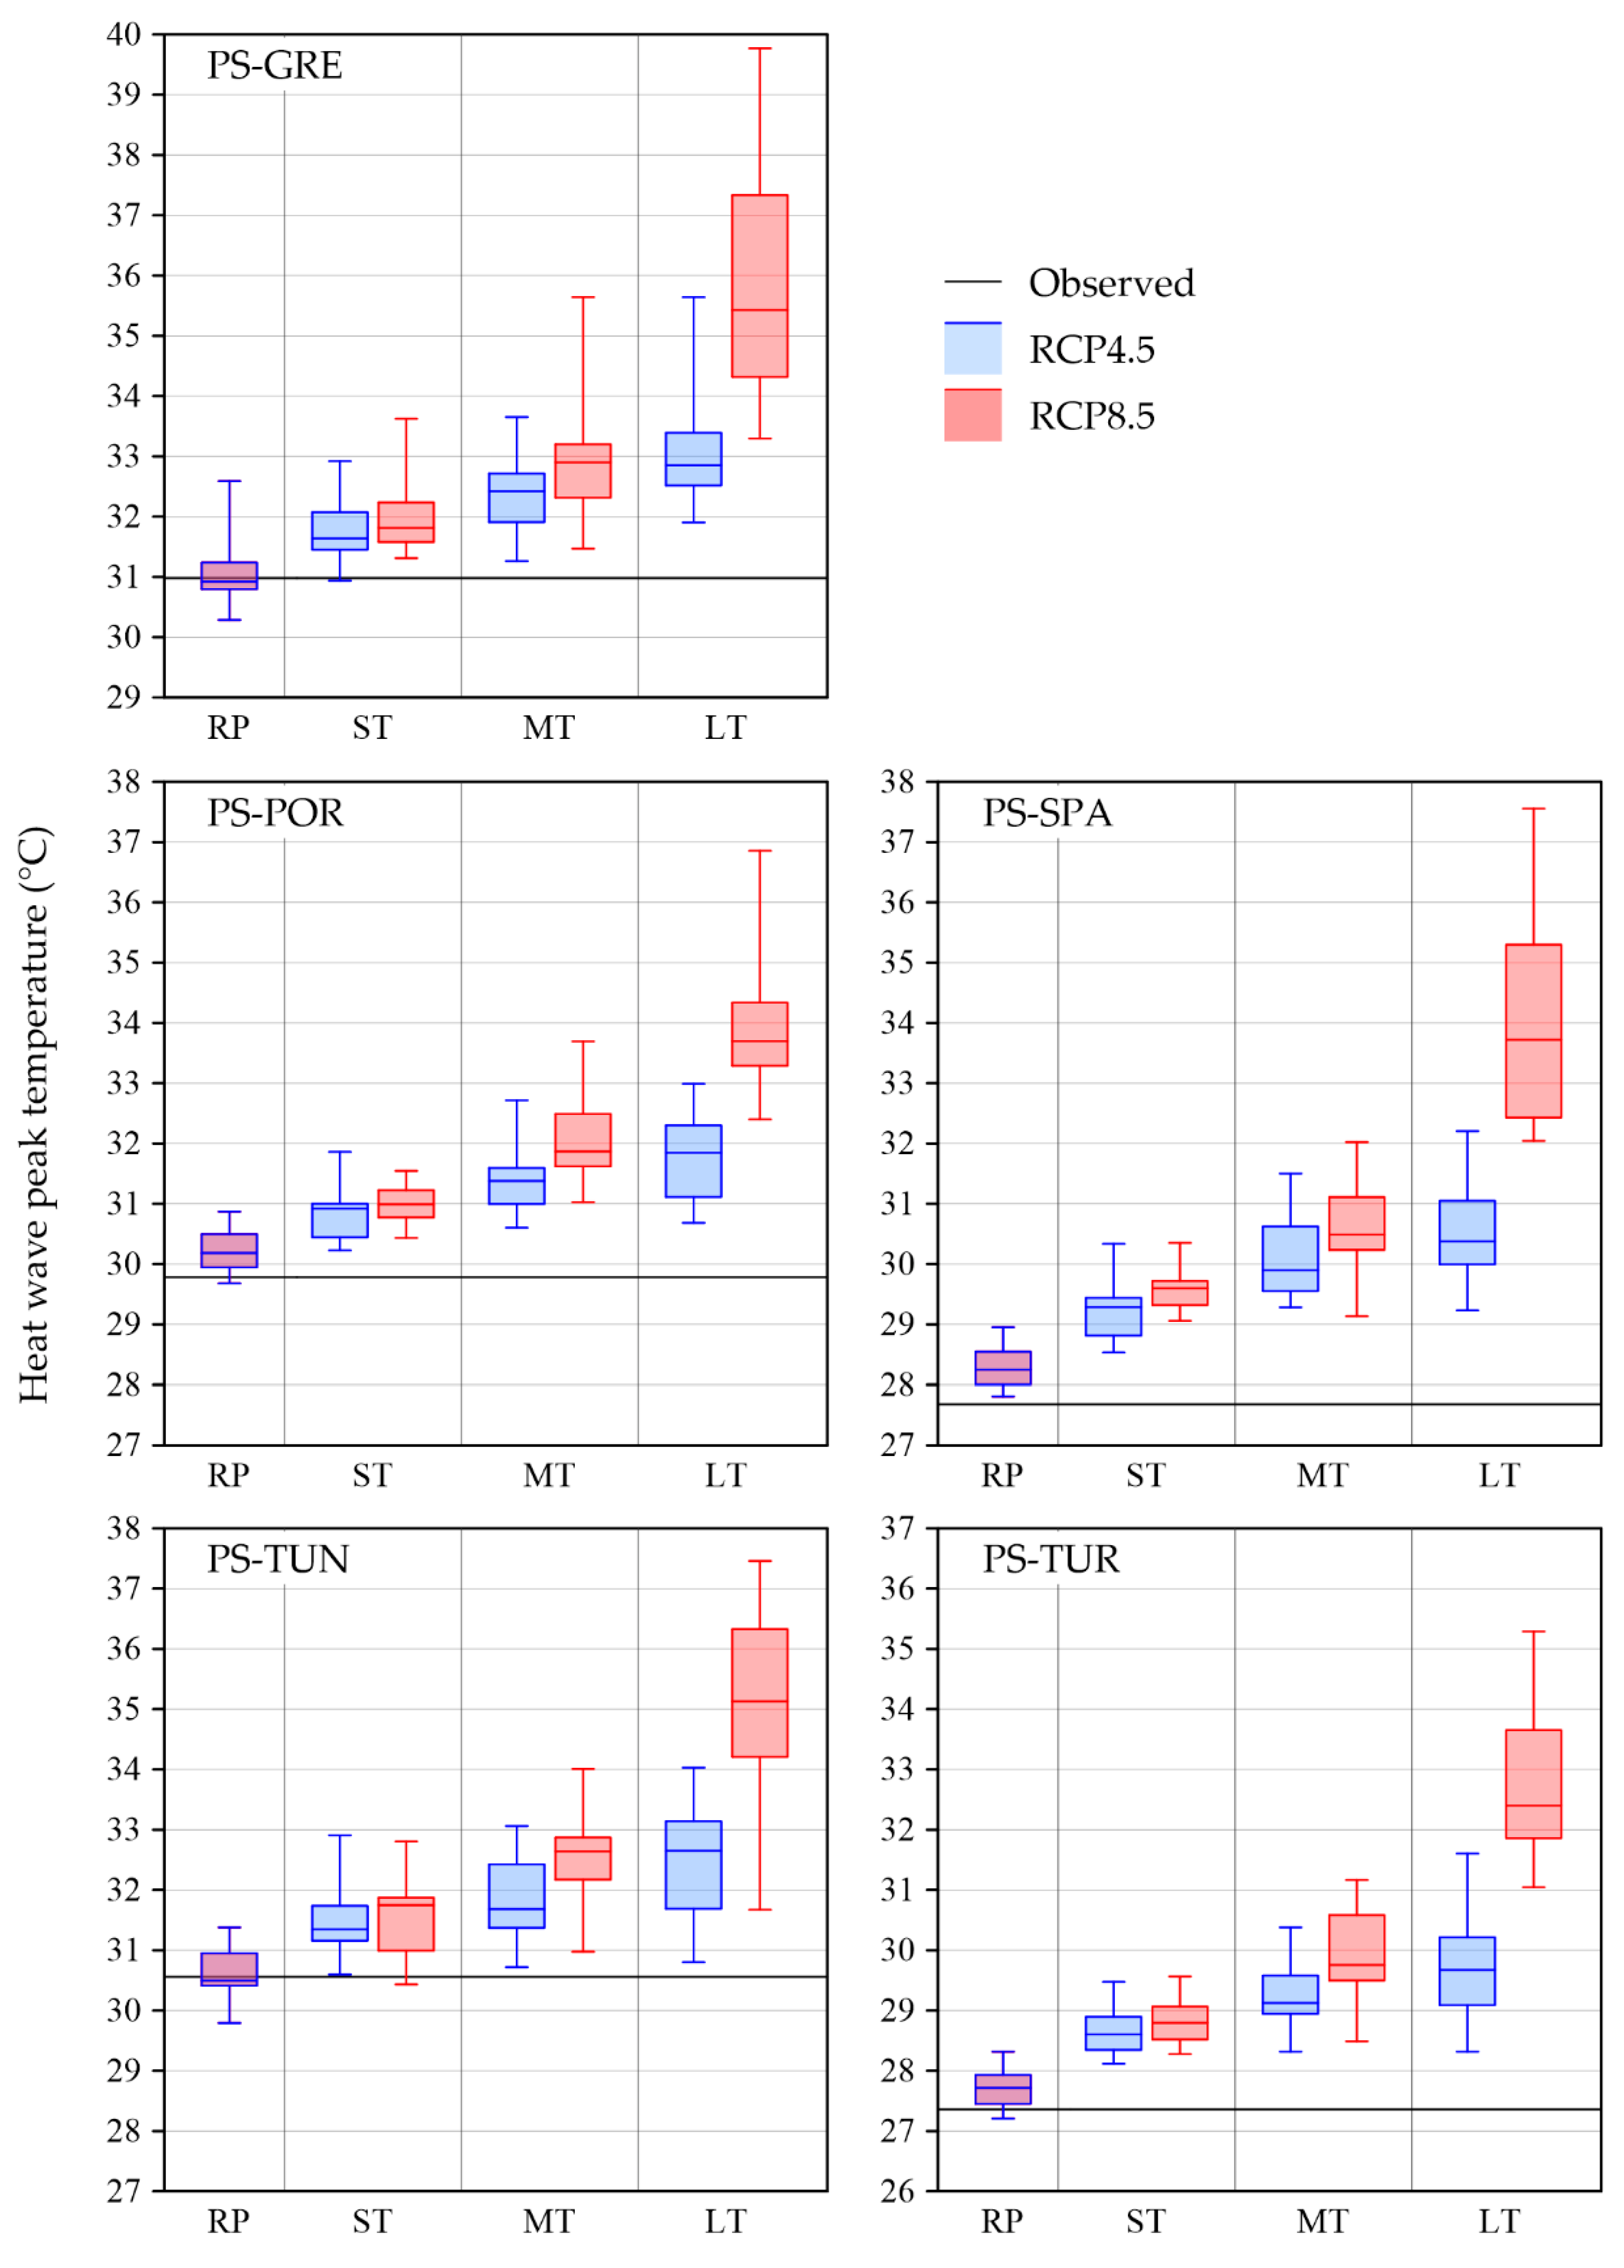
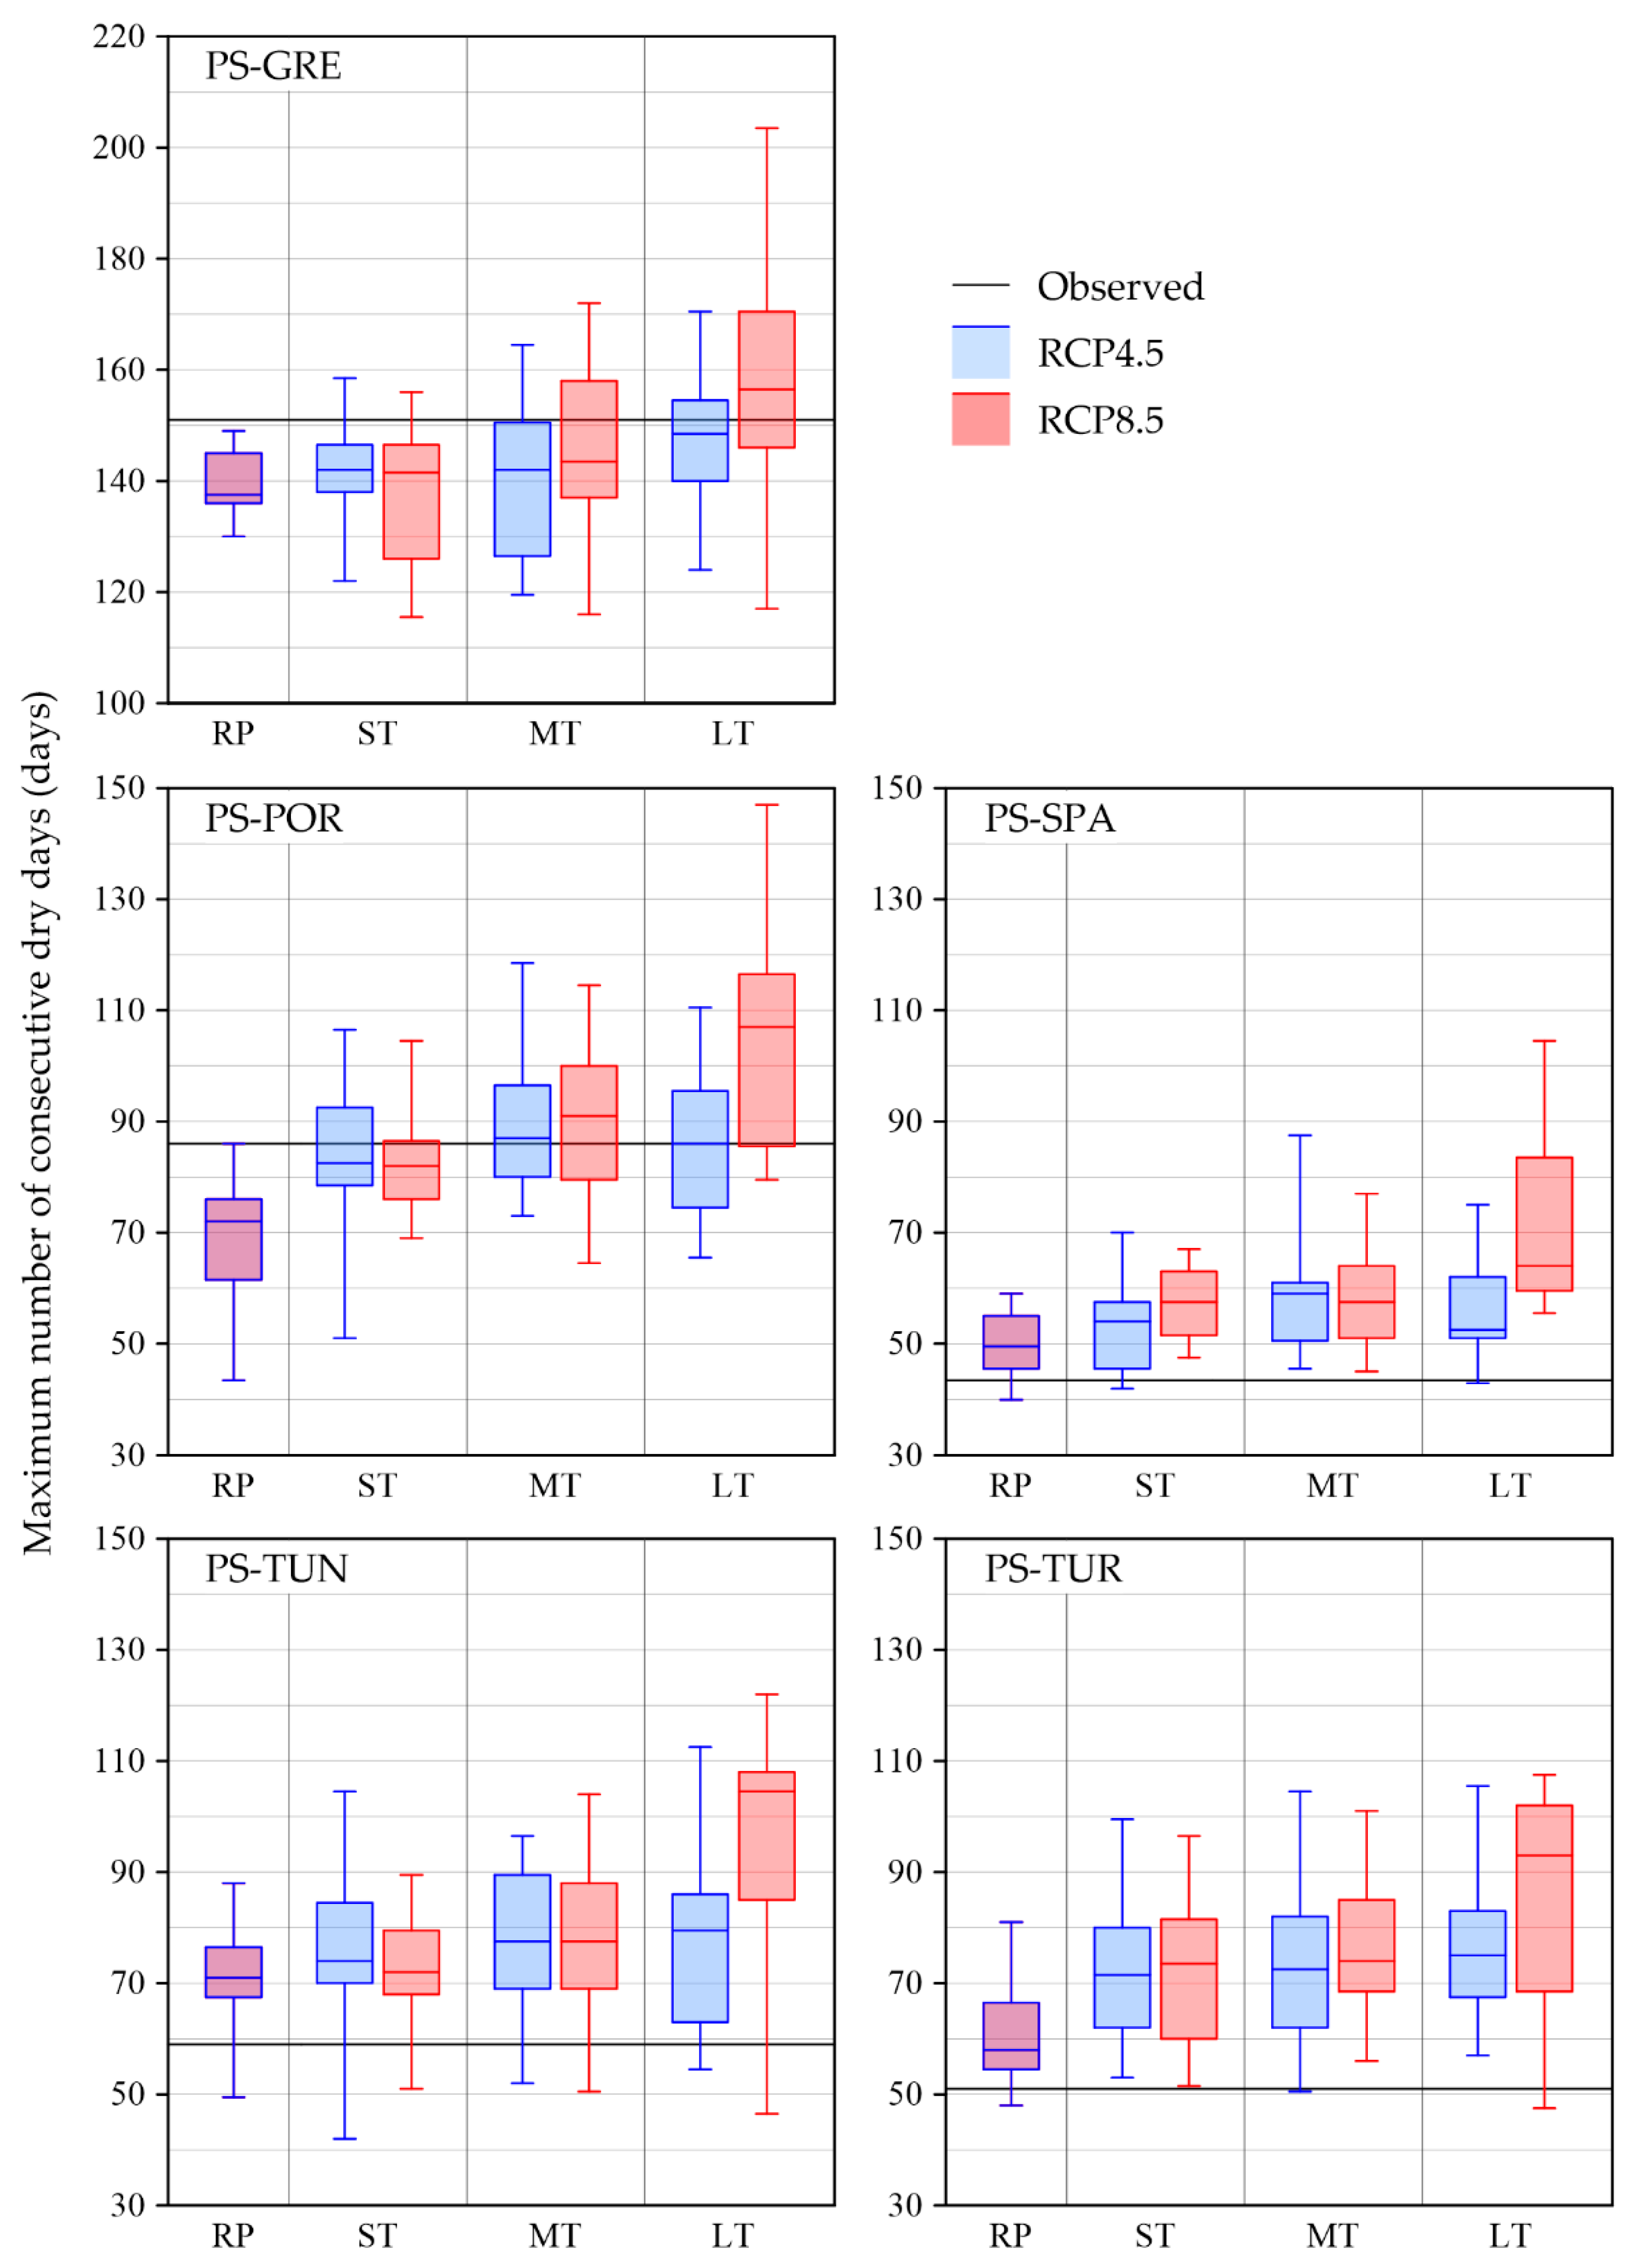
For the assessment of drought events in the pilot sites, we evaluated the change of some significant features: the maximum duration and peak temperature of heat waves and the maximum number of consecutive dry days. The length and severity of heat waves are expected to gradually increase over the century for all pilot sites, especially under the RCP8.5. The inter-model variability is quite large. However, all RCMs predict longer durations and higher peaks than those observed in the reference period. Potential variations in the maximum number of CDDs differ between the investigated areas and among the RCMs, denoting a greater uncertainty in the precipitation projections. For PS-GRE and PS-POR, no significant changes are detected with respect to the reference period; but the observed data show that the summer season is already extremely dry presenting a maximum number of CDDs (median value of the reference period) equal to 151 for PS-GRE and 86 for PS-POR. For the other pilot sites, almost all RCMs project a progressive increase in the maximum number of CDDs. The highest variation is expected for PS-TUR: the maximum number of consecutive days (median of the RCMs) is 58 in the reference period and reaches, at the end of the century, the value of 75 under the RCP4.5 scenario and 93 for the RCP8.5.
Changes in the heat wave characteristics and consecutive dry days indicate that more extreme droughts are expected in the MED for the future. This will lead to many environmental, social and economic impacts. Increasing droughts cause damages to the agriculture and tourism sectors, loss of biodiversity, forest and range-fires, and human health problems with increased risks of morbidity and mortality. All these aspects emphasize the importance of developing common sustainable mitigation and adaptation strategies.
Furthermore, the different projections over the five pilot sites highlight the importance to perform local analysis to better characterize climate variability and to provide local and regional policy makers with the tools to develop optimal mitigation and adaptation plans.
Future works will investigate the impacts of changing temperature and precipitation variables on water resources, with particular attention on groundwater within the scope of the InTheMED project. Warming of the entire MED has negative impacts on the quantity and quality of groundwater. Water scarcity can lead to groundwater overexploitations, which can also cause a progressive salinization of the fresh water in the coastal aquifers. Different approaches will be investigated to relate the temperature and precipitation changes to the groundwater resource availability, making use of complete numerical models or surrogate models (see e.g., [58]) that describe the propagation processes from meteorological to groundwater droughts.

Author Contributions

Conceptualization, V.T., M.D., D.S., A.Z. and M.G.T.; methodology, V.T., M.D., M.G.T.; formal analysis, V.T. and M.D.; data curation, V.T. and D.S.; writing—original draft preparation, V.T. and M.D. and M.G.T.; writing—review and editing, M.D., D.S., A.Z. and M.G.T.; visualization, V.T. and D.S.; supervision, M.D., A.Z. and M.G.T.; project administration, A.Z. and M.G.T. All authors have read and agreed to the published version of the manuscript.

Funding

This paper is supported by the PRIMA programme under grant agreement No. 1923, project Innovative and Sustainable Groundwater Management in the Mediterranean (InTheMED). The PRIMA programme is supported by the European Union.

Institutional Review Board Statement

Not applicable.

Informed Consent Statement

Not applicable.

Data Availability Statement

Data are available from the authors upon request.

Acknowledgments

The authors are grateful to the InTheMED partners for their help in the data collection. The authors are also thankful to the anonymous Reviewers for their valuable comments that improved our manuscript.

Conflicts of Interest

The authors declare no conflict of interest.

References

  1. Stocker, T. (Ed.) Climate Change 2013: The Physical Science Basis: Working Group I Contribution to the Fifth Assessment Report of the Intergovernmental Panel on Climate Change; Cambridge University Press: New York, NY, USA, 2014; ISBN 9781107057999. [Google Scholar]
  2. Pörtner, H.O.; Roberts, D.C.; Adams, H.; Adler, C.; Aldunce, P.; Ali, E.; Begum, R.A.; Betts, R.; Kerr, R.B.; Biesbroek, R.; et al. Climate Change 2022: Impacts, Adaptation and Vulnerability; IPCC: Geneva, Switzerland, 2022. [Google Scholar]
  3. Giorgi, F. Climate Change Hot-Spots. Geophys. Res. Lett. 2006, 33, L08707. [Google Scholar] [CrossRef]
  4. Giorgi, F.; Lionello, P. Climate Change Projections for the Mediterranean Region. Glob. Planet. Chang. 2008, 63, 90–104. [Google Scholar] [CrossRef]
  5. Tuel, A.; Eltahir, E.A.B. Why Is the Mediterranean a Climate Change Hot Spot? J. Clim. 2020, 33, 5829–5843. [Google Scholar] [CrossRef]
  6. Caloiero, T.; Caloiero, P.; Frustaci, F. Long-Term Precipitation Trend Analysis in Europe and in the Mediterranean Basin: Long-Term Precipitation Trend Analysis. Water Environ. J. 2018, 32, 433–445. [Google Scholar] [CrossRef]
  7. D’Oria, M.; Tanda, M.G.; Todaro, V. Assessment of Local Climate Change: Historical Trends and RCM Multi-Model Projections over the Salento Area (Italy). Water 2018, 10, 978. [Google Scholar] [CrossRef]
  8. Mariotti, A.; Pan, Y.; Zeng, N.; Alessandri, A. Long-Term Climate Change in the Mediterranean Region in the Midst of Decadal Variability. Clim. Dyn. 2015, 44, 1437–1456. [Google Scholar] [CrossRef]
  9. Solomon, S.; Manning, M.; Maquis, M.; Qin, D.; Averyt, K.; Tignor, M.; Miller, H.L., Jr. Climate Change 2007: The Physical Science Basis: Contribution of Working Group I to the Fourth Assessment Report of the Intergovernmental Panel on Climate Change; Cambridge University Press: Cambridge, UK, 2007; ISBN 9780521880091. [Google Scholar]
  10. Lionello, P.; Scarascia, L. The Relation between Climate Change in the Mediterranean Region and Global Warming. Reg. Environ. Chang. 2018, 18, 1481–1493. [Google Scholar] [CrossRef]
  11. Zittis, G.; Hadjinicolaou, P.; Klangidou, M.; Proestos, Y.; Lelieveld, J. A Multi-Model, Multi-Scenario, and Multi-Domain Analysis of Regional Climate Projections for the Mediterranean. Reg. Environ. Chang. 2019, 19, 2621–2635. [Google Scholar] [CrossRef]
  12. Zittis, G.; Hadjinicolaou, P.; Fnais, M.; Lelieveld, J. Projected Changes in Heat Wave Characteristics in the Eastern Mediterranean and the Middle East. Reg. Environ. Chang. 2016, 16, 1863–1876. [Google Scholar] [CrossRef]
  13. Cramer, W.; Guiot, J.; Marini, K. (Eds.) MedECC. Climate and Environmental Change in the Mediterranean Basin—Current Situation and Risks for the Future; In First Mediterranean Assessment Report; Union for the Mediterranean, Plan Bleu, UNEP/MAP: Marseille, France, 2020; 632p, ISBN 978-2-9577416-0-1. [Google Scholar]
  14. Molina, M.O.; Sánchez, E.; Gutiérrez, C. Future Heat Waves over the Mediterranean from an Euro-CORDEX Regional Climate Model Ensemble. Sci. Rep. 2020, 10, 8801. [Google Scholar] [CrossRef]
  15. Bolle, H.-J. Climate, Climate Variability and Impacts in the Mediterranean Area: An Overview. In Mediterranean Climate; Bolle, H.-J., Ed.; Springer: Berlin/Heidelberg, Gemany, 2003; pp. 5–86. ISBN 9783642628627. [Google Scholar]
  16. Teutschbein, C.; Seibert, J. Regional Climate Models for Hydrological Impact Studies at the Catchment Scale: A Review of Recent Modeling Strategies: Regional Climate Models for Hydrological Impact Studies. Geogr. Compass 2010, 4, 834–860. [Google Scholar] [CrossRef]
  17. D’Oria, M.; Ferraresi, M.; Tanda, M.G. Historical Trends and High-Resolution Future Climate Projections in Northern Tuscany (Italy). J. Hydrol. 2017, 555, 708–723. [Google Scholar] [CrossRef]
  18. Piani, C.; Haerter, J.O.; Coppola, E. Statistical Bias Correction for Daily Precipitation in Regional Climate Models over Europe. Theor. Appl. Climatol. 2010, 99, 187–192. [Google Scholar] [CrossRef]
  19. Teutschbein, C.; Seibert, J. Bias Correction of Regional Climate Model Simulations for Hydrological Climate-Change Impact Studies: Review and Evaluation of Different Methods. J. Hydrol. 2012, 456–457, 12–29. [Google Scholar] [CrossRef]
  20. Themeßl, M.J.; Gobiet, A.; Heinrich, G. Empirical-Statistical Downscaling and Error Correction of Regional Climate Models and Its Impact on the Climate Change Signal. Clim. Chang. 2012, 112, 449–468. [Google Scholar] [CrossRef]
  21. Sun, C.; Huang, G.; Fan, Y.; Zhou, X.; Lu, C.; Wang, X. Vine Copula Ensemble Downscaling for Precipitation Projection Over the Loess Plateau Based on High-Resolution Multi-RCM Outputs. Water Resour. Res. 2021, 57, 2020WR027698. [Google Scholar] [CrossRef]
  22. Enayati, M.; Bozorg-Haddad, O.; Bazrafshan, J.; Hejabi, S.; Chu, X. Bias Correction Capabilities of Quantile Mapping Methods for Rainfall and Temperature Variables. J. Water Clim. Chang. 2021, 12, 401–419. [Google Scholar] [CrossRef]
  23. García-Garizábal, I.; Causapé, J.; Abrahao, R.; Merchan, D. Impact of Climate Change on Mediterranean Irrigation Demand: Historical Dynamics of Climate and Future Projections. Water Resour. Manag. 2014, 28, 1449–1462. [Google Scholar] [CrossRef]
  24. Ribas, A.; Calbó, J.; Llausàs, A.; Lopez-Bustins, J.A. Climate Change at the Local Scale: Trends, Impacts and Adaptations in a Northwestern Mediterranean Region (Costa Brava, NE Iberian Peninsula). Int. J. Clim. Chang. Impacts Responses 2010, 2, 247–264. [Google Scholar] [CrossRef]
  25. Jacob, D.; Petersen, J.; Eggert, B.; Alias, A.; Christensen, O.B.; Bouwer, L.M.; Braun, A.; Colette, A.; Déqué, M.; Georgievski, G.; et al. EURO-CORDEX: New High-Resolution Climate Change Projections for European Impact Research. Reg. Environ. Chang. 2014, 14, 563–578. [Google Scholar] [CrossRef]
  26. Weedon, G.P.; Gomes, S.; Viterbo, P.; Shuttleworth, W.J.; Blyth, E.; Österle, H.; Adam, J.C.; Bellouin, N.; Boucher, O.; Best, M. Creation of the WATCH Forcing Data and Its Use to Assess Global and Regional Reference Crop Evaporation over Land during the Twentieth Century. J. Hydrometeorol. 2011, 12, 823–848. [Google Scholar] [CrossRef]
  27. Allen, R.G.; Pereira, L.S.; Raes, D.; Smith, M. FAO Irrigation and Drainage Paper No. 56; Food and Agriculture Organization of the United Nations: Rome, Italy, 1998; Volume 56, p. 156. [Google Scholar]
  28. Teng, J.; Potter, N.J.; Chiew, F.H.S.; Zhang, L.; Wang, B.; Vaze, J.; Evans, J.P. How Does Bias Correction of Regional Climate Model Precipitation Affect Modelled Runoff? Hydrol. Earth Syst. Sci. 2015, 19, 711–728. [Google Scholar] [CrossRef]
  29. D’Oria, M.; Cozzi, C.; Tanda, M.G. Future Precipitation and Temperature Changes over the Taro, Parma and Enza River Basins in northern Italy. Ital. J. Eng. Geol. Environ. 2018, 49–63. [Google Scholar] [CrossRef]
  30. Mann, H.B. Nonparametric Tests Against Trend. Econometrica 1945, 13, 245. [Google Scholar] [CrossRef]
  31. Kendall, M.G. Rank Correlation Methods, 4th ed.; Griffin: London, UK, 1970; ISBN 9780852641996. [Google Scholar]
  32. Ljung, G.M.; Box, G.E.P. On a Measure of Lack of Fit in Time Series Models. Biometrika 1978, 65, 297–303. [Google Scholar] [CrossRef]
  33. Taïbi, S.; Zeroual, A.; Meddi, M. Effect of Autocorrelation on Temporal Trends in Air-Temperature in Northern Algeria and Links with Teleconnections Patterns. Theor. Appl. Climatol. 2022, 147, 959–984. [Google Scholar] [CrossRef]
  34. Wang, F.; Shao, W.; Yu, H.; Kan, G.; He, X.; Zhang, D.; Ren, M.; Wang, G. Re-Evaluation of the Power of the Mann-Kendall Test for Detecting Monotonic Trends in Hydrometeorological Time Series. Front. Earth Sci. 2020, 8, 14. [Google Scholar] [CrossRef]
  35. Hamed, K.H.; Ramachandra Rao, A. A Modified Mann-Kendall Trend Test for Autocorrelated Data. J. Hydrol. 1998, 204, 182–196. [Google Scholar] [CrossRef]
  36. Yue, S.; Pilon, P.; Phinney, B.; Cavadias, G. The Influence of Autocorrelation on the Ability to Detect Trend in Hydrological Series. Hydrol. Process. 2002, 16, 1807–1829. [Google Scholar] [CrossRef]
  37. Sen, P.K. Estimates of the Regression Coefficient Based on Kendall’s Tau. J. Am. Stat. Assoc. 1968, 63, 1379–1389. [Google Scholar] [CrossRef]
  38. Pettitt, A.N. A Non-Parametric Approach to the Change-Point Problem. Appl. Stat. 1979, 28, 126. [Google Scholar] [CrossRef]
  39. WMO. Guidelines on the Definition and Monitoring of Extreme Weather and Climate Events; WMO: Geneva, Switzerland, 2016. [Google Scholar]
  40. McGregor, G.R.; Bessemoulin, P.; Ebi, K.L.; Menne, B. Heatwaves and Health: Guidance on Warning-System Development; Durham University: Durham, UK, 2015; ISBN 978926311142-5. [Google Scholar]
  41. Perkins, S.E. A Review on the Scientific Understanding of Heatwaves—Their Measurement, Driving Mechanisms and Changes at the Global Scale. Atmos. Res. 2015, 164–165, 242–267. [Google Scholar] [CrossRef]
  42. The World Bank. Climate Change Knowledge Portal. Available online: https://climateknowledgeportal.worldbank.org/ (accessed on 8 August 2022).
  43. Mamara, A.; Argiriou, A.A.; Anadranistakis, M. Recent Trend Analysis of Mean Air Temperature in Greece Based on Homogenized Data. Theor. Appl. Climatol. 2016, 126, 543–573. [Google Scholar] [CrossRef]
  44. Feidas, H. Trend Analysis of Air Temperature Time Series in Greece and Their Relationship with Circulation Using Surface and Satellite Data: Recent Trends and an Update to 2013. Theor. Appl. Climatol. 2017, 129, 1383–1406. [Google Scholar] [CrossRef]
  45. Philandras, C.M.; Nastos, P.T.; Kapsomenakis, J.; Douvis, K.C.; Tselioudis, G.; Zerefos, C.S. Long Term Precipitation Trends and Variability within the Mediterranean Region. Nat. Hazards Earth Syst. Sci. 2011, 11, 3235–3250. [Google Scholar] [CrossRef]
  46. Kastridis, A.; Kamperidou, V.; Stathis, D. Dendroclimatological Analysis of Fir (A. Borisii-Regis) in Greece in the Frame of Climate Change Investigation. Forests 2022, 13, 879. [Google Scholar] [CrossRef]
  47. Tsanis, I.K.; Koutroulis, A.G.; Daliakopoulos, I.N.; Jacob, D. Severe Climate-Induced Water Shortage and Extremes in Crete: A Letter. Clim. Chang. 2011, 106, 667–677. [Google Scholar] [CrossRef]
  48. Georgoulias, A.K.; Akritidis, D.; Kalisoras, A.; Kapsomenakis, J.; Melas, D.; Zerefos, C.S.; Zanis, P. Climate Change Projections for Greece in the 21st Century from High-Resolution EURO-CORDEX RCM Simulations. Atmos. Res. 2022, 271, 106049. [Google Scholar] [CrossRef]
  49. Valverde, P.; Serralheiro, R.; Carvalho, M.; Shahidian, S. Climate Change Impacts on Irrigated Agriculture in the Guadiana River Basin (Portugal). In Proceedings of the 8th International Conference of EWRA, Porto, Portugal, 26–29 June 2013. [Google Scholar]
  50. Valverde, P.; Serralheiro, R.; de Carvalho, M.; Maia, R.; Oliveira, B.; Ramos, V. Climate Change Impacts on Irrigated Agriculture in the Guadiana River Basin (Portugal). Agric. Water Manag. 2015, 152, 17–30. [Google Scholar] [CrossRef]
  51. Rodrigo, F.S.; Trigo, R.M. Trends in Daily Rainfall in the Iberian Peninsula from 1951 to 2002. Int. J. Climatol. 2007, 27, 513–529. [Google Scholar] [CrossRef]
  52. Guerreiro, S.B.; Kilsby, C.G.; Fowler, H.J. Rainfall in Iberian Transnational Basins: A Drier Future for the Douro, Tagus and Guadiana? Clim. Chang. 2016, 135, 467–480. [Google Scholar] [CrossRef]
  53. Miró, J.J.; Estrela, M.J.; Caselles, V.; Gómez, I. Spatial and Temporal Rainfall Changes in the Júcar and Segura Basins (1955–2016): Fine-Scale Trends. Int. J. Climatol. 2018, 38, 4699–4722. [Google Scholar] [CrossRef]
  54. Miró, J.J.; Estrela, M.J.; Olcina-Cantos, J.; Martin-Vide, J. Future Projection of Precipitation Changes in the Júcar and Segura River Basins (Iberian Peninsula) by CMIP5 GCMs Local Downscaling. Atmosphere 2021, 12, 879. [Google Scholar] [CrossRef]
  55. Driouech, F.; Rached, S.B.; Hairech, T.E. Climate Variability and Change in North African Countries. In Climate Change and Food Security in West Asia and North Africa; Sivakumar, M.V.K., Lal, R., Selvaraju, R., Hamdan, I., Eds.; Springer: Dordrecht, The Netherlands, 2013; pp. 161–172. ISBN 9789400767508. [Google Scholar]
  56. Duygu, M.B.; Kirmencioğlu, B.; Aras, M. Essential Tools to Establish a Comprehensive Drought Management Plan—Konya Basin Case Study. Turk. J. Water Sci. Manag. 2017, 1, 54–70. [Google Scholar] [CrossRef]
  57. Guan, Y.; Lu, H.; Jiang, Y.; Tian, P.; Qiu, L.; Pellikka, P.; Heiskanen, J. Changes in Global Climate Heterogeneity under the 21st Century Global Warming. Ecol. Indic. 2021, 130, 108075. [Google Scholar] [CrossRef]
  58. Secci, D.; Tanda, M.G.; D’Oria, M.; Todaro, V.; Fagandini, C. Impacts of Climate Change on Groundwater Droughts by Means of Standardized Indices and Regional Climate Models. J. Hydrol. 2021, 603, 127154. [Google Scholar] [CrossRef]
Figure 1. Location of the five pilot sites.
Water 14 02499 g001
Figure 2. Annual mean temperature in terms of 10-year moving average projected by the 17 RCMs for all pilot sites in the period 1976–2098. The two scenarios RCP4.5 and RCP8.5 are reported. The range of the y-axis in all subplots is the same to easily compare results.
Water 14 02499 g002
Figure 3. Annual precipitation in terms of 10-year moving average projected by the 17 RCMs for all pilot sites in the period 1976–2098. The two scenarios RCP4.5 and RCP8.5 are reported. The range of the y-axis in all subplots is the same to easily compare results.
Water 14 02499 g003
Figure 4. Maximum duration of heat waves in the reference period and at short-(ST), medium-(MT) and long-term (LT), under the RCP4.5 and RCP8.5 scenarios. The solid line represents the observation. The median values of each period are reported, the box-whisker plots represent the variability between the 17 RCMs. The range of the y-axis in all subplots is the same to easily compare results.
Water 14 02499 g004
Figure 5. Peak temperature of heat waves in the reference period and at short-(ST), medium-(MT) and long-term (LT), under the RCP4.5 and RCP8.5 scenarios. The solid line represents the observation. The median values of each period are reported, the box-whisker plots represent the variability between the 17 RCMs. The range of the y-axis in all subplots is the same to easily compare results.
Water 14 02499 g005
Figure 6. Maximum number of consecutive dry days in the reference period and at short-(ST), medium-(MT) and long-term (LT), under the RCP4.5 and RCP8.5 scenarios. The solid line represents the observation. The median values of each period are reported, the box-whisker plots represent the variability between the 17 RCMs. The range of the y-axis in all subplots is the same to easily compare results.
Water 14 02499 g006
Table 1. Main characteristics of the pilot sites investigated in the project InTheMED.
NationGreeceSpainPortugalTunisiaTurkey
Pilot site nameTympakiRequena-UtielGuadiana BasinGrombaliaKonya
AbbreviationPS-GREPS-SPAPS-PORPS-TUNPS-TUR
Size (km2)58128511,59439150,000
Population25,00030,000445,000201,0003,000,000
LocationCoastalInlandInland with outlet to the seaCoastalInland
Latitude extension35.03, 35.1339.27, 39.7437.15, 39.3536.47, 36.7836.80, 39.55
Longitude extension24.70, 24.86−1.53, −0.78−8.20, −6.9010.40, 10.6431.05, 35.05
Elevation range (m a.s.l.)0, 470365, 12350, 9850, 130900, 3260
Table 2. Information on precipitation (P) and temperature (T) data collected.
PS-GREPS-SPAPS-PORPS-TUNPS-TUR
N° of precipitation gauge2860618
N° of temperature gauge114118
Source of precipitation/temperature dataNational ServiceNational Service (P, T); WFD (T)National ServiceNational Service (P, T); WFD (T)National Service
Table 3. GCM-RCM models from EURO-CORDEX initiative used in this work. The ditto mark “ indicates repetition of the above text.
GCM RCM
InstituteModelInstituteModel
1CNRM-CERFACSCNRM-CM5CLMcomCCLM4-8-17
2SMHIRCA4
3KNMIRACMO22E
4ICHECEC-EARTHKNMIRACMO22E
5SMHIRCA4
6CLMcomCCLM4-8-17
7DMIHIRHAM5
8IPSLIPSL-CM5A-MRIPSLWRF381P
9SMHIRCA4
10IPSL-INERISWRF331F
11MOHCHadGEM2-ESDMIHIRHAM5
12CLMcomCCLM4-8-17
13KNMIRACMO22E
14SMHIRCA4
15MPI-MMPI-ESM-LRCLMcomCCLM4-8-17
16SMHIRCA4
17NCCNorESM1-MDMIHIRHAM5
Table 4. Annual mean temperature and total annual precipitation for the five pilot sites. The table reports the average, minimum (Min) and maximum (Max) values in the reference period 1986–2005.
Mean Temperature (°C)Precipitation (mm)
AverageMinMaxAverageMinMax
PS-GRE16.215.417.4474268763
PS-POR16.115.117.45453221018
PS-SPA13.812.215.0434281642
PS-TUN18.818.019.45072911092
PS-TUR11.49.913.1355264458
Table 5. Historical time series analysis in the period 1976–2005. Ljung–Box test (LB) for autocorrelation: Y, data present serial correlation; N, no serial correlation detected. Sen slope evaluated according to the Theil-Sen method. Mann-Kendal test (MK), MK as modified by Hamed and Rao (MMK-HR) and MK using the trend-free-pre-whitening approach (MMK-TFPW): Y, trend is significant; N trend is not significant. Pettitt test (PT): Y, a change point is detected; N, no break in the data. The significance for all tests is at the 5% level. Year of change and step in the mean between the two sub-series (Δ).
Mann-Kendall Test Pettitt Test
LBSen Slope (°C/Decade or mm/Decade)MKMMK-HRMMK-TFPWPTYearΔ (°C or mm)
Temperature
PS-GREY+0.2NNNY1997+0.8
PS-PORY+0.3YNNY1986+0.7
PS-SPAY+0.4YYNN--
PS-TUNY+0.3YYYY1993+0.6
PS-TURN+0.5Y--Y1993+1.1
Precipitation
PS-GREN−26N--N--
PS-PORN−28N--N--
PS-SPAN+5N--N--
PS-TUNN+23N--N--
PS-TURN−16N--N--
Table 6. Seasonal and annual mean temperature (°C) over the five pilot sites: observed values (Obs.) and RCM median values for the reference period (RP, 1986–2005). Temperature change (°C) between the RCM medians at the short- (ST, 2021–2040), medium- (MT, 2041–2060) and long-term (LT, 2076–2095) and those evaluated in the reference period, for the RCP4.5 and RCP8.5 scenarios. The symbol * indicates a robust change. The color scale (from white to red) highlights the differences.
Obs.RCM RCP4.5 RCP8.5
RPRPSTMTLTSTMTLT
PS-GRESpring15.4815.58+0.97 *+1.63 *+2.26 *+1.24 *+2.32 *+4.69 *
Summer25.2025.13+1.15 *+1.81 *+2.53 *+1.38 *+2.21 *+4.73 *
Autumn19.1019.11+0.82 *+1.52 *+2.35 *+1.25 *+2.16 *+4.21 *
Winter10.8611.04+0.97 *+1.33 *+1.95 *+0.98 *+1.76 *+3.77 *
Year17.6617.72+1.00 *+1.48 *+2.20 *+1.22 *+2.08 *+4.29 *
PS-PORSpring14.8614.56+0.88 *+1.31 *+1.63 *+0.82 *+1.68 *+3.45 *
Summer23.8723.66+0.84 *+1.70 *+1.87 *+1.09 *+1.83 *+4.09 *
Autumn17.3017.45+1.09 *+1.75 *+2.20 *+1.35 *+2.21 *+4.22 *
Winter9.659.83+0.79 *+0.92 *+1.41 *+0.80 *+1.43 *+2.64 *
Year16.4216.37+0.81 *+1.37 *+1.75 *+1.00 *+1.72 *+3.64 *
PS-SPASpring12.0911.83+0.84 *+1.46 *+1.75 *+0.94 *+1.88 *+3.56 *
Summer22.4422.26+1.32 *+1.94 *+2.55 *+1.34 *+2.43 *+4.99 *
Autumn14.0914.27+1.25 *+1.80 *+2.42 *+1.34 *+2.26 *+4.40 *
Winter6.436.67+0.97 *+1.10 *+1.7 *+0.95 *+1.62 *+3.33 *
Year13.7613.76+0.97 *+1.47 *+1.97 *+1.10 *+1.98 *+4.04 *
PS-TUNSpring16.5616.40+0.78 *+1.09 *+1.69 *+0.88 *+1.62 *+3.23 *
Summer25.7625.52+1.29 *+1.67 *+2.27 *+1.34 *+2.2 *+4.32 *
Autumn20.4120.34+0.98 *+1.40 *+2.04 *+1.01 *+1.92 *+3.80 *
Winter12.3812.61+0.76 *+0.97 *+1.44 *+0.64 *+1.45 *+3.01 *
Year18.7818.72+0.90 *+1.30 *+1.89 *+0.98 *+1.85 *+3.61 *
PS-TURSpring10.2610.41+1.11 *+1.74 *+2.68 *+1.27 *+2.64 *+5.43 *
Summer21.6621.45+1.23 *+2.02 *+2.53 *+1.49 *+2.53 *+4.92 *
Autumn12.1212.24+0.94 *+1.75 *+2.35 *+1.52 *+2.39 *+4.62 *
Winter0.560.95+1.51 *+2.15 *+3.27 *+1.58 *+2.61 *+5.35 *
Year11.1511.26+1.18 *+1.86 *+2.73 *+1.62 *+2.78 *+5.19 *
Table 7. Seasonal and annual precipitation (mm) over the five pilot sites: observed value (Obs.) and RCM median values for the reference period (RP, 1986–2005). Precipitation change (%) between the RCM medians at the short- (ST, 2021–2040), medium- (MT, 2041–2060) and long-term (LT, 2076–2095) and those evaluated in the reference period, for the RCP4.5 and RCP8.5 scenarios. The symbol * indicates a robust change. The color scale highlights positive (blue) and negative (gold) change rates.
Obs.RCM RCP4.5 RCP8.5
RPRPSTMTLTSTMTLT
PS-GRESpring7681+4.7−4.4−12.7+2.0−9.2−29.8
Summer00000000
Autumn130126+9.9 *+1.5 *−14.0+4.8 *−8.8−23.5
Winter267300−7.8 *−7.1 *−11.2 *+1.8−7.8 *−30.7 *
Year474513−4.1−9.3−15.7−1.8−13.5−23.5
PS-PORSpring136135−4.0 *−17.1 *−19.1 *+4.7−22.9 *−33.2 *
Summer2023−15.6 *−42.8 *−29.3 *−29.7 *−27.4 *−61.3 *
Autumn182183−17.3 *−19.0 *−21.3 *−19.0 *−23.4 *−34.6 *
Winter206210+3.5−0.7+13.6−2.7−2.0−6.2
Year545546−2.6−12.9−9.5−8.8−14.3−22.9
PS-SPASpring116116−6.3 *−5.1 *−14.9 *−2.2 *−3.4 *−24.2 *
Summer6164+7.5 *−6.1−14.0+0.7 *−7.3−38.1
Autumn151144−10.1 *−9.1 *−6.0 *−2.5 *+8.6−5.1 *
Winter107104+0.8+1.3+3.3+2.9+1.7−1.3
Year434429−3.1 *−2.6 *−3.9 *+1.4+0.2−18.5 *
PS-TUNSpring95107−19.4 *−20.9 *−21.3 *−11.7 *−19.7 *−28.8 *
Summer3225+3.8−15.0−17.9−5.3−9.4−34.0
Autumn175187−9.2−2.6+9.2−2.0−0.3−10.1
Winter205195−3.0 *−0.3 *−2.4 *−4.0 *−7.2 *−10.5 *
Year507500−0.2−0.4−0.9+0.7−5.8−16.0
PS-TURSpring120122+1.6+6.8+5.4+3.6−2.8−8.2
Summer3939−17.2 *−27.0 *−12.7 *−19.9 *−20.7 *−28.5 *
Autumn8078+10.4 *+10.2 *+4.4 *+6.6 *+2.5 *−2.7
Winter116126+2.9+9.6+4.5+3.7+4.8+6.0
Year355366+1.8+3.1+2.1+2.1−2.7−2.0
Table 8. Temperature thresholds used to define heat waves and their duration and peak temperature in the reference period (observed, Obs., and from climate models, RCM) and at short- (ST), medium- (MT) and long-term (LT), under the RCP4.5 and RCP8.5 scenarios. The median values of each period and of the 17 RCM are reported.
Duration (Days)Peak Temperature (°C)
Obs.RCMRCP4.5RCP8.5Obs.RCMRCP4.5RCP8.5
Thr. (°C)RPRPSTMTLTSTMTLTRPRPSTMTLTSTMTLT
PS-GRE29.222.556956.52331.130.931.632.432.931.832.935.4
PS-POR29.0223.556.55613.529.830.230.931.431.831.031.933.7
PS-SPA26.822.557.5961023.527.728.229.329.930.429.630.533.7
PS-TUN29.22.524.55.57.5583830.630.531.331.732.631.732.635.1
PS-TUR26.3225786823.527.427.728.629.129.728.829.832.4
Table 9. Maximum number of consecutive dry days in the reference period (observed, Obs., and from climate models, RCM) and at short- (ST), medium- (MT) and long-term (LT) under the RCP4.5 and RCP8.5 scenarios. The median values of each period and of the 17 RCMs are reported.
Obs.RCMRCP4.5RCP8.5
RPRPSTMTLTSTMTLT
PS-GRE151137.5142142148.5141.5143.5156.5
PS-POR867282.587868291107
PS-SPA43.549.5545952.557.557.564
PS-TUN59717477.579.57277.5104.5
PS-TUR515871.572.57573.57493
Publisher’s Note: MDPI stays neutral with regard to jurisdictional claims in published maps and institutional affiliations.

