Article

Identification of Nitrate Sources in Rivers in a Complex Catchment Using a Dual Isotopic Approach

1
School of Geography and Ocean Science, Nanjing University, Nanjing 210023, China
2
Water Affairs Bureau of Jiangning District, Nanjing 211100, China
3
College of Urban Resource and Environment Sciences, Jiangsu Second Normal University, Nanjing 210013, China
4
Collaborative Innovation Center of Atmospheric Environment and Equipment Technology, Jiangsu Key Laboratory of Atmospheric Environment Monitoring and Pollution Control (AEMPC), School of Environmental Science and Engineering, Nanjing University of Information Science and Technology, Nanjing 210044, China
5
Department of Geography and Environment Science, University of Reading, Reading RG6 6AB, UK
*
Authors to whom correspondence should be addressed.
Water 2021, 13(1), 83; https://doi.org/10.3390/w13010083
Submission received: 26 November 2020 / Revised: 23 December 2020 / Accepted: 29 December 2020 / Published: 1 January 2021

Abstract

:
Excessive nutrient input to surface water, including nitrate, exacerbates water eutrophication. Clarifying the proportions of different nitrate sources in the aquatic environment is critical for improving the polluted water. However, nitrate sources in river basins are very complex and not clearly understood. In this study, nitrogen concentrations and nitrate isotopic compositions were determined to estimate the spatiotemporal variation in nitrate sources in the Yuntaishan River basin, Nanjing, East China, from March 2019 to January 2020. The results showed that the concentrations of total nitrogen (TN), ammonium (NH4+-N), and nitrate (NO3-N) changed in the ranges of 0.53–18.0 mg/L, 0.01–15.4 mg/L, and 0.06–9.3 mg/L, respectively, wherein NO3-N was the main nitrogen form. Higher nitrogen concentrations appeared in winter and in the downstream parts of the river. In the entire river basin, the NO3-N mainly originated from sewage (67%) and soil (26%), with clear spatial variations. NO3-N in the Yunba sub-watershed was mainly derived from sewage (78%), which was higher than that in other tributaries, i.e., Shengli River (44%) and Yangshan River (49%). This was due to the fact that that Shengli and Yangshan sub-watersheds were covered by urban areas and were equipped with a complete sewage treatment system. In addition, the contributions of sewage to NO3-N rose from 60% upstream to 86% downstream, suggesting the increasing influence of the point source of sewage. The results showed that 53% of NO3-N in the basin outlet originated from the point source of sewage near the M4 site. Sewage contributed 75% of NO3-N in the rainy season and 67% of NO3-N in the dry season, suggesting the weakly temporal variation. Our results highlight the spatiotemporal variations in sources of NO3-N. These results will aid in the development of measures needed to control nitrogen pollution in river basins.

1. Introduction

Water eutrophication is one of the largest threats to aquatic ecosystems, causing a series of ecological and environmental problems, including outbreaks of harmful algae, hypoxia, breaks in the food chain, declining biodiversity and others [1,2,3]. Eutrophication is often caused by excessive nutrients, mainly phosphorus and nitrogen, entering the water body [4,5,6,7]. Nitrate, one of the main components of nitrogen stored in water, is mainly derived from external sources including domestic sewage, inorganic/organic fertilizer residual, soil organic nitrogen linked to mineralization and nitrification and others [8,9]. To mitigate eutrophication, water pollution management has made some progress over the recent years [10,11]; however, the water quality has not been significantly improved, particularly in developing countries [11]. Non-point-source pollution has become one of the main sources of nitrogen in aquatic environments [12,13]. Under the pressure of maintaining crop production, it is difficult to consistently reduce the consumption of nitrogen fertilizer and nitrogen pollution load from the river basin [14]. Therefore, more effective and feasible measures for reducing the release of non-point sources of nitrate to the water are urgently needed. However, the ambiguous contributions of different sources hinder the formulation of effective measures. Therefore, quantitative identification of nitrate sources is essential for evaluating the impact of nitrogen nutrients on aquatic ecosystems and to further mitigate water eutrophication.
Because of the rapid development of isotope technology and modeling [9,15,16], the nitrate isotopic composition and the Bayesian isotope mixing model have been increasingly applied to identify the potential sources and contributions of nitrate in rivers with both agricultural and urban areas [17,18]. Nitrate in water bodies originates from atmospheric rainfall, fertilizers, manure and sewage from NH4+ in fertilizers and rainfall and from nitrogen in soil organic matter (SOM) [8,9]. Land use types can affect the spatial variation in nitrate sources [19]. In watersheds dominantly covered by agricultural land, nitrate sources in rivers are mainly NH4+ from fertilizers and manure and sewage leaching, due to the large application of chemical fertilizers and the discharge of rural domestic sewage into the water bodies without proper treatment [16,20,21]. Owing to the seepage of domestic sewage and the large discharge of improperly treated wastewater from wastewater treatment plants (WWTPs), sewage contributes predominantly to nitrate in urban mainstem rivers [15,22]. Nitrate isotopic compositions have been used to assess the nitrogen biogeochemical processes [21,23,24]. The river bank and sediment bed play an important role in the nitrification and denitrification processes in rivers [25], which can transform N and cause isotope fractionation, adding complexity in detecting the contribution of N sources in aquatic systems [9]. Therefore, in complex watersheds with mixed urban and agricultural lands, the main nitrate source and the influences of different sources need to be further explored.
Different land-use types have usually led to various sources of nitrate in rivers and have further caused the different contributions of nitrate sources along the mainstream [15]. The understanding of spatiotemporal variation contributed by nitrate sources can elucidate the mechanism of nitrate dynamics in the watershed [26]. However, focusing on the characteristics of nitrate concentration and identification of nitrate sources only at the river outlets will easily neglect the changes of concentration and sources among different land-use types. In addition, analyzing the changes in nitrate sources from upstream to downstream can be helpful for understanding the contribution of high-concentration point sources to water pollution, from the perspective of the river convergence process. As the main transport medium for pollutants entering rivers, rainfall-runoff inevitably affects the contributions of nitrate non-point sources to aquatic ecosystems [27,28]. Previous studies have shown that the main nitrate source contributions display seasonal variations. Whether in agricultural or urban rivers, the contribution of domestic sewage sources to river nitrate in the dry season is larger than that in the rainy season [22,27,29,30]. In previous studies conducted in large watersheds, dual nitrate isotope determination was conducted over a few months during the rainy and dry seasons, which might cause uncertainty and overlook monthly variation during the year in the estimation of nitrate source contributions. Therefore, in addition to studying the nitrate source contributions in large watersheds, it is necessary to analyze the roles of spatiotemporal variations of the nitrate source contributions in the dynamics of nitrate in small watershed with higher temporal resolution. However, such information is scarcely found in published results.
Due to the rapid economic development in recent decades, the Yangtze River Delta region has experienced high urbanization [31]. This study examined the spatiotemporal characteristics of nitrogen concentration in a tributary of the Yangtze River, the Yuntaishan River. Based on dual-isotope analyses and a Bayesian isotope mixing model, this study identified nitrate sources in rivers and quantified the contributions of different sources in the tributaries and mainstems. The main research aims are to (1) analyze the characteristics and spatiotemporal variations of nitrogen composition in rivers; (2) identify the spatiotemporal variations in nitrate sources in rivers; (3) estimate the contributions of different nitrate sources. The results can provide a reference for understanding nitrogen dynamics in river basins and provide innovative support for nitrogen management practices in regions with both urban and rural areas. In contrast with previous studies, the monthly dense sampling in the small watershed was conducted in this research, which can markedly reduce the uncertainty in the spatiotemporal analysis of source contributions. In addition, this region was in the transitional stage from agricultural to urban land [32], which is a good representative of the rapidly urbanized areas in China. Therefore, the results can provide high spatiotemporal resolution information about nitrogen pollution and be helpful to develop new strategies for mitigating water pollution in small watersheds.

2. Materials and Methods

2.1. Study Area

The Yuntaishan River is located in Nanjing City, which is one of the megacities in the Yangtze River Delta region. The total length of the Yuntaishan River is 9.4 km with a total drainage area of 183.2 km2. The Yuntaishan River has two upstream tributaries (Yunba and Shengli Rivers) and one downstream tributary (Yangshan River) (Figure 1). The areas of three sub-catchments, Yunba River, Shengli River and Yangshan River, are 38.4 km2, 64.6 km2 and 30.8 km2, respectively. The Yuntaishan basin is a semi-urbanized area covered by 38% agricultural land and 22% urban land (Table 1). The geomorphology of the area is characterized by a hilly area whose slopes gradually increase from northeast to southwest. The study area is characterized by a subtropical monsoon climate, with an average annual air temperature of 15.7 °C. The annual mean precipitation is 1067 mm, most of which occurs between June and September. During the sampling period (from March 2019 to January 2020), the cumulative rainfall was 627.5 mm, with 66% of total rainfall occurring between June and September, and the average water temperature was 20.5 °C. The river velocity in the mainstem river ranged from 0.24 m3/s to 2.87 m3/s during the sampling period (Table 2). The daily rainfall data were obtained from Nanjing Meteorological Station.

2.2. Sample Collection and Measurement

Water samples were collected monthly from March 2019 to January 2020 at eight sampling sites (Figure 1). Duringthe water sampling campaign, water temperature and discharges were measured in situ inside the river using water thermometer and flowmeter (LS-1206B, Jiangsu Nanshui Water Technology Co. Ltd., Nanjing, China) at three stations (M3, M6, T7) (Table 2). Three sampling sites, T1, T2 and T7, were located at the outlets of tributaries of Yunba River, Shengli River and Yangshan River, respectively, which were analyzed for the impacts of different land-use types on river water quality (Figure 1). Five sampling sites (M3-M6 and M8), located at the mainstem of the Yuntaishan River, in which M3 is located at the beginning of the Yuntaishan River and M8 located in the outlet of the Yuntaishan River. Water samples were collected at eight sites monthly from both near river shores and the open rivers at a water depth of 50 cm using a sampler cleaned with deionized water. After sampling, all samples were immediately stored in a cold closet in the dark until laboratory measurement. Nitrogen-related indicators were analyzed within 24 h, and nitrate isotopes were frozen at −18 °C until laboratory measurement.
Water samples were filtered through glass microfiber filters (aperture 1.2 μm, GF/C, Whatman) for the measurement of ammonium nitrogen (NH4+-N), nitrite nitrogen (NO3-N), δ15N-NO3 and δ18O-NO3, and residual unfiltered water samples were measured for TN. The concentrations of TN, NH4+-N and NO3-N were determined using a continuous injection analyzer (Skalar San plus, Netherlands) with detection limits of 0.01 mg/L for TN, NH4+-N and NO3-N, respectively. The values of δ15N-NO3 and δ18O-NO3 were measured using the denitrified method [33,34]. NO3-N was transformed to gaseous nitrous oxide (N2O) by utilizing denitrifying bacteria lacking N2O-reductive activity. The product N2O was extracted, purified and analyzed through a trace-gas detection system, following the values of δ15N-NO3 and δ18O-NO3, being determined by an isotope ratio mass spectrometer (IRMS; IsoPrime 100, Elementar, Cheadle, UK). The standard nitrate reference USGS32, USGS34 and USGS35 were added to each sample batch. δ15N-NO3 values were denoted as per mil deviation relative to N2 in atmospheric air with a precision of ±0.2‰, and δ18O-NO3 values were reported relative to the Vienna Standard Mean Ocean Water with an analytical precision of ±0.5‰. The values for δ15N and δ18O were calculated as follows:
δ   ( ) =   ( R s a m p l e R s t a n d a r d 1 ) × 1000
where Rsample and Rstandard are the measured isotopic ratios (e.g., 15N/14N or 18O/16O) of the sample and standard, respectively. The ratio of the 15N/14N reference is N2 in the atmosphere.

2.3. NO3-N Source Identification and Contribution Estimation

According to previous research in the region, the nitrate sources include chemical fertilizers, atmospheric deposition, manure and sewage and nitrogen in soil organic matter in surface water and groundwater [9]. Similar to many studies [16,20,21], this research mainly focused on the contributions of non-point source pollution to nitrate in rivers. Although groundwater may also contribute the nitrate pollution in the river, to the best of our knowledge, the contribution is very small in our research area [16,20,21]. In addition, because none of the samples fell within the range of NO3 in fertilizer (NIF), NIF was not applied as a source for the calculation. Studies have shown that the δ15N-NO3 value in domestic sewage was lower than that in manure, with the range of 4–19‰ [9]. There was no obvious manure source in the study region, such as large animal breeding sites, and δ15N-NO3 values of most samples were below 19‰. In addition, to the best of our knowledge of this area, there were no significant differences between the untreated sewage and treated sewage. In particular, δ15N-NO3 and δ18O-NO3 in WWTPs were 13.88 ± 5.86‰ and 2.34 ± 3.39‰ [35], respectively, which were close to the values in raw sewage (11.4 ± 2.3‰ and 2.5 ± 2.2‰) [27]. Therefore, domestic sewage was considered as the main source of the NO3-N in our study area. Due to the small difference between raw sewage and treated sewage in the area, we used values of raw sewage for all sewages in the current study. Therefore, there are four potential NO3-N sources in the water environment: sewage (MS), nitrogen in soil organic matter (SOM), NH4+ in fertilizer (NF) and atmospheric precipitation (AP) [13,17]. The ranges of nitrate isotopic composition from potential sources have been well testified in previous publications [21,27,36]. Similar to many studies, this research referred to published values from similar research areas (Table 3). Based on the differences in δ15N-NO3 and δ18O-NO3 values among the four potential sources, this study adopted the dual-isotope bi-plot approach (δ15N-NO3 versus δ18O-NO3) to identify the dominant sources of NO3-N in the research sites [13]. The scattered points (δ15N-NO3 versus δ18O-NO3) of the samples fell within a single or overlapping area of the NO3-N source frame, suggesting that the NO3-N derives from this source (the single area) or the corresponding multiple sources (overlapping areas).
The Stable Isotope Analysis (SIAR) based on the MixSIAR package in the R software was applied to quantitatively estimate the proportions of different NO3-N sources. Based on the Bayesian framework, SIAR uses Dirichlet as the prior logic distribution of the contribution rate of the pollution source. When the isotope information is input, the updated information is included in the posterior distribution. Based on the Bayesian equation, the posterior distribution characteristics of each source and the probability distribution of each source contribution are obtained. According to the results of the probability distribution, the proportions contributed by each source are calculated [34]. The mixing model is described as follows:
X i j = k = 1 k P k ( S j k + C j k ) + ε i j
S j k ~ N ( μ j k ,   ω j k 2 )
C j k ~ N ( λ j k ,   τ j k 2 )
ε i j ~ N ( 0 ,   σ j 2 )
where X i j is the observed isotope value j of the mixture i , in which i = 1, 2, 3, …, N and j = 1, 2, 3,…, j ; S j k is the source value k on isotope j ( k = 1, 2, 3,…, K) and follows a normal distribution with mean μ j k and standard deviation ω j k 2 (Table 3); P k is the proportional contribution of source k and needs to be determined; C j k is the fraction factor for isotope j on source k and is normally distributed with mean λ j k and standard deviation τ j k 2 ; ε i j is the residual error for isotope value j in the mixed sample i and follows a normal distribution with mean = 0 and standard deviation σ j 2 . In this study, the fractionation factor C j k was set to 0 because denitrification was not identified in the Yuntaishan River waters (see details in Section 4.2).
There are uncertainties in proportional contributions based on the SIAR. This study used an uncertainty index (UI90) to characterize the uncertainty strength [16]. UI90 refers to the difference of the proportions between the maximum and minimum values contributed by four sources from the 5 to 95% cumulative probability divided by 90%.

2.4. Statistical Analysis

Data were checked for normality and homogeneity of variance prior to statistical analyses. Spatial and temporal differences in nitrogen concentration among different sites and months were tested using one-way analysis of variance (ANOVA) followed by Duncan’s Multiple Range Test. Pearson Product-Moment Correlations were conducted to analyze the correlations between nitrogen concentration with rainfall and different sources. All statistical analyses were performed using software SPSS version 19.0 (SPSS Inc., Chicago, IL, USA).

3. Results

3.1. Spatiotemporal Variations in Nitrogen Concentration

The concentrations of TN, NH4+-N and NO3-N changed in the ranges of 0.53–18.0 mg/L, 0.01–15.4 mg/L and 0.06–9.3 mg/L, with the averages of 5.4 ± 3.0 mg/L, 1.1 ± 1.8 mg/L and 3.4 ± 2.3 mg/L over all sites during the research period, respectively (Figure 2). NO3-N, as the primary form of nitrogen, accounted for 58.2% of TN, while the proportion of NH4+-N to TN was only 18.4%. The NO3-N/NH4+-N ratios showed the spatial variation between tributaries, with the ratios of 4.8 in T1, 2.2 in T2 and 1.2 in T7.
Temporally, there were obvious monthly variations in nitrogen concentration in the Yuntaishan River basin from March 2019 to January 2020 (Figure 2A). The TN concentration in December (8.5 ± 1.4 mg/L) was significantly higher than those from May to September (mean 3.8 ± 1.8 mg/L) (p < 0.05), while no statistical differences with those in the remaining months (mean 6.6 ± 3.1 mg/L) in Yuntaishan River basin. The NH4+-N concentration in March (3.1 ± 5.0 mg/L) was significantly higher than those from April to October (mean 0.6 ± 0.8 mg/L) (p < 0.05), but no significant difference with those from December to January (mean 1.4 ± 1.2 mg/L) (p > 0.05). The NO3-N concentrations in November and December (mean 5.9 ± 1.7 mg/L) were significantly higher than those from March to September (mean 2.5 ± 1.8 mg/L) (p < 0.05), but not significantly different from those in January and October (mean 4.1 ± 2.2 mg/L) (p > 0.05). Overall, the concentrations of TN and NO3-N generally decreased from March to August and gradually increased from August to November, and then decreased with some fluctuations from November to January of the next year in the Yuntaishan River catchment. There were seasonal patterns. The TN concentration was significantly higher in winter (mean 7.6 ± 1.9 mg/L) and autumn (6.1 ± 2.7 mg/L), but lower in summer (3.6 ± 2.0 mg/L) and spring (4.4 ± 3.5 mg/L) (p < 0.05). Similarly, the NO3-N concentration was significantly higher in winter (4.9 ± 2.3 mg/L) and autumn (4.2 ± 2.2 mg/L) but lower in summer (2.0 ± 1.7 mg/L) and spring (2.9 ± 2.0 mg/L) (p < 0.05). However, the NH4+-N concentration showed no obvious seasonal pattern.
There were obvious spatial variations in nitrogen concentration in the Yuntaishan River catchment (Figure 2B). The average concentrations of TN and NO3-N in the mainstem river (mean 6.0 ± 2.4 mg/L and 3.9 ± 2.1 mg/L) were higher than those in tributaries (mean 4.5 ± 3.6 mg/L and 2.5 ± 2.3). The NH4+-N concentrations in mainstem river (mean 0.9 ± 0.9 mg/L) were lower than those in tributaries (mean 1.2 ± 2.7 mg/L) (p > 0.05). The larger standard deviation (STD) in tributaries might be caused by the lower discharge in the tributaries. In the mainstem river, M4 had higher concentrations of TN (6.9 ± 1.9 mg/L) and NO3-N (5.1 ± 1.8 mg/L) than other sites, whereas M8 had higher NH4+-N concentration (1.2 ± 1.4 mg/L) than other sites. In the tributaries, T7 had higher concentrations of TN (6.4 ± 4.3 mg/L) and NH4+-N (2.5 ± 4.4 mg/L) than T1 and T2, whereas T1 (3.2 ± 3.1 mg/L) and T7 (3.1 ± 1.6 mg/L) had higher concentrations of NO3-N than T2 (1.2 ± 1.3 mg/L).
There were clearly monthly variations in discharge in sites M3, M6 and T7 (Table 2). In the mainstem river (M3 and M6), the discharge changed in the range of 0.2–2.9 m3/s, and average discharges from October to January (0.6 ± 0.3 m3/s and 1.0 ± 0.7 m3/s) were much lower than those from March to September (1.6 ± 0.9 m3/s and 1.9 ± 0.9 m3/s). In tributary T7, the discharge ranged from 0.1 m3/s to 0.7 m3/s with the average of 0.3 ± 0.2 m3/s. The average discharge from October to January was similar to those from March to September.

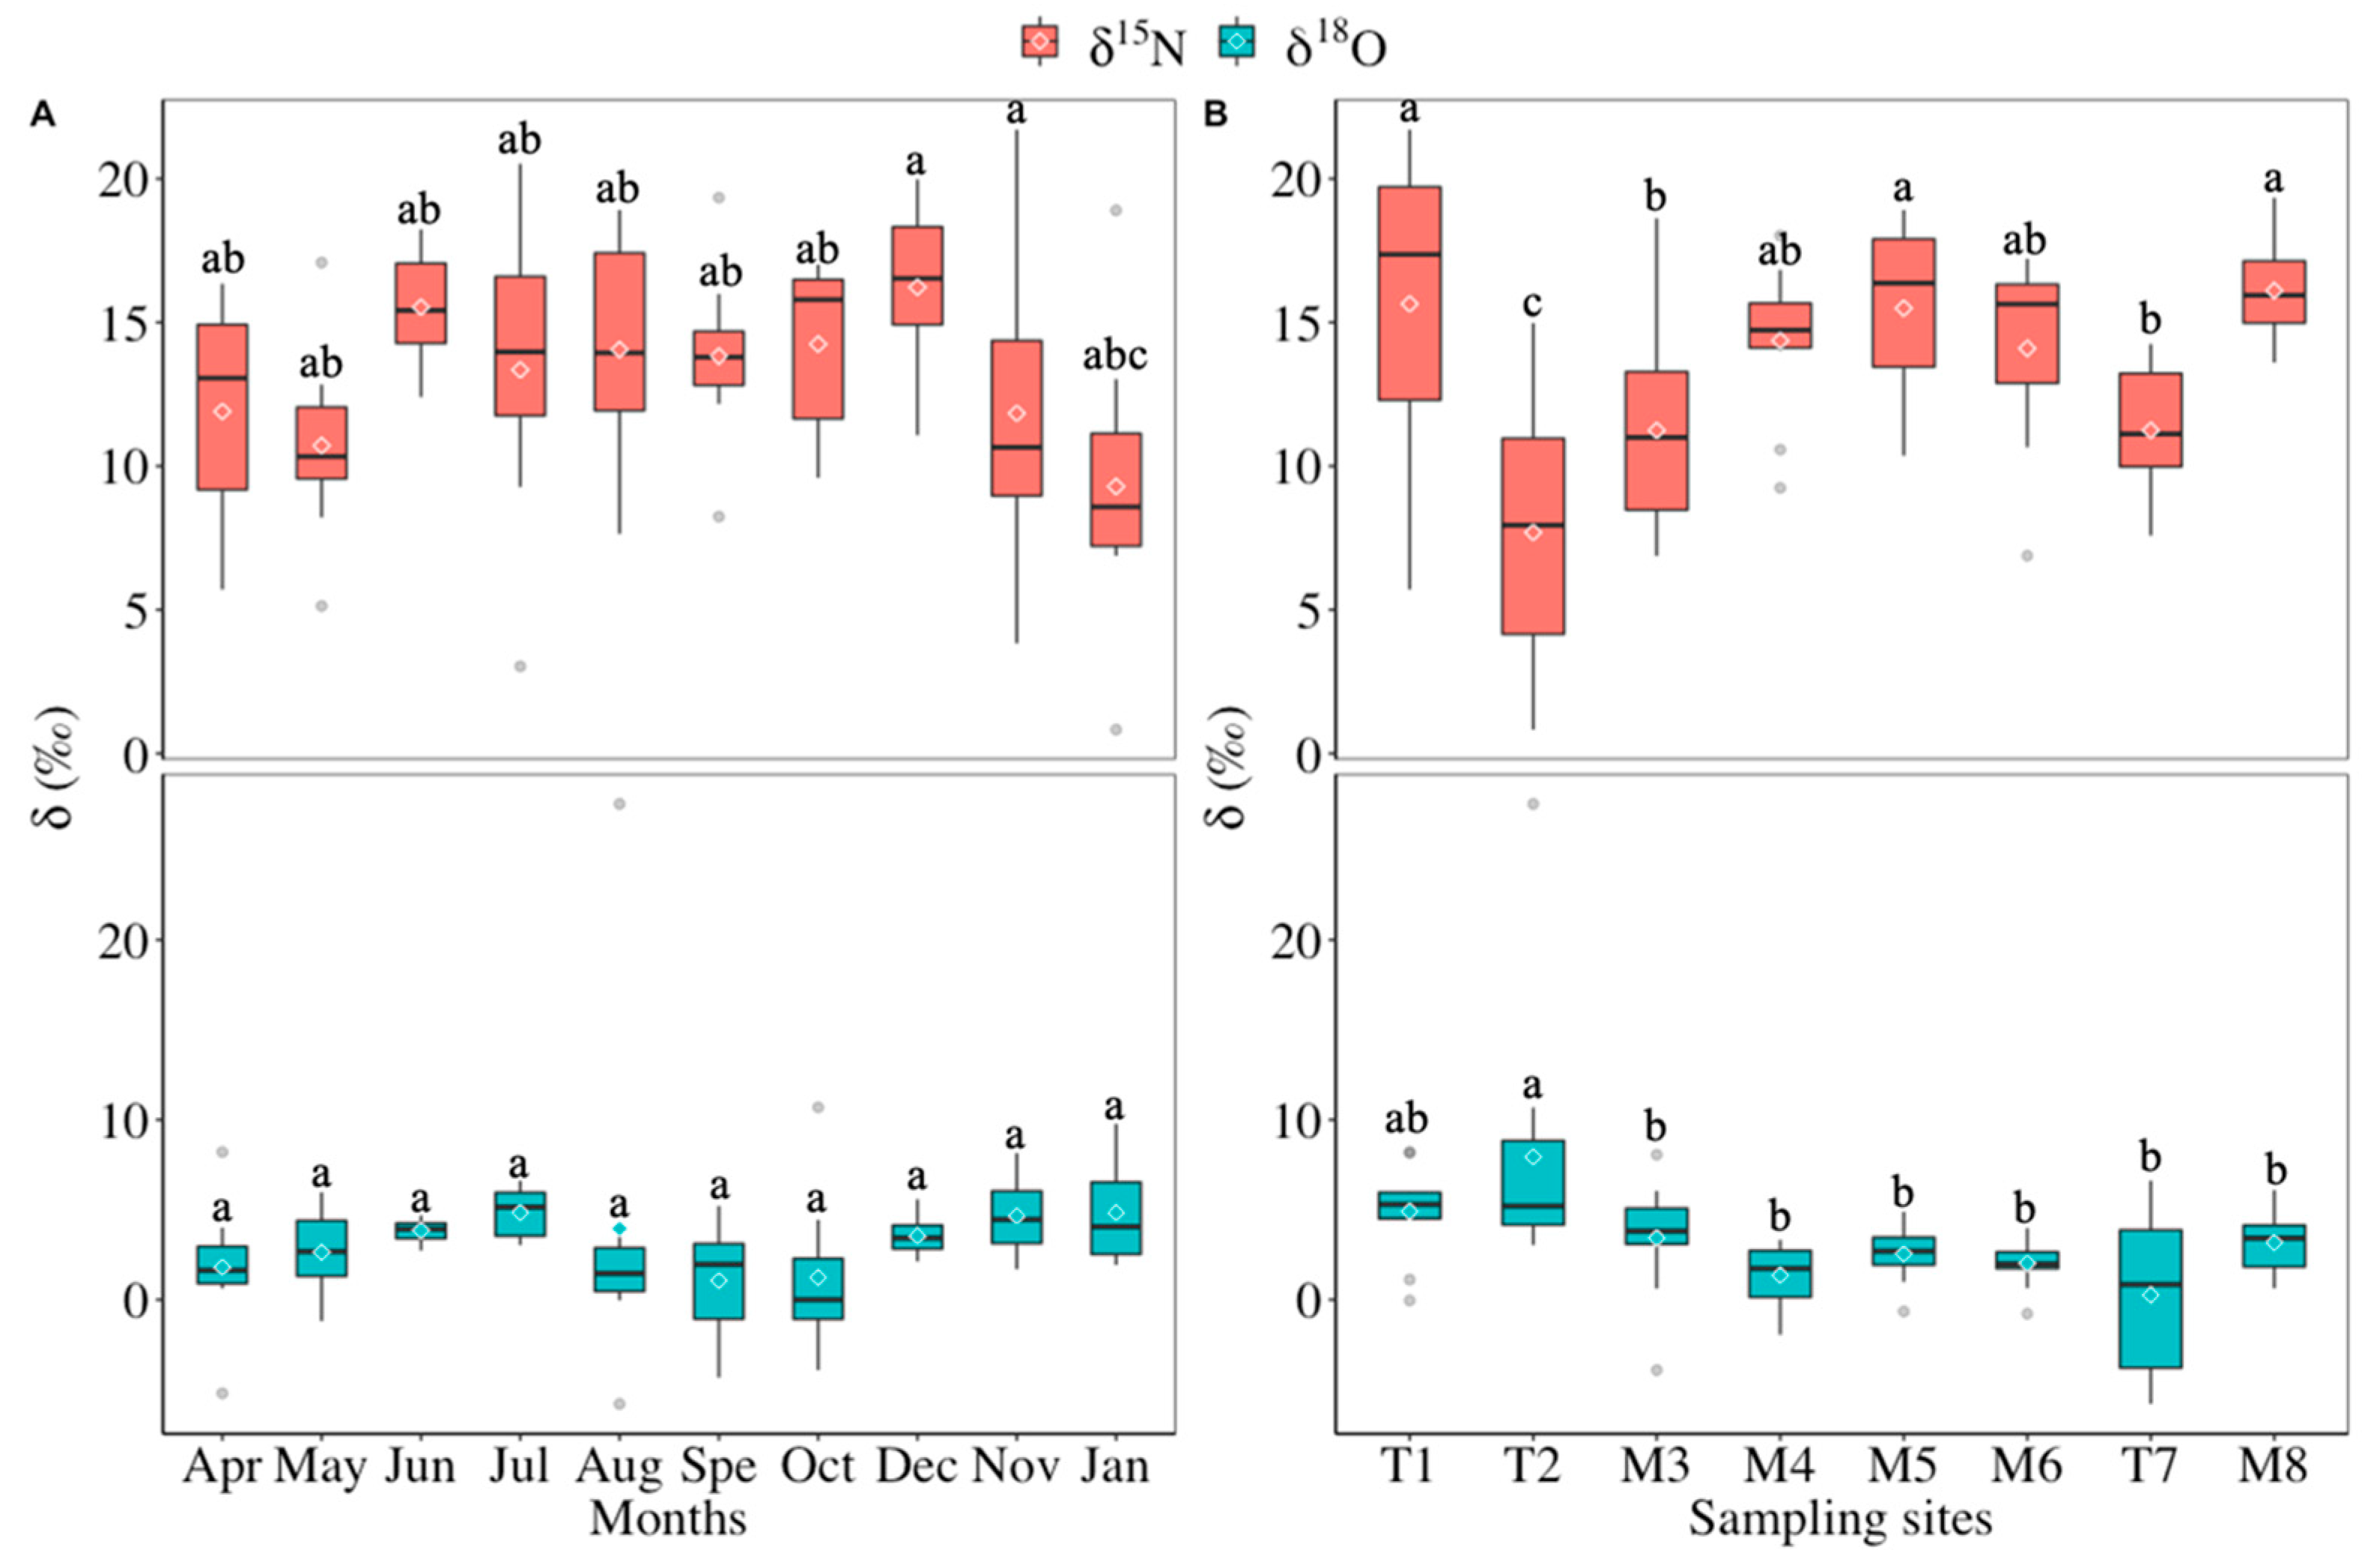
3.2. Spatiotemporal Variations in δ15N-NO3 and δ18O-NO3

The nitrate isotopic compositions at the eight sites were further measured to identify the NO3-N sources. The values of δ15N-NO3 and δ18O-NO3 varied within the ranges of 0.83‰–21.7‰ and −5.8‰–27.6‰ (n = 78), with averages of 13.2 ± 4.3‰ and 3.2 ± 4.1‰ over all sites during the research period (Figure 3A). The highest and lowest δ15N-NO3 values appeared in November and January, with values of 16.2 ± 2.9‰ and 9.3 ± 5.6‰. The highest δ18O-NO3 values appeared in July and January, with the mean value of 4.8 ± 2.2‰, while the lowest δ18O-NO3 values occurred in September (mean 1.1 ± 3.2‰). There were no significant differences in δ18O-NO3 values between different months (p > 0.05). Spatially, the δ15N-NO3 values in T1 (15.6 ± 5.2‰), M5 (15.5 ± 2.9‰) and M8 (16.1 ± 1.8‰) were significantly higher than those in T2 (7.7 ± 4.5‰), M3 (11.2 ± 3.6‰) and T7 (11.2 ± 2.3‰) (p < 0.05), but no statistical differences with the values in M4 (14.4 ± 2.7‰) and M6 (14.1 ± 3.3‰) (p > 0.05) (Figure 3B). It is worth noting that the δ15N-NO3 value increased markedly from M3 to M5, indicating a possible pollution source with high δ15N-NO3 in this river section. The δ18O-NO3 value in T2 (7.9 ± 7.4‰) was significantly higher than the values in the other seven sampling sites (p < 0.05), whereas there were no statistical differences between the other seven sites.

3.3. Nitrate Sources and Contributions in Rivers

The results of the study showed that most of the samples fell within the range of MS (Figure 4), indicating that the manure and sewage made the largest contribution (67%) to NO3-N in Yuntaishan River basin (Figure 5A). The SIAR results showed that NH4+ in fertilizer and soil organic nitrogen contributed 6% and 27% to the overall NO3-N in the Yuntaishan River basin (Figure 5A). The dispersed distribution of scattered points of samples indicates the spatial differences in the NO3-N sources among river reaches. The values of δ15N-NO3 and δ18O-NO3 in tributary T1 fell within the range of MS (Figure 4), indicating that manure and sewage were the dominant contributor to NO3-N in Yunba River with the contribution of 78% (Figure 5B). The values of δ15N-NO3 and δ18O-NO3 in tributary T2 mainly fell within the ranges of MS and SOM, indicating the multiple source contribution to NO3-N (Figure 4). The values of δ15N-NO3 and δ18O-NO3 in tributary T7 mainly fell within the ranges of MS, suggesting that it was the dominant source contribution (manure and sewage) to NO3-N (Figure 4). Soil organic nitrogen and manure and sewage contributed, respectively, 36% and 44% NO3-N to the tributary T2 and 44% and 49% NO3-N to the T7 tributary (Figure 5B).
The values of δ15N-NO3 and δ18O-NO3 at the M3 site mainly fell within the ranges of MS and SOM (Figure 4). The results of SIAR suggested that sewage and soil organic nitrogen contributed 60% and 32% of total NO3-N (Figure 5B). The values of δ15N-NO3 and δ18O-NO3 in mainstem river (M4-M8) all fell within the range of MS (Figure 4), which indicated that the NO3-N in the mainstem was mainly derived from manure and sewage with the contribution ranging from 70% (M4) to 86% (M8). From M3 to M4, TN concentrations increased from 2.6 mg/L to 4.2 mg/L, NH4+-N concentrations grew from 0.5 mg/L to 1.0 mg/L and NO3-N concentrations increased from 2.2 mg/L to 5.1 mg/L (Figure 2B), respectively, indicating that there was point source pollution effluence in the M3-M4 river reach. Therefore, nitrogen in Yuantaishan River basin was mainly derived from manure and sewage.
There were monthly variations in NO3-N sources in the Yuntaishan River basin (Figure 5C). The annual change of manure and sewage contributions was a bimodal curve, with the maximums in June (82%) and December (84%) and the minimums in May (55%) and January (55%). In contrast, the maximums of soil nitrogen contribution appeared in May (35%) and January (33%), while the minimums occurred in June (13%) and December (12%). Nevertheless, manure and sewage contributed 75% and 67% of NO3-N to Yuntaishan River basin in the rainy season and dry season.
Similar to many studies, however, there are uncertainties of the results. During the research period, the contributions of AP, MS, NF and SOM ranged from 0.01% to 1%, from 61% to 73%, from 0.4% to 17% and from 12% to 35%, respectively (Figure 5A). Therefore, the UI90 for AP, MS, NF and SOM were 0.01, 0.15, 0.22 and 0.32, respectively, indicating higher uncertainty for NF and SOM and lower uncertainty for AP and MS. In general, the estimation uncertainty of sewage sources was low, indicating that estimated contributions of different sources were acceptable.

3.4. Contribution of Tributaries to the Mainstem River NO3-N

Based on the above analysis results, this study estimated the contributions from tributaries of T1, T2 and T7 and point source of sewage near the M4 to the mainstream NO3-N (M8). Owing to the unavailable nitrate isotopic composition of the point source of sewage, this study adopted the nitrate isotopic composition in the M5 river section (downstream of the discharge point) as an approximate replacement. The results of SIAR showed that 53%, 28%, 7% and 13% of NO3-N in M8 originated from the point source of sewage, tributary T1, tributary T2 and tributary T7, respectively (Figure 6).
In order to verify the above results, this study also calculated the contribution of tributaries of T1, T2 and T7 and point source to NO3-N in M8 river section based on the mass balance. According to the semi-distributed hydrological model constructed for this research area by our research team, the annual runoff of the three tributaries at T1, T2 and T7 and the mainstream at M8 were simulated. The details of model construction and parameter calibration and verification can be found in reference [37]. The annual NO3-N loads of three tributaries and M8 were calculated by multiplying the simulated annual runoff volume by the average concentration of the measured NO3-N. The results were shown in Table 4. The contribution of point source pollution was calculated by the difference between the total load and three tributaries. Based on the simulation results, point source of sewage, tributary sites T1, T2 and T7 and point source of sewage contributed 44%, 29%, 5% and 22% of NO3-N to M8 river section, respectively (Figure 6). The absolute difference between mass balance simulation results and source identification based on the SIAR was below 10%. Both methods indicated the significant contribution of the point source of sewage to NO3-N in the M8 river section.

4. Discussion

4.1. Spatiotemporal Variation in Nitrogen

Water quality monitoring is important for understanding the potential water pollution [38]. In this study, the nitrogen was investigated using a dual isotopic approach in the Yuntaishan River catchment, East China. The concentrations of TN, NH4+-N and NO3-N in the Yuntaishan River catchment were consistent with the nitrogen composition in rivers in the agricultural region of the Taihu Lake Basin, East China [39]. The intense nitrification oxidizes NH4+ to NO3 in agricultural rivers, which leads to a high proportion of NO3-N to TN [40,41]. Previous studies indicated that the unbalanced distribution of annual precipitation and various land-use types in the catchment lead to spatiotemporal heterogeneity of nitrogen in rivers [42,43]. For example, monthly accumulative rainfall was significantly negatively correlated with nitrogen concentration [28]. Both land use and complex mixes of spatial descriptors of different scales were found to be significantly associated with water quality parameters [42].
Variations in rainfall can affect the nutrient, including nitrogen, input from terrestrial ecosystems to the river [44]. Rainfall runoff carries unused fertilizers including nitrogen in soil into the adjacent rivers, causing the increase in nitrogen concentration in water [45]. In addition, continuous rainfall could lead to higher flows entering adjacent rivers, which dilutes the nitrogen pollutants in river water, resulting in a lower nitrogen concentration [46]. However, Jacobs et al. found increasing NO3-N concentrations during the periods of high discharge in the catchment with natural forest, smallholder agriculture, and commercial tea and tree plantations [47]. These double effects complicate the relationships between rainfall and nitrogen concentrations in rivers. In our study, monthly accumulative rainfall exhibited a significant negative linear correlation with the average NO3-N concentration over all sites (r2 = 0.38, p < 0.05); however, there were no significant relationships with average TN concentration (p > 0.05) and average NH4+-N concentration (p > 0.05). In the Yuntaishan River catchment, the farmlands were located under the river embankment or were intercepted with impervious roads, which caused less nitrogen in the surface runoff from farmland to river. Therefore, the rainfall dilution may play a more important role in nitrogen concentration in the Yuntaishan River. For example, in site M3, the average discharge from October to January was much lower than those from March to September. Notably, in the same site, M3, the average concentrations of TN and NO3-N from October to January were markedly higher than those from March to September. In addition, strong water turbulence and higher water temperature may promote the degradation of nitrogen in the rainy season (from April to September), resulting in seasonal differences in nitrogen concentrations [39].
The wastewater discharge into rivers during the flow confluence process can introduce a higher concentration of pollutants, including nitrogen, downstream than upstream [15,19]. The concentrations of TN and NO3-N in the middle and lower reaches (M4-M8) were significantly higher than those upstream (M3) in the Yuntaishan River (p < 0.05) (Figure 2B), which might be caused by wastewater inflow in the river flow confluence process. The field survey found the significantly increased concentrations of TN and NO3-N from M3 to M4 were caused by the effluence of domestic sewage after improper treatment with a still high concentration of nitrogen. From M4 to M8, the concentrations of TN and NO3-N decreased slightly, indicating that dilution and degradation may exist in the confluence process. Active nitrification in Yuntaihan River basin water (see Section 4.2) without the input of high-concentration NH4+-N pollutant led to no obvious spatial difference of the NH4+-N concentration(p > 0.05) in this region.
The spatial heterogeneity of land use types in the sub-catchment can influence the main nitrogen pollution sources and further cause spatial variations in nitrogen concentrations in water [48,49]. Previous studies suggested that urban waters have become pools of nutrients and hotspots of regional pollution [50]. The site T1 sub-catchment was covered mainly by rural residential areas and farmland, so the input of domestic sewage from rural residences into the water may cause the high nitrogen concentration in the T1. In our study, the T7 sub-catchment had a larger proportion of urban land (42.8%) than the T2 sub-catchment (20.6%), and thus nitrogen concentration in T7 was much higher than T2 and T1. In addition, the upstream of T2 was connected to the reservoir, and relatively clean water diluted the water pollution in T2, which might have caused lower nitrogen concentrations. Previous studies indicated that nitrogen concentration in rivers in forest areas was lower than that in agricultural and urban areas, and the difference was attributed to low human activities [19,51]. However, this study shows limited evidence of forest coverage in affecting nitrogen distribution. This was possibly due to the fact that the forest areas were distributed upstream and were different among the sub-watersheds (Table 1), with little influence on the nitrogen distribution.

4.2. Nitrate Transformation and Source Identification

As an important process of nitrate removal in rivers, denitrification can cause isotopic fractionations during nitrogen cycling and change the isotope composition of nitrate, resulting in deviation in the identification of nitrate sources [52,53]. During the denitrification process, NO3 is finally reduced to N2. The lighter 14N isotope is incorporated in this process, resulting in an increase of δ15N in the residual NO3-N [54]. Studies have shown that the δ15N-NO3 has a positive linear correlation with the δ18O-NO3 and a negative correlation with the concentration of NO3-N when denitrification exists [8,24]. In the present study, the δ15N-NO3 value exhibited insignificant positive correlation with the δ18O-NO3 value (p > 0.05) but a significantly positive correlation with the NO3-N concentration (p < 0.05) (Figure 7). In addition, the dissolved oxygen (DO) concentration in natural rivers is generally higher than that required for denitrification (DO < 2.0 mg/L) [39,55]. Therefore, all the evidence indicates the absence of denitrification processes in our study region; this is consistent with the results from rivers in the Changle River catchment, Panzhuang Irrigation District, and Taihu Lake Basin in China [16,21,27]. Nitrate from nitrification of ammonium nitrogen in soil, chemical fertilizer and manure had δ18O-NO3 values ranging from −10‰ to 10‰ [8], with one exception. Therefore, NO3-N was mainly from nitrification of ammonium in our research region, which was consistent with the results obtained in other agricultural areas [16,21,27].
In the Yuntaishan River basin, the manure and sewage was the dominant source of NO3-N (67%), which was higher than in other agricultural rivers in the Taihu Lake Basin (20%) and the Xijiang River (16%) in China [27,29]. Guan et al. [56] found that the rural domestic wastewater per capita increased from 0.68 to 1.01 kg d−1 cap−1 between 2012 and 2020 in Zhejiang, East China. It is estimated that 32–47 tons of rural domestic wastewater was generated in Yuntaishan River Basin every day. Similar to many areas in China, waste management is practiced well in cities, but it is still poor in rural areas [56]. The direct discharge of rural domestic sewage and the effluence of wastewater treatment plants are the predominant sewage sources for NO3-N, which are widely observed in other regions, such as the Changle River basin, and the Three Gorges Reservoir in China [16,35].
Chemical fertilizer is the largest contributor to river nitrate in the agricultural area [35]. However, the contribution of fertilizer in this study was lower than those in other regions, such as Flander agricultural area [20], Sanjiang Plain agricultural area [57], and Changle River agricultural area [16]. The research period from March 2019 to January 2020, was relatively drier with an accumulative rainfall of only 627.5 mm. In Yuntaishan River basin, a large amount of unused land is in the transitional stage from agricultural to urban land. In these cases, it limits farmland runoff to enter the river directly, further reducing the contribution from fertilizer. Nitrification of organic nitrogen in soil was another contributor to river NO3-N [9]. Field investigations found that the riparian zone was covered by a large amount of vegetation. Therefore, soil organic nitrogen from decaying plants in arable land and riparian zone was leached into the river by rainfall-runoff [19], with the consequence of high contribution of soil organic nitrogen in tributaries of T2 and T7.
The contributions of different NO3-N sources also showed spatial variation in the Yuntaishan River basin. In the tributaries, the different land-use types in the sub-catchments influence the contributions of various NO3-N sources. δ15N-NO3 generally increased with the increasing portions of agricultural land, and the increasing inflow of agricultural domestic wastewater into the stream network enhanced δ15N-NO3 [51]. The upstream area of T1 is characterized by a large amount of scattered rural residential areas, where a certain amount of domestic sewage entered the river, causing the large sewage contribution. However, the upstream areas of T2 and T7 were covered by urban land, and effective sewage collection and treatment can reduce the sewage inflowing into rivers. In the mainstem, the tributaries might play an important role in the contribution of NO3-N sources. The NO3-N sources in the M3 river section were the combination of sewage in T1 and soil organic nitrogen in T2 sections. Therefore, the δ15N-NO3 values might have the formulation of δ15NM3 = f1 × δ15NT1 + f2× δ15NT2 and 1 = f1 + f2, which calculated the values of f1 and f2 as 0.45 and 0.55, respectively. The NO3-N concentrations in T1 and T2 sites were 3.2 mg/L and 1.2 mg/L, respectively. Based on the values of f1 and f2, the NO3-N value at M3 was calculated as 2.3 mg/L, which was very close to the measured value of 2.2 mg/L. In addition, there was a drainage outlet in the M4-M5 river section, which discharged poor treated sewage to the mainstem of Yuntaishan River. From M3 to M5, the contributions by sewage increased from 60% to 81%, while the NO3-N concentration increased by 2.3 times. In addition, the contributions of tributaries to mainstem NO3-N showed that point source effluence near the M4 supplied more NO3-N to M8. Therefore, the point source effluence of domestic sewage near the M4 might cause the large sewage contribution to downstream. In addition, NO3-N concentrations over the sampling points were positively correlated with sewage contributions (r2 = 0.51, p < 0.05), which further suggested that the changing sewage contributions during the river confluence process played an important role in the spatial variation in NO3-N concentration.
The contributions of NO3-N sources in the Yuntaishan River showed that the contribution of sewage in summer was higher than those in other seasons, which was consistent with other results [19,22,27,29,58]. Rainfall is an important factor for the temporal variation in nitrate sources in the study area, and some studies have focused on the relationship between rainfall and source changes [17,22]. During the intensive rainfall periods, more flushing of soil organic nitrogen and fertilizer from cultivated land is brought to waters [29]. Over the current research period, the accumulative rainfall was 627.5 mm, lower than the average precipitation (1001 mm excluding February). In addition, the Yuntaishan River basin was in the transitional stage from agricultural to urban land, which might cause more farmlands to be compacted and further constrain the flushing of soil organic nitrogen and fertilizer from cultivated land in the wet season. However, the sewage contributions were less affected by rainfall. Therefore, the factors mentioned above resulted in increased NO3-N from the sewage source in the wet season.

4.3. Mitigating Nitrogen Pollution in Rivers

After the identification of NO3-N sources, effective measures should be implemented to reduce nitrate pollution and stop further environmental pollution [59]. Based on the results, sewage was the predominant contributor to NO3-N in the Yuntaishan River (Figure 7), which mainly originated from rural residential areas [60]. Notably, an important contributor was the sewage point source pollution near the M4 site. Therefore, rural wastewater treatment should be improved to reduce the discharge of domestic sewage with high nitrogen loads [61]. In the last decade, the Chinese government has paid increasing attention to the environment [62] due to serious environmental contamination and human health damage. China enacted a new Environmental Protection Law in January 2015 [63]. To sustainably reduce nitrogen pollution, the government needs to reinforce the strict treatment of civil sewage and industrial wastewater to reduce nitrogen pollution. In addition, ecological restoration projects, such as artificial wetlands, can be conducted in the Yunba River (T1 site) to absorb nutrients and improve water quality. Soil organic nitrogen was the secondary contributor to NO3-N in the Yuntaishan River, mainly from the riparian zone. Hence, it is important to manage soil pollution and reduce the flow of pollutants from watersheds to rivers [64]. With further funding, more sponge cities can be constructed to mitigate floods and reduce nutrient input to rivers [65,66].

4.4. Future Research

This study applied spatiotemporal variations in the proportions contributed by nitrate sources to elucidate the mechanism of nitrate dynamics in the watershed based on the nitrate isotopic compositions. These results provide important theoretical support for urban non-point-source pollution control and river water quality improvement. Our study was conducted from March 2019 to January 2020, and the results showed seasonal changes in nitrogen in the Yuntaishan River basin. Future studies with an extended sampling period could provide more information on annual changes in nitrogen pollution. The coupled isotope and hydrological model methods have been confirmed to be a good tool to improve our understanding of the sources and contributions of nitrogen in rivers [67]. This study referred to the values of nitrate isotopic compositions in sewage and soil from similar urban rivers in China and our own measurement of atmospheric NO3 [21,36]. Future studies, including more in situ measurements, will improve the accuracy of the isotope composition of NO3-N source. Overall, further field measurements of different nitrogen sources at more river sites will expand our understanding of nitrogen pollution in the watershed area and will be helpful for further science-based water management policies.

5. Conclusions

Water eutrophication caused by excessive nutrients, including nitrogen, has been a global environmental problem. This study analyzed the dynamics of nitrogen in the Yuntaishan River, a mixed watershed of agricultural and urban areas in Nanjing, East China. The dual-isotope method was applied to identify the spatiotemporal characteristics of the NO3-N sources. The results showed strong spatiotemporal variations in nitrogen concentration in the Yuntaishan River basin. Higher nitrogen concentrations appeared in the downstream and in winter, while lower values were observed in the upstream and summer. The NO3-N in the rivers was mainly derived from sewage and soil organic nitrogen. The high nitrogen concentrations in the lower reaches were mainly related to the sewage point source pollution discharged in the middle reaches. The sewage point source and tributary T1 made the dominant contribution to NO3-N in the riverine outlet. In addition, the tributary T1 with rural residential areas had more NO3-N from sewage, whereas the tributaries of T2 and T7 with urban areas had more NO3-N from sewage and soil organic nitrogen. The urban areas were connected to WWTPs, leading to reduced sewage contribution to rivers. This was clearly shown in the different proportional contributions of sewage between T1 and T2 (and T7). It was worth noting that the chemical fertilizers contributed less NO3-N to rivers in the Yuntaishan River basin covered by more agricultural area. Therefore, wastewater discharge control was important to reduce nitrate exports in the Yuntaishan River. The variations in the sewage contributions during the river confluence and monthly cumulative rainfall led to the spatiotemporal difference in NO3-N concentration in the watershed. The results can provide an important basis for managing non-point-source nitrogen pollution at the watershed scale and mitigating water pollution.

Author Contributions

Investigation, conceptualization, Y.X.; visualization, Q.Y. and X.M.; conceptualization, writing—original draft, J.G.; investigation, C.Z. and Y.L.; supervision: L.W. and H.Y.; funding acquisition, L.W. and H.Y.; writing—review and editing, H.Y. All authors have read and agreed to the published version of the manuscript.

Funding

This research was funded by the Nanjing Water Science and Technology Project (201806), the Major Science and Technology Program for Water Pollution Control and Treatment (2017ZX07203002-02-01), Program A for Outstanding Ph.D. candidate of Nanjing University (202001A008), and Open Research Fund Program of Jiangsu Key Laboratory of Atmospheric Environment Monitoring and Pollution Control (KHK1806), a project funded by the Priority Academic Program Development of Jiangsu Higher Education Institutions (PAPD), and Natural Science Research Projects of the Jiangsu Higher Education Institution (No.:19KJB170002).

Institutional Review Board Statement

Not applicable.

Informed Consent Statement

Not applicable.

Data Availability Statement

The data presented in this study are available on request from the corresponding author. The data are not publicly available due to privacy.

Acknowledgments

The authors would like to acknowledge Qingqing Wang for their assistance in field sampling and Chunhua Hu for laboratory analyses.

Conflicts of Interest

We declare that we have no financial or personal relationships with other people or organizations that can inappropriately influence our work; there is no professional or other personal interest of any nature or kind in any product, service, and/or company that could be construed as influencing the position presented in, or the review of, the manuscript.

References

  1. Micheli, F. Eutrophication, fisheries, and consumer-resource dynamics in marine pelagic ecosystems. Science 1999, 285, 1396–1398. [Google Scholar] [CrossRef] [PubMed] [Green Version]
  2. Paerl, H.W.; Gardner, W.S.; Havens, K.E.; Joyner, A.R.; Mccarthy, M.J.; Newell, S.E.; Qin, B.; Scott, J.T. Mitigating cyanobacterial harmful algal blooms in aquatic ecosystems impacted by climate change and anthropogenic nutrients. Harmful Algae 2016, 54, 213–222. [Google Scholar] [CrossRef] [PubMed] [Green Version]
  3. Vonlanthen, P.; Bittner, D.; Hudson, A.G.; Young, K.A.; Muller, R.; Lundsgaard-Hansen, B.; Roy, D.; Piazza, S.D.; Largiader, C.R.; Seehausen, O. Eutrophication causes speciation reversal in whitefish adaptive radiations. Nature 2012, 482, 357–362. [Google Scholar] [CrossRef] [PubMed]
  4. Galloway, J.; Dentener, F.; Capone, D.; Boyer, E.; Howarth, R.; Seitzinger, S. Nitrogen cycles: Past, present and future. Biogeochemistry 2004, 70, 153–226. [Google Scholar] [CrossRef]
  5. Mulholland, P.J.; Helton, A.M.; Poole, G.C.; Hamilton, S.K.; Peterson, B.J.; Tank, J.L.; Ashkenas, L.R.; Cooper, L.W.; Dahm, C.N. Stream denitrification across biomes and its response to anthropogenic nitrate loading. Nature 2008, 452, 202–205. [Google Scholar] [CrossRef]
  6. Seitzinger, S.P. Denitrification in freshwater and coastal marine ecosystems: Ecological and geochemical significance. Limnol. Oceanogr. 1988, 33, 702–724. [Google Scholar] [CrossRef]
  7. Walter, K.D.; Wes, W.B.; Jeffrey, L.E.; Tyler, J.P.; Kristen, L.P.; Alyssa, J.R.; Joshua, T.S.D.J. Thornbrugh. Eutrophication of U.S. freshwaters: Analysis of potential economic damages. Environ. Sci. Technol. 2009, 43, 12–19. [Google Scholar]
  8. Kendall, C.; Elliott, E.M.; Wankel, S.D. Tracing Anthropogenic Inputs of Nitrogen to Ecosystems; Blackwell: Oxford, UK, 2008. [Google Scholar]
  9. Xue, D.; Botte, J.; De Baets, B.; Accoe, F.; Nestler, A.; Taylor, P.; Van Cleemput, O.; Berglund, M.; Boeckx, P. Present limitations and future prospects of stable isotope methods for nitrate source identification in surface- and groundwater. Water Res. 2009, 43, 1159–1170. [Google Scholar] [CrossRef]
  10. Yang, H.; Flower, R.J.; Thompson, J.R. Sustaining China’s water resources. Science 2013, 339, 141. [Google Scholar] [CrossRef]
  11. Yang, H.; Xie, P.; Ni, L.; Flower, R.J. Pollution in the Yangtze. Science 2012, 337, 410. [Google Scholar] [CrossRef]
  12. Cho, K.H.; Pachepsky, Y.A.; Oliver, D.M.; Muirhead, R.W.; Park, Y.; Quilliam, R.S.; Shelton, D.R. Modeling fate and transport of fecally-derived microorganisms at the watershed scale: State of the science and future opportunities. Water Res. 2016, 100, 38–56. [Google Scholar] [CrossRef] [PubMed]
  13. Perakis, S.S.; Hedin, L.O. Nitrogen loss from unpolluted South American forests mainly via dissolved organic compounds. Nature 2002, 415, 416–419. [Google Scholar] [CrossRef] [PubMed]
  14. Yang, H.; Shen, X.; Li, L.; Huang, X.; Zhou, Y. Spatio-temporal variations of health costs caused by chemical fertilizer utilization in China from 1990 to 2012. Sustainability 2017, 9, 1505. [Google Scholar] [CrossRef] [Green Version]
  15. Guo, Z.; Yan, C.; Wang, Z.; Xu, F.; Yang, F. Quantitative identification of nitrate sources in a coastal peri-urban watershed using hydrogeochemical indicators and dual isotopes together with the statistical approaches. Chemosphere 2020, 243, 125364. [Google Scholar] [CrossRef]
  16. Ji, X.; Xie, R.; Hao, Y.; Lu, J. Quantitative identification of nitrate pollution sources and uncertainty analysis based on dual isotope approach in an agricultural watershed. Environ. Pollut. 2017, 229, 586–594. [Google Scholar] [CrossRef]
  17. Yi, Q.; Zhang, Y.; Xie, K.; Chen, Q.; Zheng, F.; Tonina, D.; Shi, W.; Chen, C. Tracking nitrogen pollution sources in plain watersheds by combining high-frequency water quality monitoring with tracing dual nitrate isotopes. J. Hydrol. 2020, 581. [Google Scholar] [CrossRef]
  18. Zhang, Y.; Shi, P.; Song, J.; Li, Q. Application of nitrogen and oxygen Isotopes for source and fate identification of nitrate pollution in surface water: A review. Appl. Sci. 2018, 9, 18. [Google Scholar] [CrossRef] [Green Version]
  19. Hu, M.; Liu, Y.; Zhang, Y.; Dahlgren, R.A.; Chen, D. Coupling stable isotopes and water chemistry to assess the role of hydrological and biogeochemical processes on riverine nitrogen sources. Water Res 2019, 150, 418–430. [Google Scholar] [CrossRef] [Green Version]
  20. Xue, D.; De Baets, B.; Van Cleemput, O.; Hennessy, C.; Berglund, M.; Boeckx, P. Use of a Bayesian isotope mixing model to estimate proportional contributions of multiple nitrate sources in surface water. Environ. Pollut. 2012, 161, 43–49. [Google Scholar] [CrossRef]
  21. Zhang, Y.; Shi, P.; Li, F.; Wei, A. Quantification of nitrate sources and fates in rivers in an irrigated agricultural area using environmental isotopes and a Bayesian isotope mixing model. Chemosphere 2018, 208, 493–501. [Google Scholar] [CrossRef]
  22. Liu, J.; Shen, Z.; Yan, T.; Yang, Y. Source identification and impact of landscape pattern on riverine nitrogen pollution in a typical urbanized watershed, Beijing, China. Sci. Total Environ. 2018, 628, 1296–1303. [Google Scholar] [CrossRef] [PubMed]
  23. Fukada, T.; Hiscock, K.M.; Dennis, P.F. A dual-isotope approach to the nitrogen hydrochemistry of an urban aquifer. Appl. Geochem. 2004, 19, 709–719. [Google Scholar] [CrossRef]
  24. Fukada, T.; Hiscock, K.M.; Dennis, P.F.; Grischek, T. A dual isotope approach to identify denitrification in groundwater at a river-bank infiltration site. Water Res. 2003, 37, 3070–3078. [Google Scholar] [CrossRef]
  25. Fabre, C.; Sauvage, S.; Guilhen, J.; Cakir, R.; Gerino, M.; Sánchez-Pérez, J.M. Daily denitrification rates in floodplains under contrasting pedo-climatic and anthropogenic contexts: Modelling at the watershed scale. Biogeochemistry 2020, 149, 317–336. [Google Scholar] [CrossRef]
  26. Yi, Q.; Chen, Q.; Hu, L.; Shi, W. Tracking nitrogen sources, transformation, and transport at a basin scale with complex plain river networks. Environ. Sci. Technol. 2017, 51, 5396–5403. [Google Scholar] [CrossRef]
  27. Ding, J.; Xi, B.; Gao, R.; He, L.; Liu, H.; Dai, X.; Yu, Y. Identifying diffused nitrate sources in a stream in an agricultural field using a dual isotopic approach. Sci. Total Environ. 2014, 484, 10–18. [Google Scholar] [CrossRef]
  28. Guo, J.; Zuo, P.; Yang, L.; Pan, Y.; Wang, L. Quantitative identification of non-point sources of nitrate in urban channels based on dense in-situ samplings and nitrate isotope composition. Chemosphere 2020, 263, 128219. [Google Scholar] [CrossRef]
  29. Li, C.; Li, S.; Yue, F.; Liu, J.; Zhong, J.; Yan, Z.; Zhang, R.; Wang, Z.; Sen, X. Identification of sources and transformations of nitrate in the Xijiang River using nitrate isotopes and Bayesian model. Sci. Total Environ. 2019, 646, 801–810. [Google Scholar] [CrossRef]
  30. Luu, T.N.M.; Garnier, J.; Billen, G.; Thi, P.Q.L.; Nemery, J.; Orange, D.; Lan, A.L. N, P, Si budgets for the Red River Delta (northern Vietnam): How the delta affects river nutrient delivery to the sea. Biogeochemistry 2012, 107, 241–259. [Google Scholar] [CrossRef] [Green Version]
  31. Song, S.; Xu, Y.P.; Wu, Z.F.; Deng, X.J.; Wang, Q. The relative impact of urbanization and precipitation on long-term water level variations in the Yangtze River Delta. Sci. Total Environ. 2019, 648, 460–471. [Google Scholar] [CrossRef]
  32. Li, J.; Huang, X.; Yang, H.; Chuai, X.; Wu, C. Convergence of carbon intensity in the Yangtze River Delta, China. Habitat Int. 2017, 60, 58–68. [Google Scholar] [CrossRef] [PubMed]
  33. Casciotti, K.L.; Sigman, D.M.; Hastings, M.G.; Bohike, J.K.; Hilkert, A. Measurement of the oxygen isotopic composition of nitrate in seawater and freshwater using the denitrifier method. Anal. Chem. 2002, 74, 4905–4912. [Google Scholar] [CrossRef] [PubMed]
  34. Parnell, A.C.; Inger, R.; Bearhop, S.; Jackson, A.L.; Rands, S. Source partitioning using stable isotopes: Coping with too much variation. PLoS ONE 2010, 5, e9672. [Google Scholar] [CrossRef] [PubMed]
  35. Zhao, Y.; Zheng, B.; Jia, H.; Chen, Z. Determination sources of nitrates into the Three Gorges Reservoir using nitrogen and oxygen isotopes. Sci. Total Environ. 2019, 687, 128–136. [Google Scholar] [CrossRef] [PubMed]
  36. Yang, Y.Y.; Toor, G.S. Delta(15)N and delta(18)O reveal the sources of nitrate-nitrogen in urban residential stormwater runoff. Environ. Sci. Technol. 2016, 50, 2881–2889. [Google Scholar] [CrossRef] [PubMed]
  37. Ren, Z.; Zhao, C.; Wang, Q.; Xu, Y.; Guo, J.; Wang, L. Research on the characteristics and simulation of nitrogen and phosphorus in complex watersheds—a case study of Yuntaishan River Basin in Nanjing City. J. Agro Environ. Sci. 2020. [Google Scholar] [CrossRef]
  38. Ma, X.; Wang, L.; Yang, H.; Li, N.; Gong, C. Spatiotemporal analysis of water quality using multivariate statistical techniques and the water quality identification index for the Qinhuai River Basin, East China. Water 2020, 12, 2764. [Google Scholar] [CrossRef]
  39. Guo, J.; Wang, L.; Yang, L.; Deng, J.; Zhao, G.; Guo, X. Spatial-temporal characteristics of nitrogen degradation in typical rivers of Taihu Lake Basin, China. Sci. Total Environ. 2020, 713, 136456. [Google Scholar] [CrossRef]
  40. Thu, H.L.T.; Joachim, F.; Günter, M. Kinetics and simulation of nitrification at various pH values of a polluted river in the tropics. Ecohydrol. Hydrobiol. 2019, 12, 54–65. [Google Scholar]
  41. Xia, X.; Liu, T.; Yang, Z.; Michalski, G.; Liu, S. Enhanced nitrogen loss from rivers through coupled nitrification-denitrification caused by suspended sediment. Sci. Total Environ. 2017, 579, 47–59. [Google Scholar] [CrossRef] [Green Version]
  42. Vrebos, D.; Beauchard, O.; Meire, P. The impact of land use and spatial mediated processes on the water quality in a river system. Sci. Total Environ. 2017, 601–602, 365–373. [Google Scholar] [CrossRef] [PubMed]
  43. Xu, G.; Li, P.; Lu, K.; Tantai, Z.; Zhang, J.; Ren, Z.; Wang, X.; Yu, K.; Shi, P.; Cheng, Y. Seasonal changes in water quality and its main influencing factors in the Dan River basin. Catena 2019, 173, 131–140. [Google Scholar] [CrossRef]
  44. Zhou, Z.; Huang, T.; Ma, W.; Li, Y.; Zeng, K. Impacts of water quality variation and rainfall runoff on Jinpen Reservoir, in Northwest China. Water Sci. Eng. 2015, 8, 301–308. [Google Scholar] [CrossRef] [Green Version]
  45. Lang, M.; Li, P.; Yan, X. Runoff concentration and load of nitrogen and phosphorus from a residential area in an intensive agricultural watershed. Sci. Total Environ. 2013, 458–460, 238–245. [Google Scholar] [CrossRef] [PubMed]
  46. Lefrancq, M.; Jadas-Hecart, A.; La Jeunesse, I.; Landry, D.; Payraudeau, S. High frequency monitoring of pesticides in runoff water to improve understanding of their transport and environmental impacts. Sci. Total Environ. 2017, 587–588, 75–86. [Google Scholar] [CrossRef] [Green Version]
  47. Jacobs, S.R.; Weeser, B.; Guzha, A.C.; Rufino, M.C.; Butterbach-Bahl, K.; Windhorst, D.; Breuer, L. Using high-resolution Data to assess land use impact on nitrate dynamics in East African Tropical Montane Catchments. Water Resour. Res. 2018, 54, 1812–1830. [Google Scholar] [CrossRef] [Green Version]
  48. Jacobs, S.R.; Breuer, L.; Butterbach-Bahl, K.; Pelster, D.E.; Rufino, M.C. Land use affects total dissolved nitrogen and nitrate concentrations in tropical montane streams in Kenya. Sci. Total Environ. 2017, 603–604, 519–532. [Google Scholar] [CrossRef]
  49. Mainali, J.; Chang, H. Landscape and anthropogenic factors affecting spatial patterns of water quality trends in a large river basin, South Korea. J. Hydrol. 2018, 564, 26–40. [Google Scholar] [CrossRef]
  50. Yang, H.; Ma, M.; Thompson, J.R.; Flower, R.J. Waste management, informal recycling, environmental pollution and public health. J. Epidemiol. Community Health 2018, 72, 237–243. [Google Scholar] [CrossRef]
  51. Mueller, C.; Zink, M.; Samaniego, L.; Krieg, R.; Merz, R.; Rode, M.; Knoller, K. Discharge driven nitrogen dynamics in a Mesoscale River Basin as constrained by stable isotope patterns. Environ. Sci. Technol. 2016, 50, 9187–9196. [Google Scholar] [CrossRef]
  52. Kellman, L.M. A study of tile drain nitrate-delta N-15 values as a tool for assessing nitrate sources in an agricultural region. Nutr. Cycl. Agroecosyst. 2005, 71, 131–137. [Google Scholar] [CrossRef]
  53. Kendall, C. Tracing nitrogen sources and cycling in catchments. In Isotope Tracers in Catchment Hydrology; Kendall, C., McDonnell, J.J., Eds.; Elsevier: Amsterdam, The Netherlands, 1998; pp. 519–576. [Google Scholar]
  54. Bottcher, J.; Strebel, O.; Voerkelius, S.; Schmidt, H.L. Using isotope fractionation of nitrate-nitrogen and nitrate-oxygen for evaluation of microbial denitrification in a sandy aquifer. J. Hydrol. 1990, 114, 413–424. [Google Scholar] [CrossRef]
  55. Rivett, M.O.; Buss, S.R.; Morgan, P.; Smith, J.W.; Bemment, C.D. Nitrate attenuation in groundwater: A review of biogeochemical controlling processes. Water Res. 2008, 42, 4215–4232. [Google Scholar] [CrossRef] [PubMed]
  56. Guan, Y.; Zhang, Y.; Zhao, D.; Huang, X.; Li, H. Rural domestic waste management in Zhejiang Province, China: Characteristics, current practices, and an improved strategy. J. Air Waste Manag. Assoc. 2015, 65, 721–731. [Google Scholar] [CrossRef] [Green Version]
  57. Lu, L.; Cheng, H.; Pu, X.; Liu, X.; Cheng, Q. Nitrate behaviors and source apportionment in an aquatic system from a watershed with intensive agricultural activities. Environ. Sci. Process Impacts 2015, 17, 131–144. [Google Scholar] [CrossRef]
  58. Divers, M.T.; Elliott, E.M.; Bain, D.J. Quantification of nitrate sources to an urban stream using dual nitrate isotopes. Environ. Sci. Technol. 2014, 48, 10580–10587. [Google Scholar] [CrossRef]
  59. Yang, H.; Huang, X.; Thompson, J.R.; Flower, R.J. Enforcement key to China’s environment. Science 2015, 347, 834–835. [Google Scholar] [CrossRef]
  60. Yang, H.; Wright, J.A.; Gundry, S.W. Water accessibility: Boost water safety in rural China. Nature 2012, 484, 318. [Google Scholar] [CrossRef]
  61. Yang, H.; Flower, R.J.; Thompson, J.R. Industry: Rural factories won’t fix Chinese pollution. Nature 2012, 490, 342–343. [Google Scholar] [CrossRef]
  62. Yang, H.; Flower, R.J.; Thompson, J.R. Pollution: China’s new leaders offer green hope. Nature 2013, 493, 163. [Google Scholar] [CrossRef] [Green Version]
  63. Yang, H. China must continue the momentum of green law. Nature 2014, 509, 535. [Google Scholar] [CrossRef] [PubMed] [Green Version]
  64. Yang, H. China’s soil plan needs strong support. Nature 2016, 536, 375. [Google Scholar] [CrossRef] [PubMed] [Green Version]
  65. Hu, M.C.; Zhang, X.Q.; Li, Y.; Yang, H.; Tanaka, K. Flood mitigation performance of low impact development technologies under different storms for retrofitting an urbanized area. J. Clean. Prod. 2019, 222, 373–380. [Google Scholar] [CrossRef]
  66. Hu, M.C.; Zhang, X.Q.; Siu, Y.L.; Li, Y.; Tanaka, K.; Yang, H.; Xu, Y.P. Flood mitigation by permeable pavements in Chinese sponge city construction. Water 2018, 10, 172. [Google Scholar] [CrossRef] [Green Version]
  67. Husic, A.; Fox, J.; Adams, E.; Pollock, E.; Ford, W.; Agouridis, C.; Backus, J. Quantification of nitrate fate in a karst conduit using stable isotopes and numerical modeling. Water Res. 2020, 170, 115348. [Google Scholar] [CrossRef]
Figure 1. Location of sampling sites and land use types in Yuntaishan River basin, Nanjing, East China.
Water 13 00083 g001
Figure 2. The temporal (A) and spatial (B) variations in concentrations of TN, NH4+-N and NO3-N in eight sites in the Yuntaishan River basin. Letters on boxes represent statistical significance, and different letters and same letters indicate difference between these two boxes is significant (p < 0.05) and insignificant (p > 0.05) based on an ANOVA, respectively. Each month in (A) is an average of all stations, and each sampling site in (B) means the yearly average.
Water 13 00083 g002
Figure 3. The temporal (A) and spatial (B) variation in δ15N-NO3 and δ18O-NO3 in eight sites in the Yuntaishan River basin. Letters on boxes represent statistical significance, and different letters and same letters indicate difference between these two boxes is significant (p < 0.05) and insignificant (p > 0.05) based on an ANOVA, respectively. Each month in (A) is an average of all stations, and each sampling site in (B) means the yearly average.
Water 13 00083 g003
Figure 4. Dual δ15N-NO3 and δ18O-NO3 in the Yuntaishan River basin. Five areas show different nitrogen sources. The range of the δ15N-NO3 and δ18O-NO3 values are from Kendall et al. (2008) and Xue et al. (2009). NIF is NO3 in fertilizer, NF is NH4+ in fertilizer and precipitation, SOM is nitrogen in soil organic matter, MS is manure sewage and AP is atmospheric precipitation.
Water 13 00083 g004
Figure 5. Fractional contributions of different sources to NO3-N in Yuntaishan River basin. (A) Contributions from four main sources; (B) contributions in eight sampling sites; (C) contributions indifferent months. AP is atmospheric precipitation; MS is manure and sewage; NF is NH4+ in fertilizer; SOM is nitrogen in soil organic matter. The data in the table show the mean contributions of different sources. The line within the box represents the mean values. The box spans the 0.25 and 0.75 quantiles, and the whiskers represent the 0.05 and 0.95 quantiles.
Water 13 00083 g005
Figure 6. Contributions of tributaries (T1, T2 and T7) and point source to NO3-N in the outlet of Yuntaishan River. Simulation was conducted based on the mass balance.
Water 13 00083 g006
Figure 7. δ15N-NO3 versus δ18O-NO3 and NO3-N in the Yuntaishan River.
Water 13 00083 g007
Table 1. Different land-use types in of Yuntaishan River sub-catchments.
Land Use TypesSub-Catchments
Shengli River Yunba River Mainstem Yangshan River
Urban land20.6%7.3%22.4%42.8%
Rivers/Ponds2.4%2.9%2.6%2.3%
Agricultural land42.4%39.0%37.8%27.4%
Forest land14.2%33.0%17.1%11.4%
Rural residence/unused land20.5%17.9%20.1%16.2%
Total area (km2)64.638.449.530.8
Table 2. Monthly accumulative rainfall, water temperature and discharge in Yuntaishan River basin from March 2019 to January 2020.
Months Monthly Rainfall (mm) Water Temperature (℃)Discharge (m3/s)
M3M6T7
Mar49.515.82.52NaNa
Apr2020.02.48Na0.52
May3525.20.421.630.11
Jun92.526.21.752.870.13
Jul191.526.00.610.610.17
Aug76.529.21.172.520.10
Sep52.525.52.052.100.74
Oct720.60.721.72Na
Nov12.515.90.240.400.52
Dec5811.00.420.400.16
Jan32.59.70.921.530.24
Note: Na represents the lack of data.
Table 3. Values of δ15N-NO3 and δ18O-NO3 in different sources of nitrogen. Values in brackets represent the standard deviation.
Sourcesδ15N-NO3 (‰)δ18O-NO3 (‰)References
Manure and sewage16.3 (5.7)7.0 (2.7)[21]
NH4+ in fertilizer−0.2 (2.3)−2.0 (8.0)[36]
Atmospheric NO30.79 (2.5)80.01 (1.6)This study
Nitrogen in soil organic matter4.7 (0.3)−2.0 (8.0)[27]
Table 4. Annual nitrate load of each tributary and watershed.
CatchmentsRiversArea
(km2)
Annual Runoff
(×104 m3)
Loads
(t)
Yunba RiverTributary T138.41190.831.4
Shengli RiverTributary T264.6526.25.68
Yangshan RiverTributary T730.8853.723.8
Yuntaishan BasinBasin outlet M8183.23483.6108.69
Publisher’s Note: MDPI stays neutral with regard to jurisdictional claims in published maps and institutional affiliations.

