Article

Comparison Study of Multiple Precipitation Forcing Data on Hydrological Modeling and Projection in the Qujiang River Basin

1
Beijing Key Laboratory of Resource Environment and Geographic Information System, Capital Normal University, Beijing 100048, China
2
College of Resources and Environmental Sciences, China Agricultural University, Beijing 100094, China
3
State Key Laboratory of Simulation and Regulation of Water Cycle in River Basin, China Institute of Water Resources and Hydropower Research, Beijing 100038, China
4
Key Laboratory of Watershed Geographic Sciences, Nanjing Institute of Geography and Limnology, Chinese Academy of Sciences, Nanjing 210008, China
*
Author to whom correspondence should be addressed.
Water 2020, 12(9), 2626; https://doi.org/10.3390/w12092626
Submission received: 21 August 2020 / Revised: 12 September 2020 / Accepted: 17 September 2020 / Published: 19 September 2020

Abstract

:
As a key factor in the water cycle and climate change, the quality of precipitation data directly affects the hydrological processes of the river basin. Although many precipitation products with high spatial and temporal resolutions are now widely used, it is meaningful and necessary to investigate and evaluate their merits and demerits in hydrological applications. In this study, two satellite-based precipitation products (Tropical Rainfall Measurement Mission, TRMM; Integrated Multi-satellite Retrievals for GPM, IMERG) and one reanalysis precipitation product (China Meteorological Assimilation Driving Datasets for the Soil and Water Assessment Tool (SWAT) model, CMADS) are studied to compare their streamflow simulation performance in the Qujiang River Basin, China, using the SWAT model with gauged rainfall data as a reference. The main conclusions are as follows: (1) CMADS has stronger precipitation detection capabilities compared to gauged rainfall, while TRMM results in the most obvious overestimation in the four sub-basins. (2) In daily and monthly streamflow simulations, CMADS + SWAT mode offers the best performance. CMADS and IMERG can provide high quality precipitation data for data-scarce areas, and IMERG can effectively avoid the overestimation of streamflow caused by TRMM, especially on a daily scale. (3) The runoff projections of the three modes under RCP (Representative Concentration Pathway) 4.5 was higher than that of RCP 8.5 on the whole. IMERG + SWAT overestimates the surface water resources of the basin compared to CMADS + SWAT, while TRMM + SWAT provides the most stable uncertainty. These findings contribute to the comparison of the differences among the three precipitation products and provides a reference for the selection of precipitation data in similar regions.

1. Introduction

The hydrological processes of a river basin are complex and usually analyzed by the hydrological model [1]. Meteorological data are the most important input item in the hydrological model, especially precipitation, which plays a key role in the hydrological process. The accuracy and sufficiency of these data affect the accuracy of the hydrological model’s results. Current historical meteorological data sources include gauged stations, satellite data, and reanalysis products [2]. Among them, the accuracy of gauged station data is highest, but due to various constraints the distribution of such stations is uneven, which makes it impossible to accurately measure the spatial variations in precipitation [3]. Satellite-based precipitation products are obtained through retrieval algorithms based on remote sensing images combined with infrared and microwave data [4,5], and reanalysis products are created by combining station data and the climate model through data assimilation techniques [6]. Both of these methods can achieve high spatial and temporal resolution, which can make up for the disadvantages of uneven gauged stations and play a crucial role in water resource management [7,8], flood predictions [9], etc.
Currently, the most widely used satellite-based precipitation products include TRMM (Tropical Rainfall Measurement Mission) 3B42 [10], CMORPH (Climate Prediction Center Morphing Technique) [11], and IMERG (Integrated Multi-satellite Retrievals for Global Precipitation Measurement Mission (GPM)) [12]. TRMM was launched as a joint NASA (Space Administration)-JAXA (Japan Aerospace Exploration Agency) mission in 1997, and GPM was launched by them later in 2014, As a gauge-adjusted post real-time precipitation product, TRMM 3B42 V7 is considered one of the most reliable [13,14]. Nevertheless, due to the variations in climate, region, and scale, some differences exist in the various estimations of precipitation and in streamflow simulation products [15]. In some areas of China, TRMM performs well on a monthly scale but significantly overestimates at a daily scale [16,17,18]. The results of a Shanghai study showed that CMORPH outperforms TRMM 3B42 V7 at a daily scale, while the opposite is true for the Yangtze river basin. The IMERG, the successor to TRMM, has been widely focused on in recent years [19]. The estimation of daily precipitation by IMERG in China is significantly better than that of TRMM, CMORPH, and other precipitation products overall, especially that of the IMERG-final [20,21,22,23], while TRMM 3B42 outperforms IMERG in typical arid/semi-arid regions of China [24]. Although some studies have indicated that IMERG-final performs better than TRMM 3B42 V7 in precipitation estimations in some areas, there are still few comparative studies on the hydrological application of IMERG [8,25]. Therefore, whether IMERG can replace TRMM requires further investigation [26].
In reanalysis precipitation products, CMADS (China Meteorological Assimilation Driving Datasets for the Soil and Water Assessment Tool (SWAT) model) products are an emerging meteorological data source for East Asia [27]. Precipitation data are stitched together using CMORPH’s global precipitation products and the National Meteorological Information Center’s data for China. This dataset has been increasingly used by many researchers due to its high data accuracy and the advantages of the CMADS + SWAT mode [27,28,29,30,31]. Meng et al. compared the runoff simulation results of the SWAT model driven by CMADS, CFSR (Climate Forecast System Reanalysis), and traditional station data in the Heihe River Basin, among which the results of CMADS + SWAT were significantly better than those of the other two [28]. In addition, CMADS offered good runoff simulation results in the Lijiang River Basin in South China [29], as well as the cold and arid regions of Northwest China [32] and can be used to analyze the hydrological balance of the basin.
Although the CMADS and IMERG precipitation products have shown good performance in different studies, comparative studies are insufficient. This study will compare the precipitation estimation and runoff simulation results of CMADS and combine IMERG with the SWAT model in a specific river basin. In addition, the TRMM precipitation product was added to discuss the improvements in IMERG relative to TRMM. When comparing multiple precipitation products, gauged rainfall data is usually selected as a reference to judge performance [5,33]. However, most comparative studies on the hydrological applications of precipitation products only focus on historical data. At present, the impact of climate change is a significant global issue and exploring the responses of water resources to future climate change using the hydrological model is a major research direction [34,35]. Thus, the influence of the hydrological model driven by different meteorological products on future hydrological predictions cannot be ignored. Based on the comparison results of the three precipitation products in the time period studied, differences in the prediction of future runoff are also discussed.
We selected the Qujiang River Basin as the study area. This basin is part of the Sichuan Basin in China. Considering its complex internal topography and large elevation span, we selected four hydrological stations from upstream to downstream. Therefore, our work was carried out at four sub-basins. The main objectives of this study are as follows: (1) to compare three precipitation products, TRMM 3B42 V7, IMERG-final, and CMADS (hereafter referred to as TRMM, IMERG, and CMADS, respectively), with rain gauge data (hereafter referred to as Gauged) for precipitation estimation; (2) to evaluate the accuracy and applicability of the three precipitation products in daily and monthly streamflow simulations using the SWAT model; (3) to compare the runoff projection results of the SWAT model driven by three precipitation products using GCM (Global Climate Models) data.

2. Materials and Methods
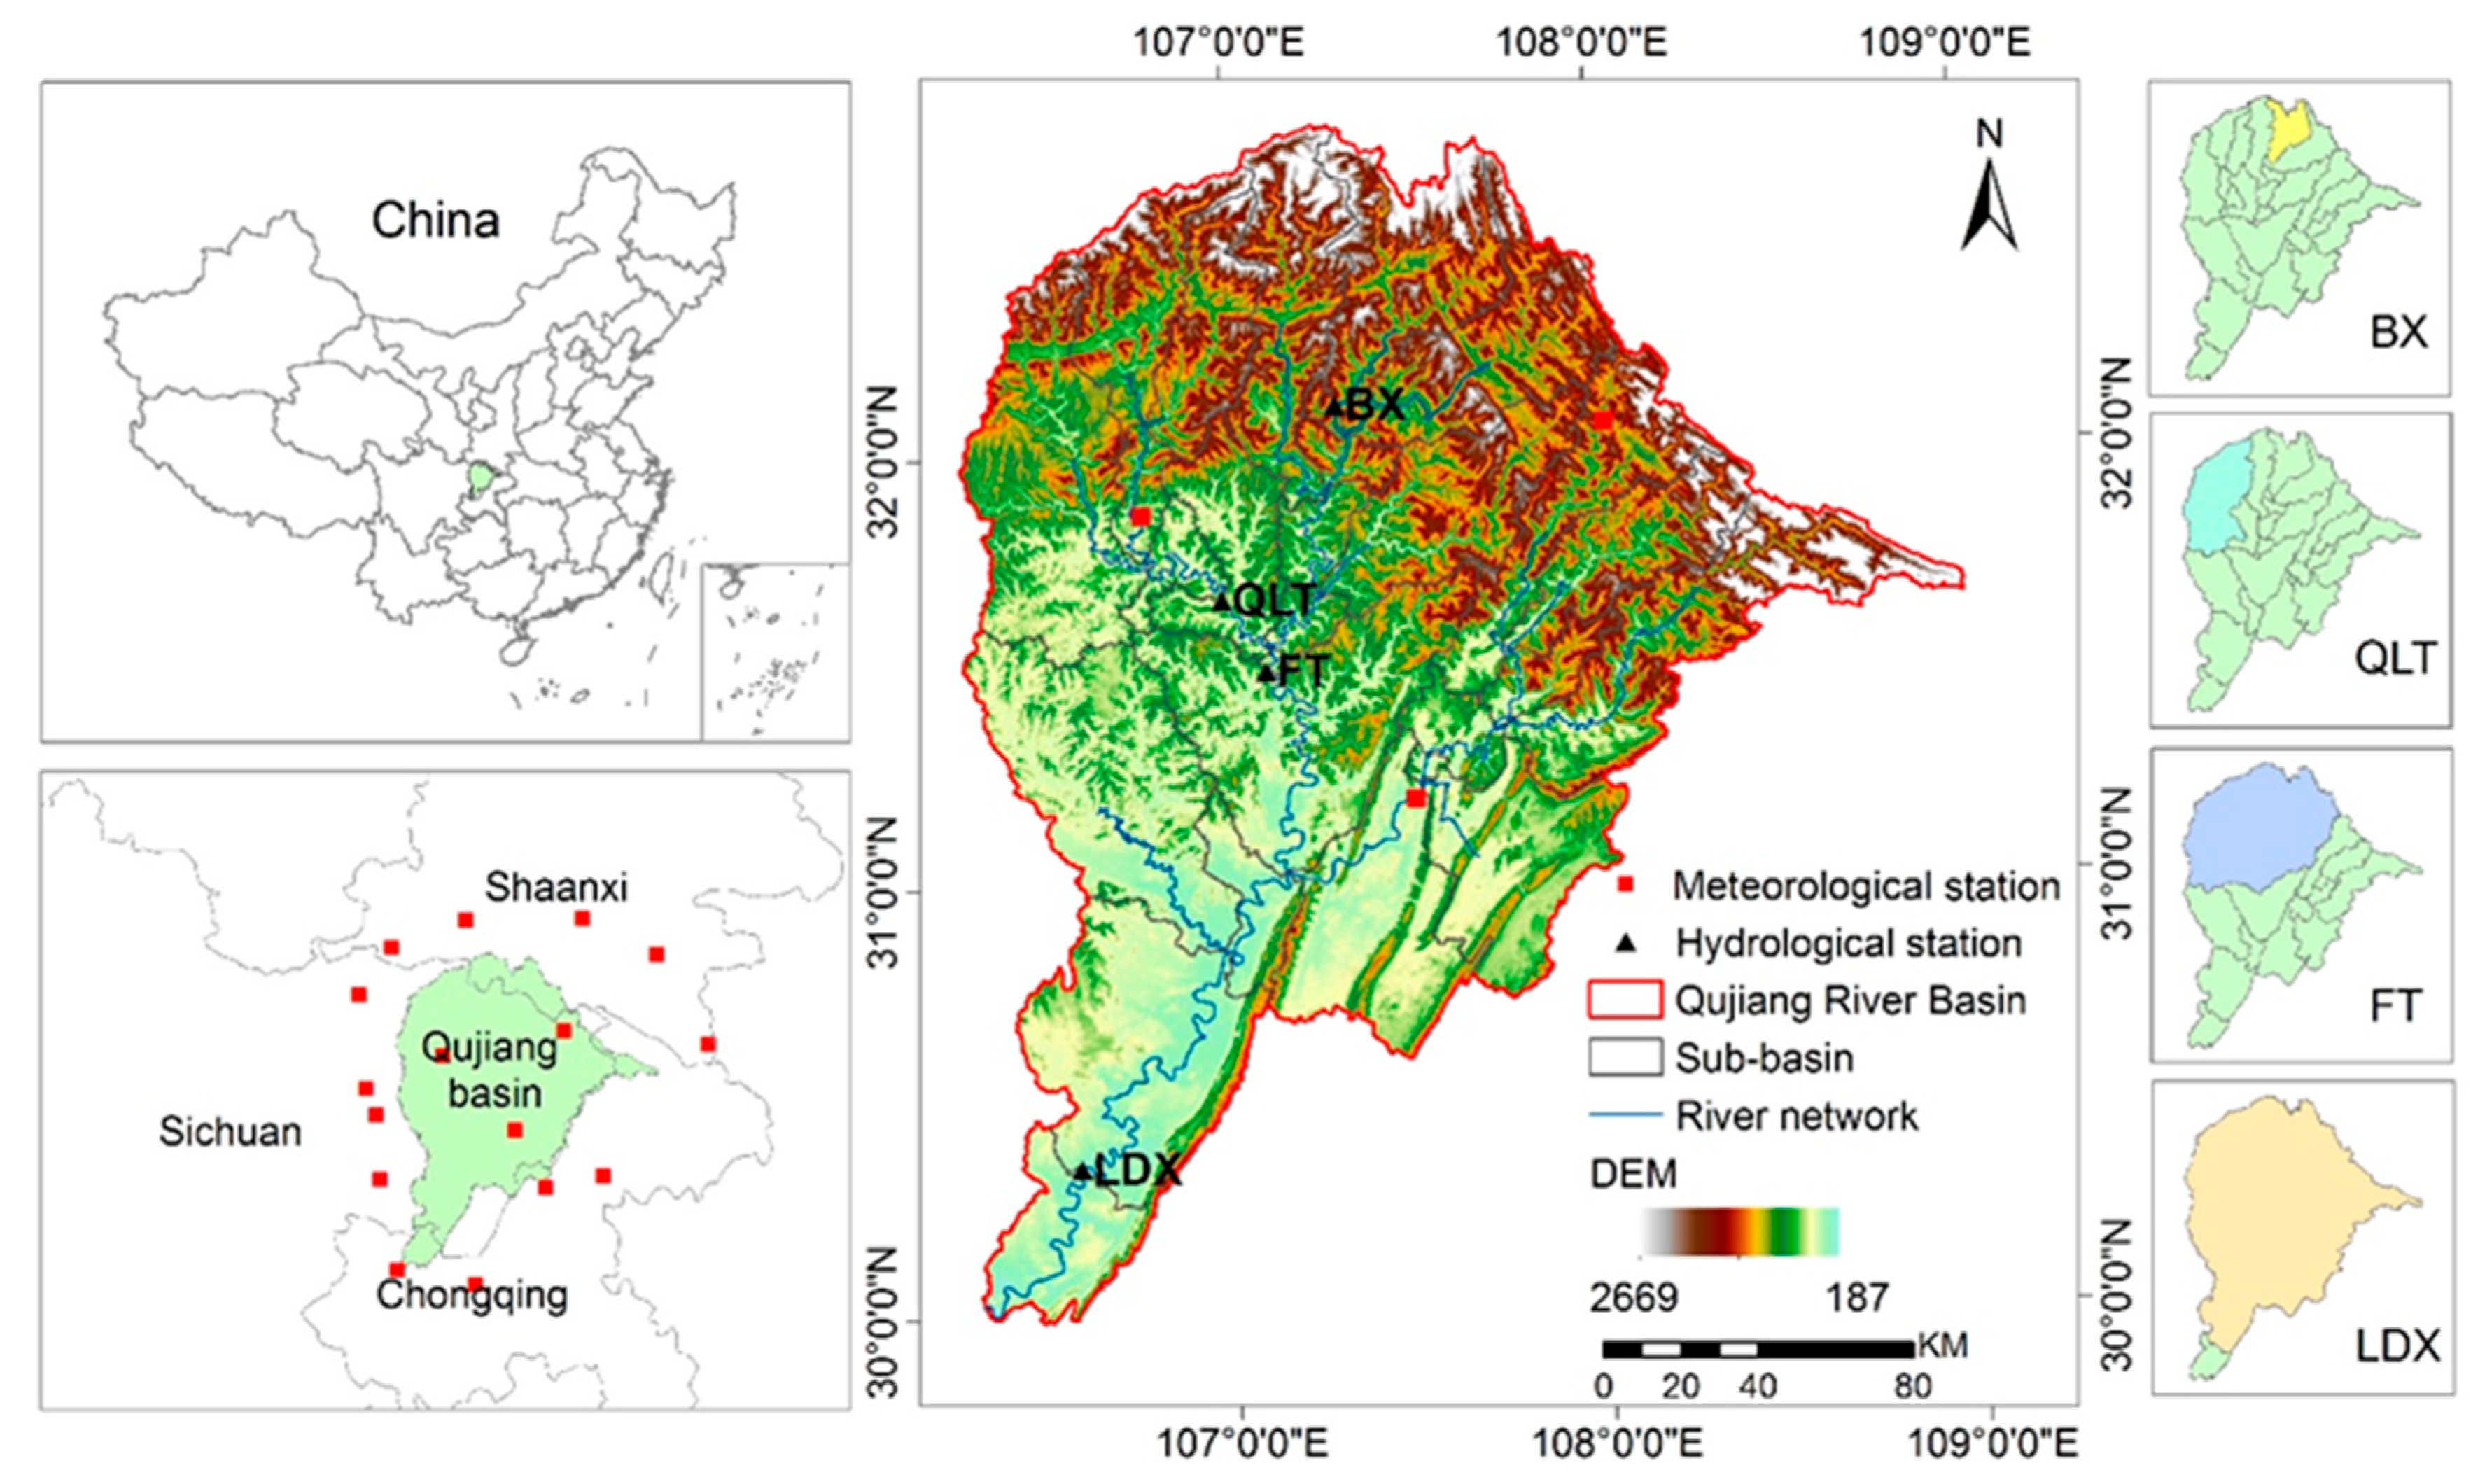
2.1. Study Area

The Qujiang River is the largest tributary on the left bank of the Jialing River, itself a tributary of the Yangtze River in China, which plays a decisive role in the development of Sichuan, Chongqing, and other provinces and cities. The location and general situation of the Qujiang River basin is shown in Figure 1. The Qujiang River basin has a total area of about 38,900 km2. This basin is mainly located to the northeast of the Sichuan Basin and is the granary of northeast Sichuan, with its main outlet located in Chongqing city. The elevation of the study area varies greatly from 2669 m in the north to 187 m in the south. The high-altitude areas are mainly concentrated in the northern border. This basin is a typical subtropical humid area. According to measured data from the meteorological stations from 1970–2015, the average annual precipitation in the basin is approximately 1193.54 mm, and the average annual temperature is approximately 16.6 °C. The precipitation from May–September accounted for about 74.63% of that for the whole year, while the precipitation from November–February accounted for only 5.79%.
In this study, four hydrological stations were selected in the upper, middle, and lower reaches of the Qujiang River basin. Among them, the Bixi (BX) station is located upstream with the largest average elevation, the Qilituo (QLT) station and the Fengtan (FT) station are located at the middle reaches, and the Luoduxi (LDX) station is located downstream near the outlet of the basin. The four sub-basin areas controlled by the four stations are 2013, 6382, 16,463, and 37,780 km2 in area. The climate characteristics of the four sub-basins are calculated using the Thiessen Polygon Method. They have very similar levels of precipitation, which are, from upstream to downstream, 1202.74, 1121.20, 1211.60, and 1199.37 mm, respectively. In terms of temperature, the BX sub-basin is slightly cooler than the other three sub-basins: the highest temperature of the BX sub-basin is 21.13 °C, while the other three sub-basins are in the range 21.43–21.51 °C; the lowest temperature of the BX sub-basin is 13.11 °C, while the remaining three sub-basins are in the range 13.62–13.78 °C.

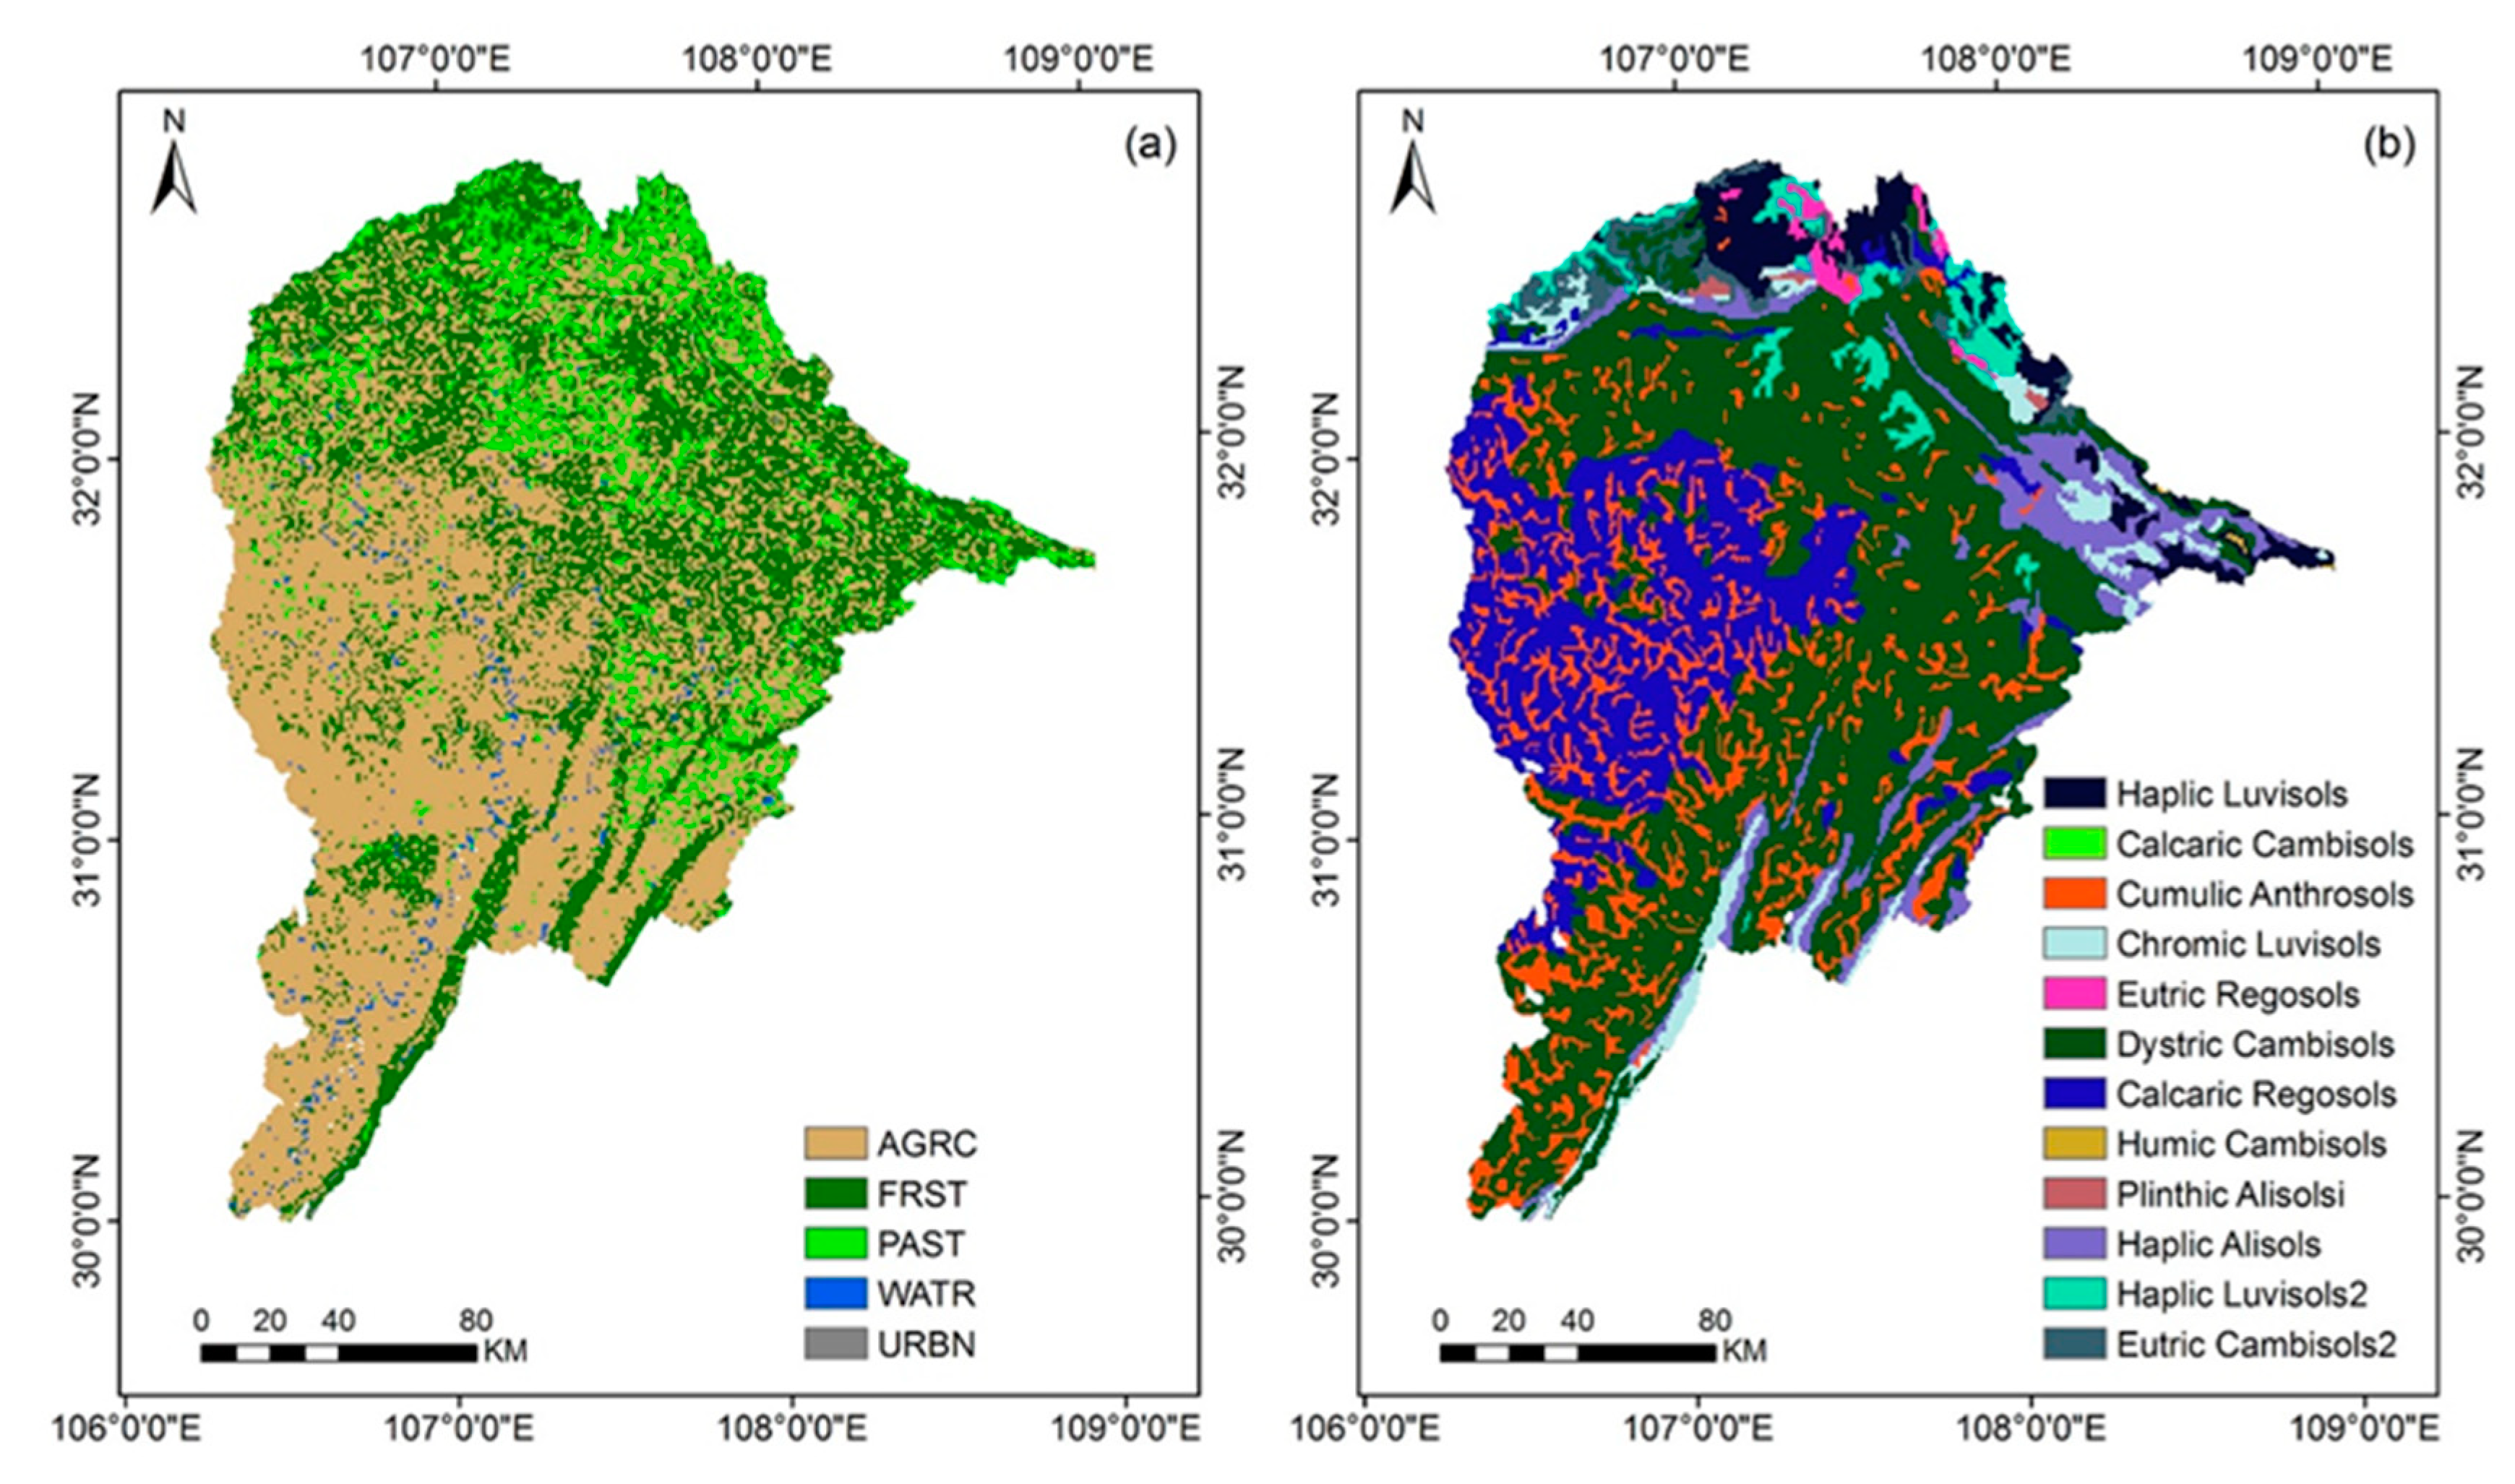
2.2. Spatial Attribute Data

The Digital Elevation Model (DEM) data used were derived from the Geospatial Data Cloud platform (http://www.gscloud.cn/), with a resolution of 30 m × 30 m. The BX sub-basin is located in the northernmost part of the entire basin, with an average elevation of 1214.83 m. The average altitude of the QLT (795.75 m), FT (896.14 m), and LDX (742.68 m) sub-basins are not significantly different and are significantly lower than the altitude of the BX sub-basin. The land use data came from the 1:1 million land use data of China in 2010 downloaded from the Resource and Environmental Data Cloud Platform (http://www.resdc.cn) with a resolution of 1 km. The types of land use in the Qujiang River basin are mainly divided into five categories (Figure 2a): cultivated land (AGRC), forest land (FRST), grassland (PAST), water (WATR), and urban land (URBN). Among them, AGRC accounts for most of the land use with 55.47% and is mainly distributed in the central and southern part of the basin; PAST accounts for 10.70% of the land use in the total area, mainly distributed in the north. In the BX sub-basin, the proportion of PAST (35.16%) is significantly higher than that of the other three sub-basins, which are dominated by AGRC. The soil data used in this study are from the China Soil Map Based Harmonized World Soil Database (v1.1) provided by the Cold and Arid Regions Sciences Data Center at Lanzhou (http://westdc.westgis.ac.cn). The soil database required by the SWAT model was established using SPAW (Soil-Plant-Air-Water) Hydrology software to calculate the relevant data. Finally, the soil in the Qujiang River basin was divided into 12 types (Figure 2b). The underlying surface properties of the whole Qujiang River Basin show obvious regional characteristics, with a large gap between high latitude and low latitude areas. This gap will affect the hydrological cycle process in the basin.

2.3. Meteorological Data

The basic information on the four precipitation products (CMADS, IMERG, TRMM, and Gauged) selected in this study are shown in Table 1. Since the observed streamflow data collected in the hydrological Yearbook are only available from 2008–2015, the meteorological data from 2008–2015 were ultimately adopted for the SWAT model. CMADS, which covers the whole of East Asia evenly, incorporates the technologies of Local Analysis and Prediction System (LAPS)/Space-Time Multiscale Analysis System (STMAS) and was constructed using bilinear interpolation, the projection of resampling modes, and the loop nesting of data [27,28]. The format of the CMADS dataset was arranged and modified according to the input driving data format of the SWAT model, so it can directly use the data set without any format conversion. TRMM 3B42 is one of the products with the highest accuracy for satellite remote sensing precipitation data; the accuracy of the V7 version has been significantly improved compared to that of the previous version [36]. IMERG is intended to intercalibrate, merge, and interpolate “all” satellite microwave precipitation estimates together with microwave (MW)-calibrated infrared (IR) satellite estimates, precipitation gauge analyses, and potentially other precipitation estimators at fine time and space scales over the entire globe [12]. The final step uses monthly gauge data to create research level products that are 3.5 months later than the observation month. The gauged meteorology data used in this study are from the China Ground Climate Data Daily Value Dataset V3.0 provided by the CMA (China Meteorological Administration), which contains 824 basic meteorology stations across China. Moreover, all the data of each element have been quality-controlled, including examining the extreme values, performing an internal consistency check, and removing questionable data [37]. Since the TRMM and IMERG data only provide precipitation data, for convenience of comparison the rest of the meteorological data adopt the data in the CMADS data set.

2.4. Climate Projection Data

The multi-model ensemble (MME), composed of five GCMs (BCC-CMS1-1, BNU-ESM, GFDL-CM3, MIROC-ESM, and NorESM1-M), is used to project future climate. The five GCMs are derived from NEX-GDDP (NASA Earth Exchange Global Daily Downscaled Projections), which is a GCM dataset containing 21 GCMs released by NASA after downscaling, providing error correction with a resolution of 0.25° × 0.25° [38] and relatively good performance in daily precipitation simulations in South China [39]. The MME includes daily precipitation and daily maximum and minimum temperature for the historical period 1950–2005, and the partly future period 2006–2100 (RCP4.5 and RCP8.5 runs). The analysis of variance of the MME and gauged rainfall data for 1986–2005 shows no significant differences in inter-annual precipitation variation (p > 0.05). Thus, we selected 2021–2040 as the future period to project the climate in the four sub-basins.

2.5. SWAT Model Construction

The SWAT model is a semi-distributed hydrological model developed by the US Department of Agricultural Research based on a series of physical mechanisms that can perform long-term sequence simulations [40,41]. At present, this model is considered to be the most promising semi-distributed hydrological model in the field of hydrological mechanisms and evolution [42]. The data required for the SWAT model include weather data, spatial attribute data, and streamflow data. The whole basin is divided into several sub-basins with independent soil types, land-use attributes, and further Hydrologic Research Units (HRUs).
The ArcSWAT 2012 version is used in the research and runs on the ArcGIS (Esri, Redlands, CA, USA)10.2 platform which created and developed by Environmental Systems Research Institute (ESRI). The Qujiang River Basin is ultimately divided into 28 sub-basins and 733 HRUs. The four hydrological stations are located at the outlets of the four sub-basins 1(BX), 12(QLT), 17(FT), and 27(LDX), and the sub-basin areas controlled by them account for 5.17%, 16.39%, 42.28%, and 97.04% of the total basin area, respectively (Figure 1). Because four different meteorological products are used in this study, four SWAT project files were created that keep the HRU division unchanged and import the processed TRMM, IMERG, CMADS, and Gauged data. The combination of the four data and SWAT modes are called the TRMM + SWAT, IMERG + SWAT, CMADS + SWAT, and Gauged + SWAT modes, respectively. The four modes are run on daily and monthly scales, with 2008 as the warm-up period, 2009–2012 as the calibration period, and 2013–2015 as the validation period.
This study uses the SUFI-2 algorithm in the SWAT-CUP software to calibrate the model. This algorithm mainly outputs the best value of each parameter, and any combination of parameters in the interval participates in the analysis of the simulation results. This study also considers the uncertainties of variables such as rainfall, observation data, and parameters, and completes comprehensive optimization through the global search method [43]. To compare the differences in streamflow simulations between various precipitation products more accurately, multi-site sequential calibration was used in the SWAT-CUP calibration model. That is, we separately calibrated the streamflow of the hydrological stations from upstream to downstream and obtained four sets of parameter values corresponding to the four hydrological stations. According to the experience of previous studies combined with the actual situation, the parameters were screened by a sensitivity analysis using the SWAT model [44]. The parameters involved are described in Table 2 (only the first ten parameters were used in the monthly scale simulation).

2.6. Performance Metrics for Precipitation and Streamflow

To quantitatively evaluate and compare the precipitation detection capacity of the three precipitation products with the gauged rainfall data from pixel-to-point, five categorical metrics are calculated, including the Proportion Correct (PC), Probability of Detection (POD), Frequency Bias Index (FBI), False Alarm Ratio (FAR), and Calibration Critical Success Index (CCSI) [23,33]. These metrics can assess the detection capability of precipitation products to estimate the probability of precipitation events (daily rainfall > 1.0 mm/day) [30]. The PC represents the accuracy of rainfall detection; POD represents the probability of rainfall detection; FBI represents the degree of overestimation or underestimation of precipitation detection; FAR represents the ratio of events falsely reported by satellite-based/reanalysis precipitation products; and CCSI combines the comprehensive features of accurate prediction, false prediction, and missing precipitation. The perfect values are 1 for PC, POD, FBI, and CCSI and 0 for FAR, respectively. The formulas of these metrics are given as follows:
PC = H + Z H + F + M + Z
POD = H H + M
FBI = H + F H + M
FAR = F F + H
CCSI = H + α H + M + F + α
α = ( H + M ) × ( H + F ) ( H + F + M + Z )
where H (Hits) is the number of rainfall events recorded simultaneously by the satellite-based/reanalysis products and gauges; F (False alarms) is the number of rainfall events recorded by the satellite-based/reanalysis products but not by the gauges; M (Misses) is the number of rainfall events recorded by the gauges but not by the satellite-based/reanalysis products; Z (Correct negatives) is the number of rainfall events not recorded by the satellite-based/reanalysis products and gauges simultaneously; and α is the correction factor for CCSI.
In addition, two performance metrics, the Root Mean Square Error (RMSE) and Percentage Bias (PBIAS), are also used to evaluate the accuracy of the precipitation of the three products compared to the Gauged data, to analyze the overall performance of the three products at a sub-basin scale. The RMSE can reflect the error intensity of the precipitation products. Since the error is squared before being averaged, the RMSE is sensitive to extreme errors. PBIAS reflects the average tendency of the precipitation products to be larger or smaller than the Gauged products. The ideal values of the RMSE and PBIAS are both 0.
To eliminate subjectivity in the performance evaluation of the hydrological model, the Nash–Sutcliffe Efficiency (NSE) [45], Coefficient of Determination (R2), and PBIAS are selected to evaluate the simulation results of the model at daily and monthly scales. Moriasi [46] noted that for the SWAT model, the simulation results can be considered satisfactory when NSE > 0.5 and PBIAS ± 25%. Moreover, the R2 varies from 0 to 1, where the larger the value is, the smaller the error dispersion of the simulation results will be. The formulas of RMSE, PBIAS, NSE, and R2 are as follows:
RMSE = 1 n i = 1 n   ( S i O i ) 2
PBIAS = i = 1 n ( S i O i ) i = 1 n O i × 100 %
NSE = 1 i = 1 n ( O i S i ) 2 i = 1 n ( O i O ¯ ) 2
R 2 = [ i = 1 n ( O i O ¯ ) × ( S i S ¯ ) ] 2 i = 1 n ( O i O ¯ ) 2 i = 1 n ( S i S ¯ ) 2
where Oi is the gauged rainfall or streamflow; Si is the precipitation product data or simulated streamflow; O ¯ is the average of the gauged rainfall or streamflow; S ¯ is the average of the precipitation product data or simulated streamflow; and n is the total number of data.

3. Results

3.1. Comparison of the Precipitation Estimation

First, we compared the precipitation estimates of the three products in the study area. The specific performance metrics of the three products relative to the Gauged products in the four sub-basins are shown in Table 3, which are the RMSE and PBIAS of the daily scale data between the three products and the Gauged data. From upstream to downstream, the RMSE of the three products decreases gradually, which indicates that the larger the sub-basin, the smaller the error. The precipitation of CMADS has the smallest RMSE among the four sub-basins, with 5.96–8.59 mm/day. The RMSE difference between TRMM and IMERG is relatively small; the closer their location is to upstream, the smaller the difference between them, which is basically the same for the BX sub-basin. Based on the PBIAS index, the precipitation of TRMM is obviously overestimated, especially in the LDX sub-basin at 17.18%, while IMERG and CMADS have different degrees of overestimation and underestimation at the four sites, with PBIAS in the range of −3.47%–1.99% and −5.41%–4.38%, respectively. Combined with RMSE, it can be seen that CMADS is better than IMERG in capturing the extreme precipitation of the four sub-basins, but its deviations in average precipitation are greater than those of the latter.
The above results show the average performance of different precipitation products in the sub-basins, while Figure 3 shows the evaluation results of the detection ability for precipitation events (daily rainfall > 1.0 mm/day). On the whole, the results of CMADS and TRMM are close, and IMERG reveals a certain gap when compared to them. For the PC, FBI, and CCSI values, the average values of CMADS in the three precipitation products are the closest to 1 (the perfect value), with 0.84, 1.07, and 0.59, respectively; the TRMM values follow with 0.82, 1.17, and 0.56, respectively; IMERG presents the worst results, with 0.75, 1.21, and 0.46, respectively. For POD, the average values of CMADS and TRMM are the same (0.7), but the variation range of CMADS (0.63 ~ 0.77) is smaller than that of TRMM (0.54 ~ 0.81), which is more stable; IMERG has the lowest value, with only 0.59. For the FAR values, the mean value of CMADS closest to 0 (the perfect value) is 0.35, TRMM follows with 0.40, while IMERG is 0.51. As can be seen from the above results, CMADS performs best and can capture precipitation events larger than 1 mm/day most accurately, while IMERG performs worse than TRMM.

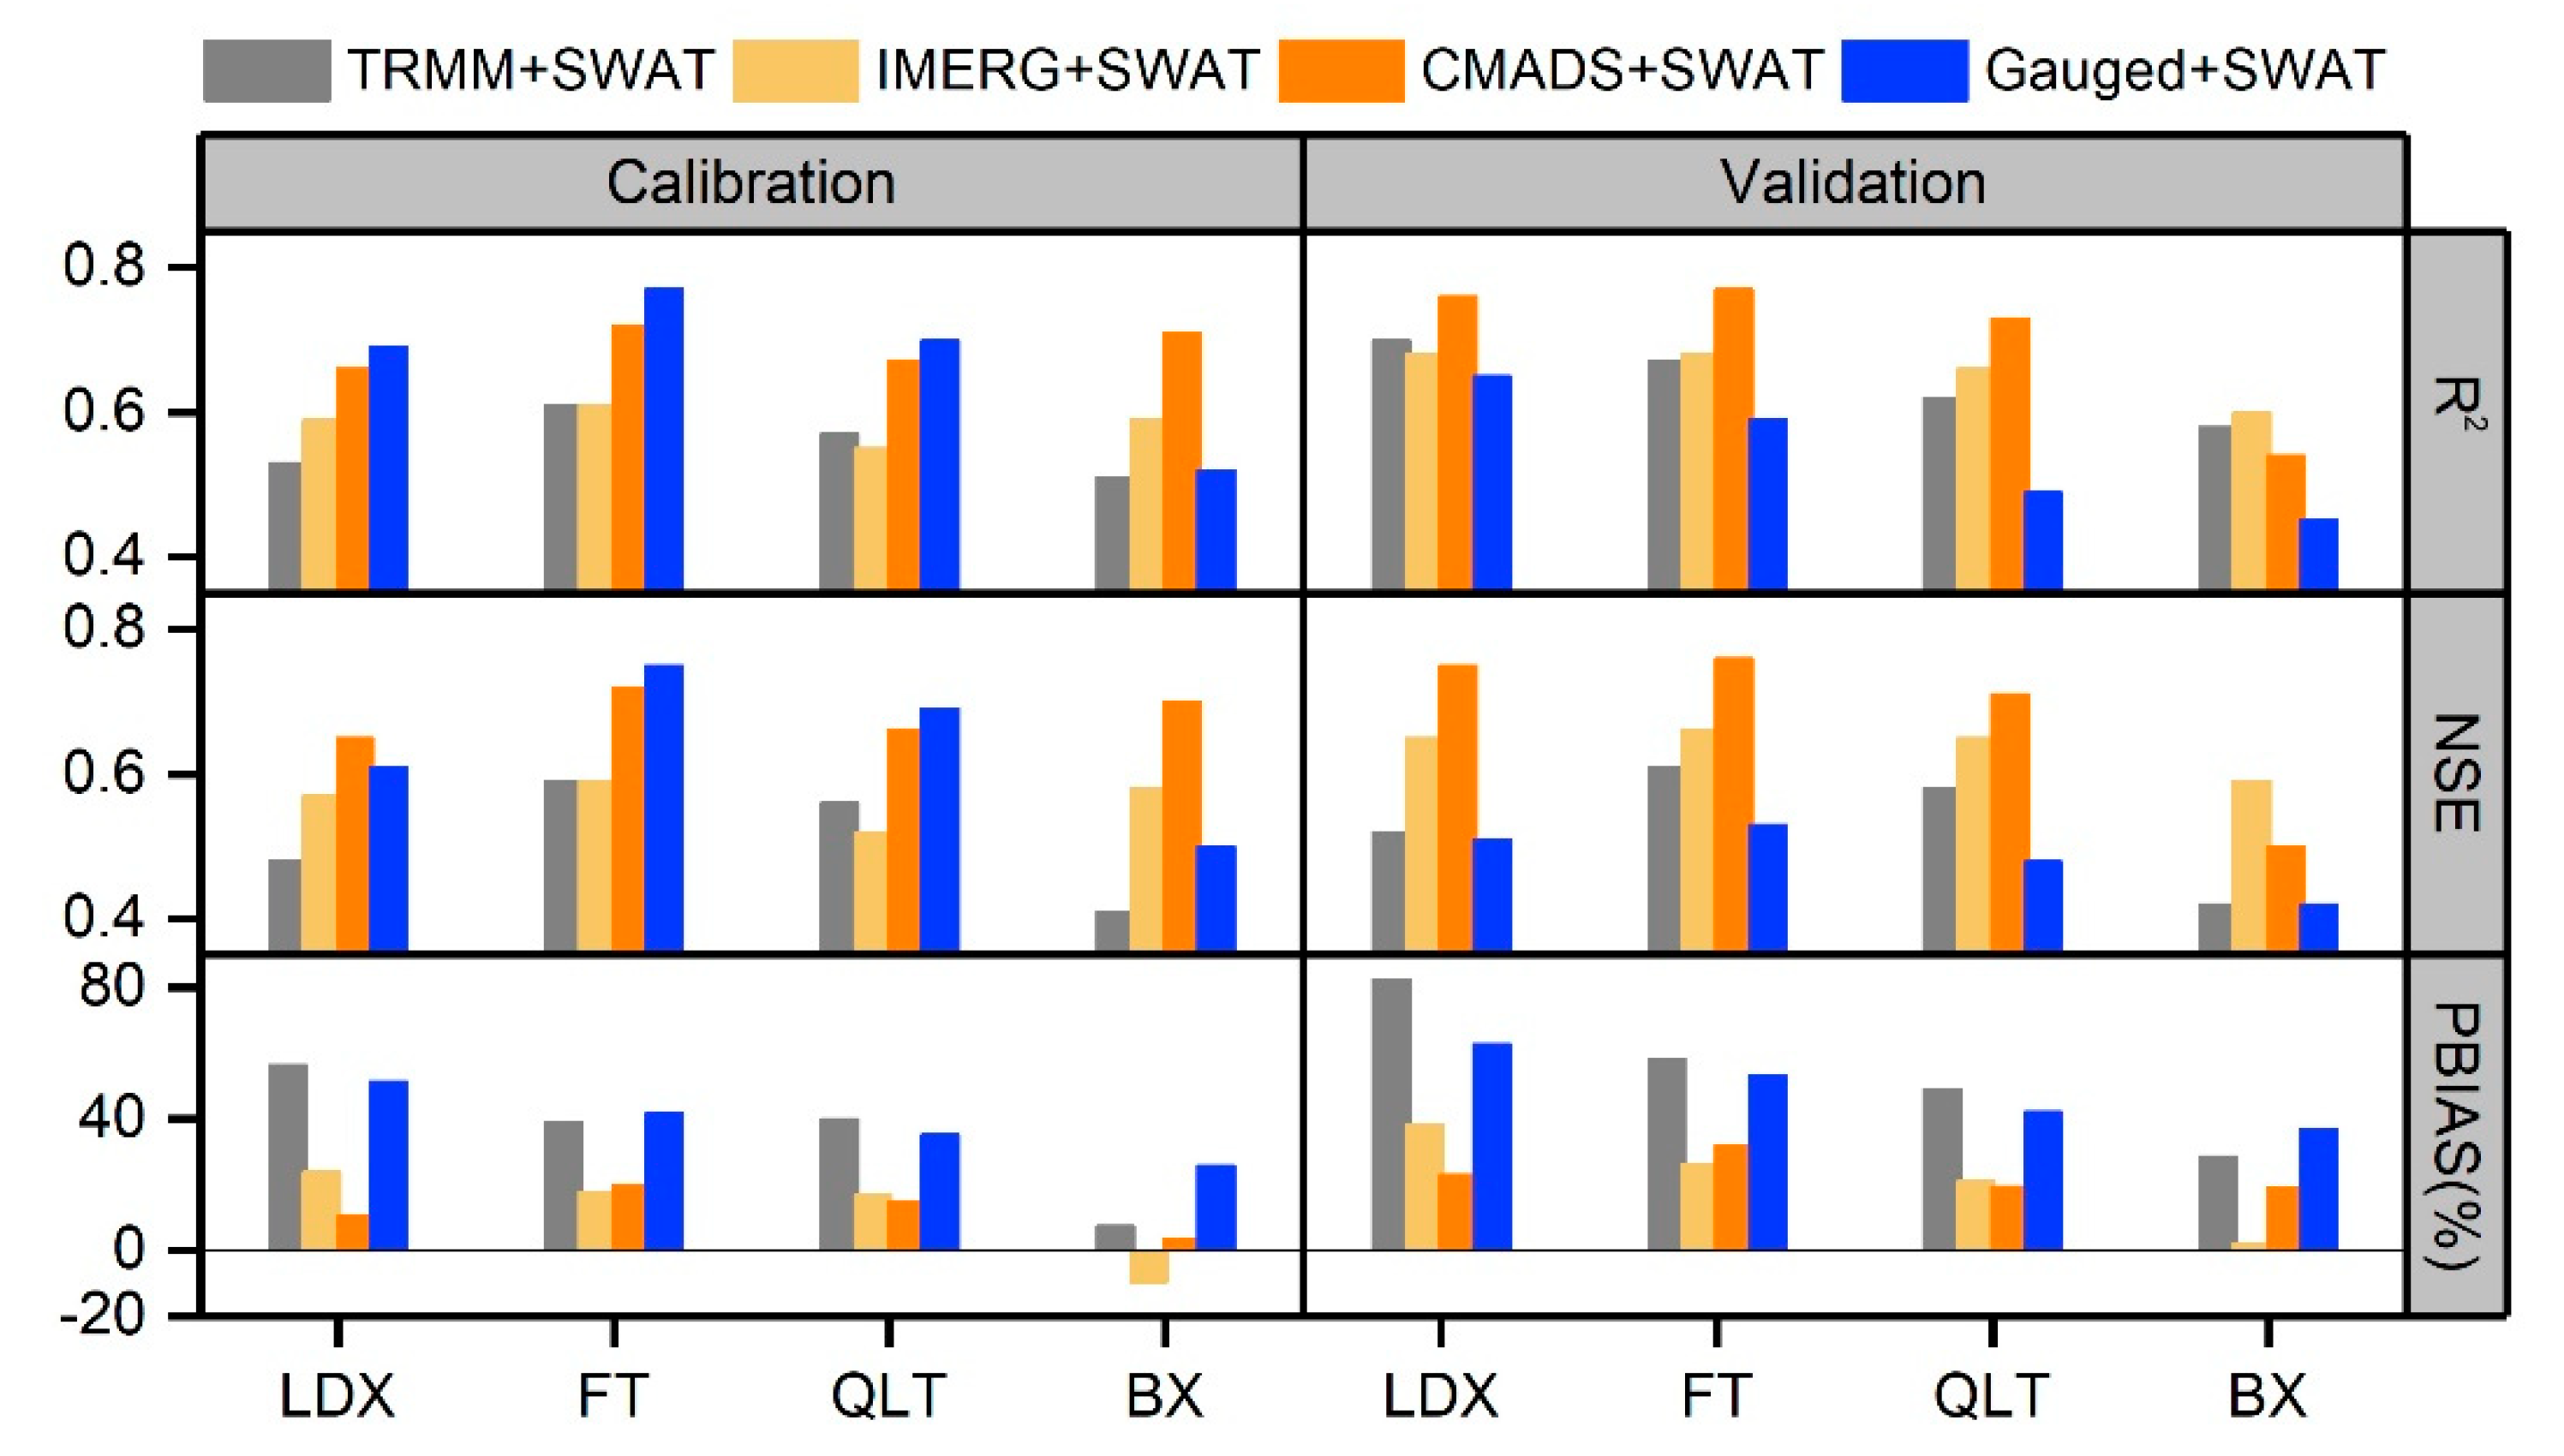
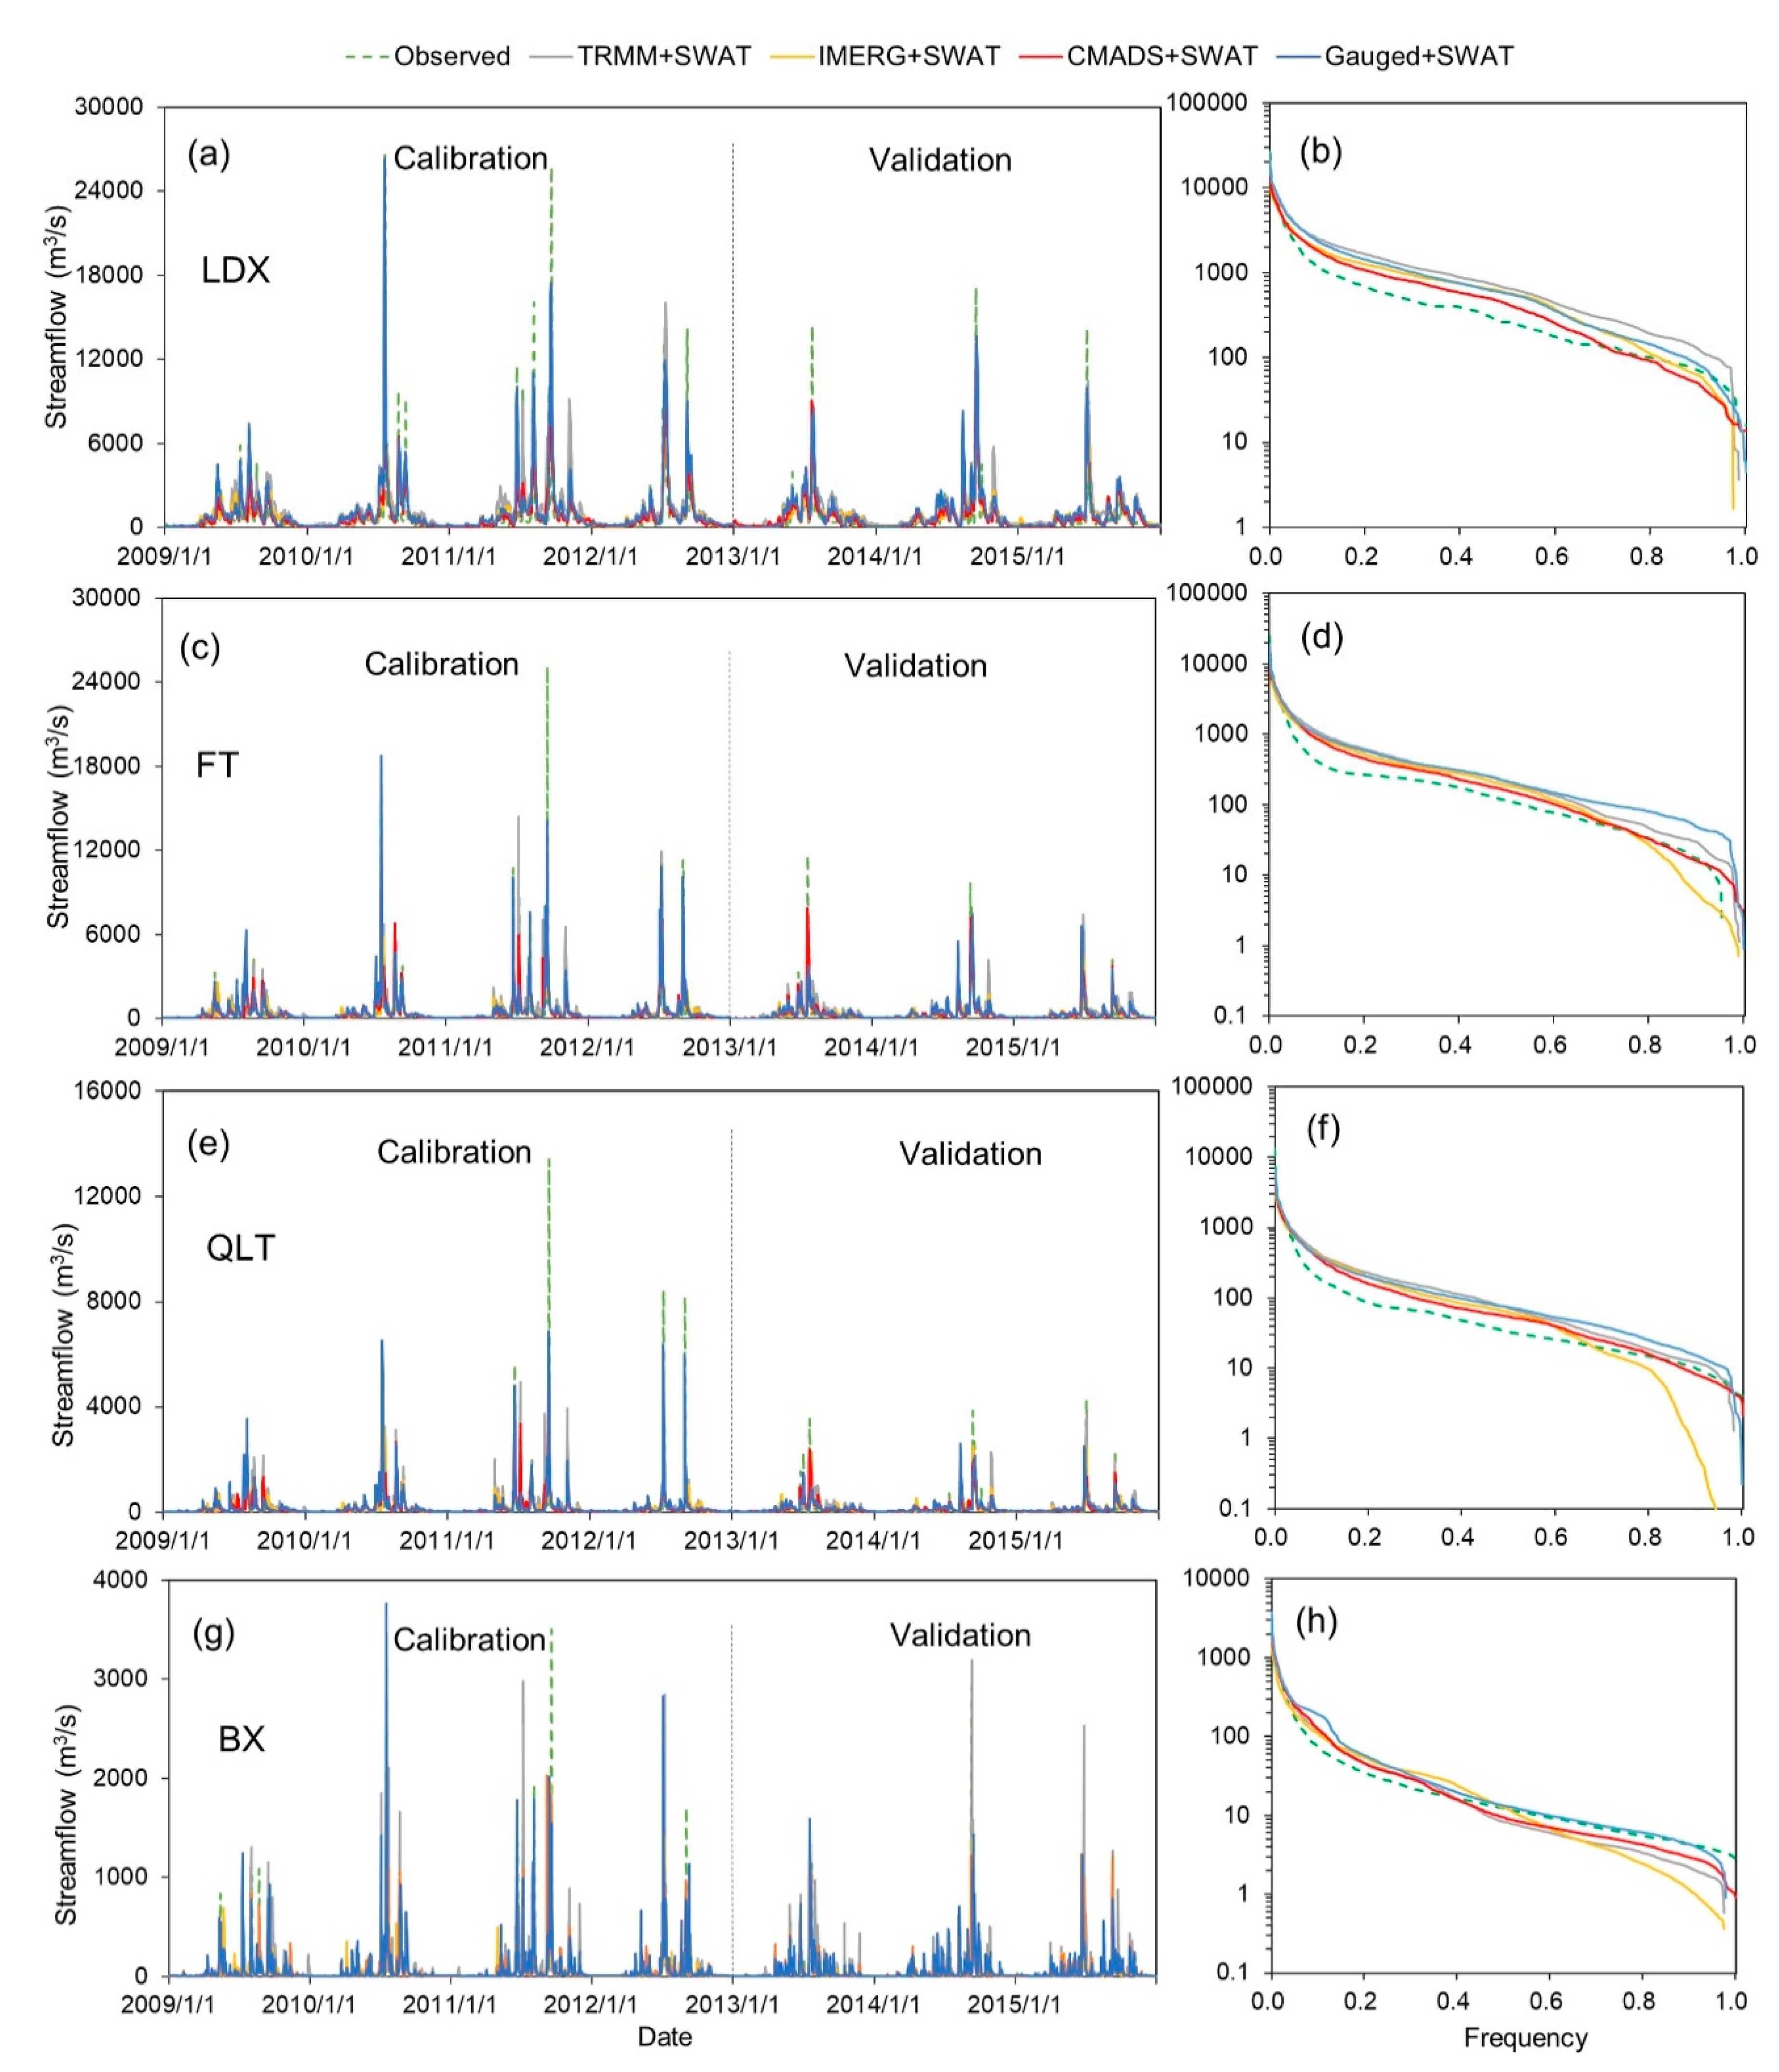
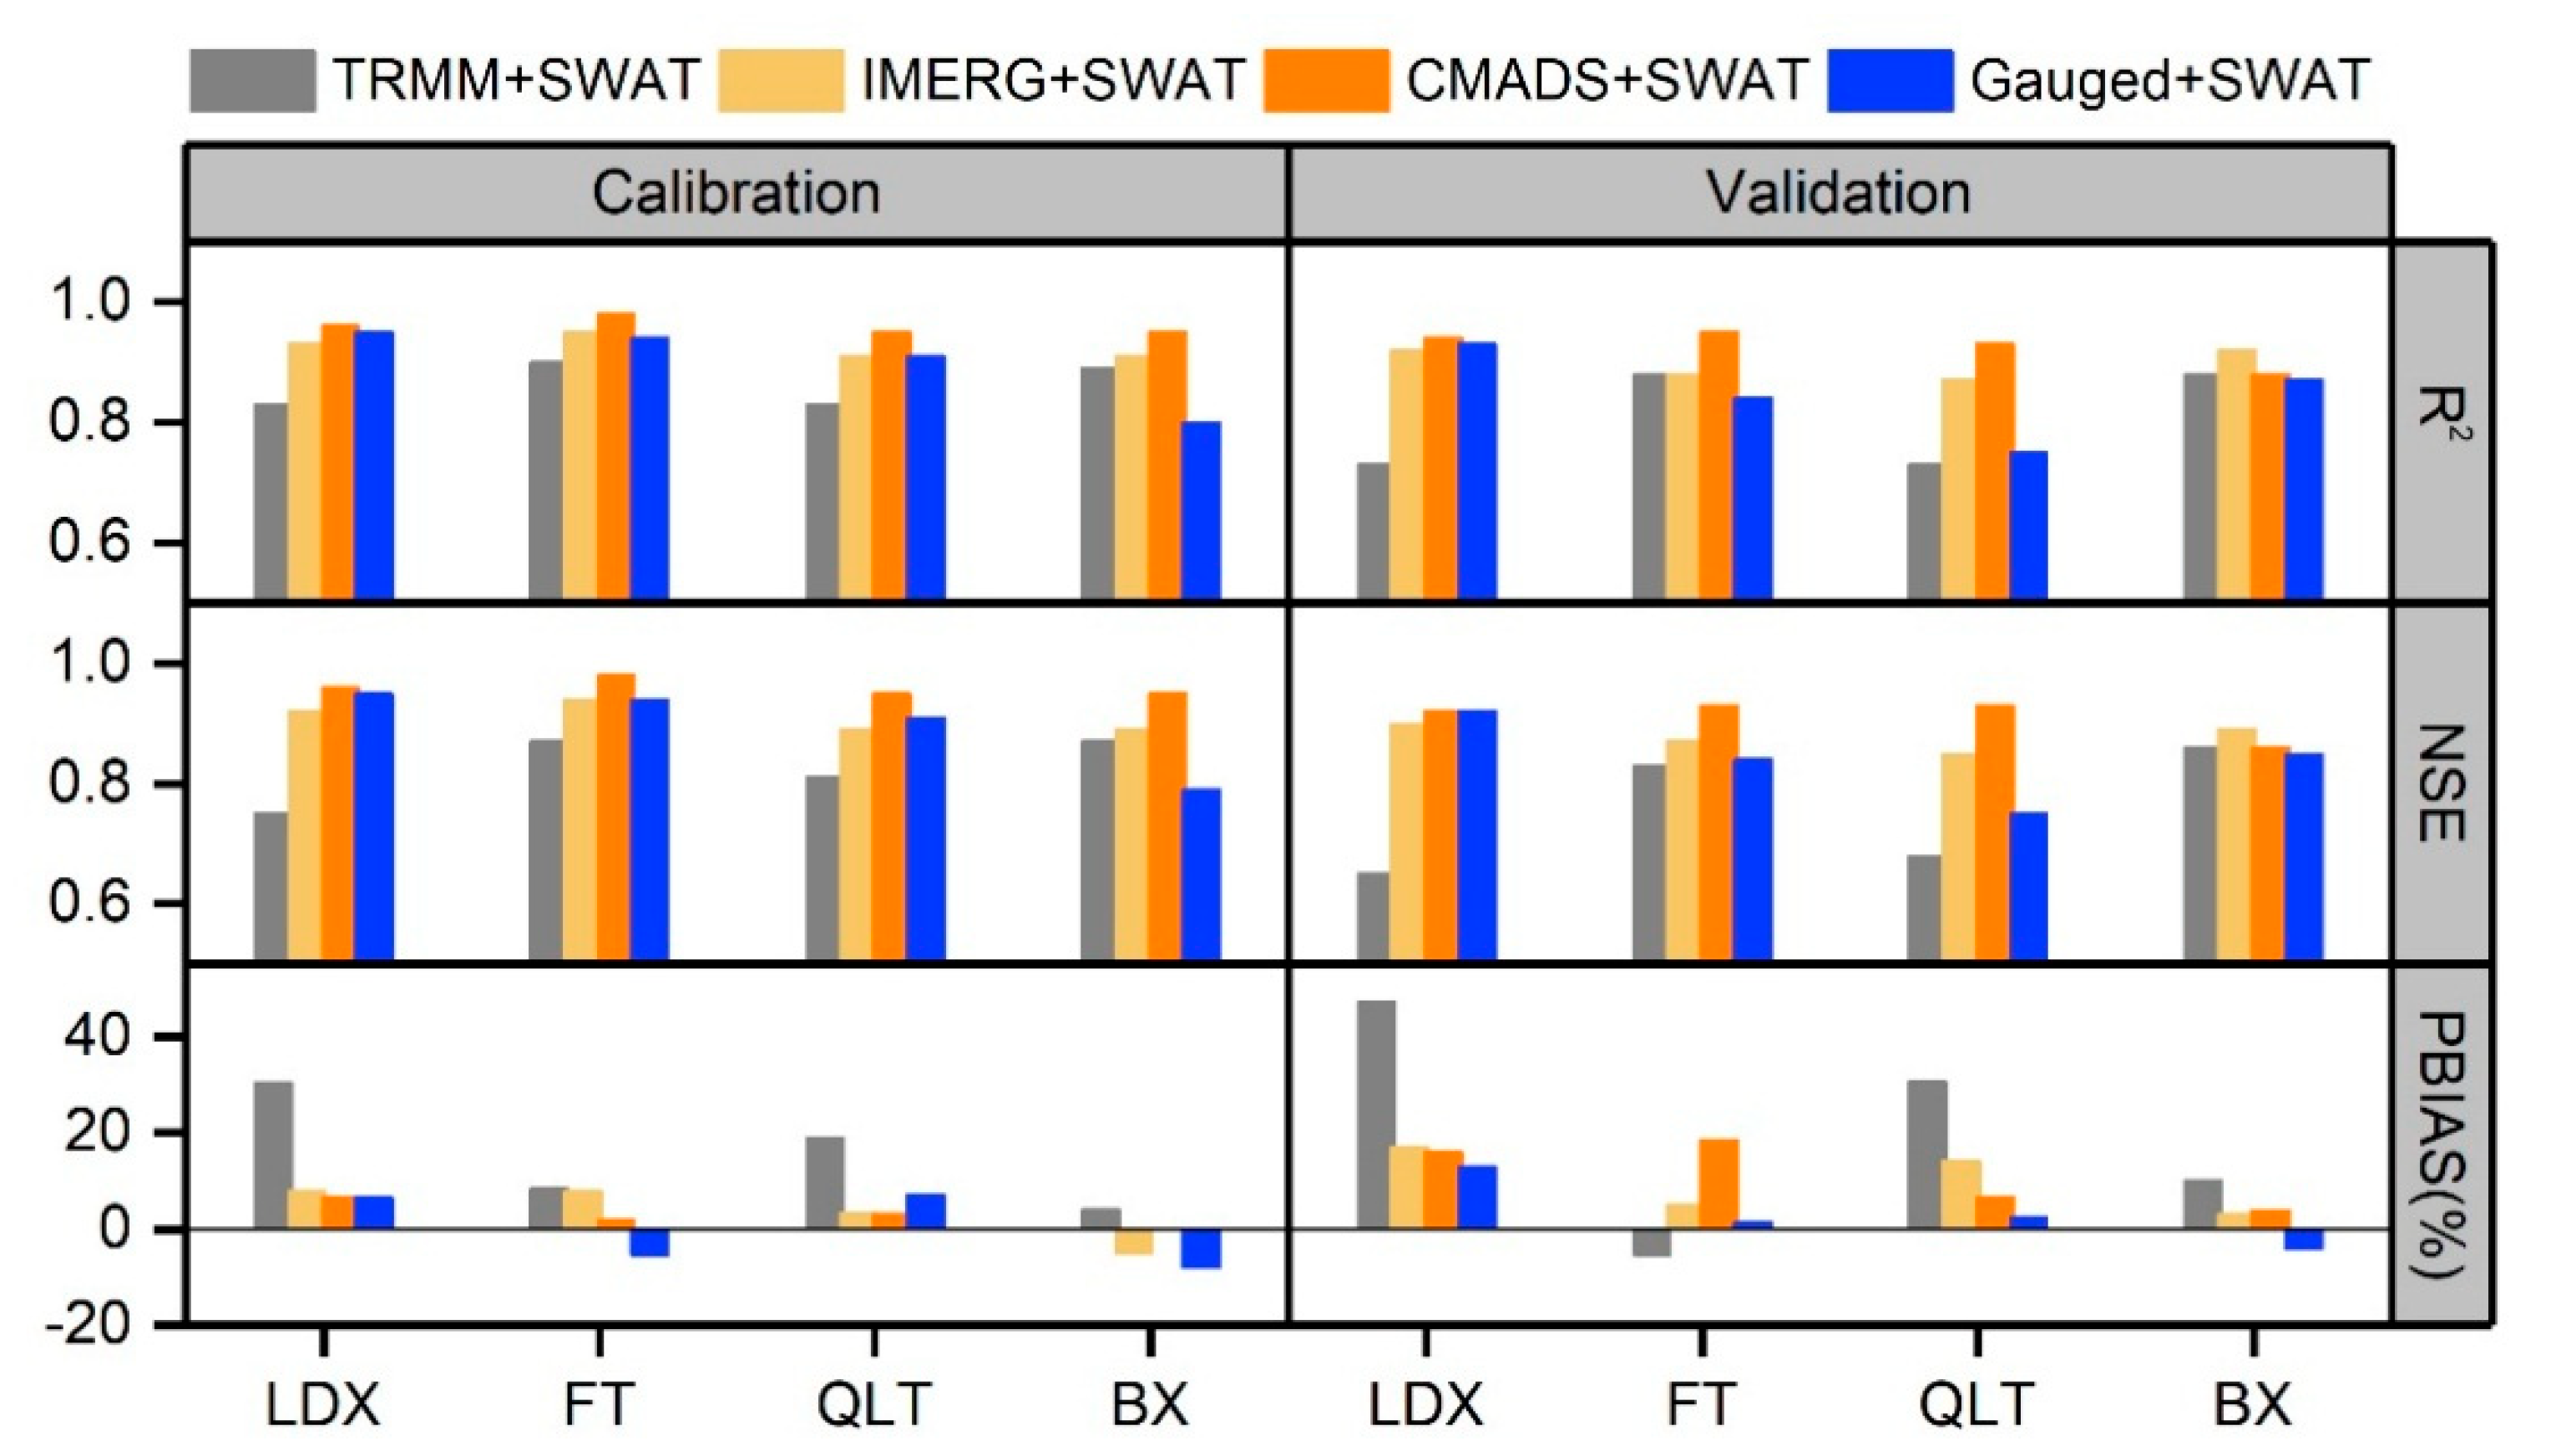
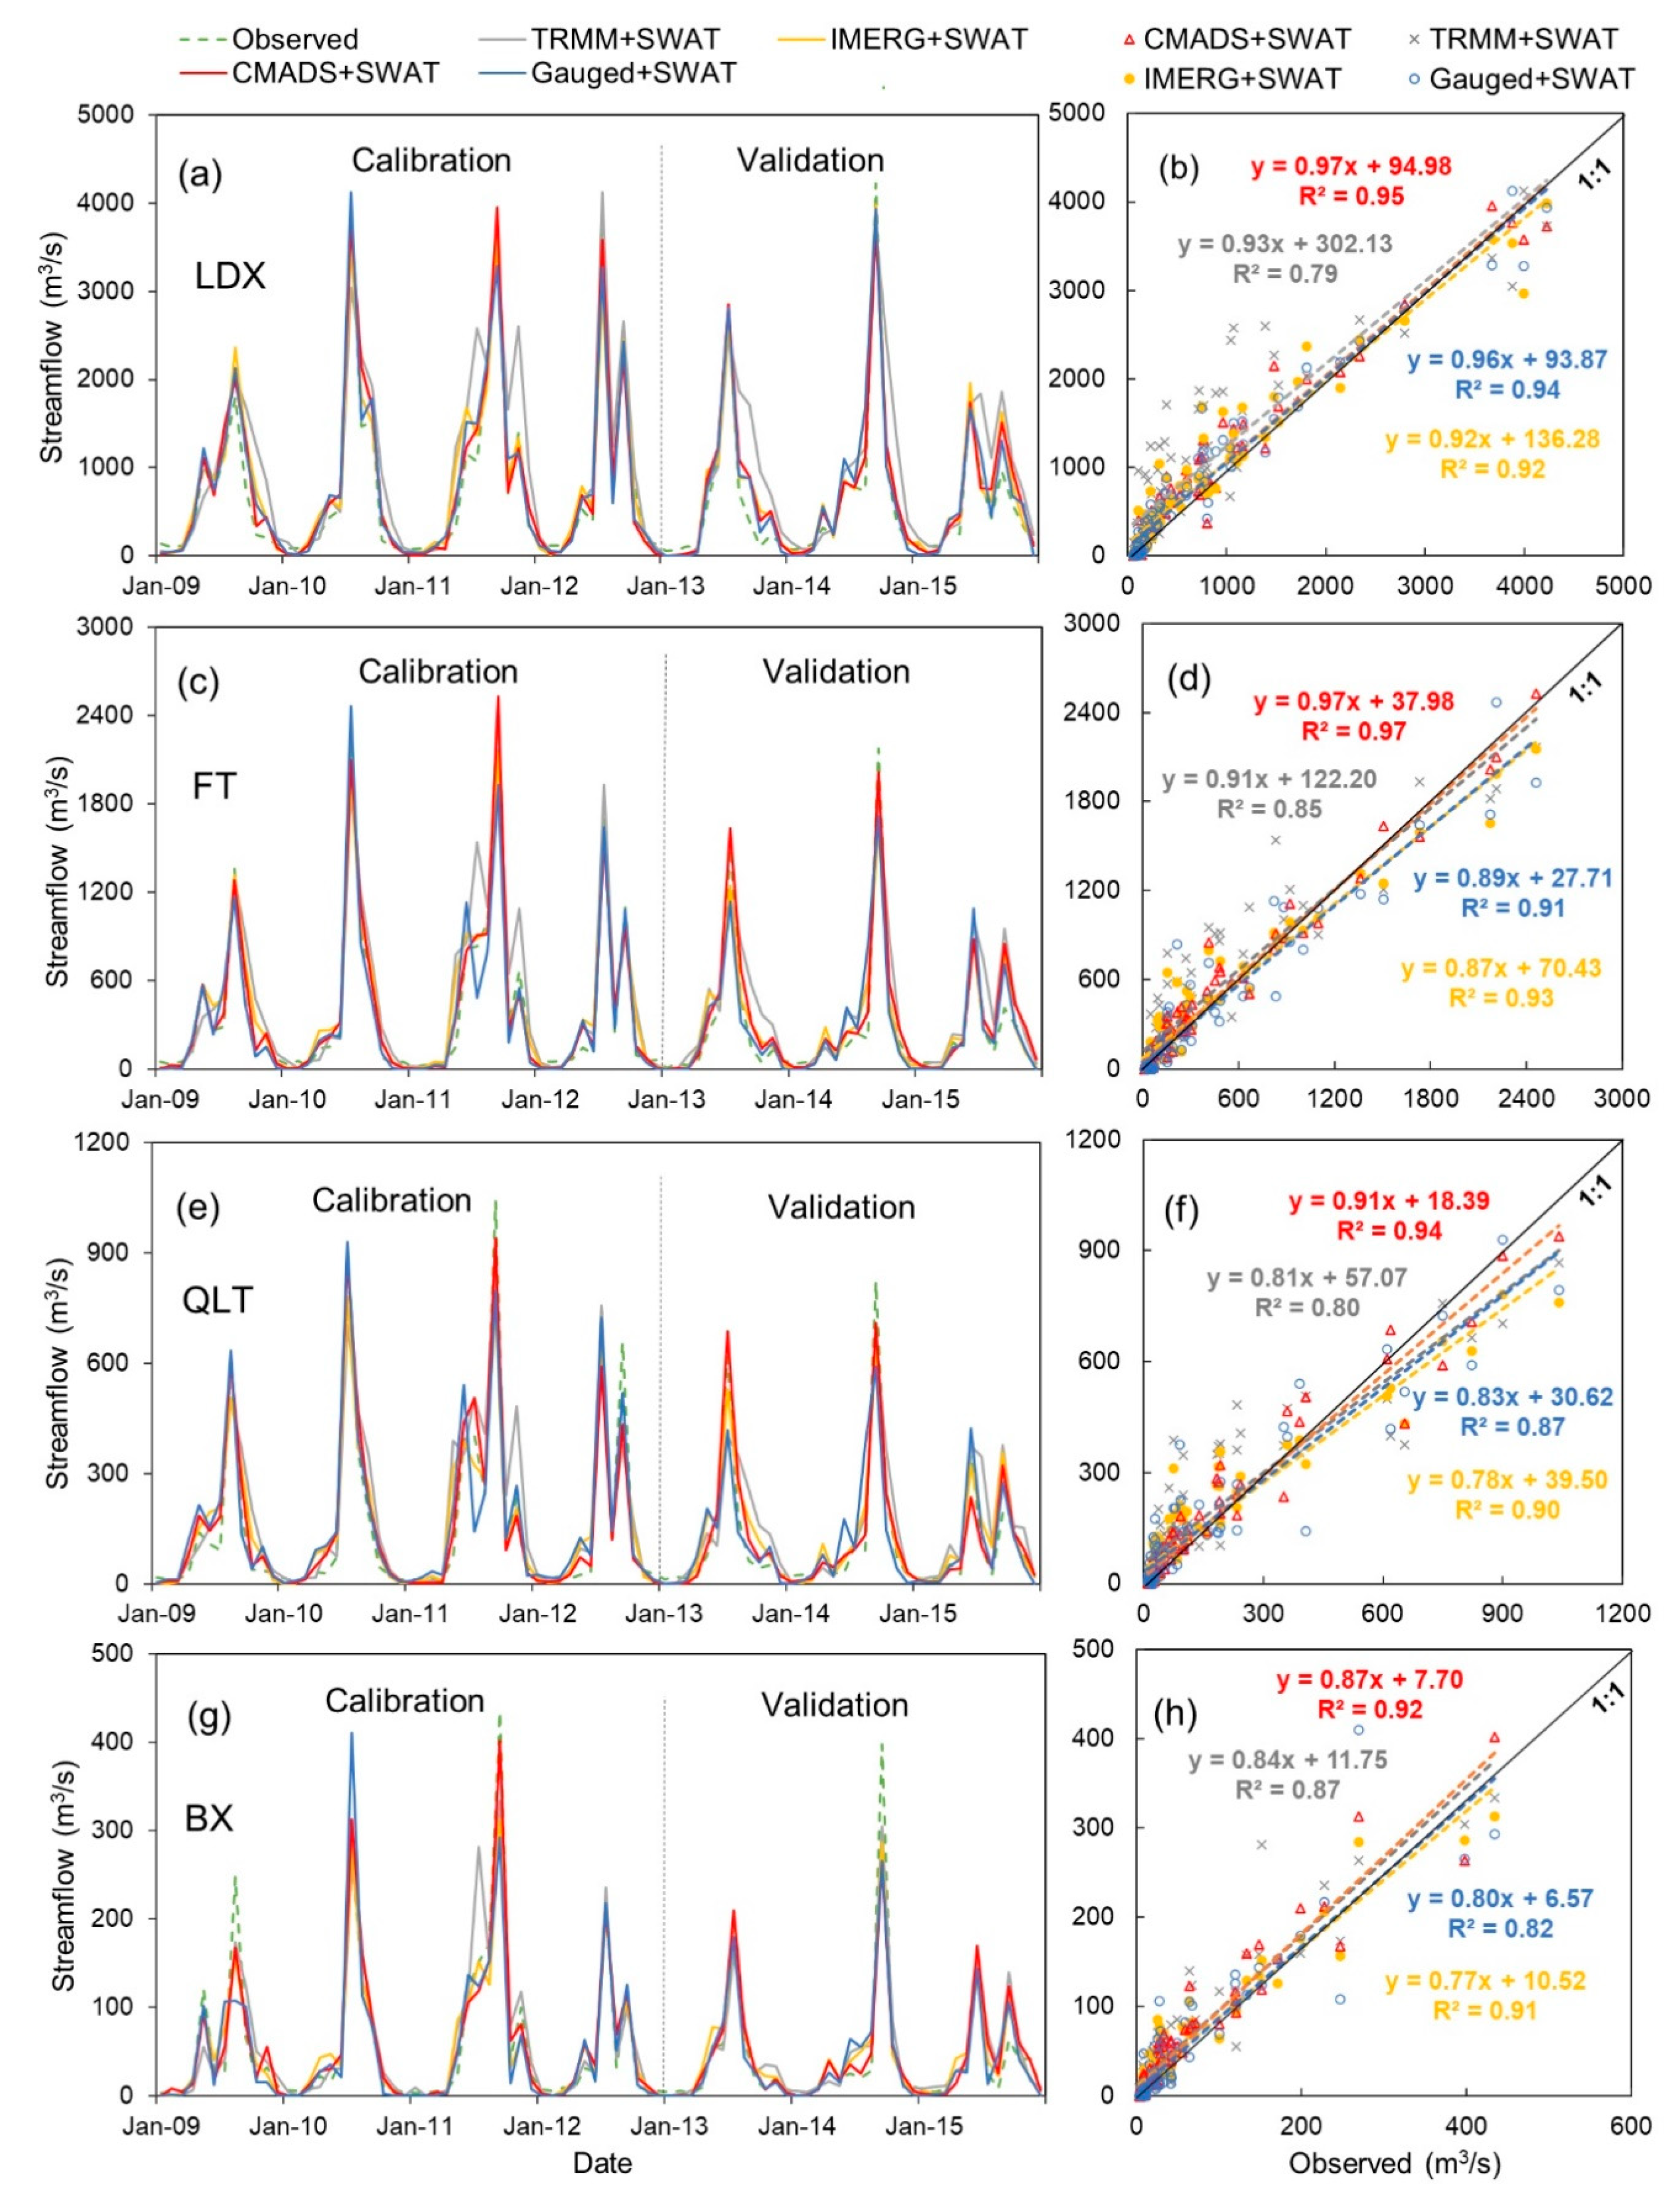
3.2. Daily Streamflow Simulation Results

The Performance metrics of the four modes in the daily scale streamflow simulation are shown in Figure 4. Overall, R2 and NSE are mostly above 0.5, while some of the results of PBIAS have excessive deviations. The performance of the four modes varies at different stations. First, we compare the results of the calibration period. In the LDX sub-basin, the NSE of CMADS + SWAT (0.65) is slightly higher than that of Gauged + SWAT (0.61), the R2 of the former (0.66) is slightly lower than that of the latter (0.69), while in PBIAS, CMADS + SWAT (11.5%) is significantly better than Gauged + SWAT (52.3%). IMERG + SWAT’s performance is moderate; its R2 and NSE are 0.59 and 0.57, respectively, and its PBIAS is satisfactory with 24.8%. The worst performer is TRMM + SWAT, whose R2 and NSE values are 0.53 and 0.50, respectively, and whose PBIAS is slightly worse than Gauged + SWAT, with 57.2%. The performance of the four modes in the QLT sub-basin is consistent with that in the FT sub-basin—that is, the R2 and NSE of Gauged + SWAT are slightly higher than than those of CMADS + SWAT, the values of TRMM + SWAT are slightly higher than those of IMERG + SWAT, and the PBIAS values of CMADS + SWAT and IMERG + SWAT are significantly better than those of TRMM + SWAT and Gauged + SWAT. The results at the BX sub-basin are obviously different than those from the other three stations. For the R2 and NSE, CMADS + SWAT is the highest, followed by IMERG + SWAT, while Gauged + SWAT is third, decreasing from about 0.7 in QLT to about 0.5, and TRMM + SWAT is the worst. Except for Gauged + SWAT, the deviations of the other three modes are also reduced, and the PBIAS is within ± 10%. Although the results of Gauged + SWAT at the three stations were satisfactory during the calibration period, the performance metrics in the validation period were obviously reduced. The other three modes showed stable performance in the validation period, similar to the results in the calibration period.
Figure 5 shows the hydrograph and streamflow frequency curves of the daily scale streamflow in the calibration and validation periods. To facilitate the hierarchical discussion, we divided the low, middle, and high streamflow portions according to the observed data and the data in Figure 5 for each sub-basin. For the LDX sub-basin, the low flow part is set to less than 100 m3/s, the middle flow part to 100–2000 m3/s, and the high flow part to more than 2000 m3/s; for the FT and QLT sub-basins, these are, respectively, less than 20 m3/s and 20–1000 m3/s and more than 1000 m3/s; for the BX sub watershed, they are, respectively, less than 10 m3/s and 10–200 m3/s and more than 200 m3/s. In the LDX sub-basin, it can be seen from Figure 5a,b that the simulated results of the four modes are lower than the observed streamflow within the low flow part, where Gauged + SWAT has the highest fitting degree of the observed value. In the middle flow part, all four modes overestimate the streamflow. TRMM + SWAT is the most overestimated, while CMADS + SWAT is the closest to the observed value, and the difference between IMERG + SWAT and Gauged + SWAT is very small. In the high flow part, Gauged + SWAT has the strongest ability to capture the maximum streamflow, followed by CMADS + SWAT. Although these models still have some errors, they are significantly superior to other modes. The performance of the four modes in QLT is also consistent with that in FT sub-basin. In the low flow part, the fitting degree between CMADS + SWAT and the observed data is the highest, IMERG + SWAT obviously underestimates, and Gauged + SWAT overestimates more than TRMM + SWAT. In the middle flow part, CMADS + SWAT is the closest to the observed values, as in the LDX sub-basin, followed by IMERG + SWAT. In the high flow part, the simulation is also similar to the LDX sub-basin. The simulation in the BX sub-basin is different from than in the other three sub-basins. The simulation results of Gauged + SWAT are the best only in the low flow part, while the middle flow part provides the most obvious overestimation. The other three modes are underestimated in the low flow part. In the high flow part, CMADS + SWAT is closest to the observed value, followed by IMERG + SWAT.

3.3. Monthly Streamflow Simulation Results

In addition to the daily streamflow, this work also compared the streamflow simulation results of the four modes at a monthly scale. Figure 6 shows the performance metrics of the four modes in the four sub-basins. As with the daily scale, we first focused on a part of the calibration period. In the LDX sub-basin, the R2 and NSE of CMADS + SWAT are the highest (0.96 and 0.94, respectively) (only 0.01 higher than those of Gauged + SWAT). The results of IMERG + SWAT are slightly lower (0.93 and 0.92, respectively), while the results of TRMM + SWAT are the worst (0.83 and 0.75, respectively). The deviation of the TRMM + SWAT results is also the largest, with a PBIAS of 31.10%, while the PBIAS values of the other three modes are only approximately 8%. The results of the four modes in the FT and QLT sub-basins are consistent—the best one is CMADS + SWAT. the R2 and NSE of IMERG + SWAT and Gauged + SWAT are basically the same and are, on average, 0.03 and 0.04 lower than those of CMADS + SWAT. The PBIAS values of the three modes are also between −5.3% and 8.4%. The performance of TRMM + SWAT is still the worst, with a lower R2 and NSE and larger deviation. In the BX sub-basin, the results of Gauged + SWAT are significantly worse than those of the other three sub-basins, which is the same as the results for the daily scale. However, unlike the daily scale, TRMM + SWAT outperforms Gauged + SWAT and is very close to IMERG + SWAT. The R2 and NSE of TRMM + SWAT and IMERG + SWAT are about 0.90 and 0.88, respectively, and the PBIAS values are about ±5%. The results of CMADS + SWAT are still the best. The R2 and NSE are 0.95 and 0.94, respectively, and the PBIAS is only 0.4%. In the validation period, except for the NSE of TRMM + SWAT in the LDX and QLT sub-basins being 0.65 and 0.68, the R2 and NSE values of the four modes in the four sub-basins are all above 0.73. Among them, CMADS + SWAT is the best in the LDX, FT, and QLT sub-basins. The performance of IMERG + SWAT is relatively stable, which is consistent with the results in the calibration period.
Figure 7 shows the hydrograph and scatter plots of the monthly streamflow simulation results for the whole simulation period. Since the performance metrics of the four modes are at a very high level, the performance on the hydrographs shows that the four groups of simulated streamflow have a very high degree of fitting with the observed streamflow. The division of the low, middle, and high flow areas of the four sub-basins is consistent with that of the daily scale. From Figure 7a–f, it can be seen that the overall performance of the four modes in the LDX, FT, and QLT sub-basins is similar. In the middle flow part, all four modes overestimate the streamflow, especially TRMM + SWAT. In the low and high flow parts, overestimation and underestimation coexist in the simulations of the four modes. On the whole, the results of CMADS + SWAT and Gauged + SWAT are closest to the 1:1 line, followed by IMERG + SWAT. However, there are differences among the four modes in different sub-basins. According to the trend line of the scatter plot, the results of CMADS + SWAT and Gauged + SWAT in the LDX sub-basin are the closest to the 1:1 line, while in the FT and QLT sub-basins, the slope and R2 values of the trend line of CMADS + SWAT are significantly higher than those in the other three modes, followed by IMERG + SWAT. In the BX sub-basin, the four modes are generally underestimated in the low and high flow parts. In the middle flow part, the results are different from those in the other three sub-basins, and the frequency of overestimation and underestimation are not very different. The slope and R2 of the trend line of the CMADS + SWAT scatter plot are the best, with more comprehensive performance.

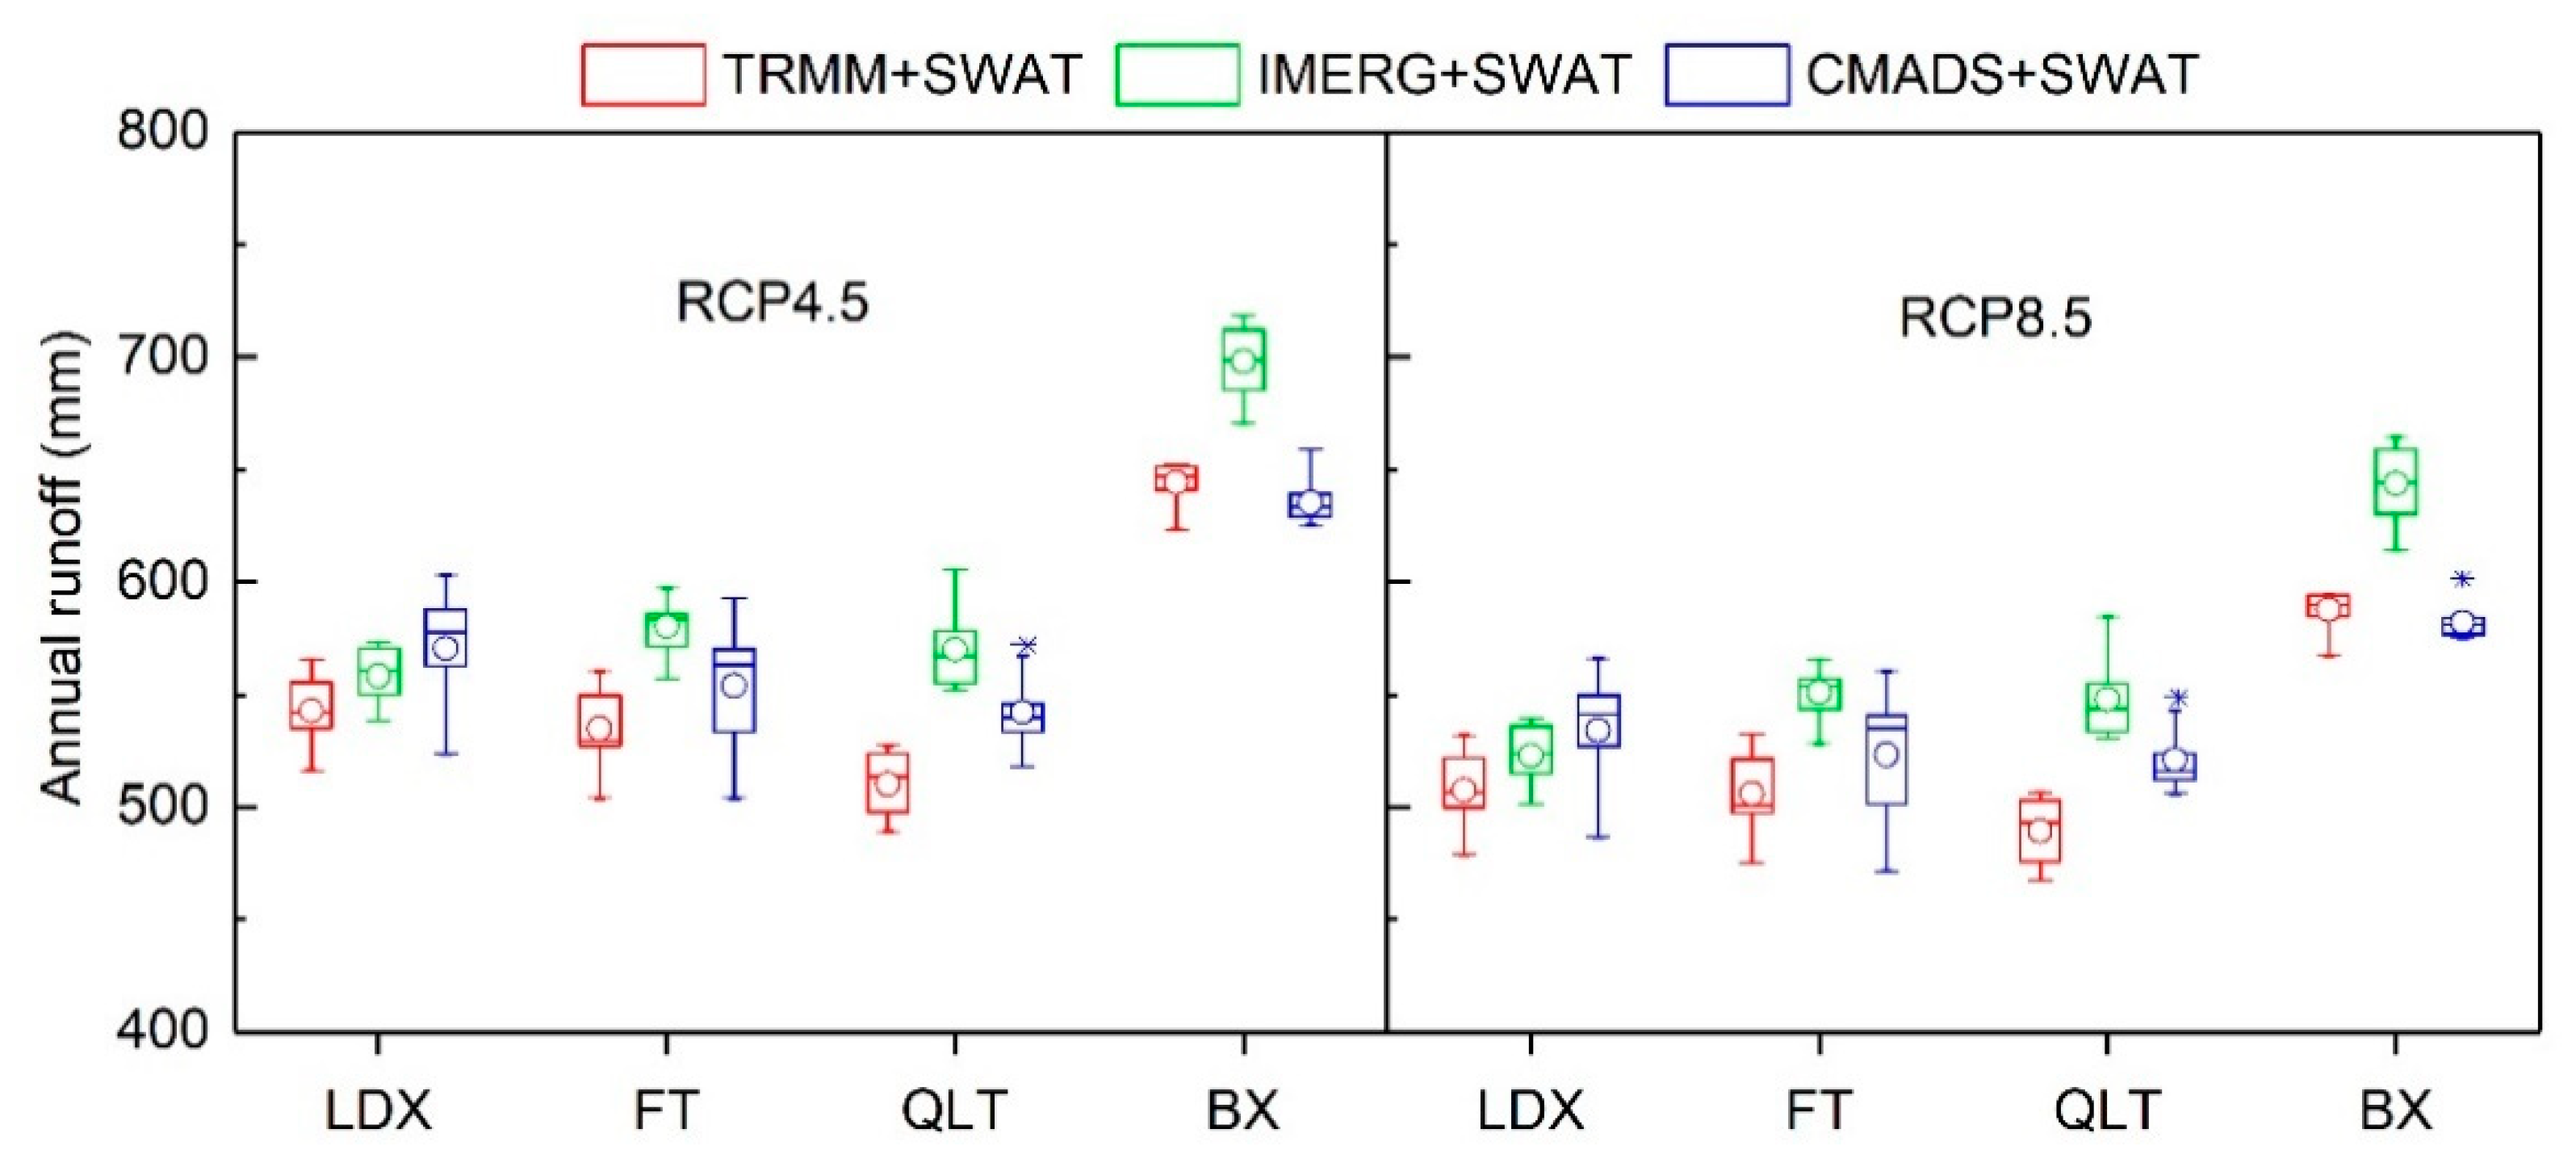
3.4. Future Runoff Projections

Among the climate factors, the variables that most significantly reflect climate change are precipitation and temperature. Therefore, this study mainly used MME data to project the temperature and maximum and minimum temperatures of the four sub-basins for 2021–2040. Their annual mean values under the scenarios of RCP4.5 and RCP8.5 are shown in Table 4. Under RCP4.5, the precipitation of the four stations will be higher than that of RCP8.5, with an average of about 30 mm, while the maximum and minimum temperatures will be opposite, with an average of about 0.27 °C and 0.23 °C (lower than that of RCP8.5), respectively. For the precipitation of the four sub-basins, it can be found that the precipitation of the LDX, FT, and QLT sub-basins will be basically the same, while the precipitation of the BX sub-basin will be slightly lower by about 20 mm. In terms of temperature, there will be no significant differences among the BX, QLT, and FT sub-basins, while the temperature in the LDX sub-basin will be lower. That is, each sub-basin has different climate characteristics.
Due to the diversity in the structures and parameters of different hydrological models, as well as the selection of GCM data and RCP scenarios, there is high uncertainty in runoff predictions under climate change [47]. In the calibration process of the hydrological model, in addition to the optimal parameters set with the highest NSE value, there are also some parameter sets whose results are almost the same, which represents the “equifinality” phenomenon. This phenomenon is one of the most important sources of uncertainty in hydrological processes under climate change [48]. Therefore, when comparing the future runoff projection results of CMADS + SWAT, IMERG + SWAT, and TRMM + SWAT, we had to account for this phenomenon. Thus, we selected ten parameter sets with the highest NSE for each model. At the same time, other climate factors, land uses, and human activities remained unchanged in 2021–2040, and the precipitation and temperature of MME under RCP4.5 and RCP8.5 are uniformly used in the three modes.
As can be seen from Figure 8, under the scenario of RCP84.5, the average runoff projection of the three models in the four sub-basins will be within 540.75–659.18 mm, which will be higher than the overall projection of 519.31–604.54 mm under RCP8.5. This is consistent with the precipitation differences between the two scenarios. Under the same scenario, the differences in runoff and the uncertainty between the three modes will be basically the same. In the LDX sub-basin, CMADS + SWAT has the highest average runoff projection results and uncertainty, and the uncertainty of CMADS + SWAT will be about twice that of IMERG + SWAT. The average runoff projection results of IMERG + SWAT will be the highest in both the FT and QLT sub-basins, followed by CMADS + SWAT, with the lowest in TRMM + SWAT. However, the uncertainty of CMADS + SWAT in the FT sub-basin is the largest, while that of IMERG + SWAT in the QLT sub-basin is the largest. Although the precipitation in the BX sub-basin will be the lowest, the runoff projection results of the three modes will be significantly higher than those of the first three sites. Among the three modes, the average runoff results of IMERG + SWAT will be still the highest, but the results of CMADS + SWAT will be lower than those of TRMM + SWAT. IMERG + SWAT has the largest uncertainty in both scenarios; the smallest uncertainty under RCP4.5 is TRMM + SWAT, while the smallest under RCP8.5 is CMADS + SWAT.

4. Discussion

In terms of precipitation estimates, although the spatial distribution of CMADS is different from that of the Gauged data, its detection capability for precipitation events larger than 1 mm/day is the strongest, and its error in the four sub-basins is relatively small, which makes it is the best among the three precipitation products. The precipitation estimation of IMERG is closer than that of TRMM with Gauged data, but its ability to detect precipitation events is slightly worse than that of the latter. While TRMM’s drawback is that it grossly overestimates precipitation, in the streamflow simulation, although the results meet the requirements, there is an obvious overestimation, especially at a daily scale. Compared to TRMM + SWAT, IMERG + SWAT can effectively reduce the overall overestimation of the simulation results, and the results of IMERG + SWAT are also closer to those of Gauged + SWAT, except for the high flow part of the daily scale streamflow. CMADS + SWAT is superior to the other three modes in both daily and monthly streamflow simulation and not only has higher R2 and NSE values and smaller deviation but also provides a more similar hydrological process line to the observed streamflow. Overall, CMADS ranks first in precipitation estimations and streamflow simulations in the study area, followed by IMERG, while TRMM is the worst. As a substitute for TRMM, IMERG has been compared to TRMM in many studies [20,21,22,23], but comparisons with CMADS are still very rare. Moreover, the comparative analysis of this study was conducted in four sub-basins, which accounted for the spatial heterogeneity within the basin and improved the accuracy of the results. Because the FT and QLT sub-basins are close in their locations and underlying surface properties, the performance of the same model in the two sub-basins was relatively consistent. In the BX sub-basin, since there are no gauged stations and the meteorological elements were calculated by the surrounding stations, the streamflow simulation results of Gauged + SWAT were not as good as those of CMADS + SWAT and IMERG + SWAT, especially at a monthly scale, which indicates that CMADS and IMERG with a high spatial and temporal resolution can compensate for the lack of gauged rainfall stations in the high-altitude region. While CMADS only covers East Asia, IMERG can provide precipitation data for the entire globe.
As the runoff projections for the future period used the same MME, the results reflect the differences between the SWAT model according to different precipitation products. The performance divergences of the three modes are different from those in the historical period. The IMERG + SWAT will obtain the highest annual average runoff projection results among the three mode, i.e., it will overestimate the surface water resources of the basin more than CMADS + SWAT. The runoff result of TRMM + SWAT was the smallest, which indicates that the dominant factor in the overestimation of the runoff simulation in the historical period is precipitation. Under the premise that the precipitation of the BX sub-basin in the future will be slightly lower than that of the other three sub-basins, the runoff of the BX sub-basin will be obviously higher than the others because the BX sub-basin is almost entirely located in a mountainous area, and the three modes all simulate the characteristic that the underlying surface conditions are more suitable for runoff generation. In addition, in terms of the uncertainty caused by the “equifinality” phenomenon, CMADS + SWAT will be the largest in LDX and FT and the smallest in QLT and BX among the three modes, while IMERG + SWAT will be the opposite. There are very few studies on prediction comparisons between different data-driven hydrological modes, so the discussion in this section could provide a reference for the selection of hydro-meteorological modes in runoff prediction.

5. Conclusions

The main purpose of this study was to compare the differences in precipitation and streamflow simulations between CMADS, TRMM, IMERG, and Gauged data at the sub-basin scale in the Qujiang river basin. Among the three precipitation products, CMADS has the strongest detection capability for gauged rainfall; the precipitation deviations of CMADS and IMERG in the four sub-basins are the smallest (within ±5%), while those of TRMM are overestimated to a large extent. In the daily and monthly streamflow simulations, CMADS + SWAT has the best performance, and the NSEs in the four sub-basins reached 0.65–0.72 and 0.86–0.97, respectively, with small deviations. Although IMERG + SWAT is not as good as CMADS + SWAT, the NSE in the daily-scale and monthly-scale simulations also reached above 0.52 and 0.85, respectively. TRMM + SWAT produced obvious overestimations in the four sub-basins, which is consistent with its performance with precipitation. Although the four sub-basins have different underlying surface properties, CMADS + SWAT and IMERG + SWAT can basically meet the needs of streamflow simulations in the basin, except for extreme streamflow simulation results at a daily scale. This indicates that CMADS can provide important basic data with high accuracy for hydrological research, especially in areas where data are scarce, and IMERG can provide acceptable precipitation data in areas similar to this study but not covered by CMADS. At the same time, this research can help determine whether IMERG can completely substitute TRMM.
In addition, when using MME data to drive the three calibrated modes (CMADS + SWAT, IMERG + SWAT, and TRMM + SWAT) to project future runoff, the results of all three modes in RCP4.5 will be higher than those of RCP8.5 in the four sub-basins, which is consistent with the precipitation results. Further, the uncertainty caused by the “equifinality” phenomenon of the three modes is largely the same under the two future scenarios. However, the differences between the three modes are different from those in the historical period. IMERG + SWAT has the highest annual average runoff projection results in four sub-basins, except in the LDX sub-basin, and the uncertainty of TRMM + SWAT will be more stable. Moreover, CMADS + SWAT will be larger in the middle and lower reaches and vice-versa for IMERG + SWAT. This part of the work can provide some guidance for future studies on the influence of hydro-meteorological modes and parameter optimization on runoff projection. Because the study area is a typical subtropical humid climate region, and the performance of different meteorological products will change under different climatic regions, comparative study of CMADS, IMERG, and TRMM in the future will need to be carried out in other climate regions, such as semi-arid areas. At the same time, research in non-mountainous areas will help understand the difference between the three meteorological products.

Author Contributions

Data curation, Y.S. and X.M.; Formal analysis, Y.S.; Methodology, Y.S.; Project administration, J.Z.; Supervision, J.Z.; Validation, Y.S., Y.Z., Y.L. and Y.C.; Writing—original draft, Y.S.; Writing—review & editing, Y.S. and J.Z. All authors have read and agreed to the published version of the manuscript.

Funding

This research was funded by the National Key R&D Program of China (2017YFC0406004) and NSFC (41271004).

Conflicts of Interest

The authors declare no conflict of interest.

References

  1. Yang, D.; Xu, Z.; Li, Z.; Yuan, X.; Wang, L.; Miao, C.; Tian, F.; Tian, L.; Long, D.; Tang, Q.; et al. Progress and prospect of hydrological sciences. Prog. Geogr. 2018, 37, 36–45. [Google Scholar]
  2. Michaelides, S.; Levizzani, V.; Anagnostou, E.; Bauer, P.; Kasparis, T.; Lane, J.E. Precipitation: Measurement, remote sensing, climatology and modeling. Atmos. Res. 2009, 94, 512–533. [Google Scholar] [CrossRef]
  3. Mishra, A.K. Effect of rain gauge density over the accuracy of rainfall: A case study over Bangalore, India. Springerplus 2013, 2, 311. [Google Scholar] [CrossRef] [PubMed] [Green Version]
  4. Conti, F.L.; Hsu, K.L.; Noto, L.V.; Sorooshian, S. Evaluation and comparison of satellite precipitation estimates with reference to a local area in the Mediterranean Sea. Atmos. Res. 2014, 138, 189–204. [Google Scholar] [CrossRef] [Green Version]
  5. Gao, X.; Zhu, Q.; Yang, Z.; Wang, H. Evaluation and hydrological application of CMADS against TRMM 3B42V7, PERSIANN-CSR, NCEP-CFSR, and gauge-based datasets in Xiang River Basin of China. Water 2018, 10, 1225. [Google Scholar] [CrossRef] [Green Version]
  6. Seyyedi, H.; Anagnostou, E.N.; Beighley, E.; Mccollum, J. Hydrologic evaluation of satellite and reanalysis precipitation datasets over a mid-latitude basin. Atmos. Res. 2015, 164–165, 37–48. [Google Scholar] [CrossRef]
  7. Zhu, Q.; Xuan, W.D.; Liu, L.; Xu, Y.P. Evaluation and hydrological application of precipitation estimates derived from PERSIANN-CDR, TRMM 3B42V7, and NCEPCFSR over humid regions in China. Hydrol. Process. 2016, 30, 3061–3083. [Google Scholar] [CrossRef]
  8. Wang, Z.; Zhong, R.; Lai, C.; Chen, J. Evaluation of the GPM IMERG satellite-based precipitation products and the hydrological utility. Atmos. Res. 2017, 196, 151–163. [Google Scholar] [CrossRef]
  9. Zhong, R.; Chen, X.; Lai, C.; Wang, Z.; Lian, Y.; Yu, H.; Wu, X. Drought monitoring utility of satellite-based precipitation products across mainland China. J. Hydrol. 2019, 568, 343–359. [Google Scholar] [CrossRef]
  10. Huffman, G.J.; Bolvin, D.T.; Nelkin, E.J.; Wolff, D.B.; Adler, R.F.; Gu, G.; Hong, Y.; Bowman, K.P.; Stocker, E.F. The TRMM multisatellite precipitation analysis (TMPA): Quasi-global, multiyear, combined-sensor precipitation estimates at fine scales. J. Hydrometeorol. 2007, 8, 38–55. [Google Scholar] [CrossRef]
  11. Joyce, R.J.; Janowiak, J.E.; Arkin, P.A.; Xie, P. CMORPH: A Method that Produces Global Precipitation Estimates from Passive Microwave and Infrared Data at High Spatial and Temporal Resolution. J. Hydrometeorol. 2004, 5, 487–503. [Google Scholar] [CrossRef]
  12. Huffman, G.J. The Transition in Multi-Satellite Products from TRMM to GPM (TMPA to IMERG). Available online: https://gpm.nasa.gov/sites/default/files/document_files/TMPA-to-IMERG_transition_191101.pdf. (accessed on 24 March 2020).
  13. Darand, M.; Amanollahi, J.; Zandkarimi, S. Evaluation of the performance of trmm multi-satellite precipitation analysis (TMPA) estimation over Iran. Atmos. Res. 2017, 190, 121–127. [Google Scholar] [CrossRef]
  14. Li, Y.; Guo, B.; Wang, K.; Wu, G.; Shi, C. Performance of TRMM Product in Quantifying Frequency and Intensity of Precipitation during Daytime and Nighttime across China. Remote Sens. 2020, 12, 740. [Google Scholar] [CrossRef] [Green Version]
  15. Sorooshian, S.; Aghakouchak, A.; Arkin, P.; Eylander, J.; Foufoulageorgiou, E.; Harmon, R.; Hendrickx, J.M.H.; Imam, B.; Kuligowski, R.; Skahill, B. Advanced Concepts on Remote Sensing of Precipitation at Multiple Scales. Bull. Am. Meteorol. Soc. 2011, 92, 1353–1357. [Google Scholar] [CrossRef]
  16. Meng, J.; Li, L.; Hao, Z.; Wang, J.; Shao, Q. Suitability of TRMM satellite rainfall in driving a distributed hydrological model in the source region of Yellow River. J. Hydrol. 2014, 509, 320–332. [Google Scholar] [CrossRef]
  17. Li, Z.; Yang, D.; Gao, B.; Jiao, Y.; Hong, Y.; Xu, T. Multiscale hydrologic applications of the latest satellite precipitation products in the Yangtze river basin using a distributed hydrologic model. J. Hydrometeorol. 2015, 16, 407–426. [Google Scholar] [CrossRef]
  18. Jiang, Q.; Li, W.; Wen, J.; Qiu, C.; Tan, J. Accuracy evaluation of two high-resolution satellite-based rainfall products: Trmm 3b42v7 and cmorph in shanghai. Water 2018, 10, 40. [Google Scholar] [CrossRef] [Green Version]
  19. Huffman, G.J.; Bolvin, D.T.; Braithwaite, D.; Hsu, K.; Joyce, R.; Kidd, C.; Nelkin, E.J.; Sorooshian, S.; Tan, J.; Xie, P. Integrated Multi-Satellite Retrievals for GPM (IMERG) Technical Documentation. Available online: https://gpm.nasa.gov/sites/default/files/document_files/IMERG_ATBD_V06.pdf. (accessed on 24 March 2020).
  20. Zhang, C.; Chen, X.; Shao, H.; Chen, S.; Liu, T.; Chen, C.; Ding, Q.; Du, H. Evaluation and Intercomparison of High-Resolution Satellite Precipitation Estimates—GPM, TRMM, and CMORPH in the Tianshan Mountain Area. Remote Sens. 2018, 10, 1543. [Google Scholar] [CrossRef] [Green Version]
  21. Lee, J.; Lee, E.; Seol, K. Validation of Integrated MultisatellitE Retrievals for GPM (IMERG) by using gauge-based analysis products of daily precipitation over East Asia. Theor. Appl. Climatol. 2019, 137, 2497–2512. [Google Scholar] [CrossRef]
  22. Yuan, F.; Wang, B.; Shi, C.; Cui, W.; Zhao, C.; Liu, Y.; Ren, L.; Zhang, L.; Zhu, Y.; Chen, T. Evaluation of hydrological utility of IMERG Final run V05 and TMPA 3B42V7 satellite precipitation products in the Yellow River source region, China. J. Hydrol. 2018, 567, 696–711. [Google Scholar] [CrossRef]
  23. Yu, C.; Hu, D.; Liu, M.; Wang, S.; Di, Y. Spatio-temporal accuracy evaluation of three high-resolution satellite precipitation products in China area. Atmos. Res. 2020, 241, 104952. [Google Scholar] [CrossRef]
  24. Wei, G.; Lü, H.T.; Crow, W.; Zhu, Y.; Wang, J.; Su, J. Evaluation of Satellite-Based precipitation products from IMERG V04A and V03D, CMORPH and TMPA with Gauged Rainfall in Three Climatologic Zones in China. Remote Sens. 2018, 10, 30. [Google Scholar] [CrossRef] [Green Version]
  25. Su, J.; Lu, H.; Zhu, Y.; Cui, Y.; Wang, X. Evaluating the hydrological utility of latest IMERG products over the upper Huaihe River Basin, China. Atmos. Res. 2019, 225, 17–29. [Google Scholar] [CrossRef]
  26. Chen, H.; Yong, B.; Shen, Y.; Liu, J.; Zhang, J. Comparison analysis of six purely satellite-derived global precipitation estimates. J. Hydrol. 2019, 581, 124376. [Google Scholar] [CrossRef]
  27. Meng, X.; Wang, H. Significance of the China meteorological assimilation driving datasets for the SWAT Model (CMADS) of East Asia. Water 2017, 9, 765. [Google Scholar] [CrossRef]
  28. Meng, X.; Shi, C.; Liu, S.; Wang, H.; Lei, X.; Liu, Z.; Ji, X.; Cai, S.; Zhao, Q. CMADS datasets and its application in watershed hydrological simulation: A case study of the heihe river basin. Pearl River 2016, 37, 1–19. [Google Scholar]
  29. Cao, Y.; Zhang, J.; Yang, M.; Lei, X.; Guo, B.; Yang, L.; Yang, L.; Zeng, Z.; Qu, J. Application of SWAT model with CMADS data to estimate hydrological elements and parameter uncertainty based on SUFI-2 algorithm in the Lijiang River Basin, China. Water 2018, 10, 742. [Google Scholar] [CrossRef] [Green Version]
  30. Vu, T.; Li, L.; Jun, K. Evaluation of multi-satellite precipitation products for streamflow simulations: A case study for the han river basin in the Korean Peninsula, East Asia. Water 2018, 10, 642. [Google Scholar] [CrossRef] [Green Version]
  31. Guo, D.; Wang, H.; Zhang, X.; Liu, G. Evaluation and analysis of grid precipitation fusion products in jinsha river basin based on china meteorological assimilation datasets for the SWAT Model. Water 2019, 11, 253. [Google Scholar] [CrossRef] [Green Version]
  32. Meng, X.; Wang, H.; Lei, X.; Cai, S. Simulation, validation, and analysis of the Hydrological components of Jing and Bo River Basin based on the SWAT model driven by CMADS. Acta Ecol. Sin. 2017, 37, 7114–7127. [Google Scholar]
  33. Guo, B.; Zhang, J.; Xu, T.; Croke, B.; Jakeman, A.; Song, Y.; Yang, Q.; Lei, X.; Liao, W. Applicability assessment and uncertainty analysis of multi-precipitation datasets for the simulation of hydrologic models. Water 2018, 10, 1611. [Google Scholar] [CrossRef] [Green Version]
  34. Simpkins, G. Hydrology: Increasing river flood risk. Nat. Clim. Chang. 2017, 7, 172. [Google Scholar] [CrossRef]
  35. Guo, T.; Mehan, S.; Gitau, M.W.; Wang, Q.; Kuczek, T.; Flanagan, D.C. Impact of number of realizations on the suitability of simulated weather data for hydrologic and environmental applications. Stoch. Env. Res. Risk A 2017, 32, 2405–2421. [Google Scholar] [CrossRef]
  36. Ochoa, A.; Pineda, L.; Willems, P.; Crespo, P. Evaluation of TRMM 3B42 (TMPA) precipitation estimates and WRF retrospective precipitation simulation over the Pacific-Andean basin into Ecuador and Peru. Hydrol. Earth Syst. Sci. Discuss. 2014, 11, 411–449. [Google Scholar] [CrossRef] [Green Version]
  37. Wang, X.N.; Ding, Y.J.; Zhao, C.C.; Wang, J. Similarities and improvements of GPM IMERG upon TRMM 3B42 precipitation product under complex topographic and climatic conditions over Hexi region, Northeastern Tibetan Plateau. Atmos. Res. 2019, 218, 347–363. [Google Scholar] [CrossRef]
  38. Bao, Y.; Wen, X. Projection of China’s near- and long-term climate in a new high-resolution daily downscaled dataset NEX-GDDP. J. Meteorol. Res. 2017, 31, 236–249. [Google Scholar] [CrossRef]
  39. Chen, H.; Sun, J.; Li, H. Future changes in precipitation extremes over China using the NEX-GDDP high-resolution daily downscaled data-set. Atmos. Ocean. Sci. Lett. 2017, 10, 403–410. [Google Scholar] [CrossRef] [Green Version]
  40. Arnold, J.G.; Srinivasan, R.; Muttiah, R.S.; Allen, P.M. Continental scale simulation of the hydrologic balance. JAWRA J. Am. Water Resour. Assoc. 1999, 35, 15. [Google Scholar] [CrossRef]
  41. Hu, Y.; Cheng, S.; Jia, H. Hydrologic simulation in NPS models: Case of application of swat in Luxi watershed. Res. Environ. Sci. 2003, 16, 29–32. [Google Scholar]
  42. Tan, M.L.; Gassman, P.W.; Srinivasan, R.; Arnold, J.G.; Yang, X. Review of SWAT Studies in Southeast Asia: Applications, Challenges and Future Directions. Water 2019, 11, 914. [Google Scholar] [CrossRef] [Green Version]
  43. Abbaspour, K.C.; Johnson, C.A.; Van Genuchten, M.T. Estimating uncertain flow and transport parameters using a sequential uncertainty fitting procedure. Vadose Zone J. 2004, 3, 1340–1352. [Google Scholar] [CrossRef]
  44. Song, Y.; Zhang, J.; Zhang, M. Impacts of Climate Change on Runoff in Qujiang River Basin Based on SWAT Model. In Proceedings of the 2018 7th International Conference on Agro-geoinformatics (Agro-geoinformatics 2018), Hangzhou, China, 6–9 August 2018. [Google Scholar]
  45. Nash, J.E.; Sutcliffe, J.V. River flow forecasting through conceptual models part I-A discussion of principles. J. Hydrol. 1970, 10, 282–290. [Google Scholar] [CrossRef]
  46. Moriasi, D.N.; Arnold, J.G.; Liew, M.W.V.; Bingner, R.L.; Harmel, R.D.; Veith, T.L. Model evaluation guidelines for systematic quantification of accuracy in watershed simulations. Trans. ASABE 2007, 50, 885–900. [Google Scholar] [CrossRef]
  47. Wilby, R.L.; Harris, I. A framework for assessing uncertainties in climate change impacts: Low-flow scenarios for the River Thames, UK. Water Resour. Res. 2006, 42, 02419. [Google Scholar] [CrossRef]
  48. Ficklin, D.L.; Barnhart, B.L. SWAT hydrologic model parameter uncertainty and its implications for hydroclimatic projections in snowmelt-dependent watersheds. J. Hydrol. 2014, 519, 2081–2090. [Google Scholar] [CrossRef] [Green Version]
Figure 1. Map of the Qujiang River Basin with the DEM (Digital Elevation Model) showing meteorological and hydrological stations.
Water 12 02626 g001
Figure 2. Spatial attribute distribution of the Qujiang River basin: (a) land use cover and (b) soil types.
Water 12 02626 g002
Figure 3. Box plots for the categorical metrics values (Proportion Correct (PC), Probability of Detection (POD), Frequency Bias Index (FBI), False Alarm Ratio (FAR), and Calibration Critical Success Index (CCSI)) of the precipitation detection capacity. The hollow circle represents the mean value, the middle line in the box represents, the median value, and each box ranges from the lower (25th) to the upper quartile (75th).
Water 12 02626 g003
Figure 4. The Performance metrics (Coefficient of Determination (R2), Nash-Sutcliffe Efficiency (NSE), and PBIAS) of the four modes of daily streamflow simulations.
Water 12 02626 g004
Figure 5. The hydrograph and streamflow frequency curve of the daily streamflow in the calibration and validation periods. (a,b) Luoduxi (LDX); (c,d) Fengtan (FT); (e,f) Qilituo (QLT); (g,h) Bixi (BX).
Water 12 02626 g005
Figure 6. The Performance metrics (R2, NSE, and PBIAS) of the four modes of monthly streamflow simulations.
Water 12 02626 g006
Figure 7. The hydrograph and scatterplot (dashed line represents linear fit) of the monthly streamflow in the calibration and validation period. (a,b) LDX; (c,d) FT; (e,f) QLT; (g,h) BX.
Water 12 02626 g007
Figure 8. The uncertainty of the annual average runoff projection results of the three modes (CMADS + SWAT, IMERG + SWAT, and TRMM + SWAT) in 2021–2040 under RCP4.5 and RCP8.5. The hollow circle represents the mean value, the middle line in the box represent the median value, and each box ranges from the lower (25th) to upper quartile (75th).
Water 12 02626 g008
Table 1. Basic information of Gauged, CMADS (China Meteorological Assimilation Driving Datasets for the Soil and Water Assessment Tool (SWAT) mode), IMERG (Integrated Multi-satellite Retrievals for GPM) and TRMM (Tropical Rainfall Measurement Mission) used in this study.
DatasetTime ResolutionSpatial ResolutionTime Series LengthNumbers of SitesData Source
Gauged1 day 2008–201516http://data.cma.cn/
CMADS1 day1/3° × 1/3°2008–2015110http://www.cmads.org/
IMERG1 day0.1° × 0.1°2008–2015870https://gpm.nasa.gov/
TRMM1 day0.25° × 0.25°2008–2015169https://pmm.nasa.gov/
Table 2. The description and initial range of the SWAT model parameters used in this paper.
ParameterTypeDescriptionMethodRange
CN2Management input file (.mgt)Initial SCS runoff curve number for moisture condition IIr 1−2 to 2
ALPHA_BFGroundwater input file (.gw)Baseflow alpha factor (1/days)v 20 to 1
SOL_AWCSol input file (.sol)Available water capacity of the soil layer (mmH2O/mmsoil)r0 to 1
SOL_KSol input file (.sol)Saturated hydraulic conductivity (mm/hour)r0 to 5
ESCOHRU input file (.hru)Soil evaporation compensation factorr0.01 to 1
GW_REVAPGroundwater input file (.gw)Groundwater “revap” coefficientv0.02 to 0.2
SFTMPBasin input file (.bsn)Snowfall temperature (°C)v−20 to 20
SMTMPBasin input file (.bsn)Snow melt base temperature (°C)v−20 to 20
CH_K2Main channel input file (.rte)Effective hydraulic conductivity in main channel alluvium (mm/hour)v0.02 to 50
CH_N2Main channel input file (.rte)Manning’s “n” value for the main channelv0.02 to 0.3
GW_DELAYGroundwater input file (.gw)Groundwater delay time (days)v30 to 450
GWQMNGroundwater input file (.gw)Threshold depth of water in the shallow aquifer required for return flow to occur (mmH2O)v0 to 2
SURLAGBasin input file (.bsn)Surface runoff lag coefficientv0.05 to 24
1 r-multiplies the existing value with (1 + the given value); 2 v-replaces the existing value with the given value.
Table 3. The Root Mean Square Error (RMSE) and Percentage Bias (PBIAS) of the three products relative to the Gauged data in the four sub-basins.
RMSE (mm/day)PBIAS
BXQLTFTLDXBXQLTFTLDX
TRMM10.038.898.376.498.99%16.83%10.43%17.18%
IMERG10.049.589.357.80−2.70%1.99%−3.47%0.41%
CMADS8.597.837.375.964.33%4.38%−2.83%−5.41%
Table 4. The annual mean precipitation and maximum and minimum temperatures of the four sub-basins in 2021–2040 under the scenarios of Representative Concentration Pathway (RCP)4.5 and RCP8.5.
RCP4.5RCP8.5
LDXFTQLTBXLDXFTQLTBX
Prec (mm)1079.411077.841070.731052.391045.431047.141040.321023.10
Tmax (°C)21.1821.9321.7421.7421.4622.1922.0022.00
Tmin (°C)13.8215.0214.9114.7414.0615.2515.1314.96

