Article

Transient Phenomena Generated in Emptying Operations in Large-Scale Hydraulic Pipelines

by
Guillermo Romero
1,
Vicente S. Fuertes-Miquel
2,*,
Óscar E. Coronado-Hernández
3,
Román Ponz-Carcelén
1 and
Francisco Biel-Sanchis
1
1
Empresa Mixta Metropolitana S.A., EMIMET, 46023 Valencia, Spain
2
Department of Hydraulic Engineering and Environment, Universitat Politècnica de València, 46022 Valencia, Spain
3
Facultad de Ingeniería, Universidad Tecnológica de Bolívar, Cartagena 131001, Colombia
*
Author to whom correspondence should be addressed.
Water 2020, 12(8), 2313; https://doi.org/10.3390/w12082313
Submission received: 15 July 2020 / Revised: 11 August 2020 / Accepted: 14 August 2020 / Published: 18 August 2020
(This article belongs to the Section Urban Water Management)

Abstract

:
Air pockets generated during emptying operations in pressurized hydraulic systems cause significant pressure drops inside pipes. To avoid these sudden pressure changes, one of the most widely used methods involves the installation of air valves along the pipeline route. These elements allow air exchange between the exterior and the interior of the pipe, which alleviates the pressure drops produced and thus prevents possible breaks or failures in the structure of the installation. This study uses a mathematical model previously validated by the authors in smaller installations to simulate all hydraulic variables involved in emptying processes over time. The purpose of these simulations is the validation of the mathematical model in real large-scale installations, and to do this, the results obtained with the mathematical model are compared with actual measurements made by the partner company. The hydraulic system selected for the study is a pipeline with a nominal diameter of 400 mm and a total length of 1020 m. The results obtained from the mathematical model show great similarity with the experimental measurements, thus validating the model for emptying large pipes.

1. Introduction

During the emptying processes of pressurized systems, air trapped inside the pipeline causes pressure drops [1,2,3] that sometimes cause serious structural damages. When the pipeline empties, the air pocket expands and generates a vacuum that causes a pressure drop [4]. The presence of two fluids (water and air) introduces greater complexity in the analysis of transient phenomena that occur during emptying processes [4], since it is necessary to use a hydraulic (water column) and thermodynamic (trapped air pocket) approach [5,6,7,8].
It is highly recommended to place air valves throughout the installation to manage the filling and emptying of pipelines and to prevent undesired variation in pressure [9,10,11]. These elements are responsible for allowing outside air to enter the pipes when emptying occurs and pressure drops are generated. In this manner, as water leaves the pipeline, air is introduced at the same time through the air valves to control the pressure and to avoid major problems [12].
The authors have developed a robust mathematical model that successfully predicts the behaviour of the main variables involved in the drainage process (removing of water from pipes) in pressurized systems [2,3,12]. The mathematical model is based on the rigid column equation [2,13], the piston flow hypothesis [14,15], the polytropic evolution of air pockets [16,17], the characteristic equation of the air valve [18,19] and the continuity equation of the air pocket. The mathematical model is validated through laboratory tests with various air pockets in simple (a pipe with constant slope) and irregular profile pipes (several pipes with different slopes), both with and without air valves. More specifically, the authors validated the mathematical model in two laboratory facilities under limited conditions and with very small pipe sizes. These previous tests were carried out in two different laboratories. In the Universitat Politècnica de València (Spain), the mathematical model was applied to a methacrylate pipeline with an internal diameter of 42 mm and a length of 4.36 m [2]. In the University of Lisbon (Portugal), the experimental facility consisted of a set of transparent Polyvinyl Chloride (PVC) pipes with a nominal diameter of 63 mm and a length of 7.3 m [12]. In both tests, it was proven that the proposed mathematical model is able to simulate the behaviour of the hydraulic and thermodynamic variables (absolute pressure of the air pocket, water velocity, water column variation, air density and air flow) considering different drainage manoeuvre scenarios [20,21,22,23,24,25]. A reliable mathematical model for predicting transient flow with trapped air is crucial to ensure the pipeline safety [26]; indeed, several experiments have been conducted by many researchers [27,28,29,30].
However, the proposed mathematical model has not been validated in real large-scale pipelines. This study presents the application of the model for the prediction of the hydraulic and thermodynamic behaviour during emptying processes in real large-scale pipelines. For this purpose, Empresa Mixta Metropolitana S.A. (EMIMET, Valencia, Spain) took measurements of the drainage process of a 1020 m-long cast iron pipeline with a nominal diameter of 400 mm located between Museros and Massamagrell, province of Valencia (Spain).

2. Study Development

To validate the mathematical model, a comparison of the results of the model with the results of field tests must be possible. It is important to accurately know the characteristics of the installation to be analysed and all its elements, as well as the initial conditions of each variable.
This study will analyse the behaviour of the hydraulic variables during an emptying manoeuvre in an installation whose characteristics are defined further below. This process will be carried out in a water supply network of the partner company. The response of the water column in a single section (P2–P4) is analysed.
The network studied is located between the municipalities of Museros and Massamagrell, in the province of Valencia (Spain). It is a cast iron pipeline with a nominal diameter DN400. The length of the installation is very large, more than 3 km long, but this study analyses a specific section that is 1020 m long, in which the emptying manoeuvre was performed. The section studied spans from the abscissa K0 + 563.329 (point P2) to K1 + 583.373 (point P4).
Figure 1 shows the exact location of the DN400 distribution network. The pipeline is shown in blue and is adjacent to the two municipalities. The figure shows the most representative points of the pipeline.
The following are the main characteristics of all the elements that make up the P2–P4 section. Throughout the entire route, there are three different types of valves: air valves (for air inlet); butterfly valves (for regulation); and a gate valve (for discharge). The latter, together with several elements, conforms the outlet through which the water inside the pipe is discharged.
First, the elements responsible for the intake of outside air into the inside of the pipeline (air valves) is described. Throughout the entire route there are two DN50 air valves installed at specific points to allow air to enter and leave the pipeline. The first is found at abscissa K1 + 052.458 (point P3), at the end of a section with a very gentle slope. The second air valve is located at the highest end of the installation (point P4) to allow air intake at the beginning of the emptying process and thus avoid significant pressure drops.
The gate valve installed in the section studied has a nominal diameter of DN100 and is responsible for allowing the complete emptying of the pipeline. This valve has a discharge coefficient (Kv) of 3300 s2/m5. This value refers to a valve opening degree of 55%, data obtained in previous analyses by the collaborating company. This valve is located at the point with the lowest topographical elevation (point P2), for the purpose of completely discharging the water during the emptying manoeuvre.
Finally, the last elements of the installation are the butterfly valves. These elements are the same size as the pipe (nominal diameter DN400). The main function of the butterfly valves is to allow the flow of water or to isolate the entire section from the rest of the network, depending on its opening degree. There are three butterfly valves installed at points P2, P3 and P4. For the present test, the valve located at point P3 is always fully open and allows the flow of water, while the other two valves located at the ends remain closed throughout the emptying process.
Figure 2 shows a detailed diagram of the installation analysed to study the emptying process. It shows the position of the different valves and the profile of the pipeline with the slope of each of its sections.
To finish the description of the selected installation, Table 1 shows the characteristic values of all the points and routes that make up section P2–P4. The abscissae of each point is shown with the length and longitudinal slope of each section.
With all the characteristics of the installation under study shown above, the set of equations that make up the mathematical model must be defined in order to analyse the emptying process and to determine the evolution of the variables of the problem.

2.1. Mathematical Model

During the emptying (drainage) process, while the water column leaves the pipeline, the air enters through the air valve and the size of the air pocket increases inside the pipeline. The set of equations that model this process can be divided into two groups: those that define the behaviour of the water column and those that model the behaviour of the air pocket.
First, the velocity and position equations for the water column are presented, followed by the two equations that represent the pressure and density of the air pocket. Last, the equation that defines the air velocity or air flow that enters through the air valve is shown.
WATER COLUMN
  • Equation of the rigid model that characterizes the movement of the emptying column:
    d v d t = p 1 * p a t m * ρ w L e + g ( z L e ) f v v 2 D R v   g   A 2   v v L e
  • Emptying column position:
    d L e d t = v   o r   L e = L 0 0 t v   d t
    where v is the velocity of the emptying column, p 1 * is the absolute pressure of the air pocket, p a t m * is the atmospheric pressure, L e is the length of emptying column, ρ w is the water density, D is the pipe diameter, g is the gravitational acceleration, z / L e corresponds to the gravity term, f is the friction factor, R v is the resistance coefficient of the discharge valve and A is the cross-section area of the pipe.
AIR POCKET
  • Evolution of the air pocket:
    d p 1 * d t = p 1 *   k ( L T L e ) ( ρ a C N   v a C N     A a d m A   ρ a   v )
  • Continuity equation for the air pocket:
    d ρ a d t = ρ a C N   v a C N     A a d m v   A   ρ a   ( L T L e )   A
  • Characteristic equation for the air valve during the emptying process:
    v a C N = C a d m 7   p a t m *   ρ a t m [ ( p 1 * p a t m *   ) 1.4286 ( p 1 * p a t m *   ) 1.714 ] o r         Q a = v a C N   A a d m
    where k is the polytropic coefficient, ρ a C N is the air density in normal conditions, L T is the total length of the installation, A a d m is the cross-sectional area of the air valve, ρ a is the density of the air pocket, C a d m is the inflow discharge coefficient of the air valves and Q a is the air flow admitted by the air valve.
The gravity term can be seen in equation (1). This term relates to the position of each section to its respective slope, which means that the value of the gravitational term will change throughout the emptying process and depending on the position of the water column. The following equations describe the behaviour of the gravitational term:
If L T   L e   > L 1   + L 2   + L 3   + L 4   + ··· + L i 1 , then:
z L e =   L 1 sin θ 1 + L 2 sin θ 2 + L 3 sin θ 3 + L 4 sin θ 4 +   · · ·   +   L i 1 sin θ i 1 L e +   ( 1 L 1 + L 2 + L 3 + L 4 +   · · ·   +   L i 1 L e   ) sin θ i
If L 1   +   L 2   +   L 3   +   L 4   +   L 5   L e   > L 1   + L 2   + L 3   + L 4 , then:
z L e = L 1 sin θ 1 + L 2 sin θ 2 + L 3 sin θ 3 + L 4 sin θ 4 L e + ( 1 L 1 + L 2 + L 3 + L 4 L e   ) sin θ 5
If L 1   +   L 2   +   L 3   +   L 4   L e   > L 1   + L 2   + L 3 , then:
z L e =   L 1 sin θ 1 + L 2 sin θ 2 + L 3 sin θ 3 L e + ( 1 L 1 + L 2 + L 3 L e   ) sin θ 4
If L 1   +   L 2   +   L 3   L e   > L 1   + L 2   CC:
z L e =   L 1 sin θ 1 + L 2 sin θ 2 L e + ( 1 L 1 + L 2 L e   ) sin θ 3
If L 1   +   L 2   L e   > L 1 ,   then:
z L e =   L 1 sin θ 1 L e + ( 1 L 1 L e   ) sin θ 2
Finally, if L 1   L e   > 0 ,   then:
z L e = sin θ 1
where i is the total number of sections that make up the installation, L j is the length of section j and θ j is the longitudinal slope of section j.

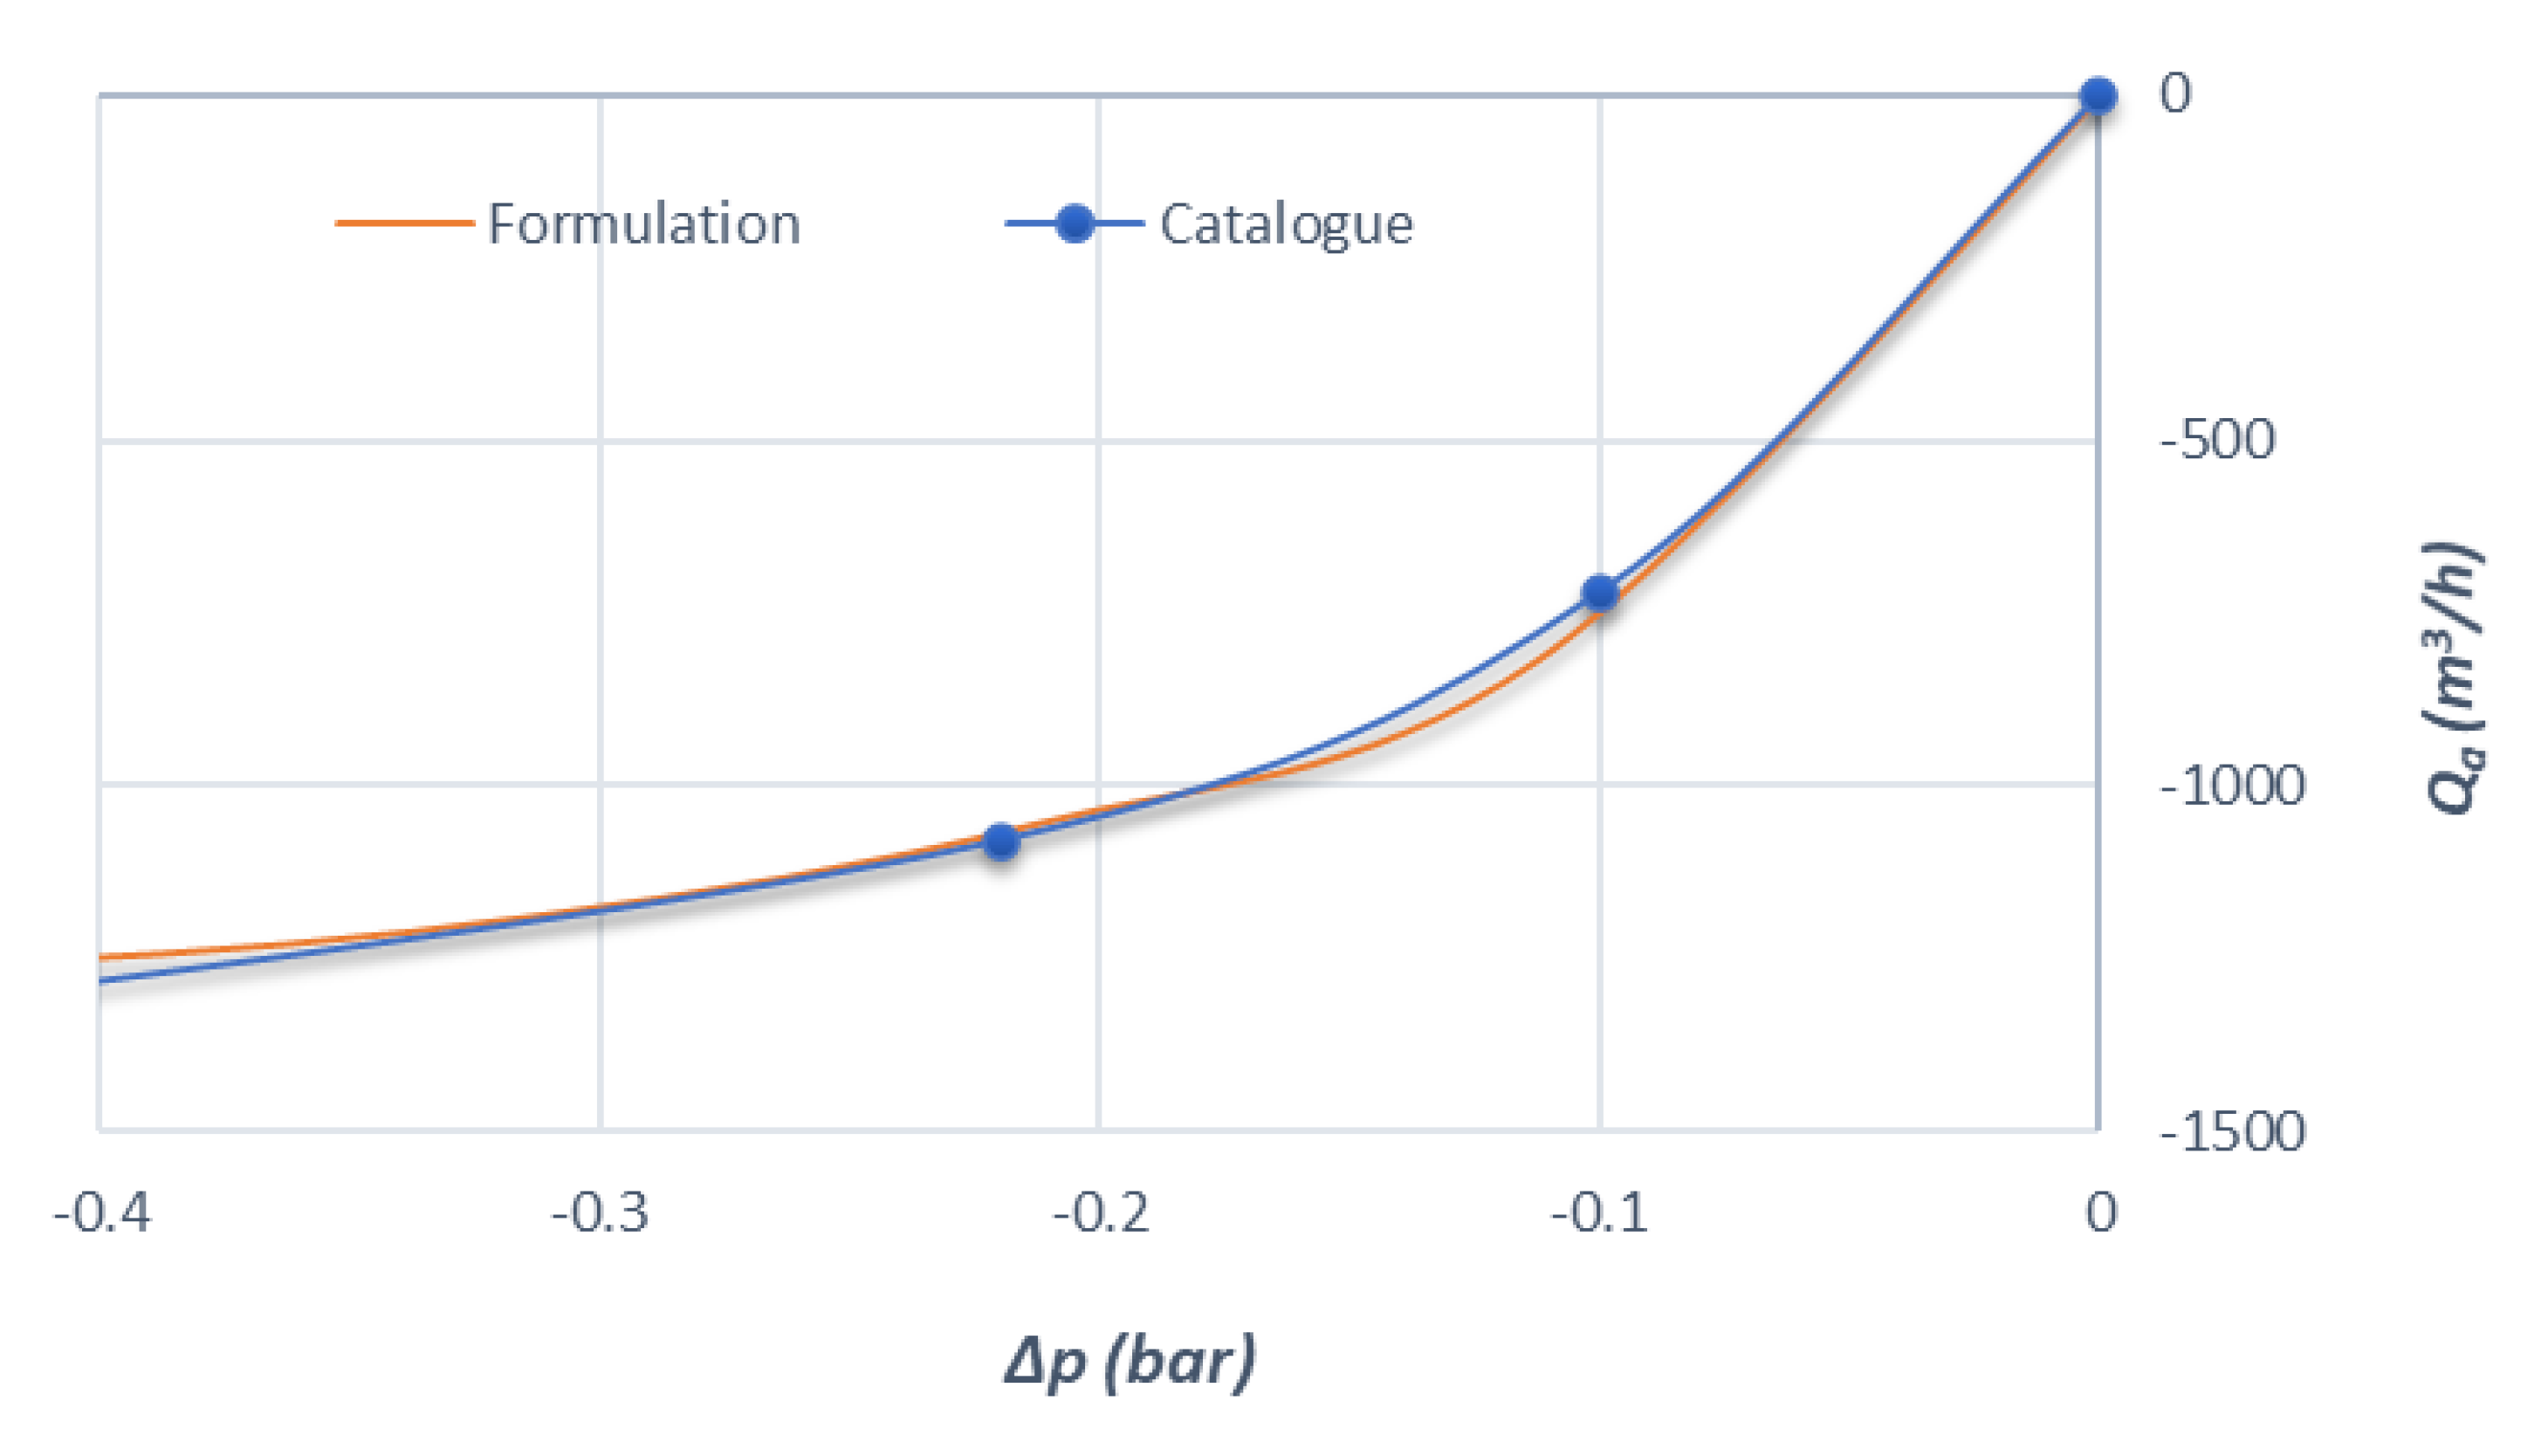
2.2. Flow Rate Curves of the Air Valves

The parameters that characterize the behaviour of air valves are the discharge coefficients. In the case of emptying processes, the coefficient required to carry out the simulations is the inflow coefficient (Cadm).
A comparison analysis was carried out to obtain the corresponding coefficient. First, the flow rate curve for the inflow phase provided by the manufacturer in their catalogue is represented and, second, the equation is adjusted to characterize the behaviour of the air valves [11]:
Q a d m =   A a d m C a d m 7   p a t m *   ρ a t m [ ( p 1 * p a t m *   ) 1.4286 ( p 1 * p a t m *   ) 1.714 ]
Figure 3 shows the results obtained and the great similarity between the catalogue curve and the curve adjusted using Equation (12) can be seen. An inflow coefficient (Cadm) of 0.75 is obtained in the inflow phase for the DN50 air valve.

2.3. Initial and Boundary Conditions

To study the emptying process of section P2–P4, the initial conditions of the different variables of the analysed problem need to be defined: v ( 0 )   = 0; L e   ( 0 )   = 1019 m; p 1 *   ( 0 )   = 313,195 Pa; ρ a ( 0 )   = 3.724 kg/m3; v a C N   ( 0 )   = 0; Q a   ( 0 )   = 0.
In addition, other important data are the friction factor to calculate conduction losses (f = 0.0257) and the value of the polytropic coefficient that models the behaviour of the air pocket (k = 1.1).

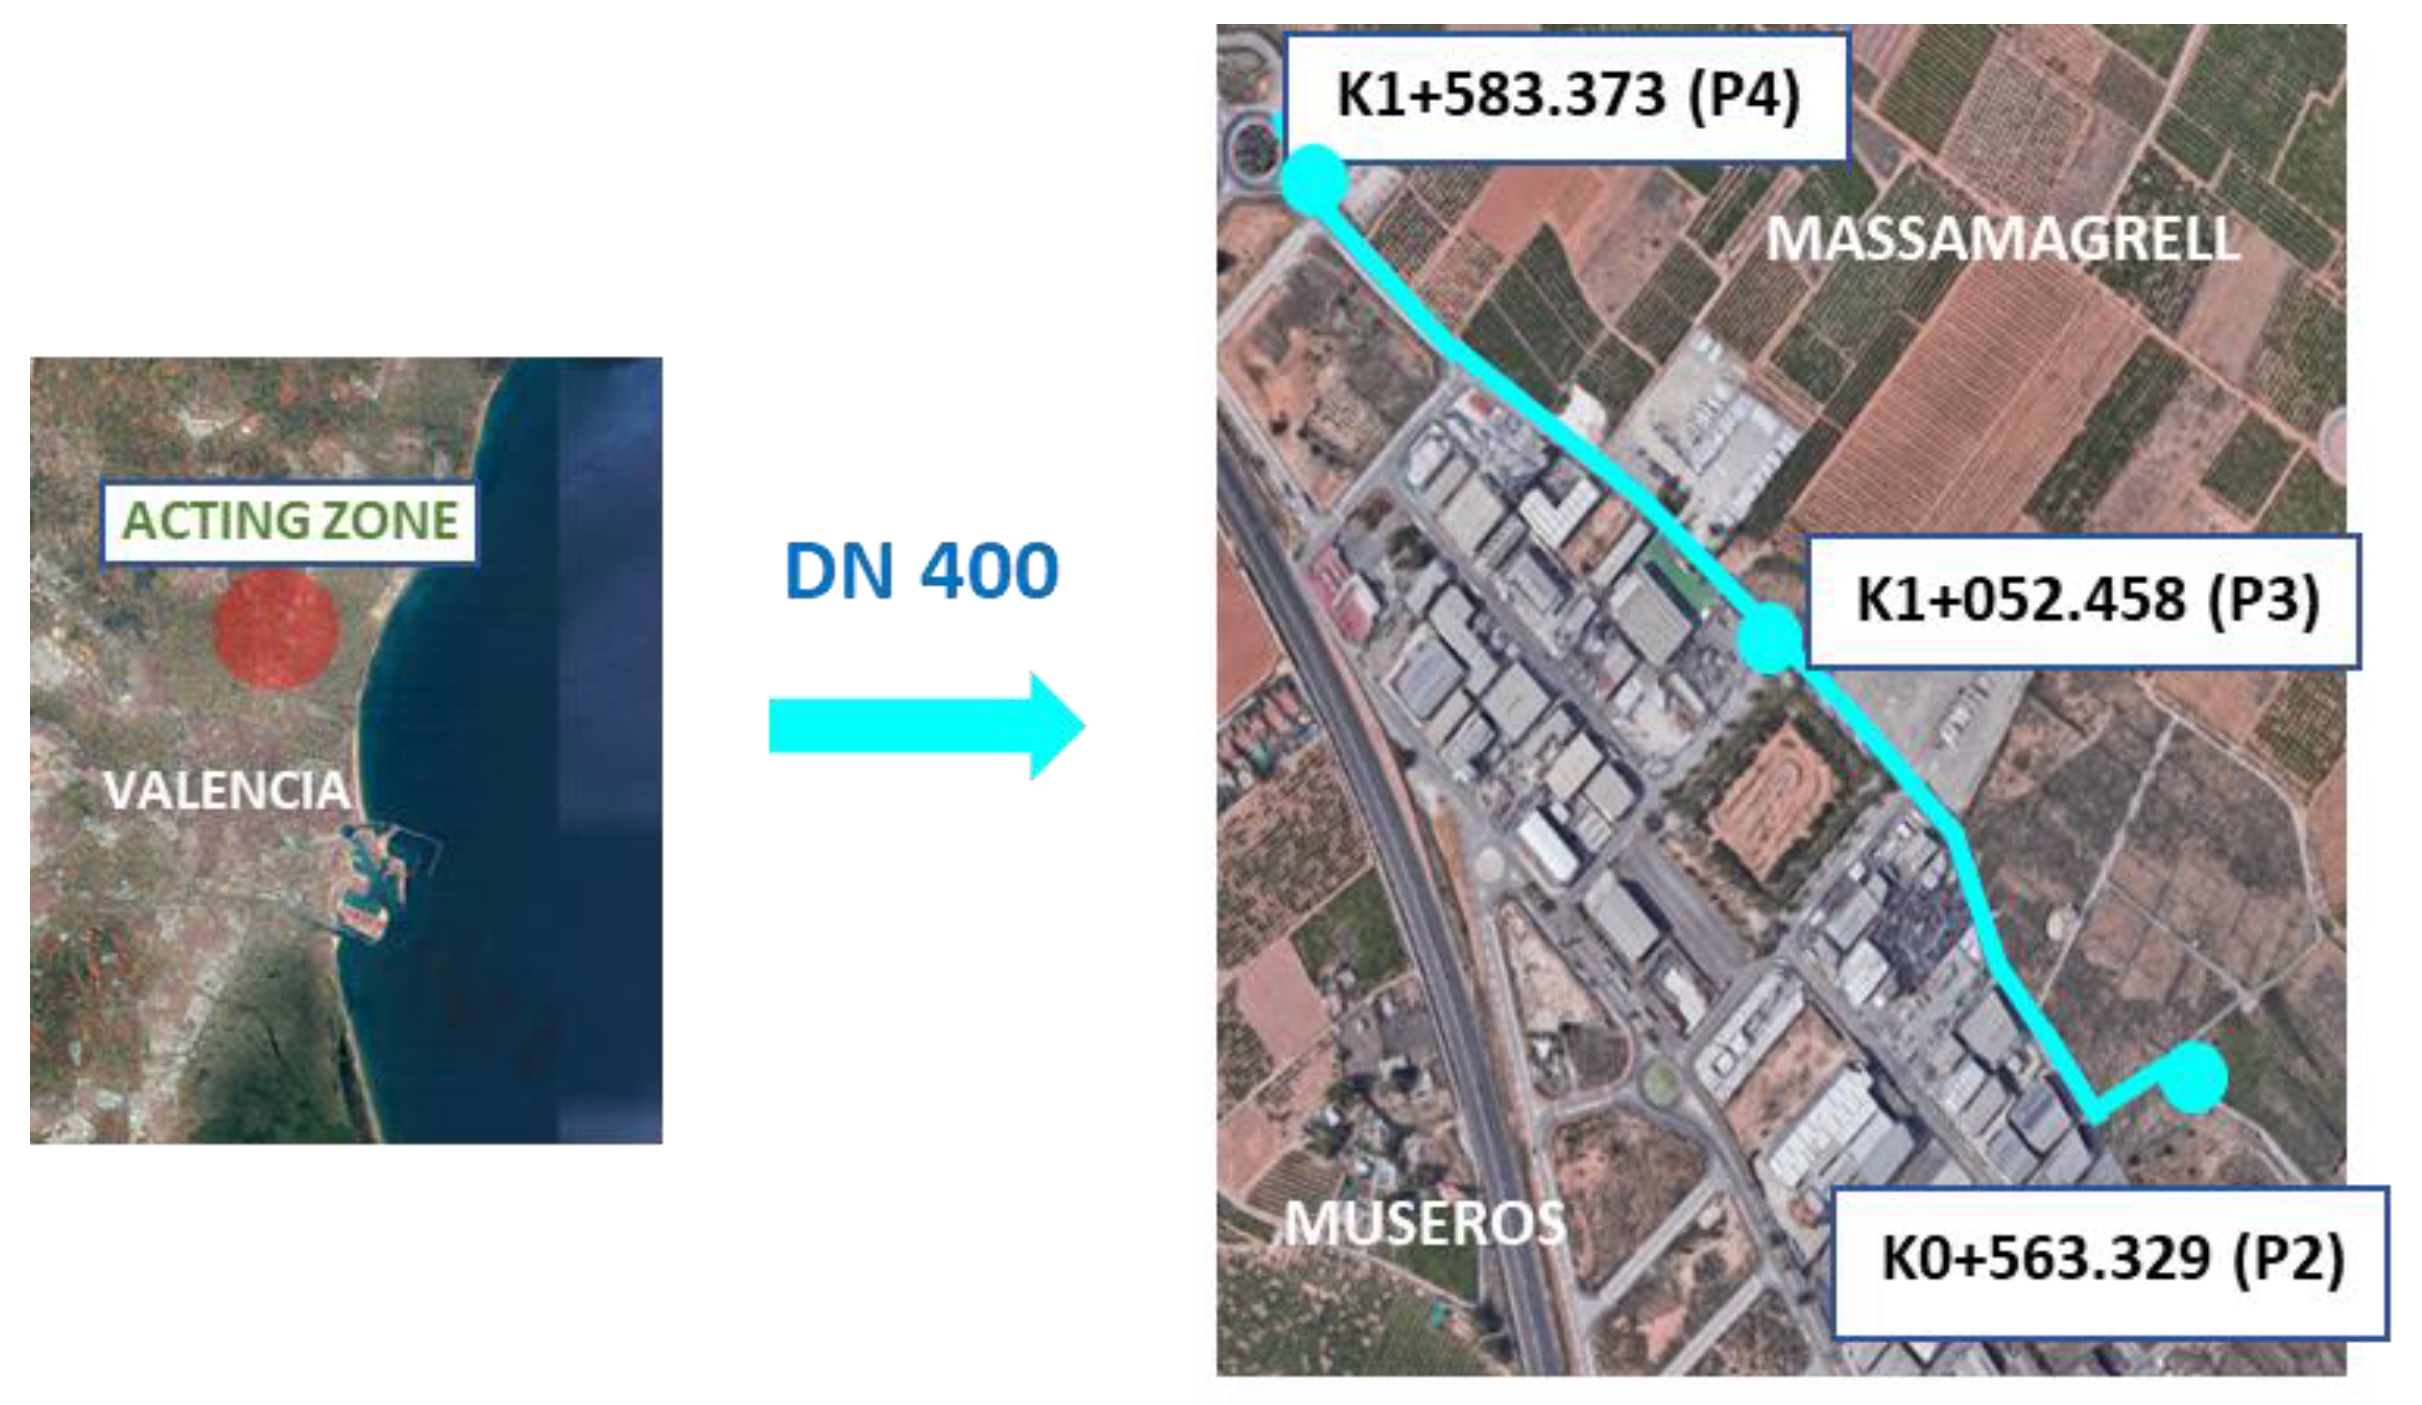
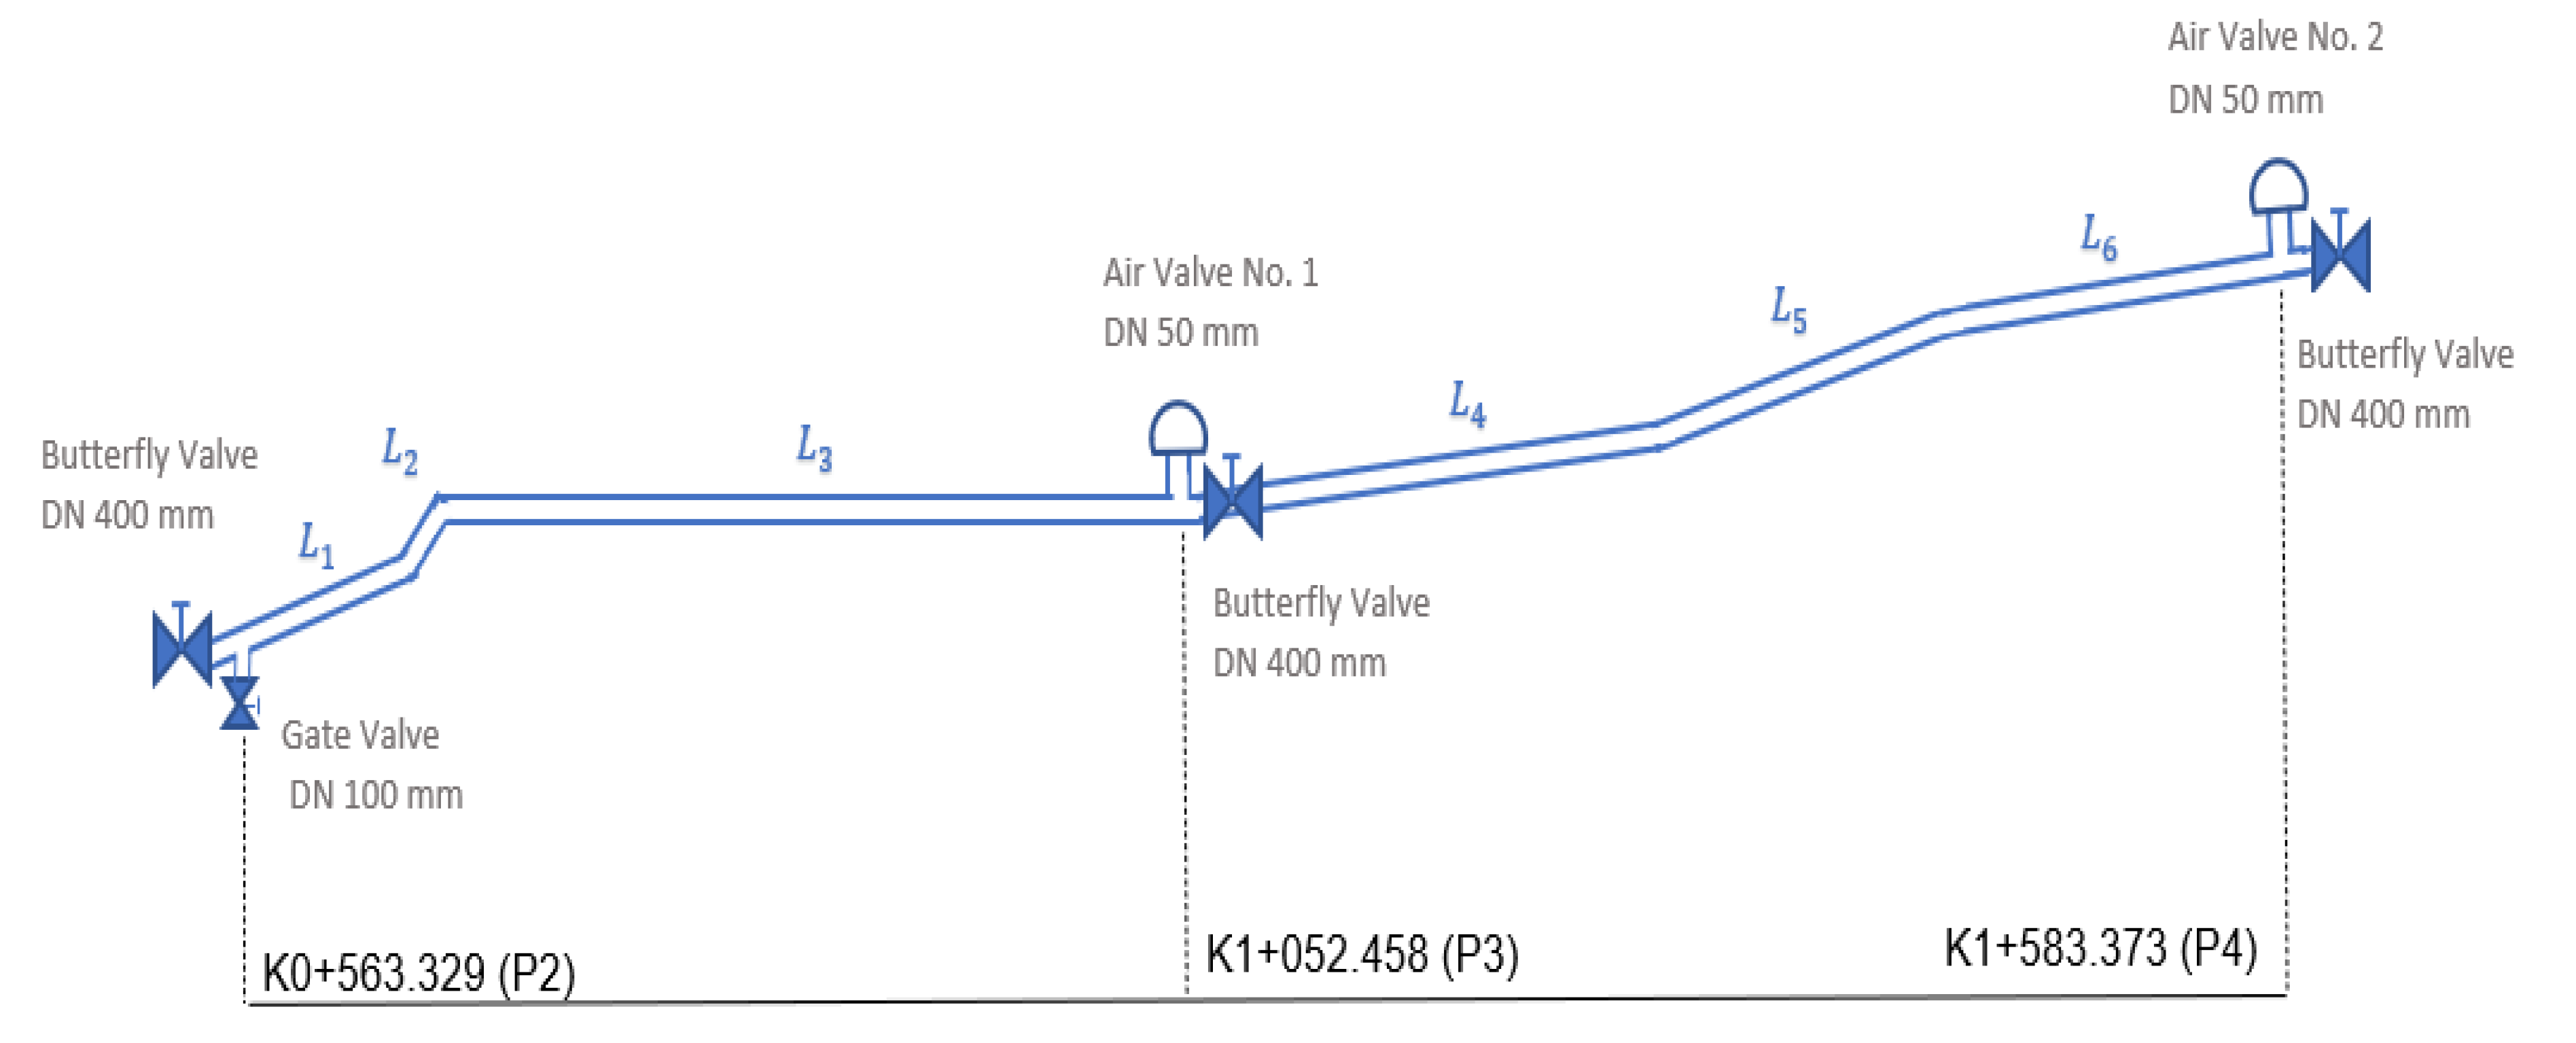
3. Application of the Mathematical Model to a Large-Scale Installation

The proposed system of equations is solved using the MATLAB software to obtain the evolution over time of the variables described in the mathematical model. The solution of the mathematical model enables us to obtain the evolution of the different variables (water flow, air pressure, air density, water speed, etc.)
In addition, experimental water flow and air pressure measurements are available throughout the emptying process. Thus, for these two variables, the comparison between the results of the mathematical model and the experimental measurements can be established. The analysis of this comparison will allow validation of the proposed mathematical model in large pipes.
The results obtained in the emptying process of the DN400 network (section P2–P4) are shown below. All the curves provided by the mathematical model are represented, but only the outlet flow and the absolute pressure inside the pipe are compared with the experimental measurement, since these are the only variables recorded during the measurements.

3.1. Water Flow Evolution

In an emptying process, all the water inside the pipe is discharged through the only drain of the section. Figure 4 shows the evolution over time of the water that flows out through the drain during the entire emptying process.
Due to the large size of the installation (total length = 1020 m), the duration of the emptying manoeuvre is lengthy (4260 s). Certainly, as the process progresses, the outflow decreases from a maximum value of 46 L/s (velocity = 0.37 m/s) at the start of the manoeuvre.
In both the results of the mathematical model and the experimental measurements, the changes in the water flow can be seen when the slope of the pipeline changes.

3.2. Air Pocket Pressure Evolution

The other variable that can be compared with the mathematical model is the absolute pressure inside the pipe. Figure 5 details the behaviour of the pressure during the 4260 s required to complete the emptying manoeuvre.
During the first 3 s of the transient, the pressure suddenly varies and changes from the initial pressure inside the pipe to a pressure close to atmospheric pressure. After these first seconds, the pressure remains practically constant (very close to atmospheric pressure) throughout the entire emptying process. It is observed how the pressure obtained by the experimental measurement takes 2 s more to stabilize and to reach the value of atmospheric pressure than the same value of the mathematical model.
This is during the first moments of the manoeuvre, when the air valve opens quickly and allows outside air to enter. This causes the sudden decrease in pressure. Once the air valve is open, the pressure in the pipeline is practically atmospheric pressure.

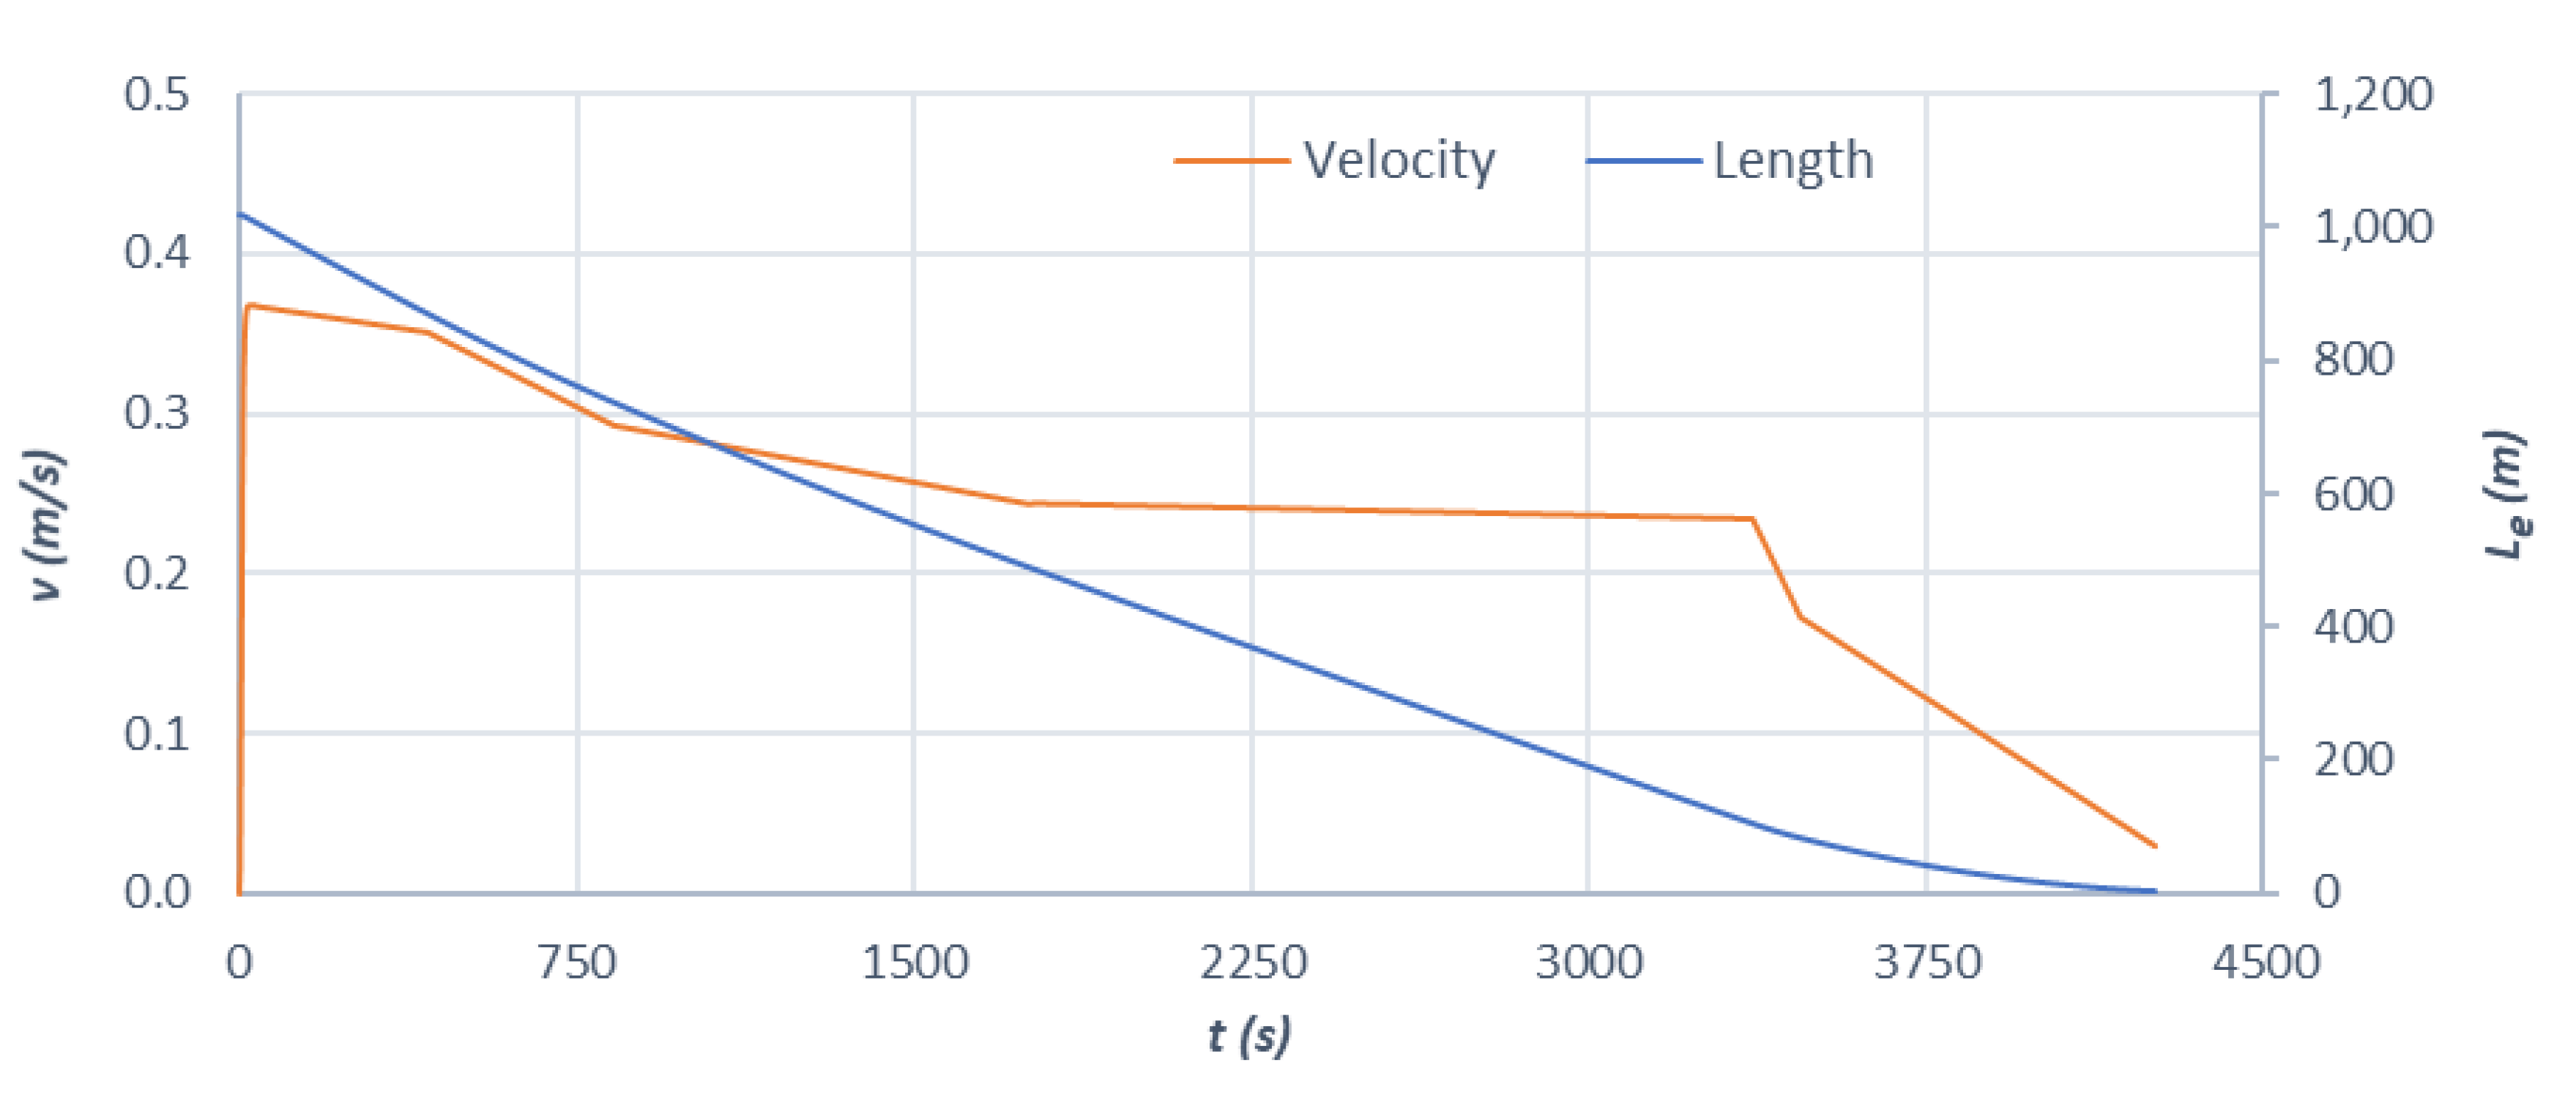
3.3. Length and Velocity Evolution of the Water Column

The water flow and air pressure are the two variables that can be compared with the values obtained from the measurements, but the mathematical model provides the evolution of all the variables of the analysed problem. Figure 6 shows the evolution of the length and velocity of the water column throughout the emptying process.
Naturally, since the cross section of the pipe is constant, the evolution of both the flow rate and the velocity are very similar.

3.4. Evolution of the Air Flow that Enters the Air Valves

Last, the air flow that enters through each of the two air valves installed in the section studied is analysed (Figure 7).
Figure 7 shows the operation of each air valve. The air valve located at the highest point of the section (point P4) operates from the outset, while the air valve located at the intermediate point (point P3) does not start operating until the water column reaches this point.
When the air valve located in the intermediate point opens and begins to introduce outside air, there is a sudden decrease in the air flow admitted by the air valve at the end. From this moment forward, the air intake in the pipeline is divided between the two air valves installed in the section studied.

4. Discussion on the Comparison between Mathematical Model and Experimental Measures

The results shown in the previous section establish the effectiveness of the proposed mathematical model. The model is able to predict the behaviour of the hydraulic and thermodynamic variables involved in the emptying processes in real large-scale installations. To do this, comparative analyses have been carried out between model results and experimental measurements of the evolution over the time of the water flow through the drain and of the absolute pressure of the air pocket inside the pipes.
With this it is confirmed that the mathematical model can be used to simulate these emptying processes in pressure systems, not only in experimental small installations, but also in real large-scale pipelines. There is a very good similarity between the flow rate curve provided by the mathematical model and the curve from the experimental results (see Figure 4). For the evolution of the pressure in the air pocket, the agreement between both curves is also very significant (see Figure 5). Thus, the validation of the model for large-scale installations is justified.
Additionally, the evolution of all the variables of the emptying processes can be determined with the model. Thus, since the model has been validated, it can be used to study in detail the transient phenomena that occur during emptying manoeuvres.

5. Conclusions

Air pockets inside pipelines may occur due to various causes: maintenance work, start-up operations, filling and emptying manoeuvres, etc. During these processes, significant overpressures and pressure drops that exceed the admissible values for the installations can be generated and can thus cause serious problems. Therefore, the correct location and dimensioning of air valves is extremely important.
The main objective of this study is to validate the mathematical model that simulates the emptying processes in real large-scale installations, since it has previously been validated with laboratory facilities.
As the results presented here show, the validation was successful. The mathematical model, consisting of numerous differential equations that simulate the operation of the actual system, is able to predict the behaviour of hydraulic variables throughout the entire process.
However, for the model to be valid, special attention must be given to the characterization of the different elements of the system. All valves must be properly characterized for reliable model results. Furthermore, it is very important to know with some precision the initial and boundary conditions that define the problem studied.
This study represents an important step forward in learning the behaviour of real installations during emptying processes. The model presented and validated can be very useful for water distribution companies when planning emptying operations. It would be possible to know in advance of possible sudden changes in pressure and in this way, it is possible to avoid failures in the structure of the pipeline; in turn it would also be possible to know precisely the emptying time of an installation before carrying it out. In addition, the model is a contribution of great interest towards advancing the knowledge of hydraulic transients with trapped air.

Author Contributions

G.R., V.S.F.-M., and Ó.E.C.-H. performed simulations using the mathematical model, as well as writing the draft version of the manuscript. R.P.-C. and F.B.-S. prepared the large-scale pipeline and provided records of measurements of hydraulic and thermodynamic variables. All authors made the analysis of the case study. All authors have read and agreed to the published version of the manuscript.

Funding

This research was not externally funded.

Acknowledgments

This study was possible thanks to the collaboration between Universitat Politècnica de València (UPV) and Empresa Mixta Metropolitana S.A. (EMIMET—Grupo Global Omnium), which is the company that made possible the experimental measurements in large-scale installations.

Conflicts of Interest

The authors declare no conflict of interest.

Abbreviations

The following abbreviations are used in this article:
A Cross-sectional area of the pipe (m2)
A a d m Cross-sectional area of the air valve (m2)
C a d m Discharge coefficient of the air valve (-)
D Internal pipe diameter (m)
D v e n t Internal diameter of the air valve (m)
f Friction factor (-)
g Gravity acceleration (m/s2)
L e Length of the emptying column (m)
L T Total length of the pipe (m)
L i Length of section i (m)
k Polytropic coefficient (-)
p 1 * Absolute pressure of the air pocket (Pa)
p a t m * Atmospheric pressure (Pa)
Q a Air flow (m3/s)
Q w Water flow (m3/s)
R v Discharge coefficient of the valve (s2/m5)
t Time (s)
v Water velocity (m/s)
v a C N Air velocity (m/s)
z Elevation (m)
z Elevation difference (m)
ρ w Water density (kg/m3)
ρ a Air density (kg/m3)
θ i Longitudinal slope (%)
Superscript
Absolute values
Subscript
a Refers to air
i Refers to the pipe section
n c Refers to normal conditions
w Refers to water
0 Refers to initial conditions

References

  1. Laanearu, J.; Annus, I.; Koppel, T.; Bergant, A.; Vučkovič, S.; Hou, Q.; van’t Westende, J.M.C. Emptying of large-scale pipeline by pressurized air. J. Hydraul. Eng. 2012, 138, 1090–1100. [Google Scholar] [CrossRef] [Green Version]
  2. Fuertes-Miquel, V.S.; Coronado-Hernández, O.E.; Iglesias-Rey, P.L.; Mora-Meliá, D. Transient phenomena during the emptying process of a single pipe with water-air interaction. J. Hydraul. Res. 2019, 57, 318–326. [Google Scholar] [CrossRef]
  3. Coronado-Hernández, O.E. Transient Phenomena during the Emptying Process of Water in Pressurized Pipelines. Ph.D. Thesis, Polytechnic University of Valencia, Valencia, Spain, 2019. [Google Scholar]
  4. Fuertes-Miquel, V.S.; Coronado-Hernández, O.E.; Mora-Meliá, D.; Iglesias-Rey, P.L. Hydraulic modeling during filling and emptying processes in pressurized pipelines: A literature review. Urban Water J. 2019, 16, 299–311. [Google Scholar] [CrossRef]
  5. Vasconcelos, J.G.; Wright, S.J. Rapid flow startup in filled horizontal pipelines. J. Hydraul. Eng. 2008, 134, 984–992. [Google Scholar] [CrossRef] [Green Version]
  6. Li, L.; Zhu, D.Z.; Huang, B. Analysis of pressure transient following rapid filling of a vented horizontal pipe. Water 2018, 10, 1698. [Google Scholar] [CrossRef] [Green Version]
  7. Bashiri-Atrabi, H.; Hosoda, T. The motion of entrapped air cavities in inclined ducts. J. Hydraul. Res. 2015, 53, 814–819. [Google Scholar] [CrossRef]
  8. Zhou, L.; Liu, D.; Karney, B. Phenomenon of white mist in pipelines rapidly filling with water with entrapped air pocket. J. Hydraul. Eng. 2013, 139, 1041–1051. [Google Scholar] [CrossRef]
  9. Ramezani, L.; Karney, B.; Malekpour, A. The challenge of air valves: A selective critical literature review. J. Water Resour. Plan. Manag. 2015, 141. [Google Scholar] [CrossRef]
  10. Ramezani, L.; Karney, B.; Malekpour, A. Encouraging effective air management in water pipelines: A critical review. J. Water Resour. Plan. Manag. 2016, 142, 04016055. [Google Scholar] [CrossRef] [Green Version]
  11. American Water Works Association (AWWA). Manual of Water Supply Practices—M51: Air-Release, Air-Vacuum, and Combination Air Valves; American Water Works Association: Denver, CO, USA, 2016. [Google Scholar]
  12. Coronado-Hernández, O.E.; Fuertes-Miquel, V.S.; Besharat, M.; Ramos, H.M. Experimental and numerical analysis of a water emptying pipeline using different air valves. Water 2017, 9, 98. [Google Scholar] [CrossRef]
  13. Liou, C.; Hunt, W.A. Filling of pipelines with undulating elevation profiles. J. Hydraul. Eng. 1996, 122, 534–539. [Google Scholar] [CrossRef]
  14. Zhou, L.; Liu, D. Experimental investigation of entrapped air pocket in a partially full water pipe. J. Hydraul. Res. 2013, 51, 469–474. [Google Scholar] [CrossRef]
  15. Izquierdo, J.; Fuertes, V.S.; Cabrera, E.; Iglesias, P.; García-Serra, J. Pipeline start-up with entrapped air. J. Hydraul. Res. 1999, 37, 579–590. [Google Scholar] [CrossRef]
  16. Fuertes-Miquel, V.S.; López-Jiménez, P.A.; Martínez-Solano, F.J.; López-Patiño, G. Numerical modelling of pipelines with air pockets and air valves. Can. J. Civ. Eng. 2016, 43, 1052–1061. [Google Scholar] [CrossRef] [Green Version]
  17. León, A.; Ghidaoui, M.; Schmidt, A.; Garcia, M. A robust two-equation model for transient-mixed flows. J. Hydraul. Res. 2010, 48, 44–56. [Google Scholar] [CrossRef] [Green Version]
  18. Chaudhry, M.H. Applied Hydraulic Transients, 3rd ed.; Springer: New York, NY, USA, 2014. [Google Scholar]
  19. Wylie, E.; Streeter, V. Fluid Transients in Systems; Prentice Hall: Englewood Cliffs, NJ, USA, 1993. [Google Scholar]
  20. Martins, S.C.; Ramos, H.M.; Almeida, A.B. Conceptual analogy for modelling entrapped air action in hydraulic systems. J. Hydraul. Res. 2015, 53, 678–686. [Google Scholar] [CrossRef]
  21. Tijsseling, A.; Hou, Q.; Bozkus, Z.; Laanearu, J. Improved one-dimensional models for rapid emptying and filling of pipelines. J. Press. Vessel Technol. 2016, 138, 031301. [Google Scholar] [CrossRef] [Green Version]
  22. Balacco, G.; Apollonio, C.; Piccinni, A.F. Experimental analysis of air valve behaviour during hydraulic transients. J. Appl. Water Eng. Res. 2015, 3, 3–11. [Google Scholar] [CrossRef]
  23. Abreu, J.; Cabrera, E.; Izquierdo, J.; García-Serra, J. Flow modeling in pressurized systems revisited. J. Hydraul. Eng. 1999, 125, 1154–1169. [Google Scholar] [CrossRef]
  24. De Marchis, M.; Freni, G.; Milici, B. Experimental analysis of pressure-discharge relationship in a private water supply tank. J. Hydroinform. 2018, 20, 608–621. [Google Scholar] [CrossRef] [Green Version]
  25. Mohan, S.; Abhijith, G.R. Hydraulic analysis of intermittent water-distribution networks considering partial-flow regimes. J. Water Res. Plann. Manag. 2020, 146, 04020071. [Google Scholar] [CrossRef]
  26. Collins, R.P.; Boxall, J.B.; Karney, B.W.; Brunone, B.; Meniconi, S. How severe can transients be after a sudden depressurization? J. Am. Water Work. Assoc. 2012, 104, E243–E251. [Google Scholar] [CrossRef] [Green Version]
  27. Alexander, J.M.; Lee, P.J.; Davidson, M.; Duan, H.F.; Li, Z.; Murch, R.; Meniconi, S.; Brunone, B. Experimental validation of existing numerical models for the interaction of fluid transients with in-line air pockets. J. Fluids Eng. 2019, 141, 121101. [Google Scholar] [CrossRef]
  28. Besharat, M.; Tarinejad, R.; Aalami, M.T.; Ramos, H.M. Study of a compressed air vessel for controlling the pressure surge in water networks: CFD and experimental analysis. Water Resour. Manag. 2016, 30, 2687–2702. [Google Scholar] [CrossRef]
  29. Covas, D.; Stoianov, I.; Ramos, H.M.; Graham, N.; Maksimovic, C.; Butler, D. Water hammer in pressurized polyethylene pipes: Conceptual model and experimental analysis. Urban Water J. 2010, 1, 177–197. [Google Scholar] [CrossRef]
  30. Alexander, J.M.; Lee, P.J.; Davidson, M.; Li, Z.; Murch, R.; Duan, H.F.; Meniconi, S.; Brunone, B. Experimental investigation of the interaction of fluid transients with an in-line air pocket. J. Hydraul. Eng. 2020, 146, 04019067. [Google Scholar] [CrossRef]
Figure 1. Geographic location of the DN400 pipeline.
Water 12 02313 g001
Figure 2. Diagram of the P2–P4 installation.
Water 12 02313 g002
Figure 3. Characteristic curve of the DN50 air valve in the inflow phase.
Water 12 02313 g003
Figure 4. Evolution over time of water flow during the emptying process in section P2–P4. Comparison between the mathematical model and the experimental measurements.
Water 12 02313 g004
Figure 5. Evolution over time of the pressure inside the pipe during the emptying process in section P2–P4.
Water 12 02313 g005
Figure 6. Evolution over time of the position and velocity of the water column during the emptying process in section P2–P4.
Water 12 02313 g006
Figure 7. Evolution over time of the airflow entering the two air valves during the emptying process in section P2–P4.
Water 12 02313 g007
Table 1. Geometric characteristics of the P2–P4 installation.
Section No.AbscissaPipeline Shaft Height (m.a.s.l.)Length (m)Longitudinal Slope (%)
FromToFromTo
1K0 + 563.329 (P2)K0 + 646.017104.23105.882.6881.898
2K0 + 646.017K0 + 667.767105.8107.1221.756.065
3K0 + 667.767K1 + 052.458 (P3)107.12107.44384.6910.083
4K1 + 052.458 (P3)K1 + 301.062107.44108.94248.6040.603
5K1 + 301.062K1 + 434.515108.94111.05133.4531.58
6K1 + 434.515K1 + 583.373 (P4)111.05111.82148.8580.517

