Article

Dynamic Distributed Storage of Stormwater in Sponge-Like Porous Bodies: Modelling Water Uptake

by
T. Staffan Lundström
1,*,
Hans O. Åkerstedt
1,
I. A. Sofia Larsson
1,
Jiri Marsalek
2 and
Maria Viklander
2
1
Fluid Mechanics, Department of Engineering Sciences and Mathematics, Luleå University of Technology, 976 31 Luleå, Sweden
2
Urban Water, Department of Civil, Environmental and Natural Resources Engineering, Luleå University of Technology, 976 31 Luleå, Sweden
*
Author to whom correspondence should be addressed.
Water 2020, 12(8), 2080; https://doi.org/10.3390/w12082080
Submission received: 15 June 2020 / Revised: 14 July 2020 / Accepted: 17 July 2020 / Published: 22 July 2020
(This article belongs to the Special Issue Industrial and Environmental Fluid Mechanics)

Abstract

:
An innovative concept of dynamic stormwater storage in sponge-like porous bodies (SPBs) is presented and modelled using first principles, for down-flow and up-flow variants of SPBs. The rate of inflow driven by absorption and/or capillary action into various porous material structures was computed as a function of time and found to be critically dependent on the type of structure and the porous material used. In a case study, the rates of inflow and storage filling were modelled for various conditions and found to match, or exceed, the rates of rainwater inflow and volume accumulation associated with two types of Swedish rainfalls, of 60-min duration and a return period of 10 years. Hence, the mathematical models indicated that the SPB devices studied could capture relevant amounts of water. The theoretical study also showed that the SPB concepts could be further optimized. Such findings confirmed the potential of dynamic SPB storage to control stormwater runoff and serve as one of numerous elements contributing to restoration of pre-urban hydrology in urban catchments. Finally, the issues to be considered in bringing this theoretical concept to a higher Technological Readiness Level were discussed briefly, including operational challenges. However, it should be noted that a proper analysis of such issues requires a separate study building on the current presentation of theoretical concepts.

1. Introduction

Urbanization dramatically alters the hydrological cycle of developing areas by reducing hydrological abstractions and accelerating runoff, which leads to increased runoff volumes and flow peaks, and ultimately the risk of water ponding or flooding [1]. Such changes of the urban environment, accompanied by deteriorating runoff quality and geomorphology of urban streams, lead to reduced biodiversity and contribute to unsustainability in urban areas [2]. Therefore, restoration of the pre-development catchment by measures enhancing water abstraction (e.g., infiltration in soakaways and evapotranspiration on green roofs) and slowing the speed of runoff (e.g., cross-berms in runoff swales) have been pursued in modern drainage design [3,4]. In practice, the above measures, or their functional principles, are applied via broadly varying scales, typically described as lot-level [5], neighborhood and catchment scales [6]. The discussion here focuses on lot-scale measures (LSMs), which in common terminology are also called distributed control measures, and when such LSMs serve to dissipate runoff volume they are referred to as runoff source controls. The importance of these measures follows from their key features:
  • control of runoff close to source, thus avoiding negative effects along the transport route (e.g., disconnection of roof leaders from storm sewers),
  • small size, which allows applications or retrofits with minimal or zero footprint (e.g., green roofs),
  • large numbers of these measures creating benefits as the sum of small contributions, which may not be individually discerned at the catchment scale, and
  • these ‘micro-measures’ are typically operated by the property owners, which brings about socio-economic benefits arising from public participation in, and cost-sharing of, stormwater management programs [5].
LSMs are widely described in the literature, particularly in numerous urban drainage manuals [7,8,9], as practices reducing lot runoff. Starting with the rooftops, the following LSMs are commonly used: grey and green roofs [10,11], rainwater harvesting on rooftops and reuse [12,13,14], infiltration of rainwater and runoff into soakaways or topsoil [8,9], and the minimization of the extent of impervious areas and reducing the speed of runoff [7,15]. Rooftop storage of rainwater collects and dissipates water near the source, retains 10–60% of event rainfall (depending on the green roof design and rain event characteristics) [11], has zero land requirements, may improve rainwater quality (though the opposite effects have also been reported), and contributes to biodiversity and the creation of an urban habitat. Generally, green roofs are more effective than gray roofs without vegetation [10]. The operation of green roofs also creates challenges, starting with the initial investment, operational costs, potential elution of chemicals from green roof substrates [16], and the fact reported in Francis and Jensen’s review [17] that some published reports of green roof benefits in the form of ecosystem services do not present sufficient evidence proving those benefits.
LSMs based on runoff infiltration into soils can be effective in dissipating runoff with infiltration capacity > 0.5 cm/h [7,9]. Typical examples of such measures are infiltration soakaways or pipes, bioretention cells, diversion of runoff from rooftops or other impervious areas on grassy surfaces, and enhanced water storage in soils with increased thickness of topsoil. While detailed specifications for these measures with respect to their design and best practices of implementation are presented in design manuals [7,8,9], their performance in intercepting and infiltrating stormwater is not quantified in the above references. Infiltration measures are, however, considered highly effective in runoff control at the lot level and therefore included among best practices.
The innovative theoretical concept of stormwater storage in sponge-like porous bodies (SPBs) presented in this paper holds the promise of applicability in conjunction with some of the existing best practices in LSMs, such as green/gray roofs and small-scale infiltration practices (e.g., soakaways [10]). The “sponge” concept has been introduced into stormwater management in the framework of a sponge city [18,19,20] and effectively incorporates many of the earlier introduced stormwater management practices [21] into urban land use policies to repurpose rainwater in cities and fight flooding. It is hypothesized here that the sponge concept in stormwater management should benefit from connection to recent work on poro-elasto-capillary wicking of cellulose sponges, combining wicking and swelling [22].
Wicking dynamics is of importance in a number of fields and has, therefore, been studied theoretically and experimentally for quite some time [23,24]. At this stage, more research is still required to explore new fields of application and deal with more complex geometries [25,26,27,28,29]. The principal advantage of sponge-like porous bodies is their ability to absorb large quantities of water, given a careful selection of the material used. Hydrogels, consisting of three-dimensionally cross-linked hydrophilic polymer networks, are one of the materials capable of retaining large volumes of water in the swollen state. Depending on the type of monomer used in the production of the material, hydrogels can respond in different ways to changes in the surrounding environment, for example, varying pH and temperature, which may affect hydrogel swelling and water retaining properties [30]. Even though hydrogels have been used in numerous small-scale applications, the feasibility of their use in stormwater storage and control is theoretically explored for the first time in this paper.
The objectives of the paper are to: (a) describe the theoretical sponge-like porous bodies (SPB) water storage concept on the basis of first principles, (b) derive and verify semi-analytical models for entry of stormwater into SPBs, (c) use such models to demonstrate the theoretical capacity of SPBs to fully capture selected Swedish design rainfalls, and (d) discuss practical challenges that may be encountered in field applications in stormwater control, including steps in advancing technology readiness level (TRL) of SPBs.

2. Development of Governing Equations of Inflow into SPB Storage: Down-Flow and Up-Flow Variants

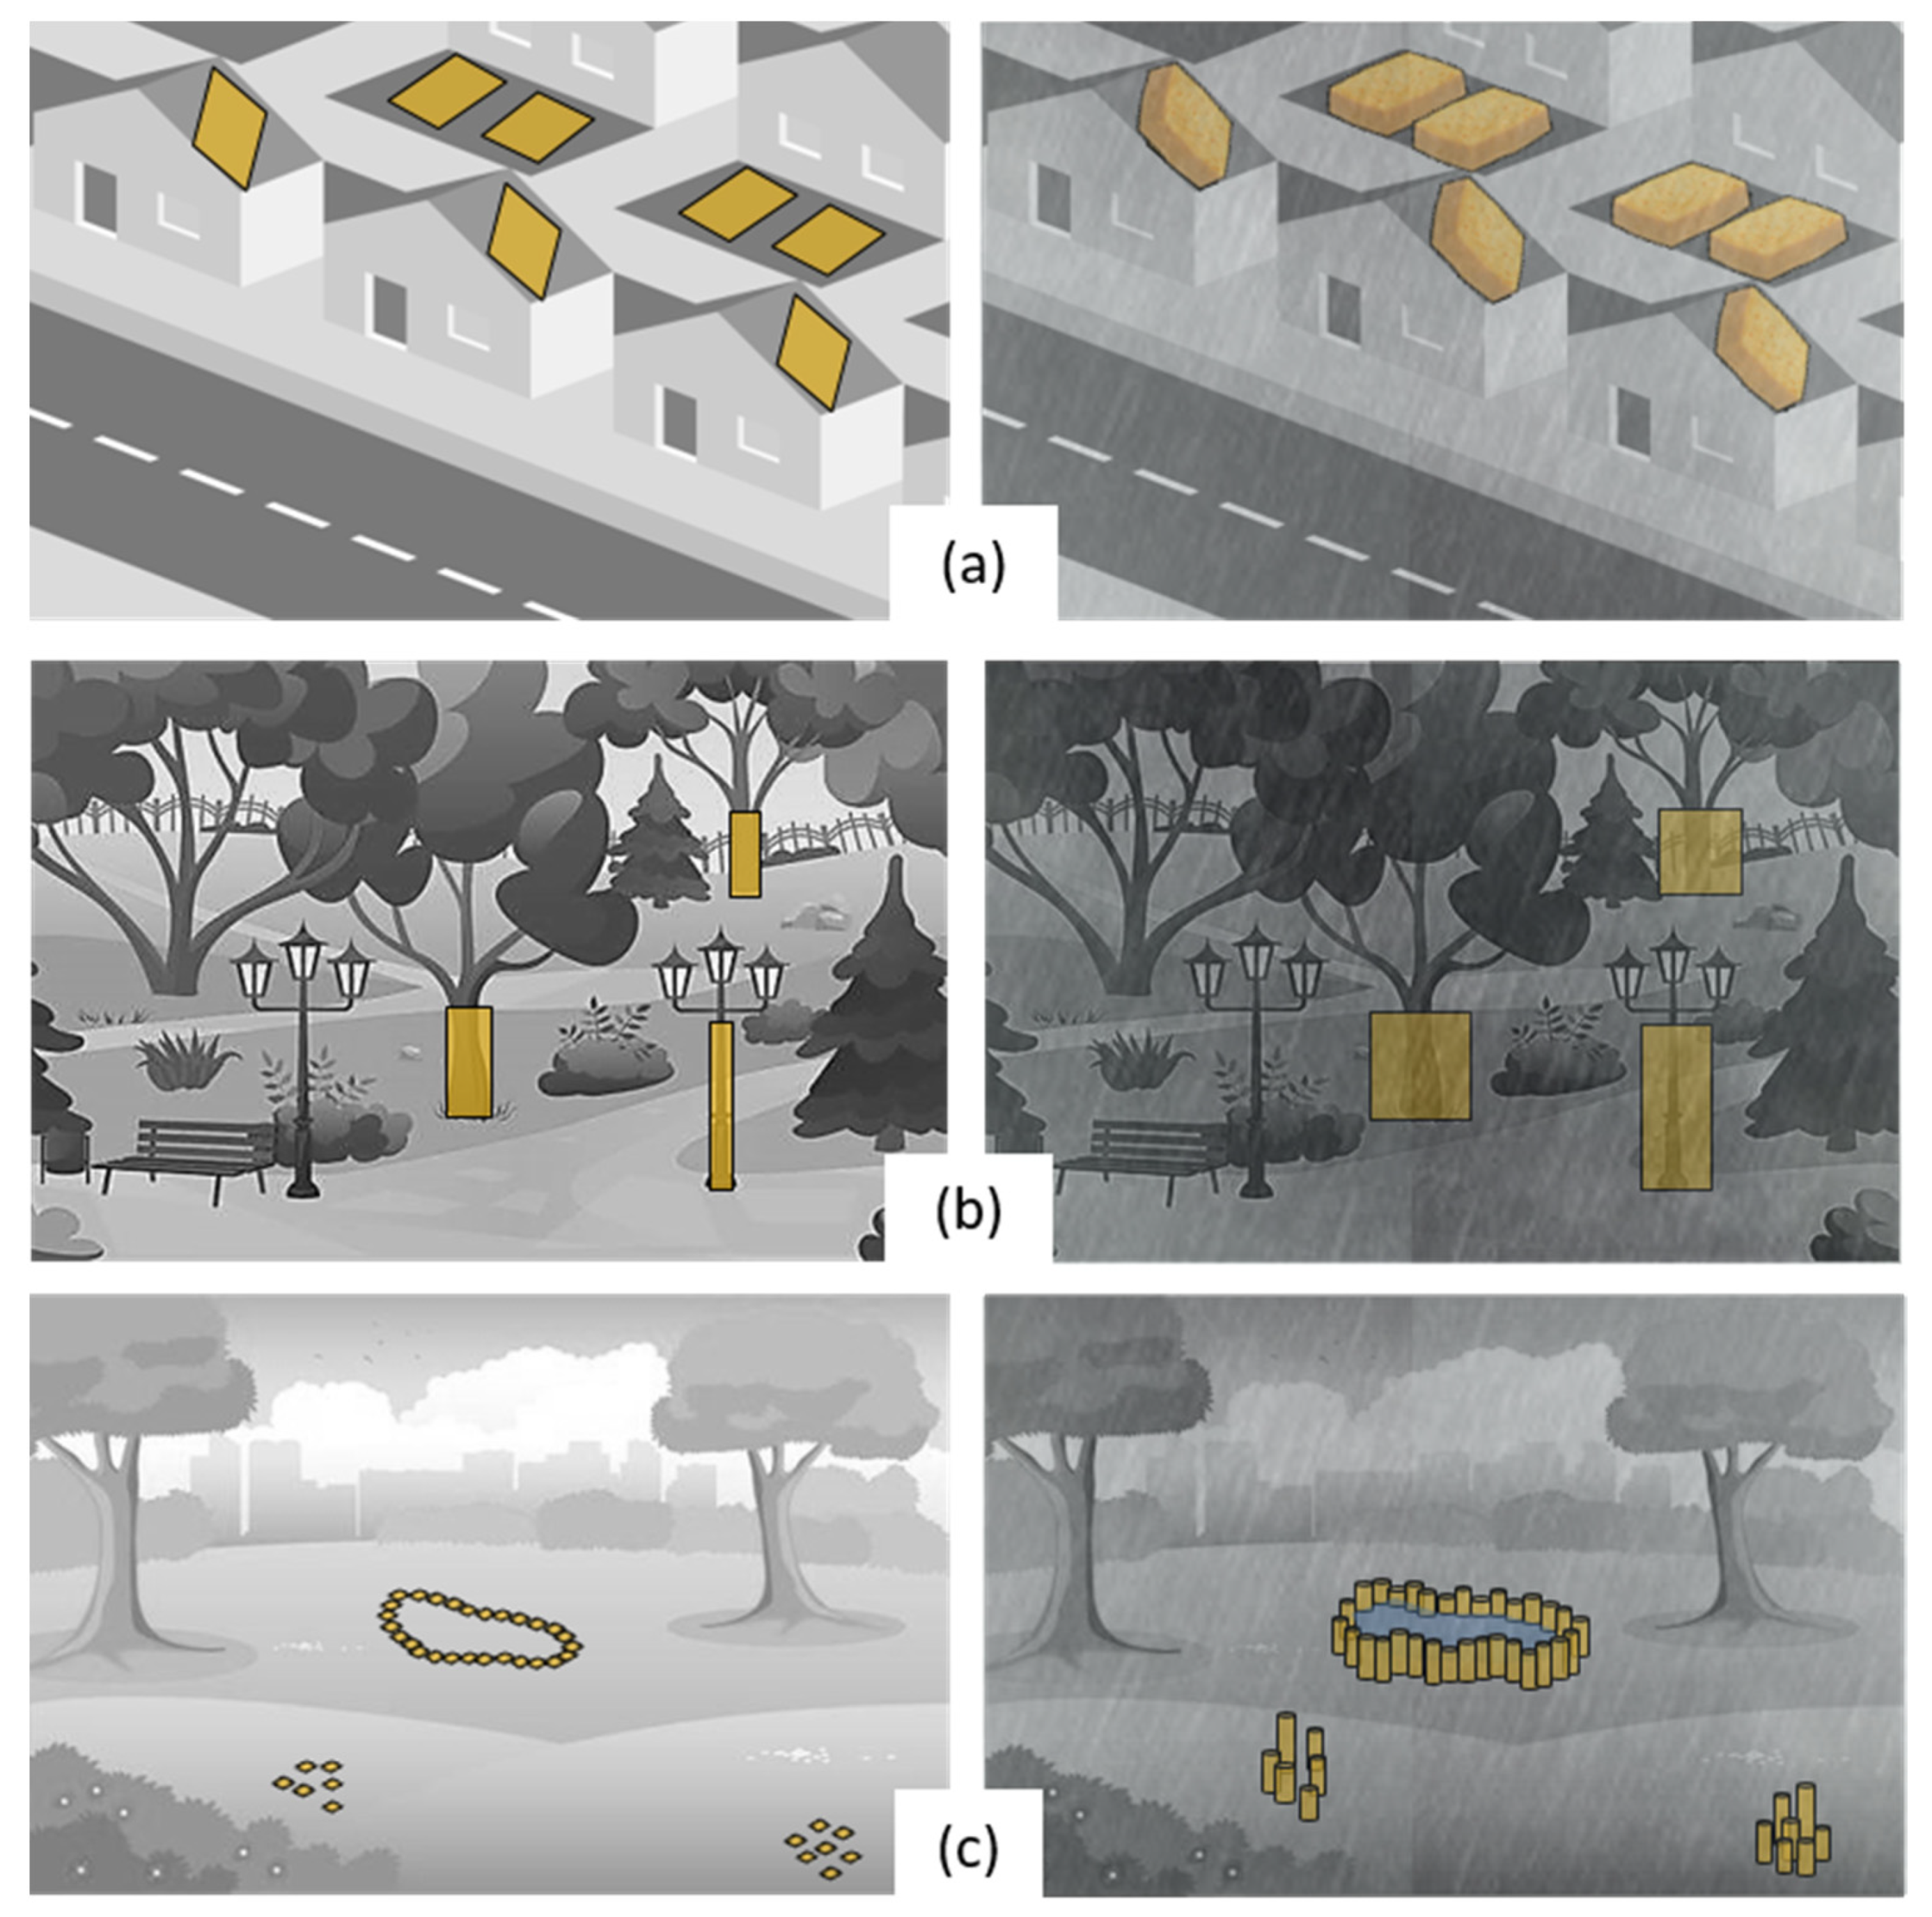
2.1. SPB Storage Concept Description

In the first SPB storage variant, Down-flow SPB storage, a relatively large area, such as sections of a roof, parking lot, playground, or football field, would be covered with a material that absorbs the rainwater directly upon contact. The material then swells in a vertical direction, keeping the intercepted water in place (Figure 1a).
One possible type of material to consider in this application are hydrogels, recognizing that such materials can satisfy several demands of Down-flow SPB storage. For maximum effectiveness, the influx of water into a hydrogel layer should match the influx of rainwater, but partial interceptions with some water bypassing are fully acceptable, as demonstrated by similar widely used control measures, e.g., green roofs [11]. In fact, there may be opportunities for installing Down-flow SPB storage units in conjunction with green or gray roofs.
In the second variant, water ponded on the ground moves upwards and is stored in two types of pre-installed Up-flow SPB storage structures: (i) intermediate height (1–2 m) supported vertical structures that expand only in the horizontal direction when absorbing water (Figure 1b), and (ii) low-height (<0.2 m) unsupported structures that grow from the ground as they absorb water (Figure 1c). The former structures can be wrapped around trees (Figure 1b) or lamp posts, or attached to walls and concrete bridge abutments, to mention a few examples. The supported storage structures may swell in a horizontal direction when water first moves horizontally in and then upwards through the structures. For the unsupported structures that grow from the ground as they absorb water (Figure 1c), the material not only swells, but also stiffens. This process is analogous to the rising of flowers, when irrigated after a dry period. The water impoundments formed by these structures may also store water from adjacent areas. Examples of these storage structures include hydrogel fibers and porous rods made of natural fibers [31].
The design of unsupported storage structures may require the use of a cluster of compliant rods, which stiffen as they become saturated by capillary action, or by applying a pressure gradient that makes them grow vertically as a function of the inflow rate. However, there must be spaces for storing the expanding material during dry weather periods, which can be a challenge with respect to space limitations and safety. Depending on site conditions, individual rods may grow in isolation, one by one, or in clusters forming various patterns serving as barriers around water impoundments holding significant volumes of stormwater (Figure 1c). Such impoundments could be designed to feed soakaway pits, or similar infiltration structures.

2.2. Governing Equations

The governing equations are presented below for the Down-flow and Up-flow SPB storage variants.

2.2.1. Down-Flow SPB storage: Governing Equations

The flow into absorbing materials, like hydrogels, may be described by the diffusion equation:
θ ( r , t ) t = [ D i j ( θ , r ) θ ( r , t ) , j ] , i
where θ is the concentration of water within the swelling material at location r and time t and Dij is the diffusion coefficient. Assuming that D is constant in space and independent of θ, Equation (1) reduces to:
θ ( r , t ) t = D θ ( r , t ) , j j
where the product ,j is the flux of water per unit area. From these equations the volumetric uptake V of water per unit time Δt, Qab, was derived by Sweijen et al. [32] as
V Δ t = Q a b ( t ) = V a b D θ , j n j d A
or, in a different form, after expressing the volumetric water uptake as a function of time ∆t, the following equation is obtained
V ( t ) = 0 t Q a b ( t ) d t = 0 t V a b D θ , j n j d A d t = 0 t V a b θ t d V d t = V a b θ ( r , t ) d V
where Aab is the area of the interface between the water and the absorbing material, n is the vector normal to the interface, and Vab is the volume of water that penetrated through the surface Aab into the absorbing material. From this equation it is obvious that the flow rate will increase with the size (area) of the interface, the magnitude of D, and the gradient of θ(r,t), which should be as large as possible.

2.2.2. Up-Flow SPB Storage: Governing Equations

The governing equation for the up-flow SPB storage is assumed to be the Darcy law, together with the condition of water incompressibility, according to:
u i = ϕ K i j x j ( p + ρ g x 1 )
u i x i = 0
where ui is the velocity, ϕ the porosity, Kij the permeability and p the pressure. The constant g is the acceleration due to gravity that is set to act in the negative x1 direction and ρ is the density of water. This equation is valid for Newtonian flow through a stationary porous medium, up to particle Reynolds numbers Rep = Ud/ν ~ 40 [33], where U is the average velocity in the porous medium, d is a characteristic length of the solids in the porous medium, and ν is the kinematic viscosity of the fluid. The porous medium is not allowed to deform in this first model of Up-flow SPB storage. In our model, the flow is driven by capillary action described by
Δ p = 2 γ c o s Θ R
where Δp is the pressure jump over the curved water surface (the capillary pressure), γ is the surface tension, Θ is the contact angle, and R is the pore radius of the porous medium. By replacing Δp on the left-hand side of Equation (7) with ρ ghmax, the maximum height, hmax, within a capillary tube can be derived, and this expression is also known as Jurin’s law.
Important for Up-flow SPB storage is that the main driving mechanism for the upward flow, capillary action, is promoted by small scale capillaries, while the water moves much more easily through large-scale channels. The reason for this is that the capillary pressure increases with 1/R, while the permeability Kij and thus the flow rate is proportional to R2, where R is the typical length dimension of the problem, e.g., a pore radius in a porous medium or the size of particles of the porous medium. In the following, we have chosen to use the size of the particles (fibers), while it is also possible to include the porosity in the expression [27,28].

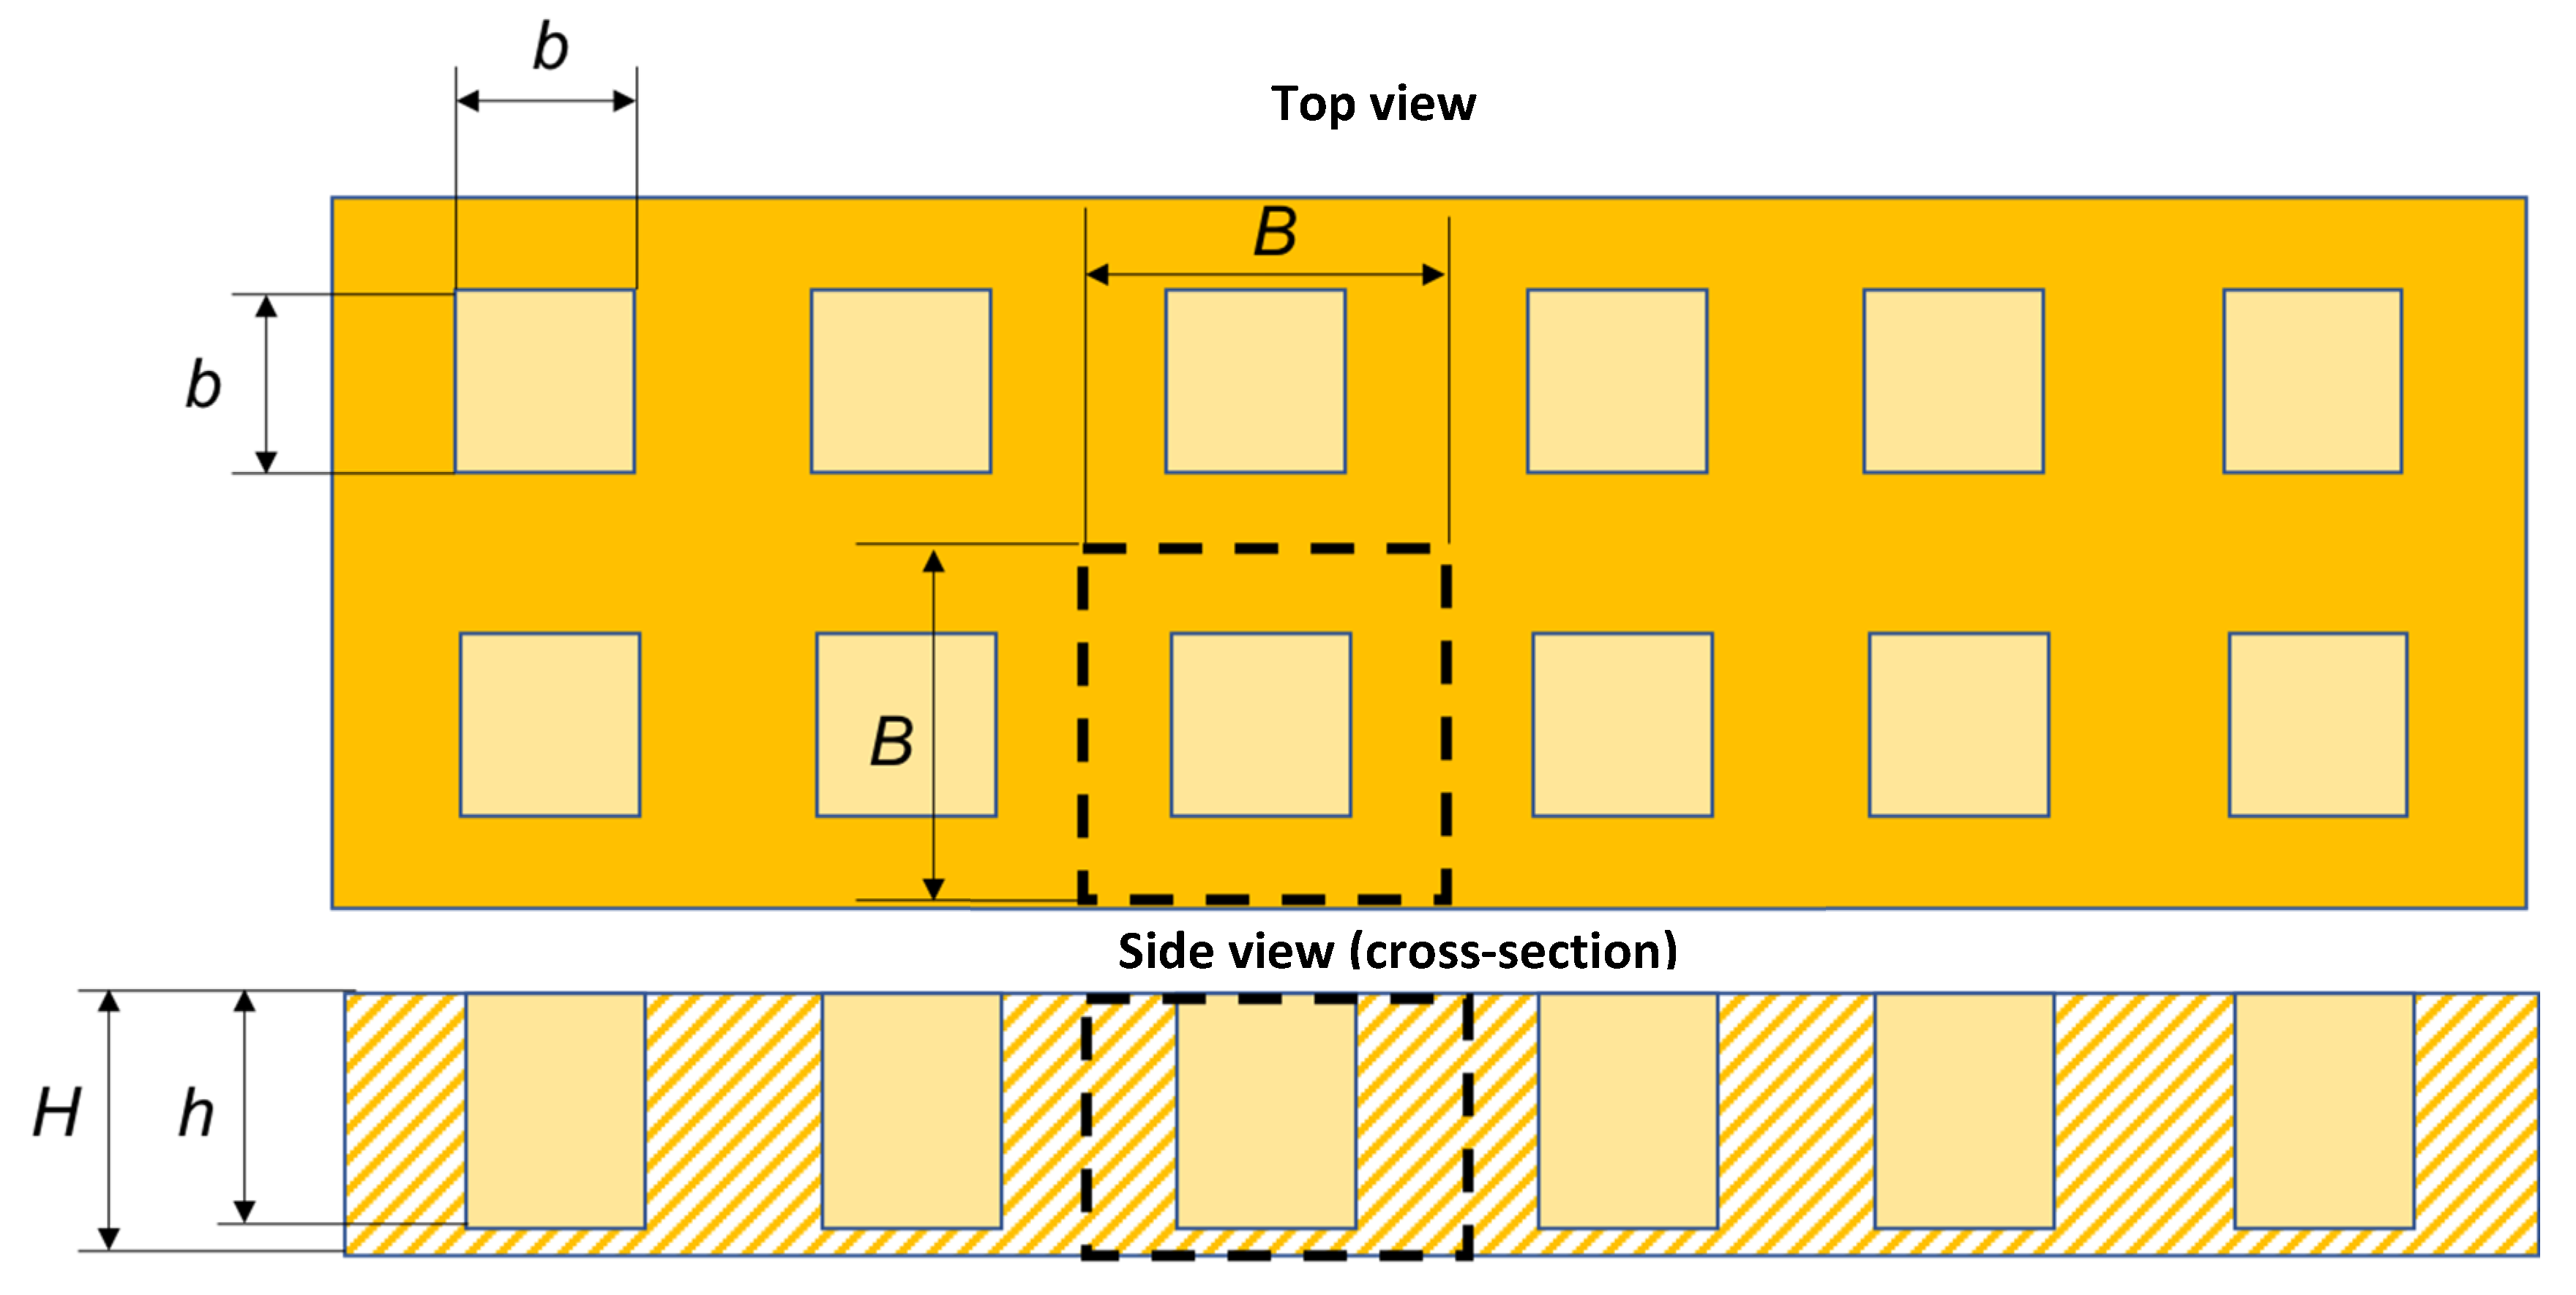
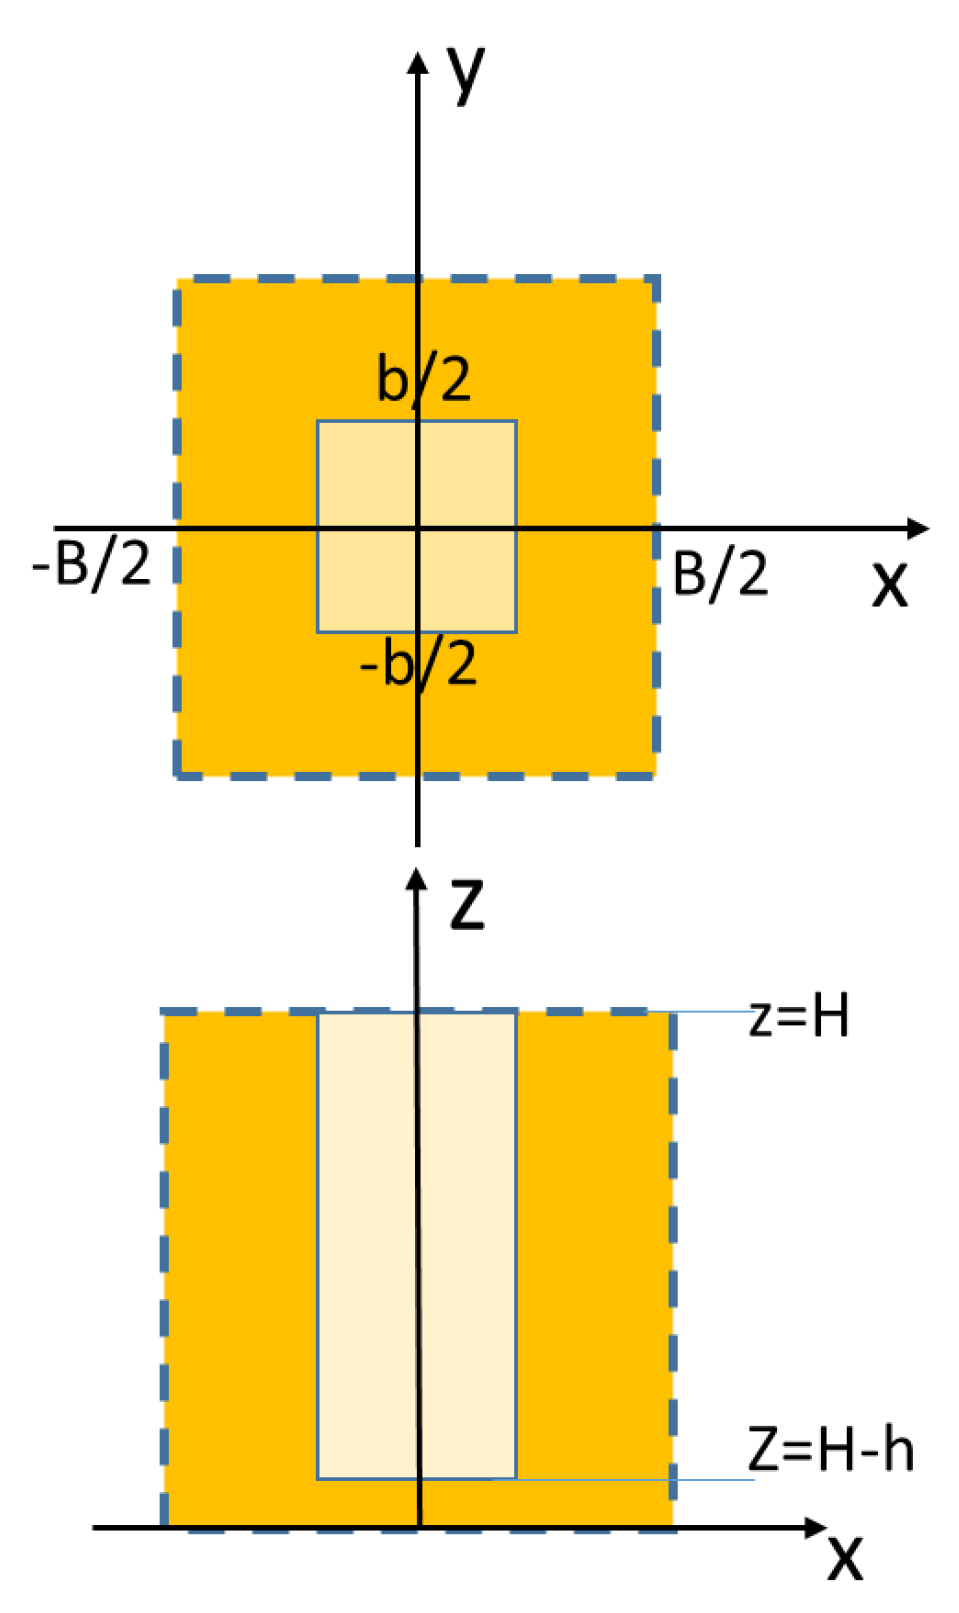
2.3. SPB Process and Geometric Parameters

As briefly mentioned in the previous section, there are several parameters of SPBs that can be tuned up for optimal performance. Relevant values of the most significant among these parameters are discussed here in more detail.

2.3.1. Down-Flow SPB Storage: Parameters

The magnitude of the diffusion coefficient of water entering the Down-flow SPB storage, D, is determined by the properties of the absorbing material, the composition of water, and conditions at the site. It is, therefore, desirable to find a combination of such characteristics that maximizes D. One group of efficient absorbers of water are hydrogels. For example, Bajpai [34] derived values of D between 6 . 9   ×   10 9 and 1 . 3   ×   10 8 m2/s for a hydrogel based on Acrylamide doped with different concentrations of maleic acid. Doll et al. [35] measured values between 1 . 3 1 . 4   ×   10 9 m2/s for two types of bio-based hydrogels, and El-Hamshary [36] tested a number of variants of poly(acrylamide-co-itaconic acid) hydrogels and obtained values between 3 . 0 × 10 10 1 . 2 × 10 8 m2/s. Hence, there is a broad range of D values in the literature, depending on the hydrogel composition. Following Bajpai [34], D is here approximated as 1 . 0 × 10 8 m2/s, which falls into the upper end zone of the results reviewed but is short of the maximum.
Regardless of D, the rate of water uptake is enhanced by a large area of contact between the absorbing material and the water, Aab, as shown in Equation (3). So instead of using a flat surface area of the absorbing material the interface with the water should be corrugated in some way. As an example, let us study a prismatic block of absorbing material, with a plan view area, Aflat, height (thickness) H, and a grid arrangement of relatively small cavities, with a square cross-section b × b in plan, and depth h, shown in Figure 2. In such a simplified porous medium body, repeating square cells can be described by a plan dimension (side B), and height H, in Figure 2. Now also let b′ = b/B and h′ = h/B and observe that 0 < b′ < 1 and 0 < h′< H/B. The total contact area between the water and the absorbing material may now be derived as:
A a b = A f l a t ( 1 + 4 b h )
and for a maximum value of h′, Equation (8) becomes
A a b = A f l a t ( 1 + 4 b H B )
The absorbing area increases with b′ but, as stated above, the theoretical maximum value of b′ equals one. In practice, the actual value should be smaller, around 0.5, to maintain a sufficient volume of the absorbing material. More interesting is the ratio H/B. Realistically, the upper limit H is constrained, while B is fairly arbitrary and sets the scale of the cavities. Finally, Equation (9) may be generalized to:
A a b = A f l a t ( 1 + C b H B )
where C is a constant equal to 4 for the geometry in Figure 2 and π for cylindrical cavities, for instance. As shown by Equations (3) and (4) the flow rate into the absorbing material is directly related to the gradient of θ(r,t), which will decrease as the absorbing material becomes saturated.
In Section 2.6, the sensitivity of the above parameters will be discussed with the combinations of values listed in Table 1 as a base and with h = H. In Table 1 it can be seen that, as the unit cell length scale B decreases, the number of square cavities increases for the same plan-view area. Hence, the area exposed to water, Aab, increases substantially.

2.3.2. Up-Flow SPB Storage: Parameters

Up-flow SPB storage is schematized as a model cylinder consisting of a solid cylinder with radius δ and height Hs, a porous inner annulus with a larger radius a and height Hi, and a porous outer annulus with a larger radius b and a height Ho (see Figure 3). The solid cylinder mimics a tree or lamp post, and the inner and outer annuli confine the porous media, cf. Figure 1b and Figure 3. The porosities are ϕi and ϕo, respectively, the geometrical scales of the porous media are Ri and Ro, respectively, and the origin of a cylindrical co-ordinate system (x, r, θ) is located at the center of the solid cylinder base (Figure 3). The actual dimensions of the cylinders are arbitrary, and so are the values of R and ϕ, but to make the cylinder an effective absorber (RiRo), we set Ri < Ro. By applying this model, the water uptake, as a function of time, Qin(t), can be derived for various geometries and conditions, and the Up-flow SPBs can be evaluated. Now, as an additional assumption, let the porous media consist of solid vertical rods with radii Ri and Ro, respectively, let the porosity ϕ be 0.7 in both annuli and let the temperature be 20 °C implying that the surface tension (water-air) is 72.8 mN/m. To simplify the model further, the radii are set to remain constant during the filling, and the porous media do not deform; hence, there is no swelling and perfect wetting is assumed, θ = 0. The sensitivity of the parameters of Up-flow SPB storage will be discussed in Section 2.6, based on the combinations of the values listed in Table 2.

2.4. Solutions of the Governing Equations

The governing equations are solved numerically for the two geometries considered. For the model of the Down-flow SPB, this is rather straightforward, while for the model of the Up-flow SPB some further analysis is required. Most of the derivations for the Up-flow SPB are presented in Supplementary Materials.

2.4.1. Down-Flow SPB Storage: Numerical Set-Up

A numerical scheme for Equations (2)–(4) and (10) is set-up in COMSOL Multiphysics® for the unit cell defined by dashed lines in Figure 4. Equation (2) is then solved with the boundary conditions specified in Equations (11)–(18). Notice that it is assumed that the height of the absorbing material is constant throughout the absorption process, hence the material will not swell in the model. Instead it is assumed that only 50% of the cell volume is occupied by the absorbing material making room for the water. These restrictions may be relaxed in future studies.
The problem is set up with periodic boundary conditions according to
θ ( B / 2 , y , z ) = θ ( B / 2 , y , z )   θ ( x , B / 2 , z ) = θ ( x , B / 2 , z )  
and the condition of no flux at the bottom can be expressed as
θ / z | z = 0  
Dirichlet boundary conditions for a concentration θ(r,t) = 0.5 at the boundaries specified by
x = b / 2 , | y | b / 2 , H h z H
y = b / 2 , | x | b / 2 , H h z H
| x | b / 2 , | y | b / 2 , z = H h
{ ( x , y ) , | x | B / 2 , | y | B / 2 } \ { ( x , y ) , | x | b / 2 , | y | b / 2 } , z = H
As an initial condition, it is assumed that θ = 0 in the volume Vab specified by the boundaries given by Equations (13)–(18) and z = 0.

2.4.2. Up-Flow SPB Storage: Numerical Set-Up

The capillary pressure, Equation (7), created between the rods within the annular clusters induces both radial and axial components of the flow. These components need to be calculated for each time step, depending on the positions of the flow front in both the inner and outer annular porous media, as illustrated in Figure 3. The pressures in the annular porous media are pi(x, r, t) and po(x, r, t), respectively, where the flow and pressure are assumed to be independent of the azimuthal co-ordinate and the fluid is set to be incompressible. The perpendicular, i.e., in the radial direction, and parallel permeabilities, i.e., in the axial direction, in the annular porous media are denoted as K i , , K i , , K o , , and K o , , respectively. Darcy’s law, Equation (5), may now be expressed as:
ϕ i K i , 2 φ i x 2 + ϕ i K i , 1 r r ( r φ i r ) = 0 ϕ o K o , 2 φ o x 2 + ϕ o K o , 1 r r ( r φ o r ) = 0
where the modified pressures are φ i = p i + ρ g x and φ o = p o + ρ g x , respectively, and g is the gravitational acceleration. The permeabilities in Equation (19) are chosen to be given by
K i , = 16 9 π 2 ( m a x b 1 ) 5 2 R i 2 K i , = 8 53 ( 1 b ) 3 R i 2 1 b 2 K o , = 16 9 π 2 ( m a x b 1 ) 5 2 R o 2 K o , = 8 53 ( 1 b ) 3 R o 2 1 b 2
where Π m a x = π / ( 2 3 ) in the case of hexagonal packing of the fibers [37] and Π b is the fraction of fibers. This is a simplification, but more advanced expressions, as e.g., derived in [38,39,40,41], can be used in future studies.
Equation (19) are set-up for the geometry and boundary conditions of interest according to Supplementary Materials, in which the derivations in [26] were followed, with two main differences: in the present model the finite widths of the channels are taken into account, and the gravity is considered. From this derivation the problem was solved in a semi-analytical fashion using MATLAB.

2.5. Verification of Numerical Solutions

By definition, the numerical derivations are approximations and need to be verified, as presented below.

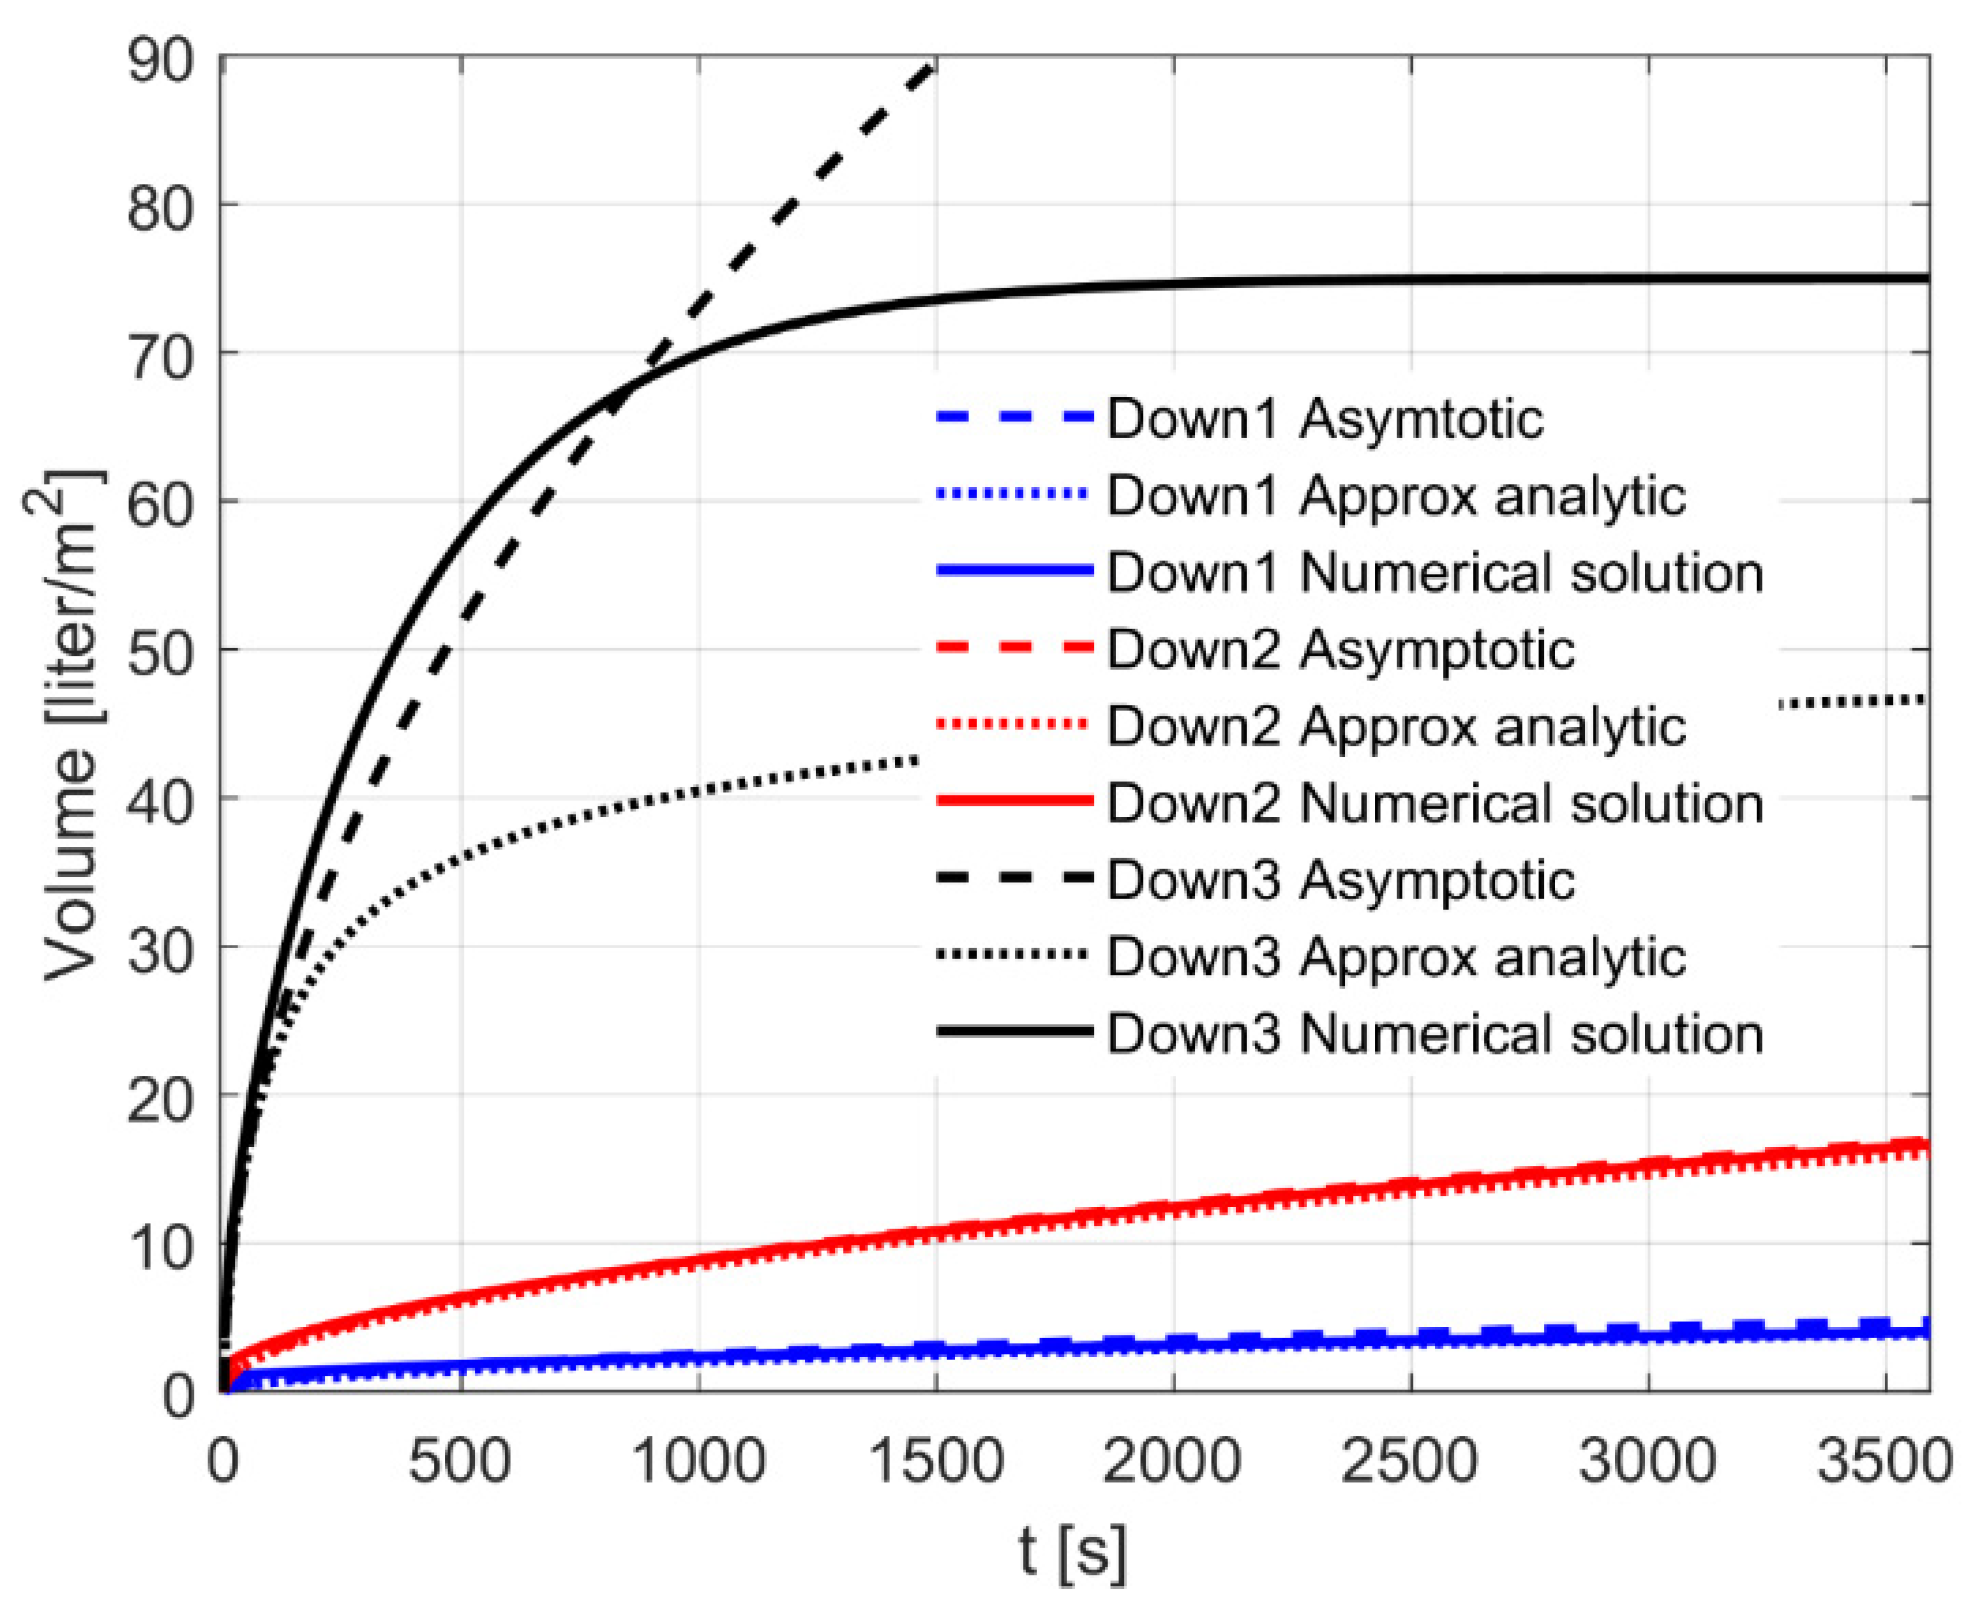
2.5.1. Down-Flow SPB Storage: Verification

To verify the robustness of the numerical results for the Down-flow SPB storage an approximate analytical solution was found. This approximate solution is valid as long as the boundary layers of thickness Δ, that are initially developing on all the boundaries given by Equations (13)–(18), are much smaller than the characteristic dimensions of the Down-flow SPB storage, i.e., Δ << b, B, H and h. Considering the different boundaries in Equations (13)–(18) separately, a similarity solution for each boundary is found. To exemplify, in the region from x = b/2 to x = B/2 the approximate solution is given by
θ ( x , t ) = 1 2 ( 1 e r f ( x b 2 2 D t ) )
Similar solutions can be obtained for the other four boundaries. The total volume of water absorbed into the volume V(t) as a function of time is then found by integrating the water concentration over the total volume Vab, according to Equation (4), yielding an approximate result given by
V ( t ) = B 2 H + 2 b h B 3 b 2 + 2 π ( B 2 + 4 b h ) D t H ( B 2 b 2 ) e r f ( H 2 D t ) b 2 ( H h ) e r f ( H h 2 D t ) 2 b h ( B b ) e r f ( B b 4 D t )   2 π D t ( B 2 b 2 ) e H 2 4 D t 2 D t π e ( H h ) 2 4 D t b 2 8 D t π e ( B b ) 2 16 D t
As an additional verification, a simple asymptotic solution valid for short times can also be found by expanding Equation (22) in the limit t 0 according to
V ( t ) = 2 π D t ( B 2 + 4 b h )
In addition to these expressions, the numerical results can be compared to the maximum possible uptake of water.
In Figure 5 the absorbed water volume diffusing into the volume Vab is plotted as a function of time for the three cases in Table 1 and for the three solutions. The solid line is the numerical result, the dotted line is the approximate analytical solution, Equation (22), and the dashed line is an asymptotic solution valid for short times, Equation (23). For cases Down1 (blue lines) and Down2 (red lines), the numerical and approximate analytical solutions overall agree quite well, but for short times there is a slight disagreement since the numerical solution cannot capture the rapid t1/2 initial development of the analytical solution. For case Down3 (black line), the agreement for short times is good, while for long times only the numerical solution fulfills the correct asymptotic volume of 75 L. The analytical solution here becomes invalid, because the boundary layers are no longer small compared to the dimensions of case Down3. It should be noted that Down1 and Down2 also approach the correct asymptotic volume, which takes a long time. The agreement with the analytical solutions and the final volume of water for all cases indicates that the numerical solution is correct.

2.5.2. Up-Flow SPB Storage: Verification

The results of the model can be verified and validated for the case of flow in a single channel with no porous medium, but including the effects of gravity. This is the famous experiment of capillary rise in a tube, with the well-known approximate analytical solution by Washburn [23]. More recently, Fries and Dreyer [42] found an exact analytical solution for this case and also tested it experimentally, with good agreement. For the case of flow in two annular regions, the maximum heights reached in the two channels (see Equation (25), in Supplementary Materials) can be verified by energy arguments. In the initial phase of the development of the fronts in each channel, when the interaction between the channels is zero, the expressions for the fronts Equation (24) in Supplementary Materials also agree with the results of Fries and Dreyer [42]. In Figure 6 a comparison is shown between the numerical results for the inner and outer channels given by Equations (22) and (23), in Supplementary Materials and the result obtained by using the analytical solution of Fries and Dreyer without any interaction. It is seen that, during this initial phase, in which there is a small interaction between the channels, the agreement is good. In the work by Zarandi et al. [27] the analytical solution by Fries and Dreyer [42] was also validated for porous media. In their case the porous medium consisted of several different kinds of glass-fiber wicks. The agreement between theory and experiments is good for several cases while for other cases there is a clear difference. The conclusion is that the disagreement in some cases can be derived from inhomogeneities, caused by ‘kinking’ fibers in the porous medium. Hence, the theory of Fries and Dreyer [42] provides an upper bound of the experimental data. In this context it is also important to mention that the surface energies (contact angle) may play an important role and that there are measures to reduce this angle as shown by Caglar et al. [29]. Including additional mechanisms, Caupin et al. [43] derived an upper limit for the capillary rise, which on the nano-scale was very large and exceeded Jurin’s law. Experimental evidence is still required.

2.6. Parameter Sensitivity

Before comparing the modelled SPB capacities to rainfall data, a brief parameter sensitivity analysis is performed.

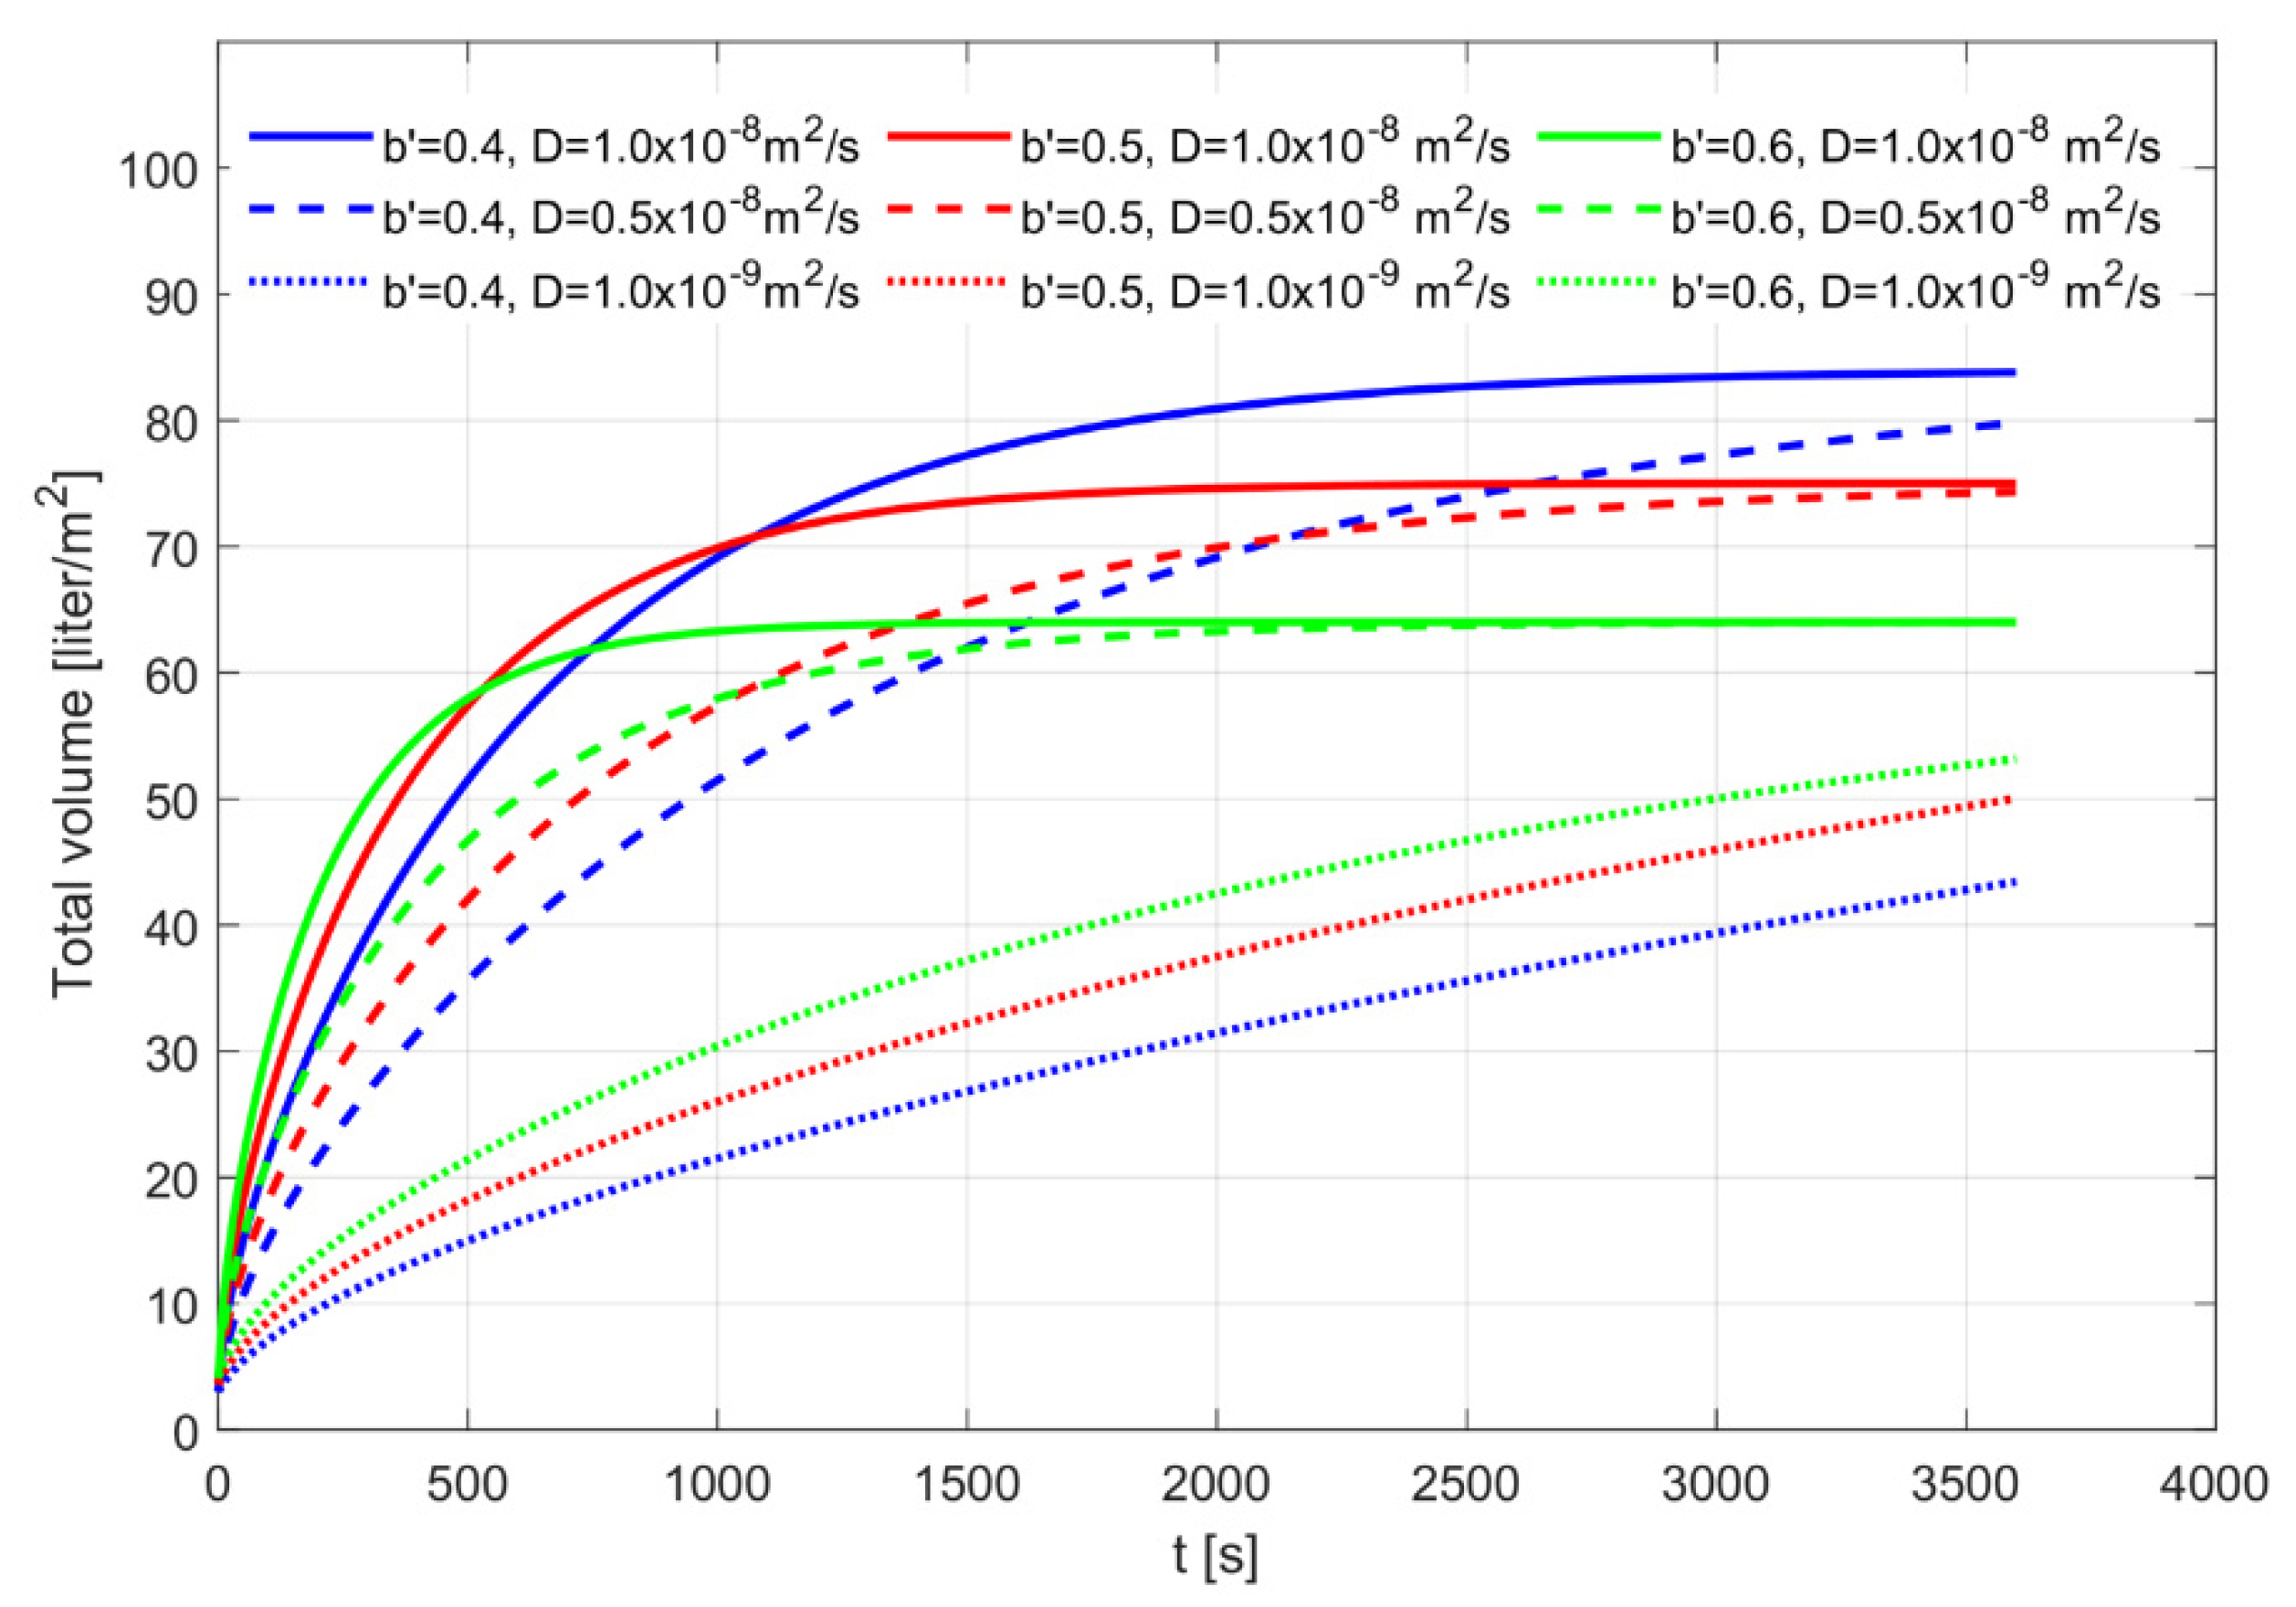
2.6.1. Down-Flow SPB Storage: Parameter Sensitivity

The value of B, which is the scale of water/SPB interface corrugations shown in Table 1 and Figure 2, influences the volumetric flow rate to a large extent, as evident from comparing the solid lines of different colors in Figure 5. Hence, the smaller the scale studied, the faster is the overall absorption process. For the smallest scale, Down3, where the sides of the open squares are 10 mm, the 1 m2 flat surface can absorb around 75 L in 15 min. The sensitivity of the results due to diffusion, D, is given by the absorbed volume dependence on square root of the diffusion coefficient, according to the asymptotic expression (23). It only affects the growth of the volume in time, not the total absorbed volume: see the difference between the solid lines D = 1 . 0 × 10 8 m2/s, the dashed lines, D = 0.5 × 10 8 m2/s, and the dotted lines D = 1 . 0 × 10 9 m2/s in Figure 7. In this context, the variation of the parameter b (=b/B, see Figure 2) is also interesting. Although this parameter should be set large for rapid growth, a large value of b   yields a smaller total volume of absorption, as best seen by scrutinizing the solid lines of different colors in Figure 7. Here blue lines denote b = 0.4 , red b = 0.5 , and green b = 0.6 . The effect of varying H is close to linear and increases both the initial rate of growth as well as the total absorption.

2.6.2. Up-Flow SPB Storage: Parameter Sensitivity

In all three cases in Table 2, one can anticipate initially fast inflows into both porous media, followed by a slowdown in the inflow (see Figure 8a,b). The graphs, however, reveal that, in the three cases studied, the water uptake differs. Initially the water uptake is fastest in case Up1, during the period 0 < t < 2 s, as shown in Figure 8a. Then, during a period up to slightly more than 100 s, the water uptake is greatest in case Up2, (Figure 8b). After that, the water uptake in the system with almost equal radii (Up3) dominates. Hence, the storage set-up with two porosities can be designed for both a fast water uptake, as well as the maximum volume of water uptake. The maximum water uptake is about 8, 20 and 46 L, for durations of 10, 100 and 1000 s, respectively.
The results may also be interpreted in terms of the water column height in the respective annuli. The maximum height is about 1.4 m for the cases studied, as exemplified by cases Up1–3 in Figure 9. The figure also shows that there is a large difference in the final height between the inner and outer annuli for Up1–2, which is unsatisfactory. Hence, having several annuli with different radii may make the dynamic storage structure more efficient, as a complement to using the porous media with less spread sizes of the fibers (Case Up3).
Concerning the other parameters in Table 2, it is obvious that the amount of water uptake will increase with an overall increase in δ, a and b (see also Figure 3). The effect of changing porosity (set in Table 2 as 0.7) is, however, less obvious and, therefore, such an effect is illustrated in Figure 10 where the color blue denotes ϕ = 0.6, red ϕ = 0.7 and green ϕ = 0.8 and the different line types represent the cases Up1–3. Hence, using sparser porous media will both speed-up the uptake and increase the maximum uptake of water and makes it evident that the porosity should be as high as possible, while keeping the capillary pressure sufficiently high.

3. Modelling the SPB Storage Interception of Short-Duration Design Rainfalls

From the hydrological point of view, two essential properties of SPB storage are the rates of inflow and the total storage volume, which should be selected according to the design rainfall characteristics. Ultimately, the SPB structures fully intercepting and storing the incoming rainwater would provide the highest attainable runoff control, but such a condition should not be viewed as a prerequisite in assessing the feasibility of SPB storage applications in stormwater control. One can envisage integrated storage designs, in which SPB storage would complement specific features of conventional storage (e.g., when applied as one of the layers of a green roof). Also note that LSMs, and even larger scale measures, are sometimes designed to partly bypass high flows, as noted, e.g., for green roofs by Shafique et al. [11]. With this in mind, capacities of SPB storage inflow rates and volumes are theoretically assessed in this section for specific Swedish short-duration extreme rainfall data adopted from Olsson et al. [44].

3.1. Inflow

Two types of inflow into stormwater storage can be distinguished: direct rainfall over the footprint of the storage facility, and indirect inflow diverted from adjacent drainage contributing areas. The indirect inflow generally exceeds the direct by a significant factor given by the ratio of contributing areas (Aindirect/Adirect). Direct inflow in wet weather can be determined from the local rainfall regime [44], and for the purpose of this study the following rainfall data were adopted from Swedish precipitation records (see Table 3): (a) 60-min block rainfalls of return period of 10-years, for southwestern and northern regions of Sweden (i.e., the regions with the highest and lowest annual precipitation depths, respectively), and (b) 60-min block rainfalls, with a 5-min high-intensity rainfall burst (starting at 27.5 min since rain onset), with the return period of 10 years, for the southwestern and northern regions.

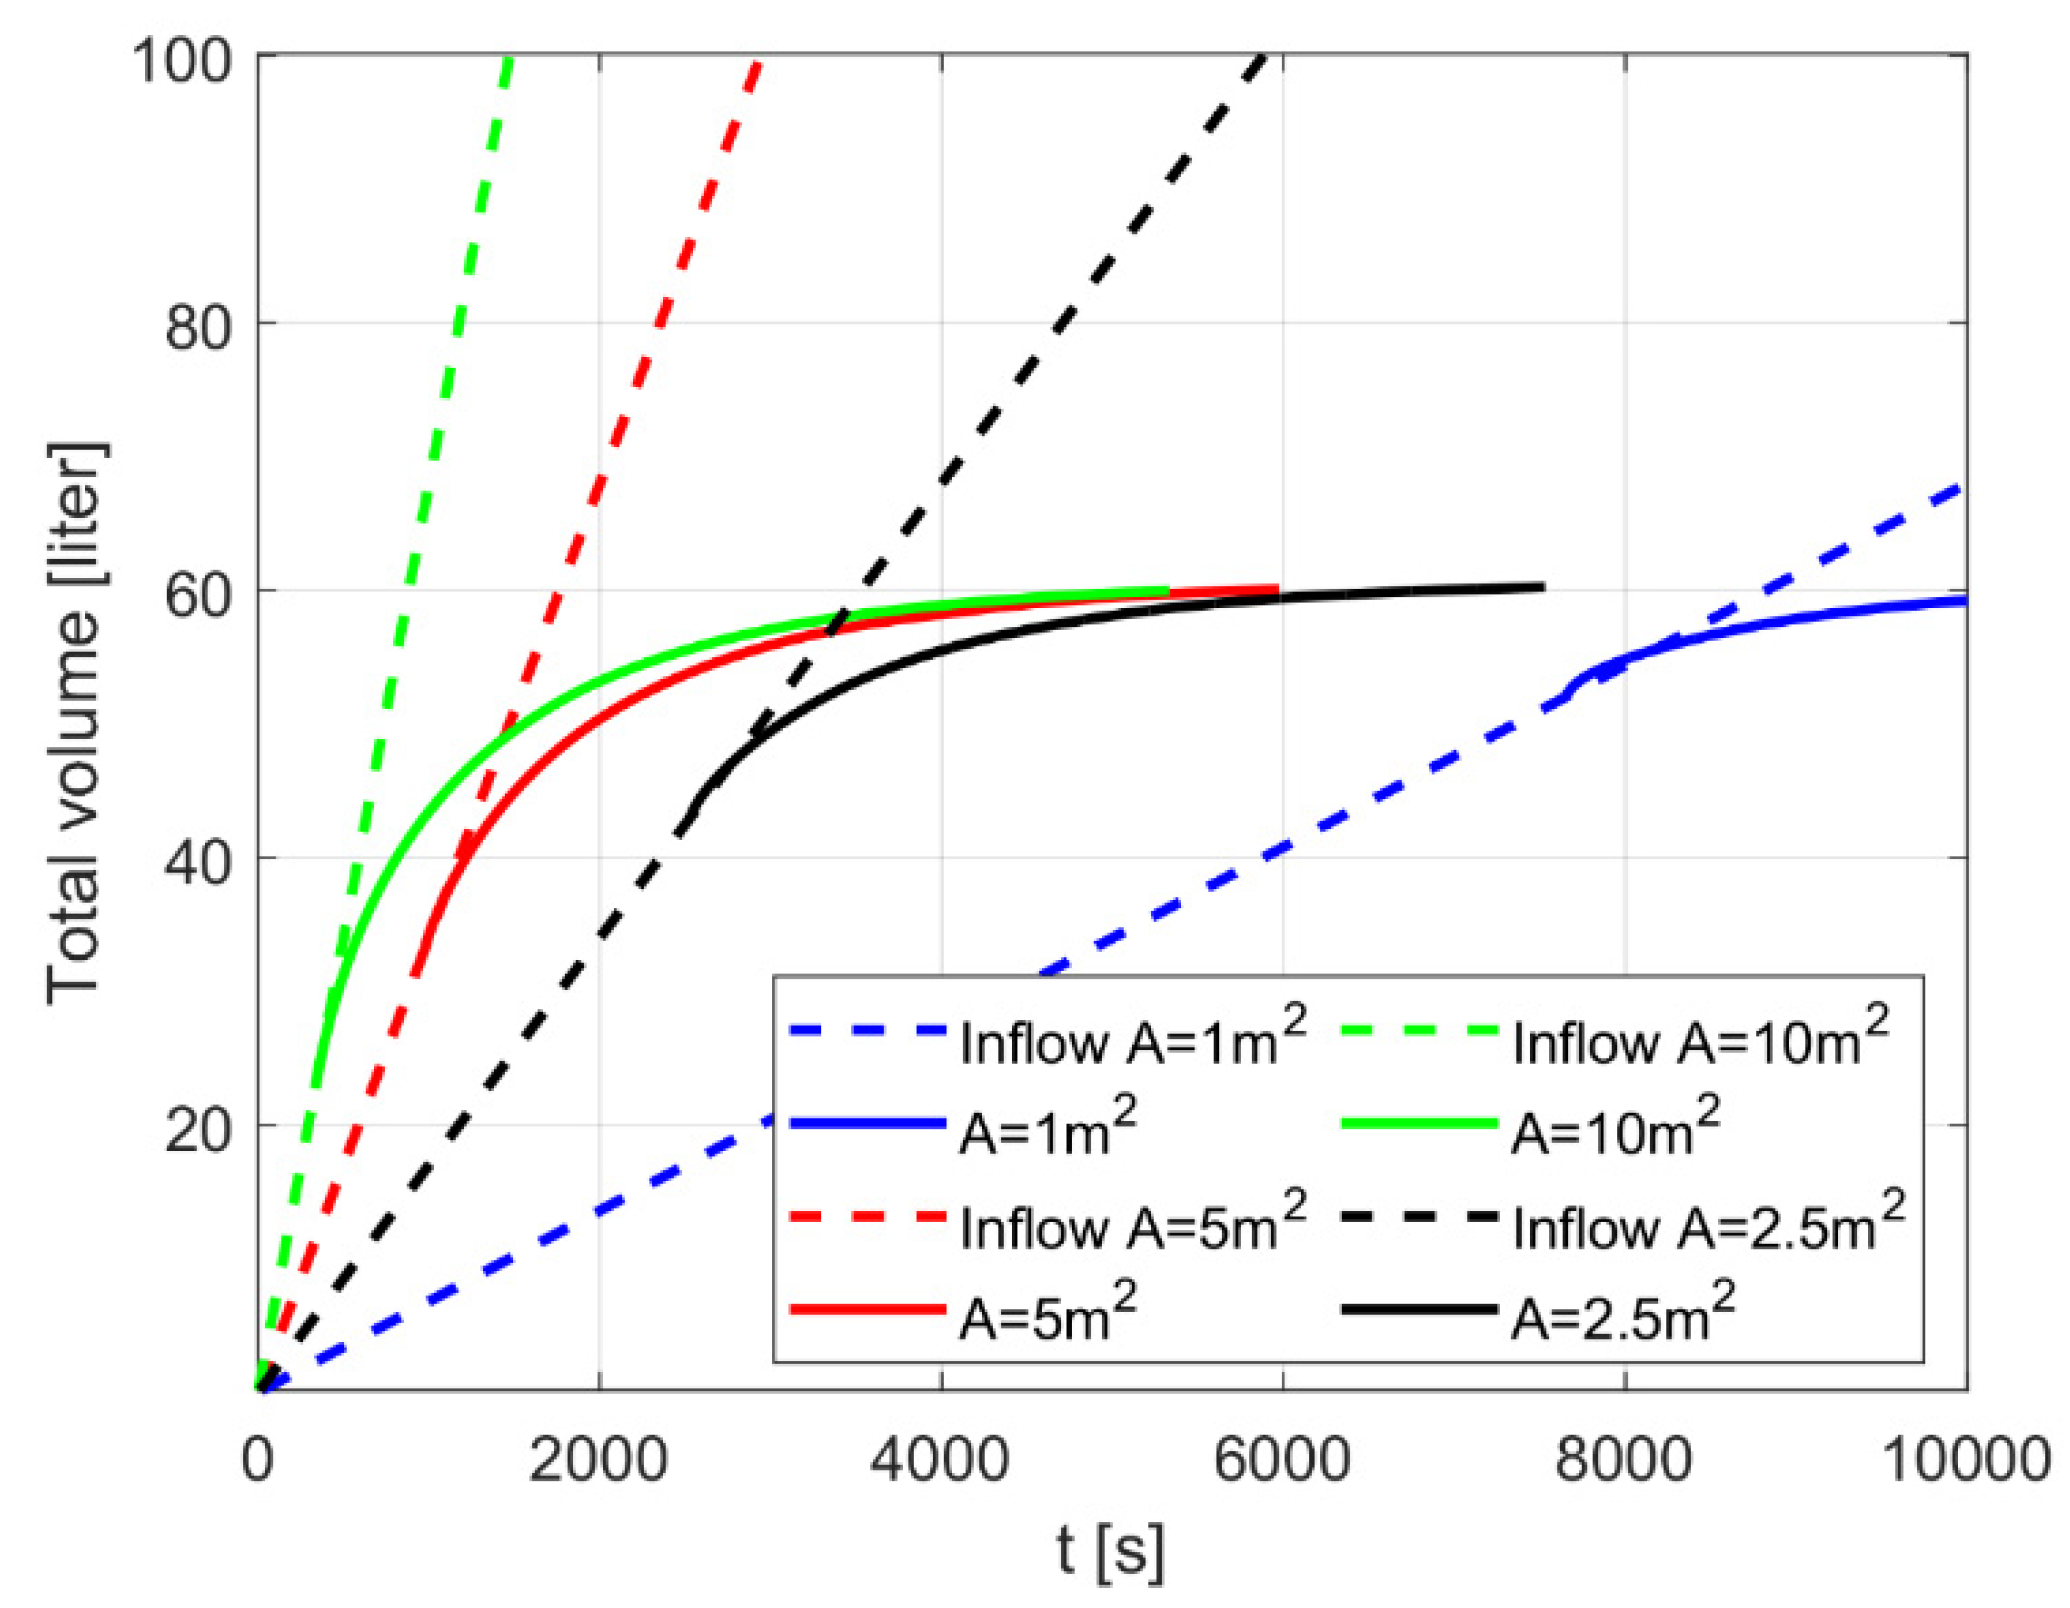
3.2. Comparison of Rainfall Volumes to Storage Capacities: Down-Flow SPB Storage

The Down-flow SPB storage provides a direct capture of rainwater, and the comparison between the numerical solution (black solid line) in Figure 5 (i.e., Down3) and the rainwater inflows from Table 3 reveals that the rainwater volumes for the two events in the two regions are fully captured in the case of Down3 (see Figure 11). It should be noted that the Down-flow SPB can capture more rainwater than that supplied; thus, in the Down3 case, there is some safety available should the storage capacity deteriorate for unknown reasons. This point will be further discussed towards the end of this section. It can be inferred from data in Figure 11 that the SPB storage concept proposed here has a great potential to capture and store all the rainwater associated with the short-duration extreme rainfall events studied.

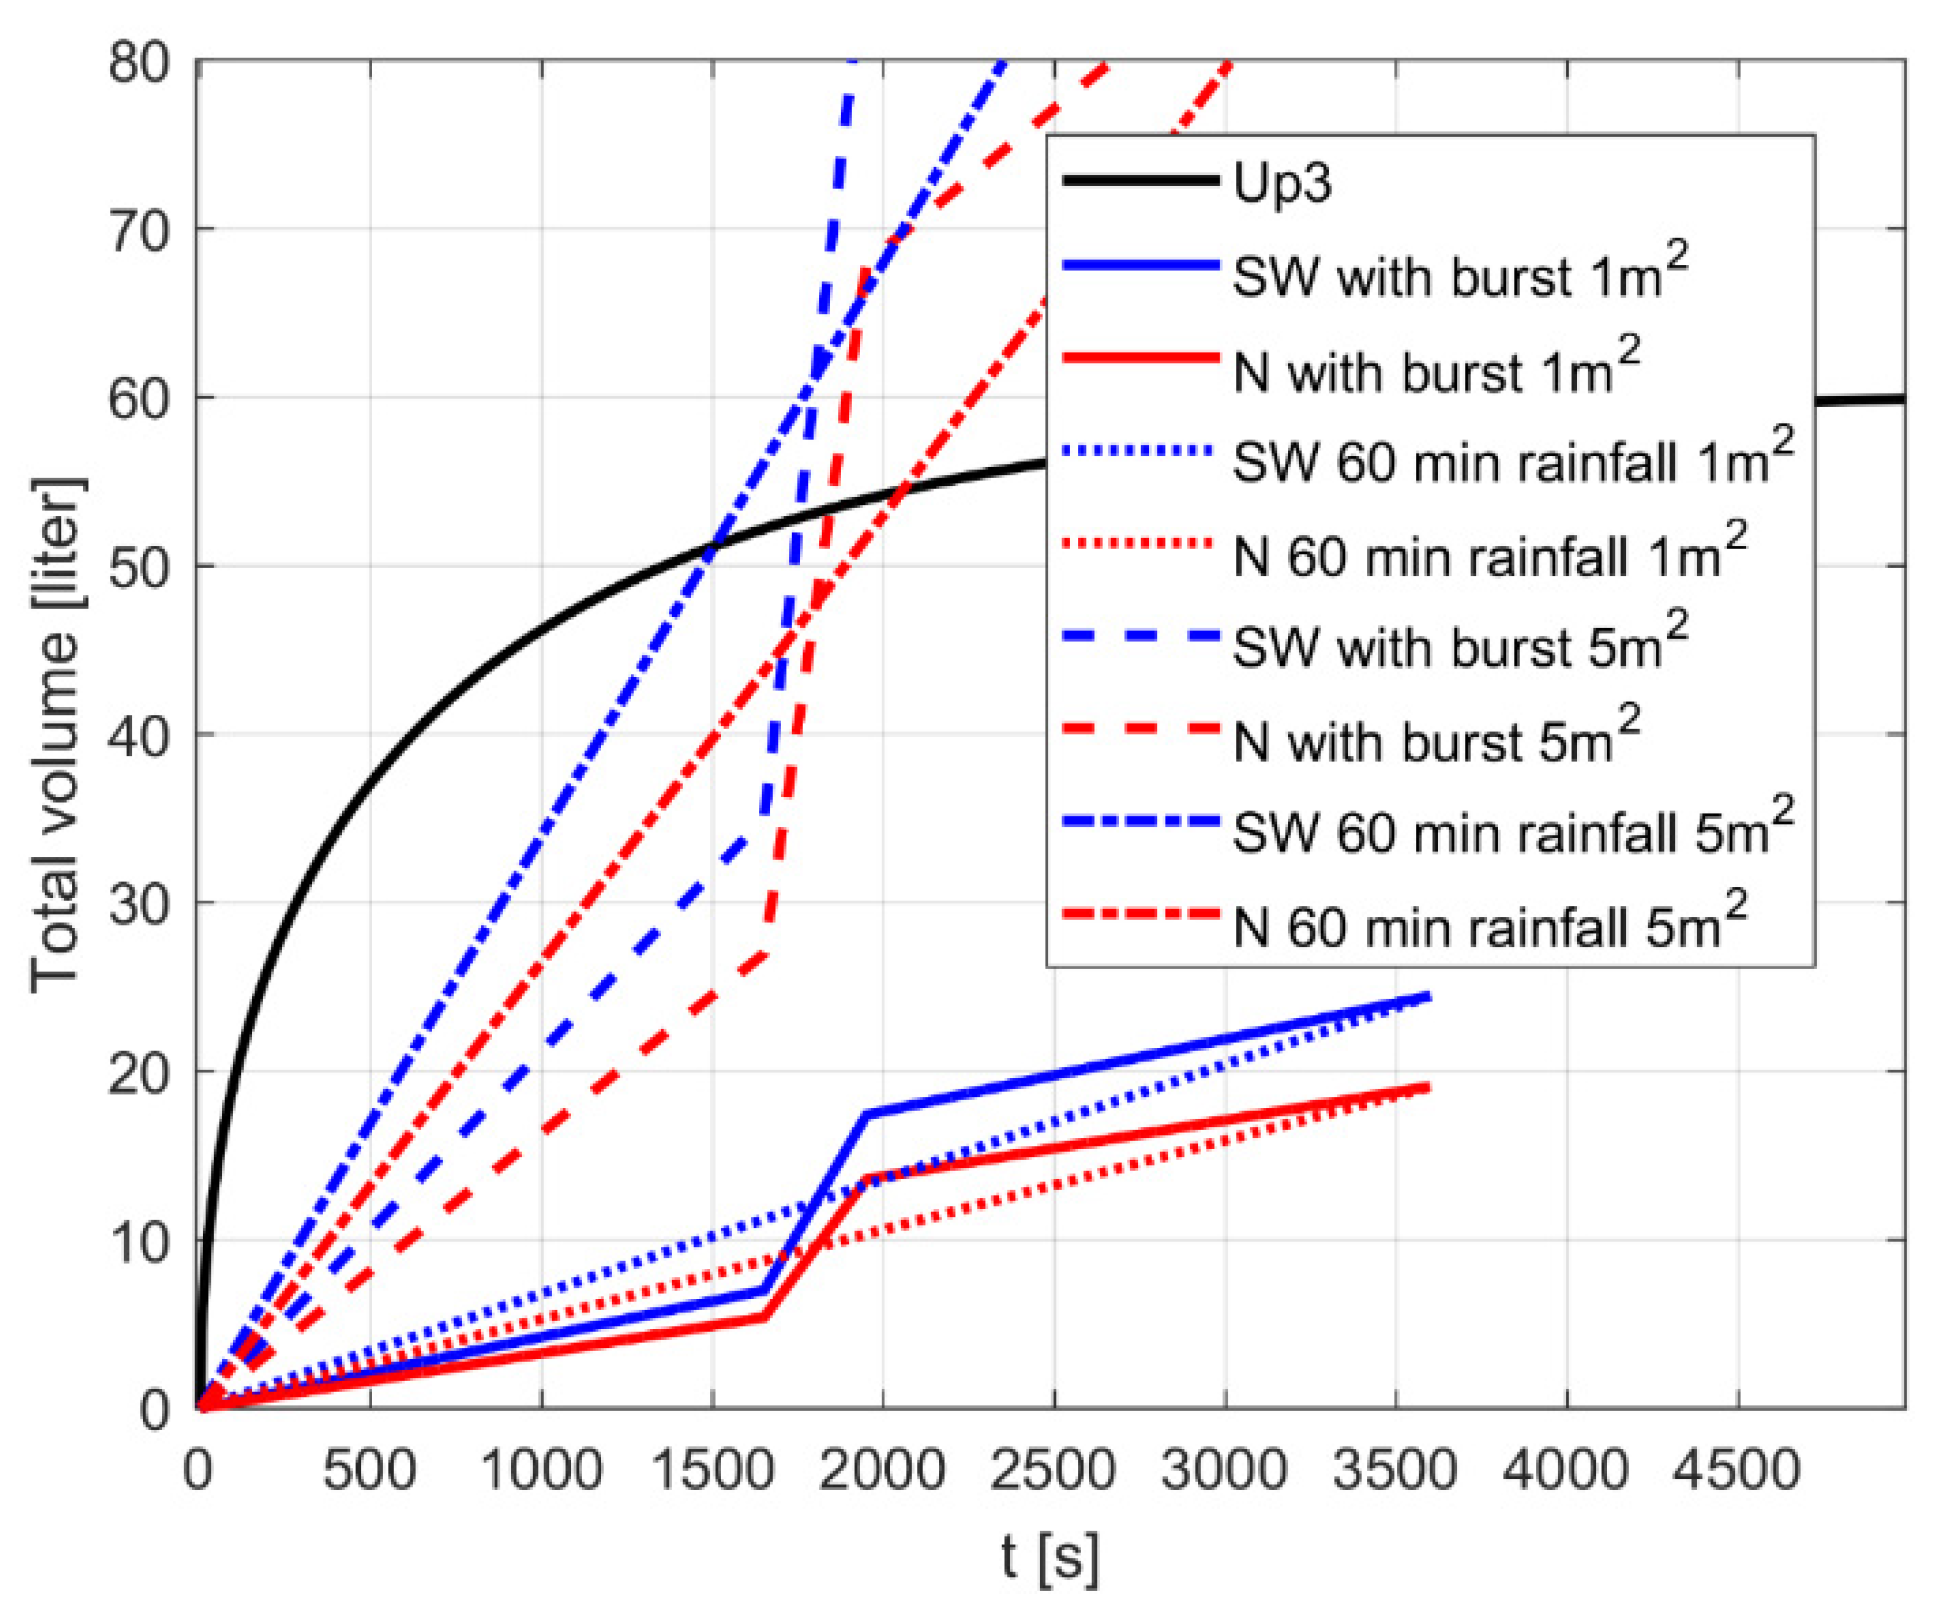
3.3. Comparison of Cumulative Rainfall Volumes and Theoretical Storage Capacities: Up-Flow SPB Storage

The Up-flow SPB storage, that has a minor footprint, is not intended to directly capture rainwater, but to store stormwater from a certain contributing area, draining into individual storage facilities. Hence, various contributing areas A should be considered for individual storage arrangements, formed by sets of SPB cylinders. Assuming that stormwater can easily enter the confined storage area without any losses along the flow path, the Up-flow SPB (green curve in Figure 8, case Up3) is compared to eight design rainfall scenarios in Figure 12. The scenarios are listed and were defined as follows: two regional rainfalls (SW & N), two events (60 min rainfalls with or without a high intensity burst), and two contributing areas, 1 and 5 m2. The comparison indicates that one Up-flow SPB storage unit per unit area, Up3/m2, has a greater storage capacity than needed to capture all runoff, but one storage unit/(5 m2) is not enough to capture all runoff, regardless of the design event or the geographical region. Nevertheless, the Up-flow SPB storage can collect a great amount of water, and with a high density of storage units, it would be feasible to capture all runoff. It should also be noted that, in terms of capacity, Up3 is merely the “best” case among the three cases studied, rather than an optimized solution.
In both comparisons, the SPB storage units modelled (i.e., Down-flow and Up-flow) could capture and store more water than available early during the rainfall event, which is physically impossible. For a more realistic comparison between the cumulative rainfall volume and storage filling, the numerical model for the Up-flow case was modified to handle events with a constant rate of inflow. Using this new model and focusing on Case Up3 with the largest uptake of water during the first 60 min, it appears that at the beginning of the rainfall event, the inflows into the Up-flow SPB storage follow the SW region runoff inflows for various contributing areas: 1, 2.5, 5 and 10 m2 (see Figure 13). After some time, depending on the contributing area, the storage can no longer fully capture runoff from respective areas. For the area of 2.5 m2, this tipping point occurs just before the 60-min rainfall event ends, and hence, the SPB unit can almost capture runoff from a contributing area of 2.5 m2, exposed to the SW region design event with a uniform intensity (see the black dashed and dashed lines in Figure 13). Therefore, this finding provides evidence that the presented Up-flow SPB concept has great potential for controlling runoff. A similar comparison for the Down-flow SPBs would yield the same conclusion. Notice that the comparison will hold also for multiple closely time-spaced rain showers.

4. Discussion

The discussion focuses on the following aspects of SPB storage: potential role of SPB storage in stormwater management, water uptake (speed and volume) and its modelling, filtration of stormwater by SPBs, and other practical considerations.
Analysis of the SPB storage concept presented here places this type of storage into the category of ‘best practice’, serving to manage stormwater at the smallest scale, i.e., the lot or site level (defined earlier as LSMs). While the quantified effect of a single measure on the catchment runoff is not measurable, the overall benefit of many such measures throughout the catchment is significant as argued, e.g., in the case of green roofs [45]. Furthermore, these localized distributed measures are not required to intercept the incoming stormwater fully, because of their multiplicity and hierarchical placement in the upper reaches of the catchment. For example, another similar LSM, green roofs, on average retain 57–76% of incoming rainwater [45] and bypass the rest, to be intercepted by other downstream measures or be conveyed to the receiving waters. Functionally, Down-flow SPB storage compares favorably to gray roofs (i.e., roof storage without vegetation), but the literature on gray roofs is rather limited. In terms of storage filling, the Down-flow SPB storage was shown here to be capable of fully intercepting design rainfall from 10-year cool temperate climate events. Furthermore, one can also envisage the SPBs as part of an integrated system containing various control measures, in which SPBs complement other measures. Compared to green roofs, gray roofs or SPB storage measures would reduce the load of the storage structure on the roof, eliminate the weight of green roof vegetation substrate (typically 200 mm [45]) and avoid water quality issues connected with elution of green roof media. However, these benefits have to be measured against the ecological benefits of green roofs, even though Francis and Jensen’s review [17] points out that reports of green roof benefits in the form of ecosystem services are sometimes insufficiently documented. Up-flow SPBs have a limited footprint and could play a different role in local runoff management than down-flow SPBs, by forming vertical storage units, or, in the case of unsupported rods growing from the ground up, by temporarily retaining stormwater over infiltration soakaways, or ground depressions, and thereby increasing their effectiveness in reducing runoff.
The computational models presented in this study focused on the inflow to the storage facility, but the outflow of water during storage drawdown, at rates much lower than those of inflow, is also important and subject to ongoing investigation. There is a significant difference between the time scales of the inflow and outflow rates associated with design events: the former can be as short as 1 h [46] and the latter can be as long as 48 h, depending on the local rainfall regime [9]. Hence, the average outflow rate would be about 50 times smaller than the inflow rate of design events. Theoretically, water may be released, e.g., by changes in capillary action, by mechanisms applying pressure to stored water, and by evaporation of water into the atmosphere [47,48,49,50,51]. All three measures have different time-scales, and their design would need to meet the time limit on the full drawdown of the storage facility, typically specified as 48 h (such limits depend on the type of storage facility and the local rainfall regime).
For Down-flow SPBs, only fine particles will be present in the rainwater entering the SPB storage unit, and filtration may be a minor issue, but airborne materials, dust, leaves, twigs, and bird droppings may interfere with the transport of water into the absorbing material. One practical option would be to apply some pre-treatment of rainwater, in the form of diversion or screening [52]. Even with this simple pre-treatment, it is likely that impurities collected on the SPB surface would form a biological filtration layer (usually called “a cake” or “schmutzdecke”), as described, e.g., by Li and Davis [53] and Tien [54], but the SPB material itself should not be affected by the “particles”. However, the functioning of the storage will deteriorate when “particles” start to fill the cavities, serving to increase the interface area and cover the surface of the absorbing material as the cake is formed. This implies that the flow rates into and out of the storage would be impaired, while the amount of water that can be stored would remain about the same. This type of filtration can be modelled on various spatial scales and represents a possible topic for future research, e.g., building on the work of Tien [54], Li and Davis [55], Frishfelds et al. [56], Lundström et al. [57], and Zhou et al. [58]. From the operational point of view, “the cake” needs to be removed at certain time intervals, which is commonly achieved in practice by periodic flushing.
The Up-flow SPBs are also exposed to the entry of water carrying various materials (e.g., solids), chemicals (e.g., nutrients, dissolved organic matter), and fecal microorganisms attributed mostly to pets and wildlife droppings [59]. However, these SPBs should be less susceptible to clogging by larger particles, because of gravity forces acting on such particles in the direction opposite to that of flow (away from the filter membrane). In general, the storage structure needs to be designed to sustain its operation and functioning taking into account such influent quality. The first step for enhancing the storage structure operation would be, again, to include some kind of pre-treatment of the incoming stormwater (mostly settling, or screening). Even with pre-treatment, the SPB storage system needs to be able to handle solids of various sizes. Conceivably, fine particles could be allowed to enter into the vertical structures, in a process mimicking deep bed filtration, while larger particles would be filtered away, in the form of cake filtration, or deposition at the SPB structure foot. The advantage of this approach would be that the cake will have a relatively high permeability since it will consist of larger size particles/objects. When allowing smaller particles to enter the storage, the filtration process should not impair the flow rates to the same extent as in the case of cake filtration of such particles [57]. In addition, in this case, in-depth studies may be carried out for the dynamic storage itself, including porous media with various sizes of pore structures [55,60,61]. However, concerns about the porous material surface fouling will need to be addressed. While the treatment of stormwater by filtration in SPBs is a challenge for flow entry and storage filling, it offers a great opportunity for enhancing the stored stormwater quality. This dual functionality, providing both quantity and quality control benefits, would improve cost-benefit considerations of SPB storage facilities and their economic attractiveness.
In addition to the storage outflow, several practical issues of operating SPB storage may need to be resolved before starting prototype field testing: rainwater or stormwater filtration upon storage entry through the water/SPB interface, formation of biofilms impeding inflow (fouling), environmental concerns, resistance to damage or deterioration of SPB due to freezing, and safety of designs incorporating SPB storage. For filtration, the conditions at the point of inflow into SPBs are of high importance, i.e., the SPB performance in receiving, storing and treating rainwater or stormwater carrying suspended solids and chemicals. Consequently, when looking for practical applications of SPB storage, one should start with relatively “clean” waters (e.g., rainwater on rooftops).
The simulated test cases show that significant volumes of water can be stored relatively quickly in the SPB storage units analyzed and that the geometry of such units could be further optimized. The modelling experiments with relevant inflow rates resulting from short-duration design rainfalls furthermore indicate that the concepts presented could be used to contribute to the restoration of catchment hydrology and reduce runoff even during heavy rainfalls. Although the design rainfall events are generally developed for return periods ranging from 2 to 100 years [44], it is conceivable that the SPBs would be best applied within a lower range of return period, perhaps 2–25 years, and in an integrated manner with other types of storage, existing or planned, in the catchment. For example, the overflows from SPBs could be diverted to conventional storage, and vice versa.

5. Conclusions

Potential roles of dynamic water storage in sponge-like porous bodies (SPBs) in lot-level stormwater management were proposed and theoretically examined. To this end, mathematical analysis and numerical modelling, based on first principles, demonstrated that SPBs could be designed to fully capture Swedish design rainfalls of 1-h duration and the average return period of 10 years. Furthermore, such analyses demonstrated that the use of absorbing and/or porous media on several scales in self-driven storage designs can be optimized with respect to the theoretical maximum storage capacity and inflow rates. Hence, the potential of the concepts discussed is much greater than what could be presented in this paper. At the same time, it is evident that additional theoretical and experimental work is needed to advance the Technology Readiness Level of the proposed theoretical SPB concept beyond the current level.

Supplementary Materials

The following are available online at https://www.mdpi.com/2073-4441/12/8/2080/s1.

Author Contributions

Conceptualization, T.S.L. and M.V.; Formal analysis, T.S.L., H.O.Å. and I.A.S.L.; Funding acquisition, M.V.; Investigation, H.O.Å.; Methodology, T.S.L. and I.A.S.L.; Software, H.O.Å.; Visualization, H.O.Å. and I.A.S.L.; Writing—original draft, T.S.L., H.O.Å., I.A.S.L. and J.M.; Writing—review & editing, T.S.L., J.M., I.A.S.L., and H.O.Å. All authors have read and agreed to the published version of the manuscript.

Funding

This research was funded by VINNOVA (Swedish Governmental Agency for Innovation Systems) DRIZZLE—Centre for Stormwater Management grant number 2016-05176.

Conflicts of Interest

The authors declare no conflict of interest.

References

  1. Marsalek, J.; Jimenez-Cisneros, B.; Karamouz, M.; Malmqvist, P.-A.; Goldenfum, J.; Chocat, B. Urban Water Cycle Processes and Interactions; Taylor and Francis: Leiden, The Netherlands, 2008. [Google Scholar]
  2. Moussiopoulos, N.; Nikolaou, K. Environmental, social and economic information management for the evaluation of sustainability in urban areas: A system of indicators for Thesssaloniki, Greece. Cities 2010, 27, 377–384. [Google Scholar] [CrossRef]
  3. Burns, M.J.; Fletcher, T.D.; Walsh, C.J.; Ladson, A.R.; Hatt, B.E. Setting objectives for hydrologic restoration: From site-scale to catchment-scale. In Proceedings of the NOVATECH Conference, Lyon, France, 23–27 June 2013. [Google Scholar]
  4. Waters, D.; Watt, W.E.; Marsalek, J.; Anderson, B.C. Adaptation of a storm drainage system to accommodate increased rainfall resulting from climate change. J. Environ. Plan. Manag. 2013, 46, 755–770. [Google Scholar] [CrossRef]
  5. Toronto Region Conservation Authority. Evaluation of Residential Lot Level Stormwater Practices; Toronto Region Conservation Authority (TRCA): Toronto, ON, Canada, 2013.
  6. Marsalek, J.; Schreier, H. Innovation in stormwater management in Canada: The way forward. Water Qual. Res. J. 2009, 44, v–x. [Google Scholar] [CrossRef] [Green Version]
  7. Ministry of the Environment. Stormwater Management Planning and Design Manual; Ministry of the Environment: Toronto, ON, Canada, 2003.
  8. B.C. Ministry of Environment. Underground Stormwater Infiltration; Ministry of Environment: Victoria, BC, Canada, 2014.
  9. Minnesota Pollution Control Agency. Minnesota Stormwater Manual. Available online: https://stormwater.pca.state.mn.us/index.php?title=Main_Page (accessed on 29 January 2020).
  10. Hamouz, V.; Muthanna, T.M. Hydrological modelling of green and grey roofs in cold climate with the SWMM model. J. Environ. Manag. 2019, 249, 109350. [Google Scholar] [CrossRef] [PubMed]
  11. Shafique, M.; Kim, R.; Kyung-Ho, K. Green roof for stormwater management in a highly urbanized area: The case of Seoul, Korea. Sustainability 2018, 10, 584. [Google Scholar] [CrossRef] [Green Version]
  12. Campisano, A.; Modica, C. Rain water harvesting as source control option to reduce roof runoff peaks to downstream drainage systems. J. Hydroinform. 2015, 18, 23–32. [Google Scholar] [CrossRef] [Green Version]
  13. Palla, A.; Gneco, L.; Lanza, L.G. Hydrologic restoration in the urban environment using green roofs. Water 2010, 2, 140–154. [Google Scholar] [CrossRef]
  14. Cipoalla, S.S.; Altobelli, M.; Maglionico, M. Decentralized water management: Rainwater Harvesting, greywater reuse and Green roofs within the GST4Water Project. Proceedings 2018, 2, 673. [Google Scholar] [CrossRef] [Green Version]
  15. Gupta, R. Monitoring in-situ performance of pervious concrete in British Columbia—A pilot study. Case Stud. Constr. Mater. 2014, 1, 1–9. [Google Scholar] [CrossRef] [Green Version]
  16. Karczmarczyk, A.; Bus, A.; Baryla, A. Phosphate leaching from green roof substrates—Can green roofs pollute urban water bodies? Water 2018, 10, 199. [Google Scholar] [CrossRef] [Green Version]
  17. Francis, L.F.M.; Jensen, M.B. Benefits of green roofs: A systematic review of the evidence for three ecosystem services. Urban For. Urban Green. 2017, 28, 167–176. [Google Scholar] [CrossRef]
  18. Chan, F.K.S.; Thorne, C.R. “Sponge City” in China—A breakthrough of planning and flood risk management in the urban context. Land Use Policy 2018, 76, 772–778. [Google Scholar] [CrossRef]
  19. Zhang, S.; Li, Y.; Ma, M.; Song, T.; Song, R. Storm water management and flood control in sponge city construction of beijing. Water 2018, 10, 1040. [Google Scholar] [CrossRef] [Green Version]
  20. Li, N.; Qin, C.; Du, P. Optimization of China sponge city design: The case of Lincang technology innovation park. Water 2018, 10, 1189. [Google Scholar] [CrossRef] [Green Version]
  21. Ahiablame, L.M.; Engel, B.A.; Chaubey, I. Effectiveness of low impact development practices: Literature review and suggestions for future research. Water Air Soil Pollut. 2012, 223, 4253–4273. [Google Scholar] [CrossRef]
  22. Ha, J.; Kim, J.; Jung, Y.; Yun, G.; Kim, D.; Kim, H. Poro-elasto-capillary wicking of cellulose sponges. Sci. Adv. 2018, 4, eaao7051. [Google Scholar] [CrossRef] [Green Version]
  23. Washburn, E.W. The dynamics of capillary flow. Phys. Rev. 1921, 17, 273–283. [Google Scholar] [CrossRef]
  24. Masoodi, R.; Pillai, K.M. Wicking in Porous Materials: Traditional and Modern Modeling Approaches; CRC Press: Boca Raton, FL, USA, 2012. [Google Scholar]
  25. Lundström, T.S.; Gustavsson, H.; Jekabsons, N.; Jakovics, A. Dynamics of wicking during filling of multi-scale porous media: Porous pore-doublet model, experiments and theory. AIChE J. 2008, 54, 372–380. [Google Scholar] [CrossRef]
  26. Frishfelds, V.; Lundström, T.S.; Jakovics, A. Lattice gas analysis of liquid front in non-crimp fabrics. Transp. Porous Media 2010, 84, 75–93. [Google Scholar] [CrossRef]
  27. Zarandi, M.A.F.; Pillai, K.M.; Kimmel, A.S. Spontaneous imbibition of liquid in glass fiber wicks, Part I: Usefulness of a sharp-front approach. AIChE J. 2018, 64, 294–305. [Google Scholar] [CrossRef]
  28. Zarandi, M.A.F.; Pillai, K.M. Spontaneous imbibition of liquid in glass fiber wicks, part II: Validation of a diffuse-front model. AIChE J. 2018, 64, 306–315. [Google Scholar] [CrossRef]
  29. Caglar, B.; Tekin, C.; Karasu, F.; Michaud, V. Assessment of capillary phenomena in liquid composite molding. Compos. A 2019, 120, 73–83. [Google Scholar] [CrossRef]
  30. Bajpai, S.K.; Singh, S. Analysis of swelling behavior of poly (methacrylamide-co-methachrylic acid) hydrogels and effect of synthesis conditions on water uptake. React. Funct. Polym. 2006, 66, 431–440. [Google Scholar] [CrossRef]
  31. Vo, H.N.; Pucci, M.F.; Corn, S.; Le Moigne, N.; Garat, W.; Drapier, S.; Liotier, P.J. Capillary wicking in bio-based reinforcements undergoing swelling—Dual scale consideration of porous medium. Compos. A 2020, 134, 105893. [Google Scholar] [CrossRef]
  32. Sweijen, T.; van Duijn, C.J.; Hassanizadeh, S.M. A model for diffusion of water into a swelling particle with a free boundary: Application to a super absorbent polymer particle. Chem. Eng. Sci. 2017, 172, 407–413. [Google Scholar] [CrossRef]
  33. Khayamyan, S.; Lundström, T.S.; Hellström, J.G.H.; Gren, P.; Lycksam, H. Measurements of transitional and turbulent flow in a randomly packed bed of spheres with particle image velocimetry. Transp. Porous Media 2017, 116, 413–431. [Google Scholar] [CrossRef] [Green Version]
  34. Bajpai, S.K. Swelling–Deswelling behavior of poly(acrylamide-co-maleic acid) hydrogels. J. Appl. Polym. Sci. 2001, 80, 2782–2789. [Google Scholar] [CrossRef]
  35. Doll, K.M.; Vermillion, K.E.; Fanta, G.F.; Liu, Z. Diffusion coefficients of water in biobased hydrogel polymer matrices by nuclear magnetic resonance imaging. J. Appl. Polym. Sci. 2012, 125, E580–E585. [Google Scholar] [CrossRef]
  36. El-Hamshary, H. Synthesis and water sorption studies of pH sensitive poly (acrylamide-co-itaconic acid) hydrogels. Eur. Polym. J. 2007, 43, 4830–4838. [Google Scholar] [CrossRef]
  37. Gebart, B.R. Permeability of unidirectional reinforcements in RTM. J. Compos. Mater. 1992, 26, 1100–1133. [Google Scholar] [CrossRef]
  38. Lundström, T.S.; Gebart, B.R. Effect of perturbation of fibre architecture on permeability inside fibre tows. J. Compos. Mater. 1995, 29, 424–443. [Google Scholar] [CrossRef]
  39. Lundström, T.S.; Frishfelds, V.; Jacovics, A. A statistical approach to permeability of clustered fibre reinforcements. J. Compos. Mater. 2004, 38, 1137–1149. [Google Scholar] [CrossRef]
  40. Chen, X.; Papathanasiou, T.D. Micro-scale modeling of axial flow through unidirectional disordered fiber arrays. Compos. Sci. Technol. 2007, 67, 1286–1293. [Google Scholar] [CrossRef]
  41. Papathanasiou, T.D.; Chen, X. The effect of certain morphological features on the permeability of clustered fibrous media. Polym. Polym. Compos. 2009, 17, 1–12. [Google Scholar] [CrossRef]
  42. Fries, N.; Dreyer, M. An analytic solution of capillary rise restrained by gravity. J. Colloid Interface Sci. 2008, 320, 259–263. [Google Scholar] [CrossRef]
  43. Caupin, F.; Cole, M.W.; Balibar, S.; Treiner, J. Absolute limit for the capillary rise of a fluid. EPL 2008, 82, 56004. [Google Scholar] [CrossRef] [Green Version]
  44. Olsson, J.; Södling, J.; Berg, P.; Wern, L.; Eronn, A. Short-duration rainfall extremes in Sweden: A regional analysis. Hydrol. Res. 2019, 50, 945–960. [Google Scholar] [CrossRef]
  45. Akther, M.; He, J.; Chu, A.; Huang, J.; van Duin, B. A review of green roof applications for managing urban stormwater in different climatic zones. Sustainability 2018, 10, 2864. [Google Scholar] [CrossRef] [Green Version]
  46. Berggren, K. Urban Stormwater Systems in Future Climates—Assessment and Management of Hydraulic Overloading. Doctoral Thesis, Luleå University of Technology, Luleå, Sweden, 2014. [Google Scholar]
  47. Beyhaghi, S.; Geoffroy, S.; Prat, M.; Pillai, K.M. Wicking and evaporation of liquids in porous wicks: A simple analytical approach to optimization of wick design. AIChe J. 2014, 60, 1930–1940. [Google Scholar] [CrossRef] [Green Version]
  48. Venturas, M.D.; Sperry, J.S.; Hacke, U.G. Plant xylem hydraulics: What we understand, current research, and future challenges. J. Integr. Plant Biol. 2017, 59, 356–389. [Google Scholar] [CrossRef] [Green Version]
  49. Cirkel, D.G.; Voortman, B.R.; van Veen, T.; Bartholomeus, R.P. Evaporation from (Blue-)green roofs: Assessing the benefits of a storage and capillary irrigation system based on measurements and modeling. Water 2018, 10, 1253. [Google Scholar] [CrossRef] [Green Version]
  50. Shi, W.; Vieitez, J.R.; Berrier, A.S.; Roseveare, M.W.; Surinach, D.A.; Srijanto, B.R.; Collier, C.P.; Boreyko, J.B. Self-stabilizing transpiration in synthetic leaves. ACS Appl. Mater. Interfaces 2019, 11, 13768–13776. [Google Scholar] [CrossRef] [Green Version]
  51. Xu, Z.; Pillai, K.M. A pore-network study on the factors influencing the isothermal drying of single- and dual-scale porous media. Dry. Technol. 2020. [Google Scholar] [CrossRef]
  52. Texas A&M University, AgriLife Extension. Rainwater Harvesting. Available online: https://rainwaterharvesting.tamu.edu/pre-storage-treatment (accessed on 29 January 2020).
  53. Li, H.; Davis, A.P. Urban particle capture in bioretention media. I: Laboratory and field studies. J. Environ. Eng. 2008, 134, 409–418. [Google Scholar] [CrossRef]
  54. Tien, C. Principles of Filtration, 1st ed.; Elsevier: Amsterdam, The Netherlands, 2012; ISBN 978-0-444-56366-8. [Google Scholar]
  55. Li, H.; Davis, A.P. Urban particle capture in bioretention media. II: Theory and model development. J. Environ. Eng. 2008, 134, 419–432. [Google Scholar] [CrossRef]
  56. Frishfelds, V.; Hellström, J.G.I.; Lundström, T.S.; Mattsson, H. Fluid flow induced internal erosion of porous media; Modelling of the No erosion filter test experiment. Transp. Porous Media 2011, 89, 441–457. [Google Scholar] [CrossRef]
  57. Lundström, T.S.; Frishfelds, V. Modeling filtration of particulate flow during impregnation of dual-scale fabrics. J. Compos. Mater. 2013, 47, 1907–1915. [Google Scholar] [CrossRef]
  58. Zhou, H.; Wang, G.; Jia, C.; Li, C. A Novel, coupled CFD-DEM model for the flow characteristics of particles inside a pipe. Water 2019, 11, 2381. [Google Scholar] [CrossRef] [Green Version]
  59. Müller, A.; Österlund, H.; Marsalek, J.; Viklander, M. The pollution conveyed by urban runoff: A review of sources. Sci. Total Environ. 2019, 709, 13625. [Google Scholar] [CrossRef]
  60. Rege, S.D.; Fogler, H.S. A network model for deep bed filtration of solid particles and emulsion drops. AIChE J. 1988, 34, 1761–1772. [Google Scholar] [CrossRef]
  61. Nordlund, M.; Fernberg, S.P.; Lundström, T.S. Particle deposition mechanisms during processing of advanced composite materials. Compos. A 2007, 38, 2182–2193. [Google Scholar] [CrossRef]
Figure 1. Theoretical concepts: (a) Down-flow sponge-like porous bodies (SPB) storage; (b) Up-flow SPB storage with the pre-installed vertical structures expanding horizontally; and (c) Up-flow SPB storage with new vertical structures growing up from the ground when absorbing water. Note that the SPB storage sketches presented in the figure are intended just to elucidate the theoretical concept of such storage, without any aesthetic, practical or placement considerations.
Water 12 02080 g001
Figure 2. Sketch of the computational model for studying the effect of an increased interface area (the cell of interest is marked with dashed lines).
Water 12 02080 g002
Figure 3. Principal sketch of the geometry (to the left) and flow patterns used in the modelling (to the right) of Up-flow SPB storage.
Water 12 02080 g003
Figure 4. Definition of the coordinate system.
Water 12 02080 g004
Figure 5. Water volume [L] captured per square meter with the Down-flow SPB storage studied as a function of time [s]. Blue curves: Down1, red curves: Down2, and black curves: Down3. Solid line: the numerical model, dotted line: analytical solution, and dashed line: asymptotic solution.
Water 12 02080 g005
Figure 6. Verification of the numerical solutions of Equations (22) and (23) in Supplementary Materials against the analytical solution of Fries and Dreyer [42] within the limits of short times (t ≤ 4 s).
Water 12 02080 g006
Figure 7. Total water volume per square meter captured by the Down-flow SPB storage (Down3) for various diffusion constants D and parameters b’ as a function of time. Graph lines: solid, D = 1.0 × 10 8 m2/s; dashed, D = 0.5 × 10 8 m2/s; and, dotted,   D = 1.0 × 10 9 m2/s. Graph colors: blue, b = 0.4 , red, b = 0.5 , and green, b = 0.6 .
Water 12 02080 g007
Figure 8. Water uptake [liters] as a function of time [s] for the three cases studied (Table 2). Graphs in the two panels correspond to two time intervals: (a) 0–1 min and (b) 0–1 h, respectively. Graph colors: the blue, red and green curves denote cases Up1, Up2 and Up3, respectively.
Water 12 02080 g008
Figure 9. The height of water column [m] as a function of time [s] for cases Up1, Up2 and Up3, listed in Table 2. The graph panels represent two time intervals, 0–1 min and 0–1 h, respectively. The blue, red and green curves represent cases Up1, Up2 and Up3, respectively. Dashed and dotted lines represent the height of the water column after the merging of fronts.
Water 12 02080 g009
Figure 10. The water uptake [L] as a function of time [s] for combinations of the three porosities and the cases Up1–3. Graph lines: solid Up1, dotted Up2, dashed Up3. Graph colors: blue ϕ = 0.6, red ϕ = 0.7, green ϕ = 0.8.
Water 12 02080 g010
Figure 11. Comparison between the Down-flow SPB storage filling (Down3, numerical solution) [L/m2] and the cumulative rainfall ([L/m2] data from Table 3) as a function of time [s]. The figure also demonstrates the storage capacity of the SPB.
Water 12 02080 g011
Figure 12. Comparison between the cumulative rainfall volume and Up-flow SPB (Up3) storage filling (black solid line) for various inflow scenarios: two climatic regions (N and SW), two shapes of rainfall hyetographs (block rainfalls without and with a high intensity burst; blue and red lines, respectively), and two runoff contributing areas (1 and 5 m2, respectively). The figure also demonstrates the storage capacity of the SPB.
Water 12 02080 g012
Figure 13. Comparisons of cumulative rainfall volumes and Up-flow SPB (Up3) storage filling (black solid line) for a constant rate of inflow (SW region) and various runoff contributing areas: blue—1 m2, black—2.5 m2, red—5 m2, green—10 m2.
Water 12 02080 g013
Table 1. Values of parameters for the modelling of the Down-flow SPB storage.
Case/
Parameter
D
[m2/s]
bH
[m]
B
[m]
Unit CellsAab
[m2]
Aflat
[m2]
C
Down11 × 10−80.50.2111.414
Down21 × 10−80.50.20.1100514
Down31 × 10−80.50.20.011 × 1044114
Table 2. Values of parameters used in a case study of Up-flow SPBs.
Case/
Variable
δ
[m]
A
[m]
B
[m]
ϕRi
(μm)
Ro
(μm)
Up10.050.10.150.710100
Up20.050.10.150.71050
Up30.050.10.150.71011
Table 3. Direct inflow of rainwater into storage.
EventDirect Rainwater Inflow Velocity (=Intensity) [m/s] per Unit Area [m2]
Southwest (SW)North (N)
Uniform intensity (also called the block rainfall) 60-min duration event, with return period 1:10 years 0.68 × 10 5
no preceding rainfall
0.53 × 10 5
no preceding rainfall
60-min duration event, with a high-intensity burst of 5 min, return period 1:10 years (the hyetograph was patterned after Berggren [46]) 3.47 × 10 5
Preceding rainfall (during the first 27.5 min) = 7 mm *
2.73 × 10 5
Preceding rainfall (during the first 27.5 min) = 5.4 mm *
* Note that the high-intensity burst occurs after some rain has fallen already during the first 27.5 min.

