1. Introduction
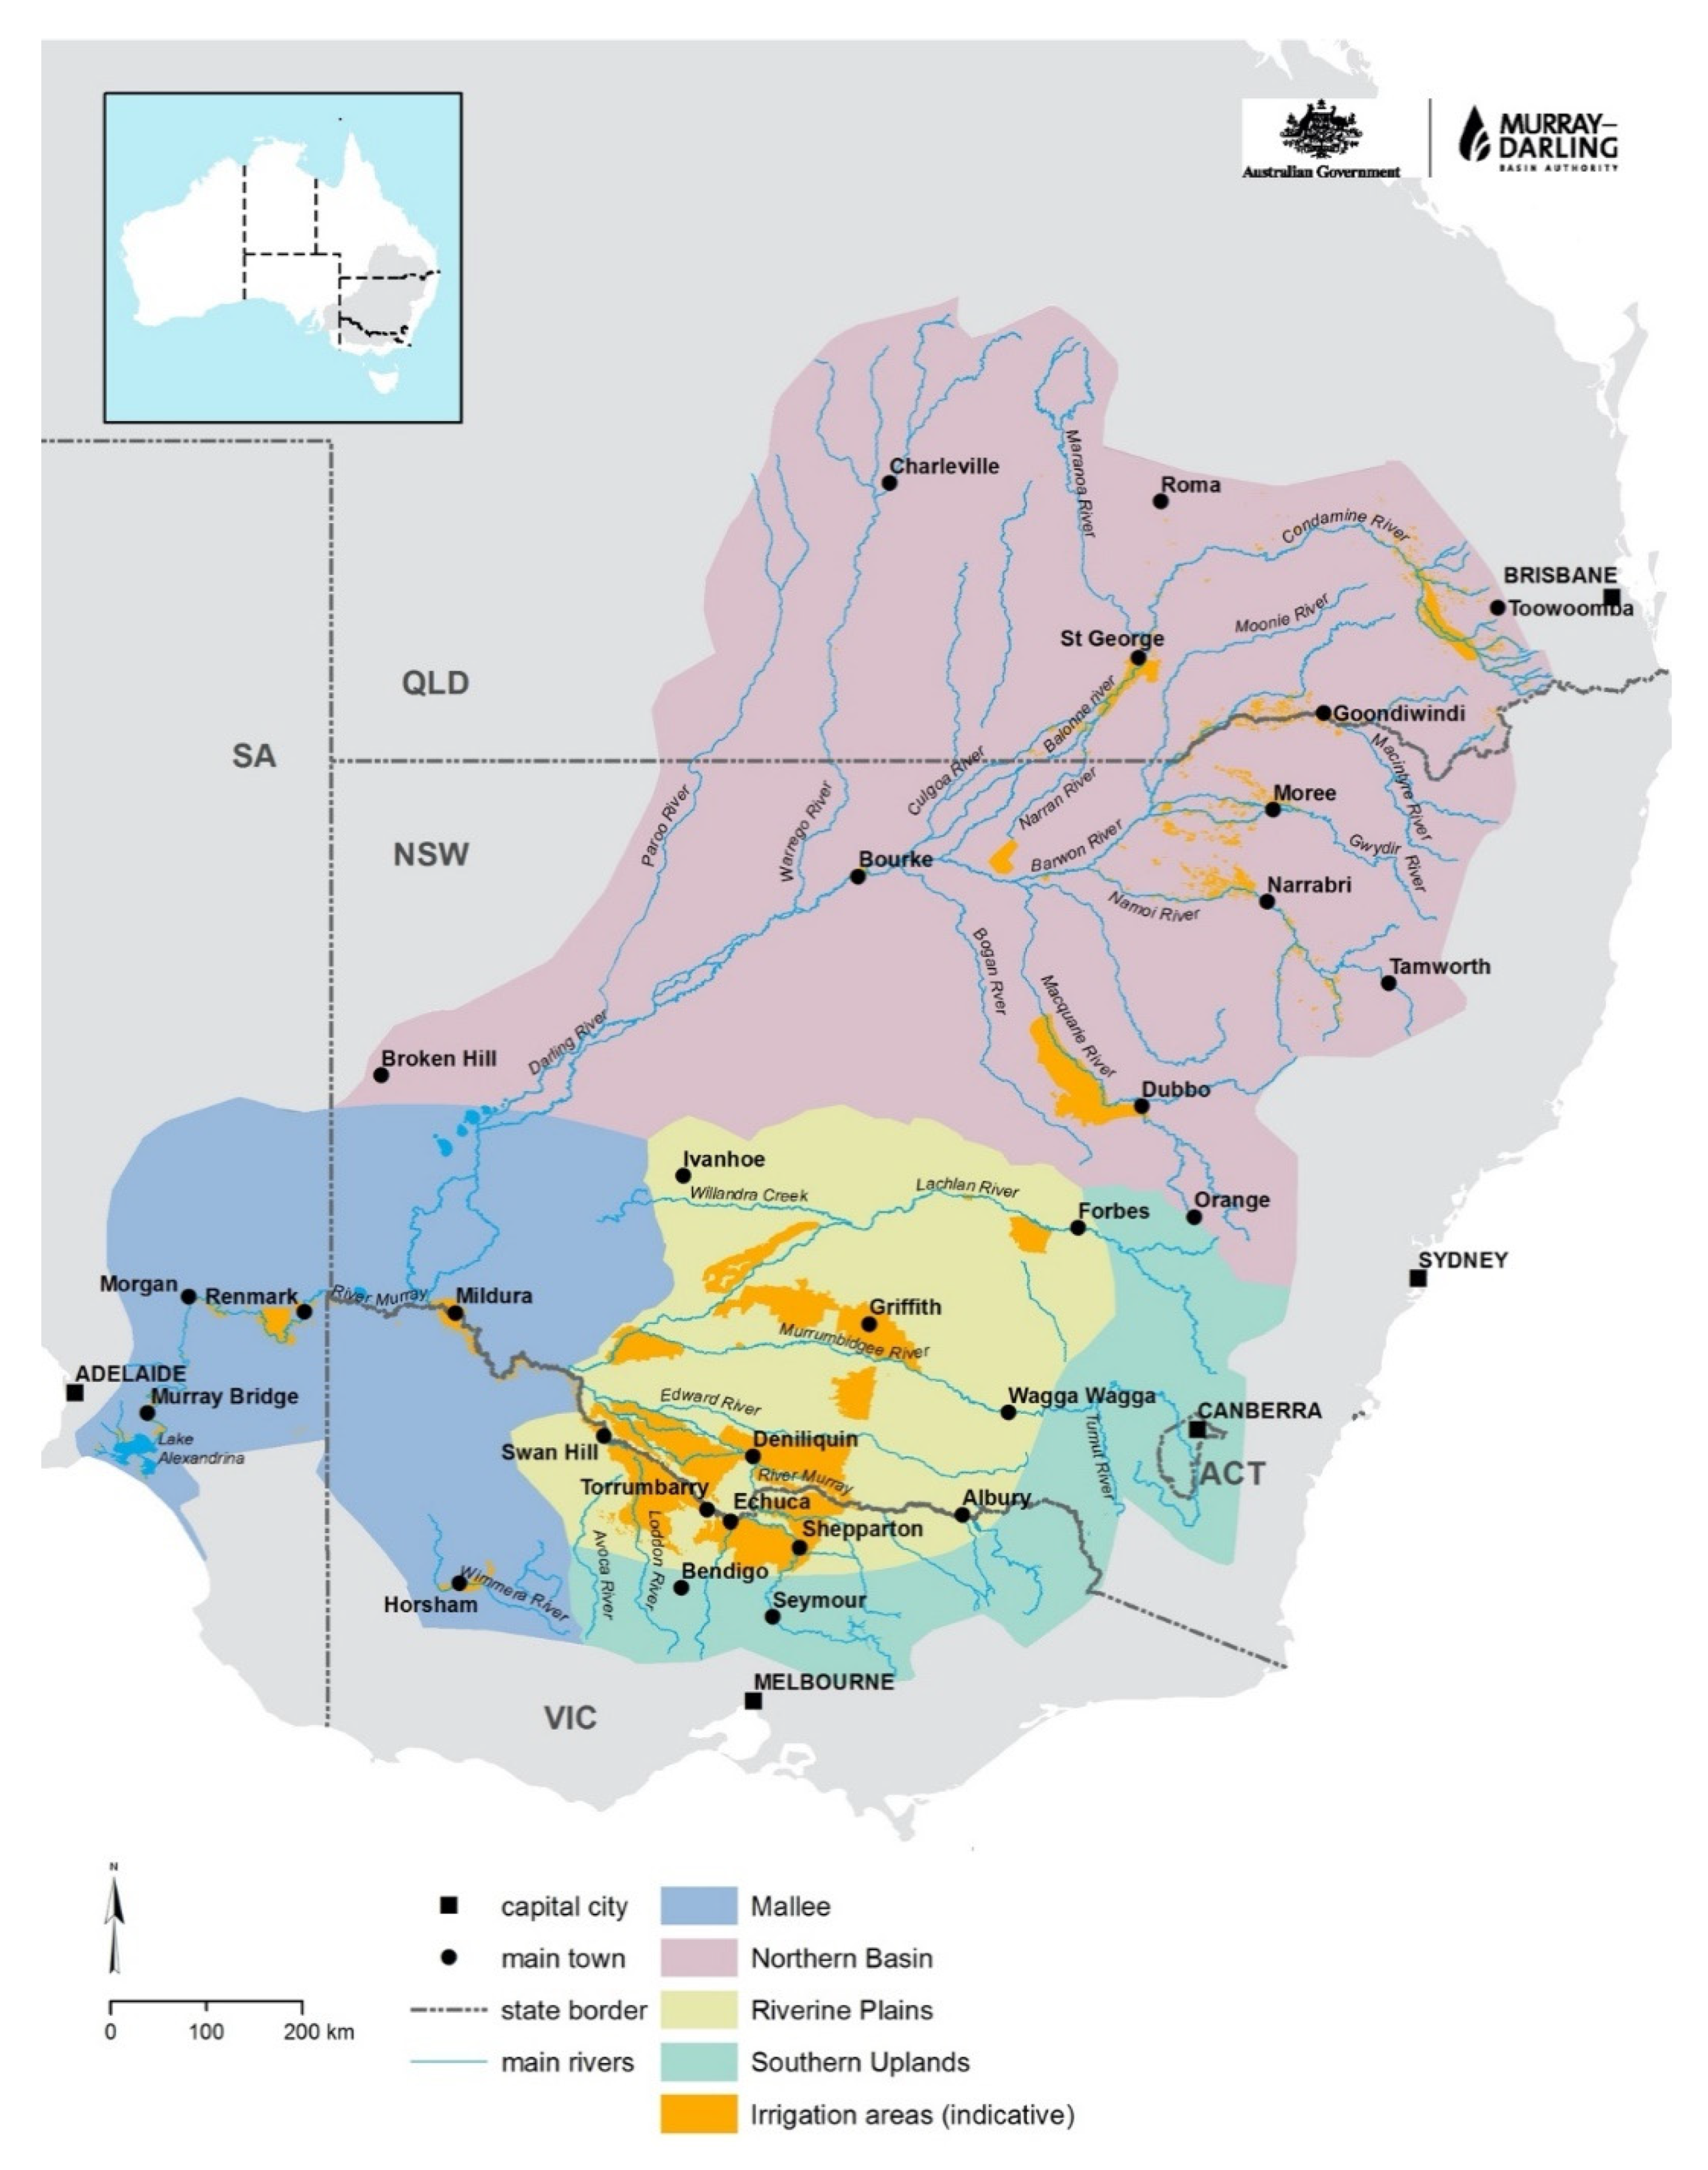
This paper is focused on salinity management in the Murray–Darling Basin (MDB), Australia, where issues associated with increased salinity have been apparent since the 1960s. The water quality of the River Murray has been a particular concern.
Salinity is not a new soil and water quality problem. Salinization was recorded as the cause of failure of earlier irrigation-dependent civilizations of Mesopotamia (now Iraq) and Peru (Viru Valley) [
1]. Salinization is found globally and is particularly severe in the Aral Sea Basin in Central Asia, the Indo-Gangetic Basin in India, the Indus Basin in Pakistan, the Yellow River Basin in China, the Euphrates Basin in Syria and Iraq, and the San Joaquin Valley in the United States [
2].
The MDB has several attributes that make it particularly vulnerable to salinity problems. Much of the MDB is semi-arid, with a low discharge of both groundwater and surface water to the ocean. This has led to the MDB having a naturally saline landscape. Across a large proportion of the MDB, and particularly the southern Basin, the underlying groundwater is highly saline. This salty groundwater results from millions of years of rainfall deposition, weathering of rocks and ancient ocean sediments leading to accumulation of salt in the landscape, with this salt only very slowly returned to the ocean via the Basin’s river systems [
3].
Since European settlement in the early 1800s, two actions—the clearance of native vegetation for dryland agriculture and the development of irrigation systems on the Riverine Plains and Mallee—have resulted in more water now entering the groundwater systems where it can mobilize the salt to the land surface (causing land salinization problems) and to surface water systems (causing water quality problems). Additionally, river regulation and increasing water extraction for irrigation and other uses have also changed river flow patterns and increased river salinities.
Since the 1960s salinization of land and increased salinity in the River Murray has been apparent and has been the subject of many individual studies by the three southern Basin states—Victoria, New South Wales and South Australia. However, by the mid-1980s salinity was recognized as one of the most significant environmental and economic challenges facing the southern MDB [
4,
5]. The resolution of these challenges has been complex and sustained, and has involved and continues to involve the joint, cooperative actions of the three southern Basin states and the Commonwealth over the past three decades.
This cooperative approach to salinity management was initiated by the development of an inter-governmental agreement on natural resource management, not just river management, and as such, it has led the way to other interstate arrangements on water. From the start, there were potential conflicts between managing river salinity and reducing groundwater levels using drainage and pumping of shallow groundwater [
5]. Engineering options for salt interception were central to the salinity management strategies, allowing river salinity to be controlled and improving land and water management.
Salinity management since 1988 has been underpinned by an innovative, world-leading and adaptive salinity management framework consisting of an agreed salinity target; joint works and measures to reduce salinity entering the rivers; an agreed accountability and governance system consisting of a system of salinity credits to offset debits; a robust and agreed method to quantify the credits and debits; and a salinity register to keep track of credits and debits.
This paper aims to describe salinity management from the mid-1980s to now (2020), where salinity appears to be under control within a strict management regime. We provide some background on the MDB and the processes operating in the Murray Basin that are causing the observed salinization issues. We then review the three salinity management strategies that have been in place since 1988 to address the salinity problems first in the River Murray, and more recently in the whole Basin. The various actions implemented to control salinity through the strategies are discussed as are the benefits of the Murray–Darling Basin Plan for salinity management. Finally, we discuss the future of salinity in the MDB with climate change predicted to lead to a hotter, drier, and more variable climate (particularly more frequent droughts), and identify what we believe are the key success factors of the program.
In this paper, river salinity is described by the term EC, consistent with the salinity strategies. EC is the mean electrical conductivity of river water, in μS/cm, especially at Morgan, one of the major offtakes for Adelaide’s water supply.
4. Salinity Management
4.1. History
As noted in the previous section, the issue of elevated salinity in the River Murray system really came to a head in the late 1960s because salinity at Morgan was exceeding 800 EC on many occasions, with major implications for Adelaide’s drinking water supply. Additionally, land salinization was occurring in a number of irrigation regions in the southern Basin. As a result, the individual southern Basin states—Victoria, New South Wales, and South Australia—undertook many salinity investigations, which quantified waterlogging and salinity problems within the irrigation regions in the southern MDB and proposed mitigation options. Salt interception schemes began to be designed and constructed. Engagement with the community also began and sub-regional salinity management plans were implemented [
4].
However, by the early 1980s, it was becoming apparent that any resolution of the salinity issues in the River Murray would require cooperative and joint state actions, an innovative policy framework and novel funding mechanisms.
In 1985, Ministers of the environment, land and water from the Commonwealth, New South Wales, Victoria, and South Australian governments met in Adelaide, to focus on the need for a more holistic approach to the management the problems of land degradation and salinity in the MDB. Subsequently, there was an intense period of discussion between the four governments, which culminated in 1987 with a new Murray–Darling Basin Agreement that replaced the earlier River Murray Waters Agreement, which had been in place since 1915. The Murray–Darling Basin Commission (MDBC), an unincorporated joint venture linking the Commonwealth government and the five Basin state governments (Initially, the Commonwealth, NSW, Victorian and South Australian governments were involved, with Queensland joining in 2000 and the Australian Capital Territory in 2001), was also established (replacing the River Murray Commission).
In 1992, a totally new Murray–Darling Basin Agreement replaced the earlier 1987 agreement, with the MDBC required to administer the new Agreement and to advise on all aspects of water, land, and other environmental issues throughout the whole Basin, as well as the traditional responsibility of the management of allocation and delivery of shared water to the three River Murray states.
One of the first actions under the 1987 Murray–Darling Basin Agreement was the development of the Salinity and Drainage Strategy, which ran from1988 to 2000. Subsequently, two other salinity strategies have been developed – the Basin Salinity Management Strategy (2001–2015), and the current Basin Salinity Management 2030 (BSM2030), which commenced in 2016. Additional to these salinity strategies was the development of the Murray–Darling Basin Plan (Basin Plan), which commenced in late 2012.
The details of these strategies and the Basin Plan are discussed below (see also [
4] for a general review of salinity management in the MDB).
4.2. Salinity and Drainage Strategy (S&DS 1988–2000)
This first strategy, developed cooperatively by three states (Victoria, NSW, and South Australia) and the Commonwealth, was novel and innovative, and provided momentum for consecutive salinity management strategies lasting more than three decades. It involved the construction of salt interception schemes to reduce salt entering the River Murray and the development of an innovative salinity accountability framework (salinity register) for managing salinity debits resulting from development activities together with the salinity credits generated by the interception schemes.
The strategy had to reconcile two conflicting actions. First, to improve the quality of irrigated land required that waterlogging had to be minimized by reducing accessions to groundwater and also that the drainage was improved, often with the result that the salt discharged to rivers was increased. Obviously, this conflicted with the second aim of the strategy to reduce river salinity.
The aims of the strategy were to [
36]:
Improve irrigation drainage in the Riverine Plains region;
Reduce groundwater levels by improving irrigation practice through whole farm planning, improved irrigation management, drainage reuse, improved irrigation infrastructure, and the establishment of deep-rooted vegetation; and
Reduce salt entering the river by constructing salt interception schemes in the lower reaches of the River Murray.
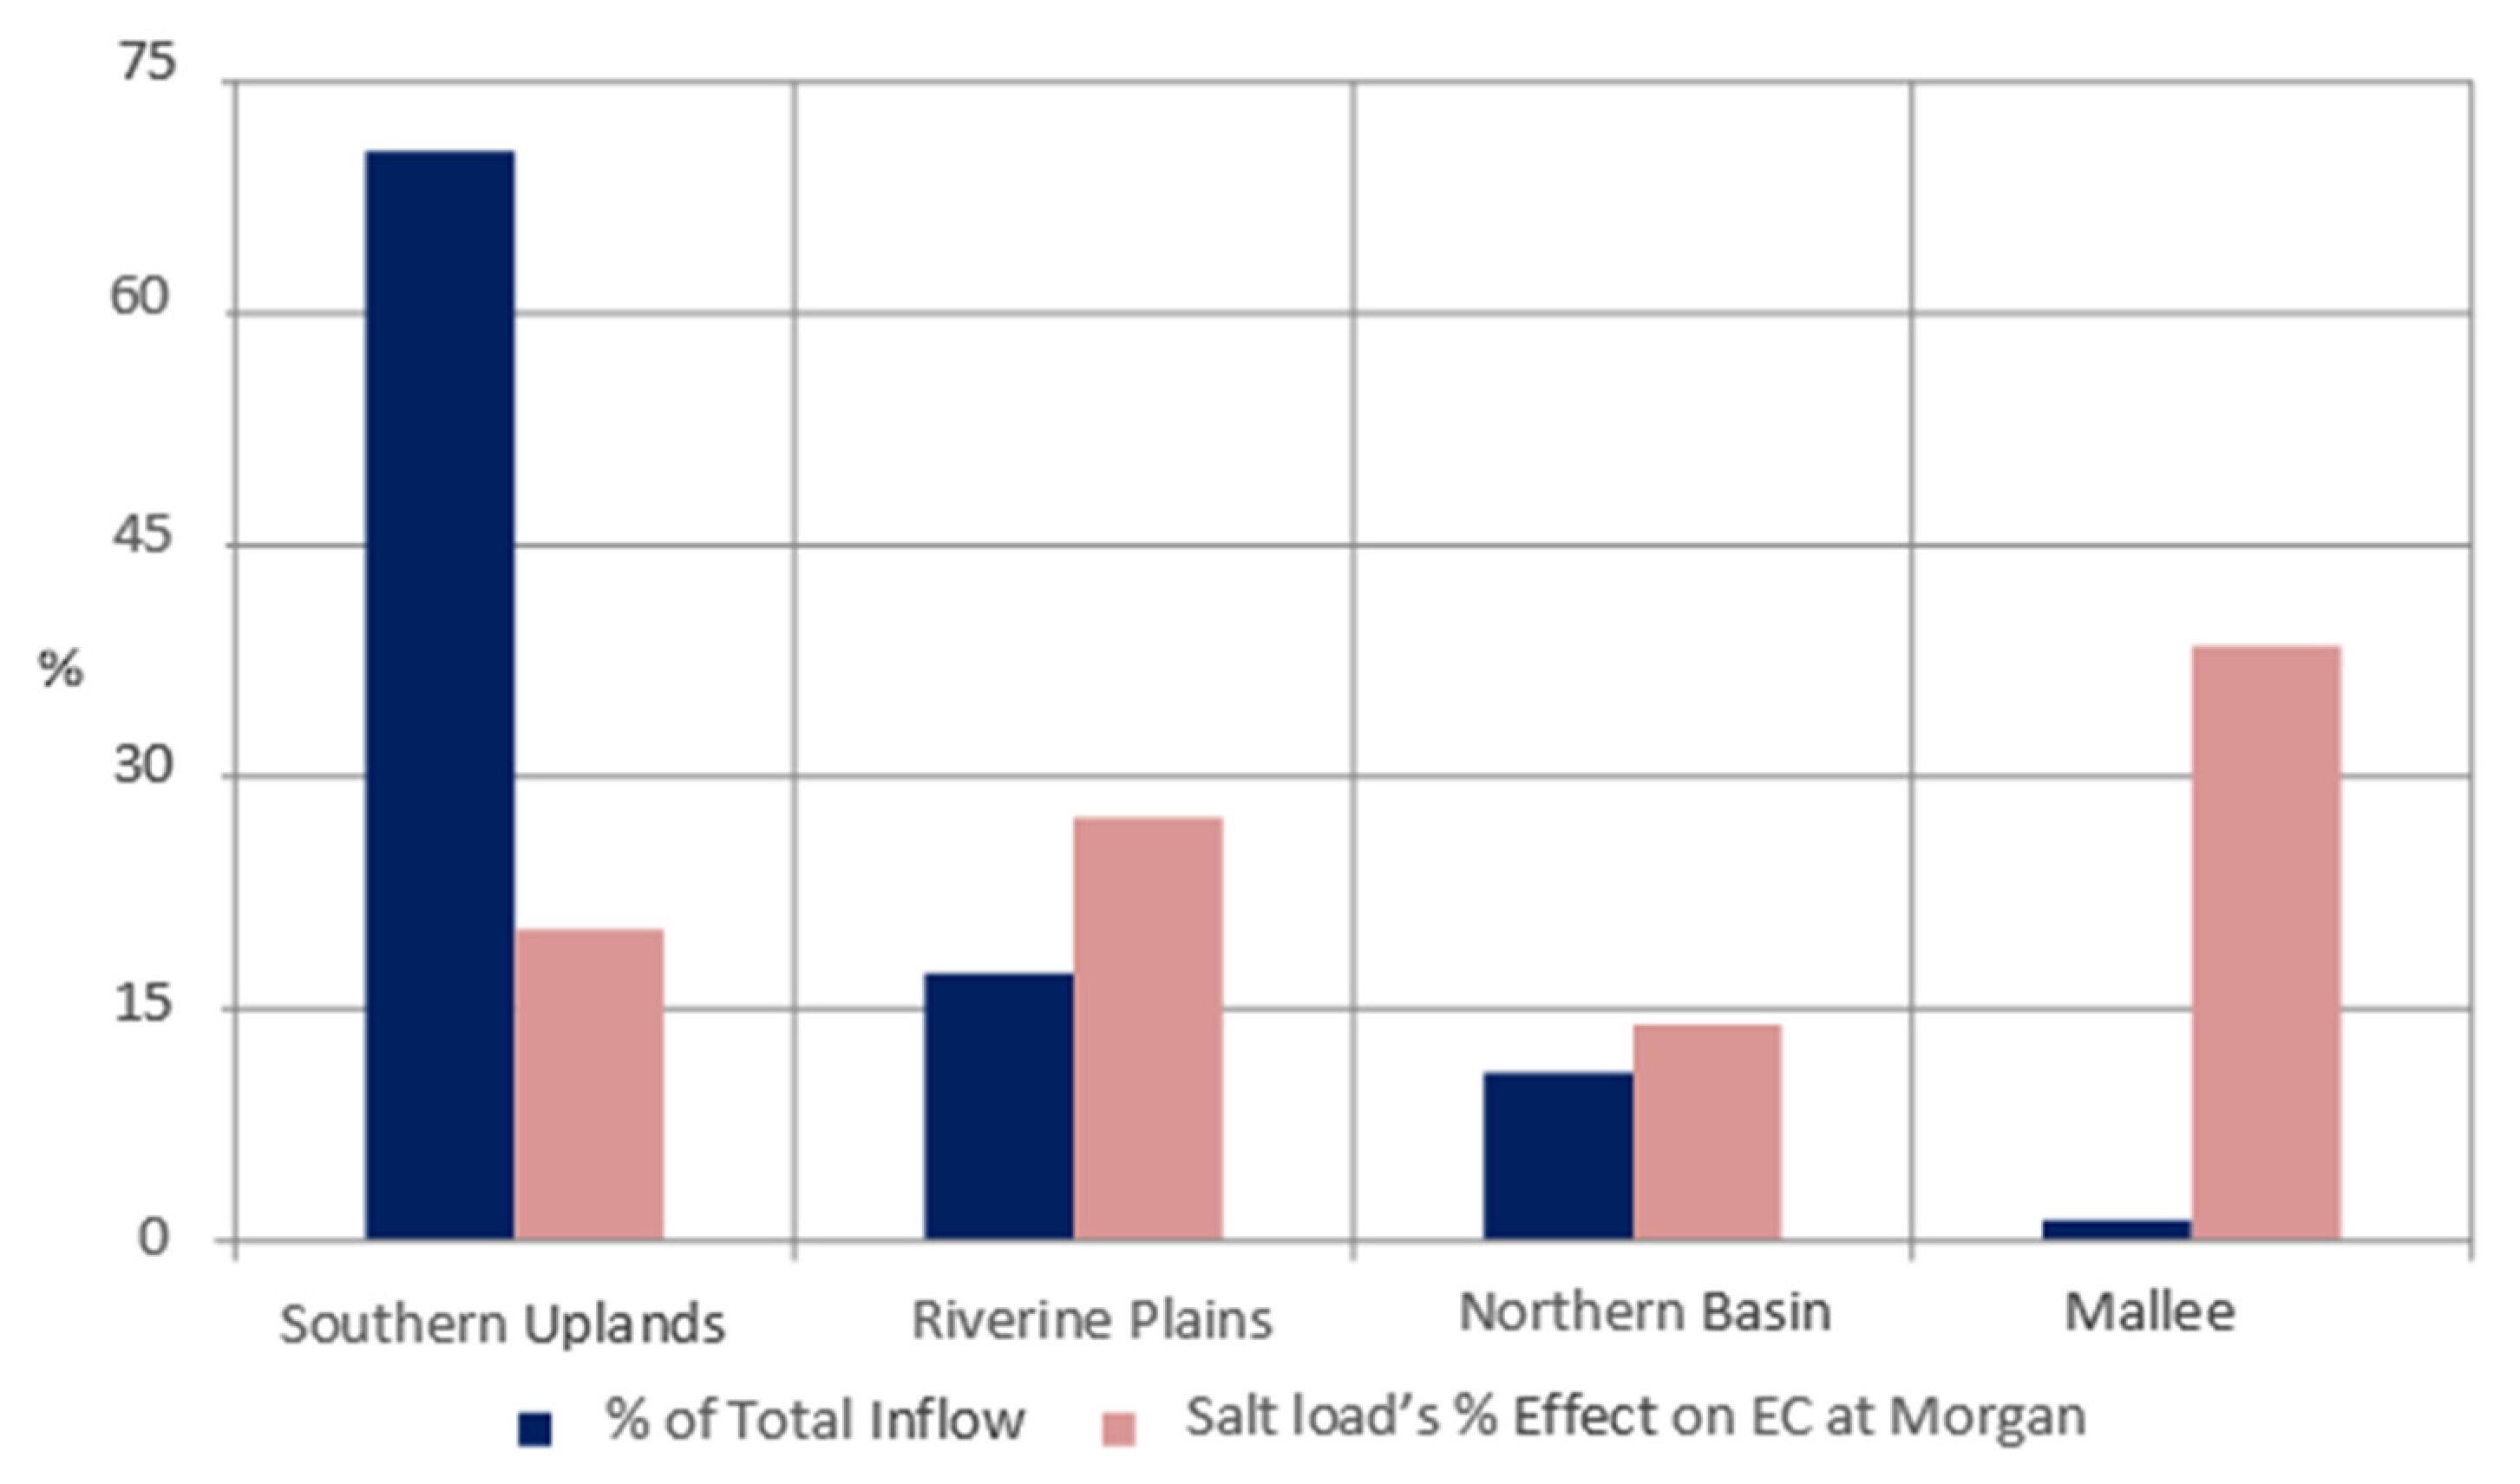
The strategy was focused on the mid and lower River Murray region and
Figure 4 and
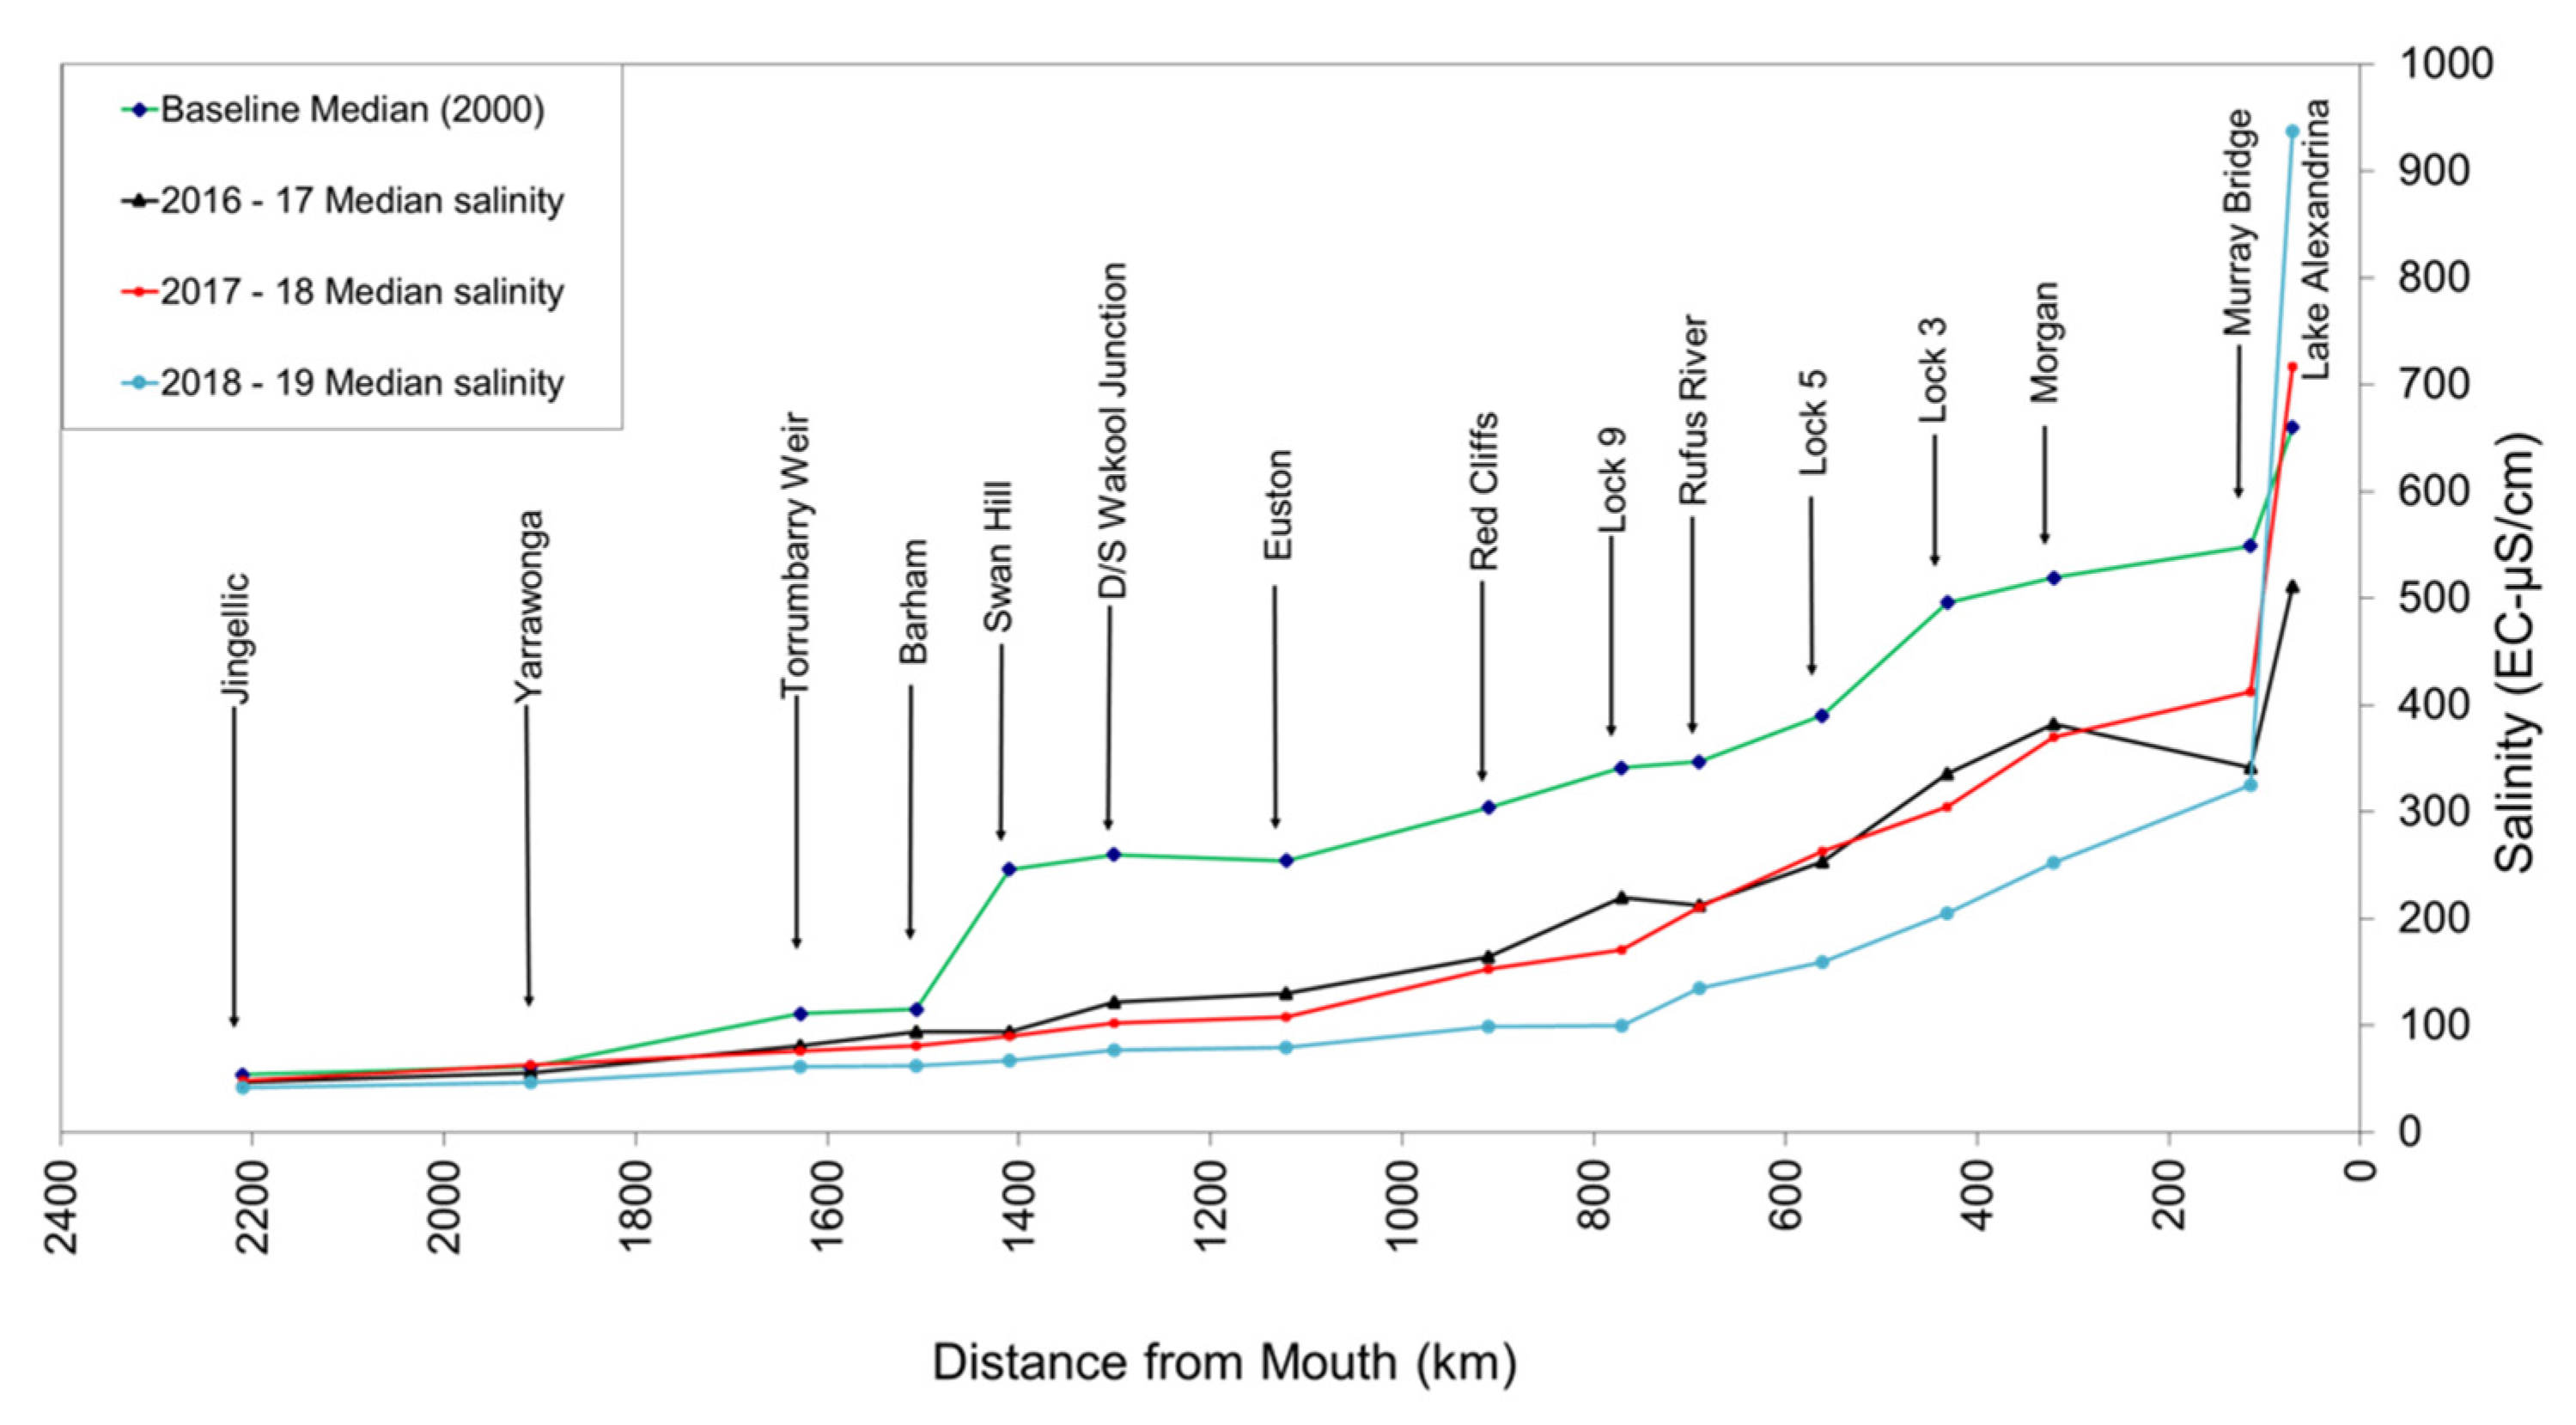
Figure 5 show the reason for this. The median daily salinity along the River Murray over the period 1975–2000 (
Figure 5) shows that salinity commenced to increase around Torrumbarry (start of the Riverine Plains) and continued to increase downstream. Most of the salt load came from the Riverine Plains and Mallee regions (
Figure 4). Additionally, large irrigation areas in the Riverine Plains were beginning to be drained and if this saline drainage water was diverted to the river, salt loads from this region would have been increased even further.
The major features of the first salinity strategy, which have underpinned subsequent salinity strategies, are summarized below.
A salinity target was set, with the 80th percentile salinity in the River Murray at Morgan being less than 800 EC.
Under this strategy NSW, Victoria, South Australia and the Commonwealth to jointly contributed funding for salt interception schemes that would reduce Morgan average daily salinity by 80 EC. Of this 80 EC, 15 EC were allocated to each of NSW and Victoria to offset the impacts of future drainage works or development in irrigation areas, and the remaining 50 EC was shared by the Commonwealth and South Australia, and used to reduce River Murray salinity [
4].
An innovative system of salt credits and debits was introduced to allow future actions (e.g., new irrigation development) to occur only if adverse salinity impacts were fully offset. Salinity credits were realized through joint investments in salt interception schemes and improved land management practices and the salinity impacts of development activities were capped within the credits generated largely from these schemes.
This salinity offset framework was key to the sustained success of salinity management in the MDB under the Salinity and Drainage Strategy and the two subsequent strategies for over three decades. Central to this framework is the agreed accountability and governance system consisting of a system of salinity credits and debits, a robust and agreed method (modelling) to quantify and validate the credits and debits, and a salinity register to keep track of credits and debits.
How the system works is illustrated by the following example. A salt interception scheme generates 1 EC salinity credit if it reduces the modelled mean electrical conductivity at Morgan by 1 μS/cm. On the other hand, if there is a development or other action, that causes an increase in modelled EC of 1 μS/cm, it generates a debit of 1 EC.
For the purpose of determining salinity credits or debits various models are used, including complex groundwater and surface water (river and tributary) models. Each of these models are subject to a rigorous independent technical assessment processes and regular review. After models are assessed and approved, they are used for estimating salt loads prevented from entering the river or any increases of salt loads to the river. The river model then estimates the salinity impact at Morgan either as a credit or debit. Under the Murray–Darling Basin Agreement, the Basin governments are responsible for informing the Murray–Darling Basin Authority (MDBA) or its predecessor organization (MDBC) if an activity is going to create a credit or debit. The MDBA is responsible for assessing and approving the models used for estimating credits and debits, and for maintaining each government’s account in the salinity register, which is independently audited.
The Basin states need to ascertain that they have credits available if they wish an action (e.g., the development of a new or extended irrigation system) to go ahead. The shared salt interception schemes generated credits, which are distributed to states on the basis their relative contribution to the cost of the scheme. This allowed development and other actions to occur, that would generate debits. A salinity register keeps track of the balance of credits amongst the different jurisdictions. MDBA ([
4], Appendix 4) provides details of how the salinity register works.
Given that salinity may be a limit on development, the offset scheme encouraged Basin governments to develop policies that limit salinity impacts and to take actions that may gain salinity credits. In this way the offset scheme has encouraged water use efficiency measures in irrigation districts and good land and water planning, and has ensured that irrigation development or modernization can continue to occur providing the impacts are offset by investment in salt mitigation actions.
The main actions introduced to reduce salinity in the western Murray Basin (e.g., Riverine Plains and Mallee regions) are discussed in more detail in the next section.
At the completion of the Salinity and Drainage Strategy in 2000, three new salt interceptions schemes had been built, three existing schemes had been expanded, substantial improvements to irrigation drainage had been undertaken, and there were significant changes in irrigation practices that reduced drainage volume. Additionally, a salinity audit undertaken in 1999 [
37] showed clearly that the strategy was reducing salinity in the River Murray and enabling continued irrigation.
4.3. The Basin Salinity Management Strategy (2001–2015)
A potentially new salinity threat was revealed during the wetter period of the 1990s in the form of rising water tables in large areas of the upstream dryland catchments, mostly located in the northern Basin. This was leading to an increase in dryland salinity. For example, the area of salinized land in the Macquarie, Namoi, and Lachlan (and Loddon and Avoca) catchments was forecast to more than double over the next one hundred years, with the Morgan salinity target being exceeded by 50% by 2020. Overall, it was estimated at that time that three to five million ha of land would become salinized over the following 100 years without substantial intervention, resulting in serious impacts on water quality, agricultural productivity, the environment, and built infrastructure.
This stark prediction that large salt exports could occur from catchment sources, many located in the northern MDB, over the next 50–100 years lead to the development of the second salinity strategy—
Basin Salinity Management Strategy 2001–2015 (BSMS). This shifted focus from the southern Basin and River Murray catchment to a whole-of-Basin approach. The BSMS had four objectives [
31]:
Maintain the objectives of the Salinity and Drainage Strategy (1988–2000);
Address the perceived salinity impact from upland catchments and control the rise in salt contributed from tributary catchments;
Control land degradation and protect important terrestrial ecosystems, productive agricultural land, cultural heritage, and built infrastructure at agreed levels Basin-wide; and
Get communities and governments to learn to live with salt and to make trade-offs with catchment land uses.
To address the predicted salinity impacts from upland catchment, BSMS continued and strengthened the salinity accountability framework established under the Salinity and Drainage Strategy, expanded the salt interception schemes program to create further 61 EC credits, and extended this to enable actions that occurred in the tributary catchments to be included on the salinity registers where they had an impact on river salinity in the River Murray. This required the introduction of “end-of-valley” salinity and salt loads targets at 24 locations in the Basin covering the major tributaries. The intent of these targets was to drive actions in the valleys and catchments to reduce salinity impacts to major tributaries and the River Murray, and for the Basin states to monitor salt loads from each tributary and report the results.
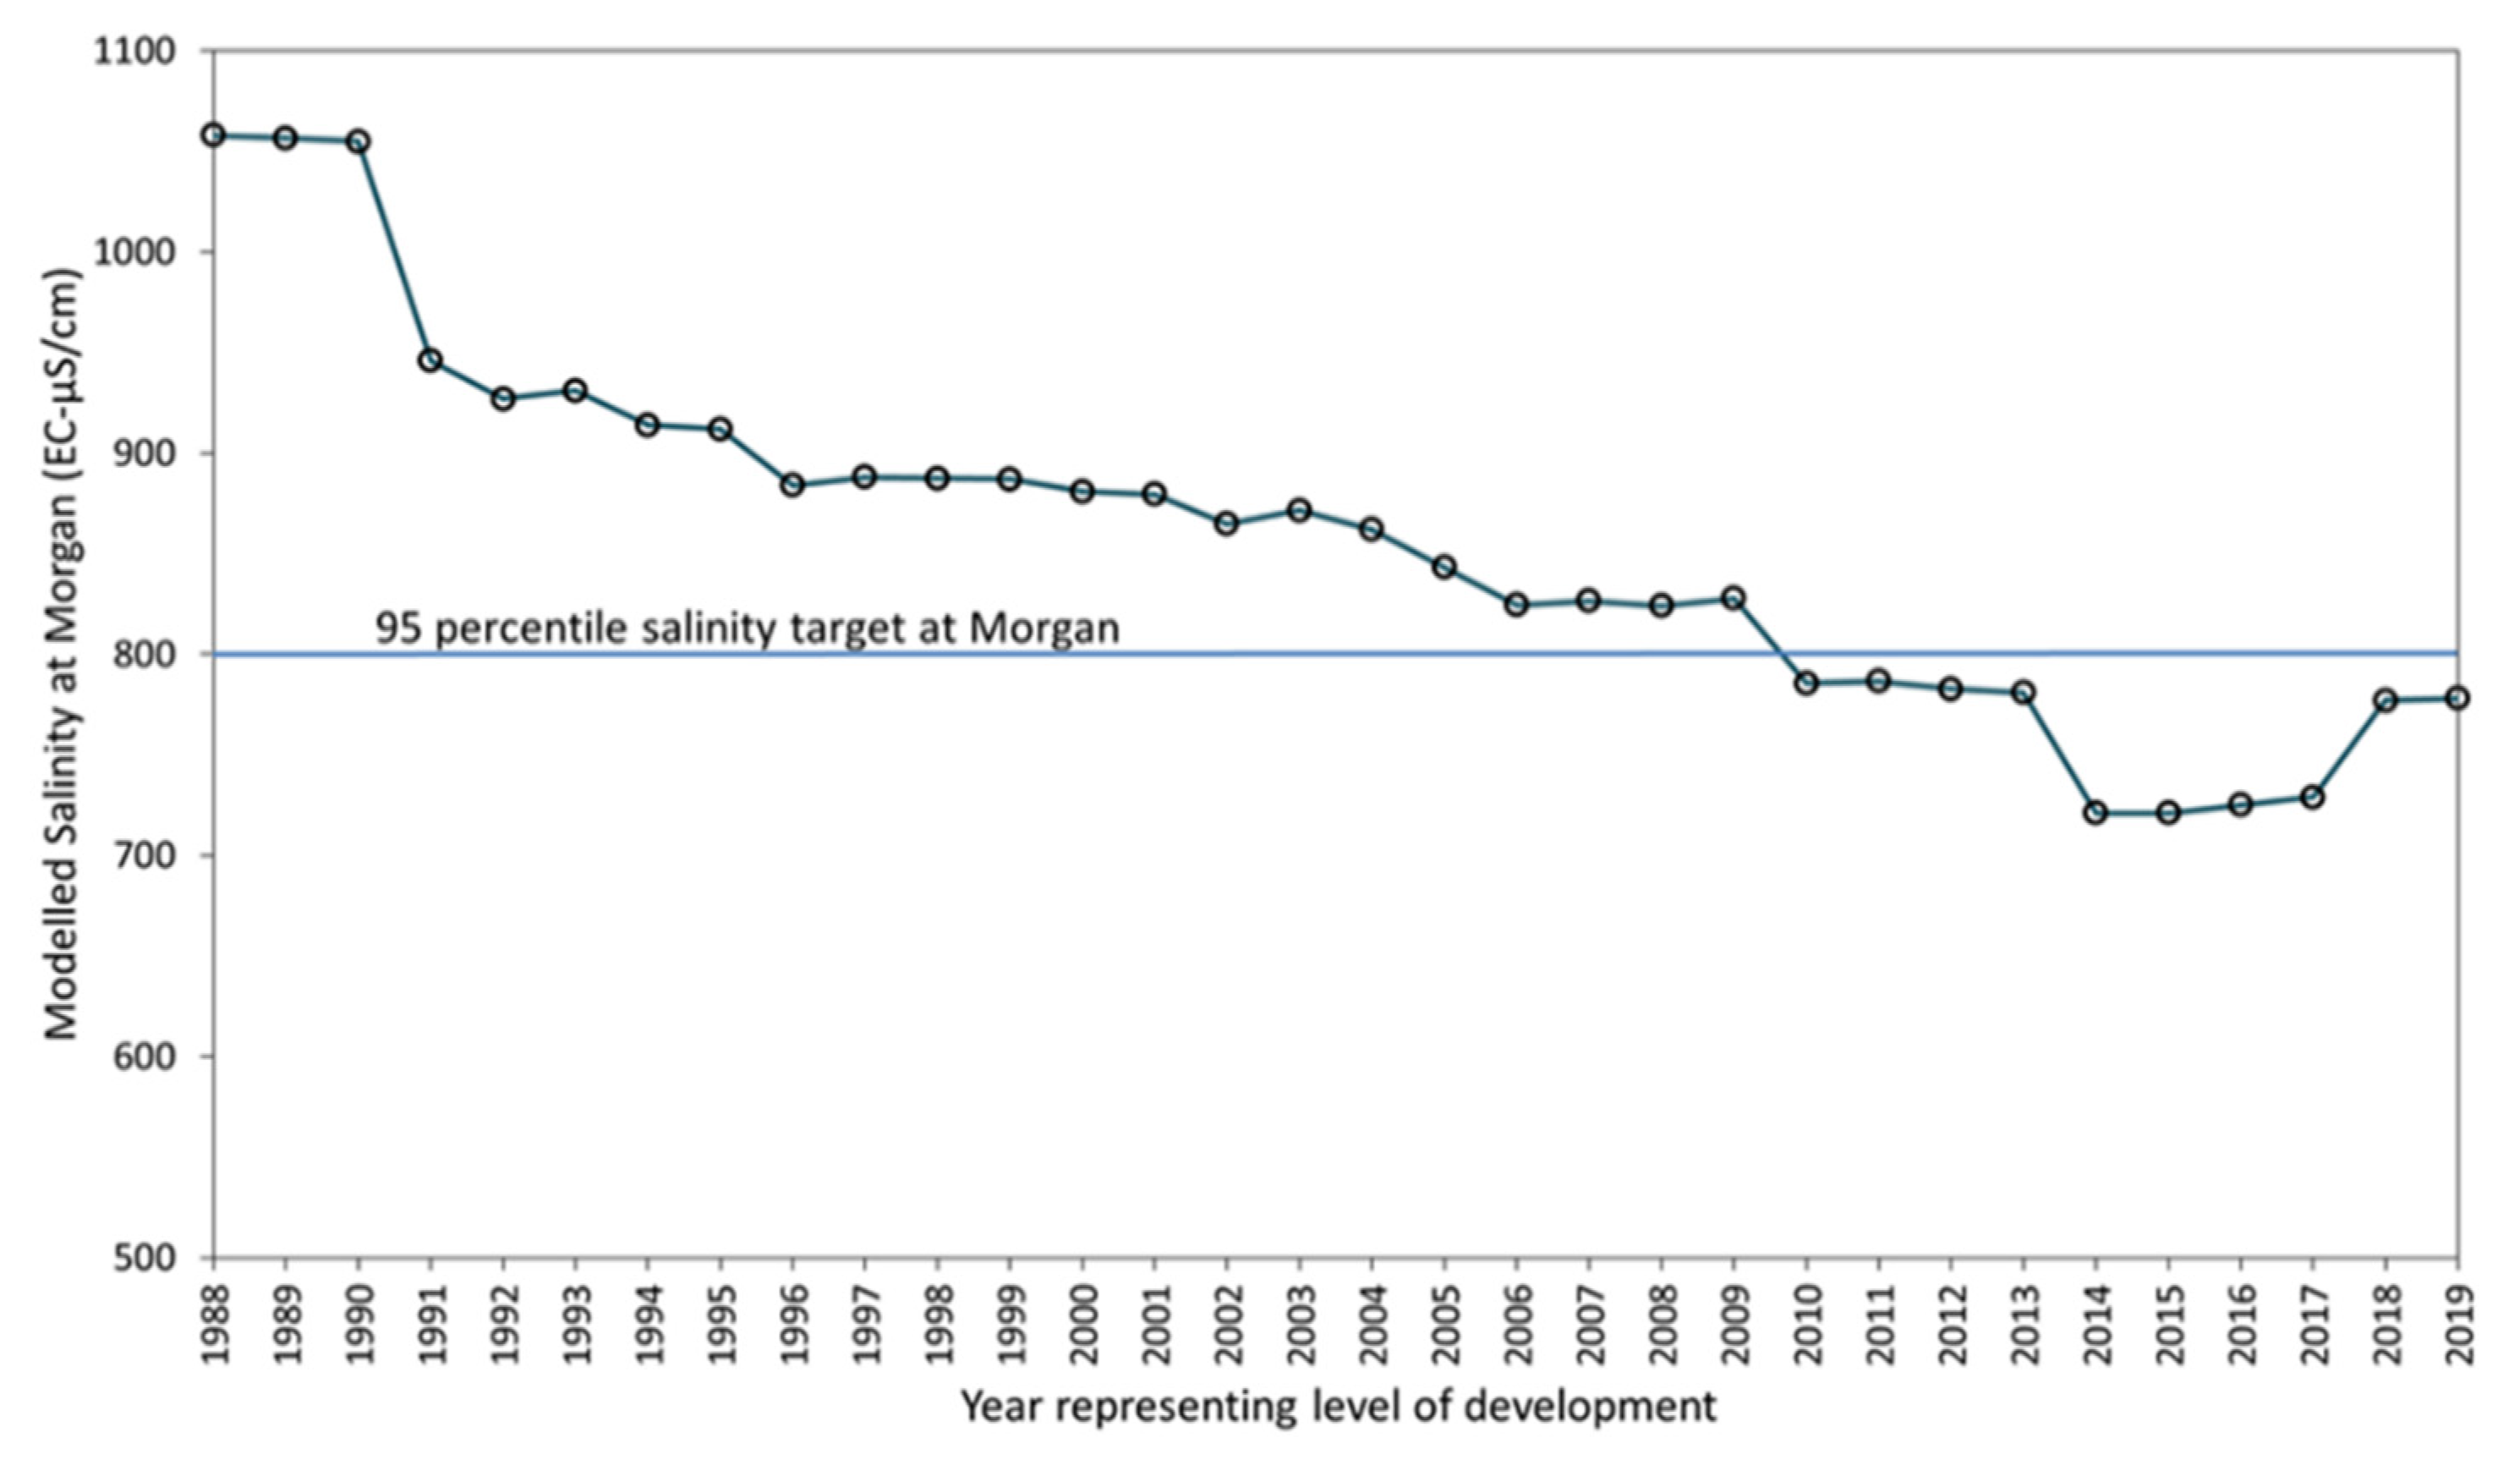
In addition, the BSMS set a formal Basin Salinity Target for managing river salinity in the River Murray. The target was to maintain the modelled average daily salinity level at Morgan at less than 800 EC for at least 95% of the time within a benchmark period (1975–2000) that encompassed the expected long-term range of climate variability. Additionally, the strong salinity accountability and governance framework established under the Salinity and Drainage Strategy was maintained and extended to the whole Basin under the BSMS. This again was built on technical modelling capabilities, independent peer review of the models and independent audit of salinity registers, and the strategy implementation performance by partner governments and the MDBA.
State-based policies and programs to improve irrigation and land management practices continued to be supported by BSMS, with the modernization of irrigation infrastructure and the continued improvements to on-farm practices helping to significantly reduce river salinity. Salinity impact zoning systems were also introduced in South Australia and Victoria, and became an important focus of BSMS as they enabled irrigation development to continue to occur in areas of low salinity impact.
The Basin Salinity Target was met for the first time in 2010, through the combination of improved irrigation practices, catchment programs and significant investment in the construction and operation of salt interception schemes (
Figure 6) [
5]. By the end of BSMS (2015), the partner governments had fully met their salinity accountability obligations.
Experience during the Millennium drought (1997–2010), together with investment in further studies, showed that salinity in the tributary catchments and valleys was cyclical in nature, and that, for most areas, the predicted maximum future impacts would not be substantially worse than was seen during the wet years of the 1990s.
4.4. Basin Plan
The introduction of the Murray–Darling Basin Plan in 2012 represented a significant step in the adaptive management of the MDB’s water resources [
38]. The Plan provides complementary salinity management provisions through a Water Quality and Salinity Management Plan, which sets out water quality objectives and targets for Basin water resources. The Basin Plan also identifies the agencies responsible for considering those targets as part of their operational roles, provides for inclusion of water quality measures in Regional Water Resource Plans.
In relation to water quality, the Basin Plan built on the two decades of collaborative work by governments in both the Salinity and Drainage Strategy and the BSMS. The Plan sets out non-mandatory objectives and targets for water quality to be suitable for drinking, agricultural, recreational, cultural, and environmental purposes and includes:
Specific river targets that relate to salinity levels (at five reporting sites), dissolved oxygen and blue-green algae;
An objective to flush out salt from the River Murray system—an indicative measure of success was identified as export of two million tonnes of salt per year (3-year annualized average) from the Basin into the Southern Ocean [
39];
A framework for developing water quality targets for each water resource area, which are required to be detailed in new Water Quality Management Plans to be developed as part of Regional Water Resource Plans; and
End-of-valley targets that were developed under the BSMS for the purposes of long-term salinity planning and management.
In addition to the above specific provisions to manage and maintain water quality and salinity, the Basin Plan sets a limit on consumptive water use (Sustainable Diversion Limits) and establishes environmental watering strategies using the water recovered for the environment. The use of larger volumes of environmental water maintains connectivity between tributaries and higher flows in rivers and tributaries providing significant dilution flows for managing salinity.
In the River Murray, full implementation of the Basin Plan will result in approximately 20% less water being diverted for irrigation and allocated to the environment. The overall salinity benefits of this change have been estimated to be around an average 60 EC reduction at Morgan [
5,
40], although there is some uncertainty about the scale of the benefits. It is possible that use of environmental water to water floodplains will mobilize more salt thus reducing the above gain. Additionally, this extra water will permit more responsive management of salt interception schemes to be investigated.
4.5. Basin Salinity Management 2030 (BSM2030)
The most recent salinity strategy—
Basin Salinity Management 2030 (BSM2030)—recognizes that salinity remains a risk to the Basin and that ongoing and proactive salinity management and accountability is required to ensure that river salinity does not return to the highly saline conditions of previous decades [
5].
However, BSM2030 is also a strategy for a Basin in transition and needs to accommodate complementary management arrangements specified in the Basin Plan. This Plan and the Murray–Darling Basin Agreement (Schedule B) collectively outline the salinity management obligations for each government that is party to the Murray–Darling Basin Agreement. The BSMS2030 provides a framework for how those governments will work individually and collectively to meet their obligations.
This third phase of the Basin salinity management aims to:
Maintain the cap on salinity through the existing Basin Salinity Target and the existing salinity accountability framework, which will ensure that partner governments continue to be accountable for offsetting actions that increase river salinity;
Explore opportunities to responsively manage salt interception schemes so that operations and costs can be reduced when river salinity is forecast to be low;
Support implementation of the Basin Plan to manage in-river salinity outcomes through flow management decisions in response to elevated salinity events (e.g., by using environmental water to dilute in-river salinity);
Identify changes in salinity risks from catchments and support implementation of cost-effective measures, where appropriate, through water resource plans, land and water management plans or other relevant statutory instruments; and
Invest in knowledge priorities to reduce uncertainty about future salinity risks and to potentially avoid future capital investment in new joint works and measures.
The Basin Plan and BSM2030 are consistent and interlinked. They link state catchment-based arrangements for salinity management with Basin Plan’s Water Resource Plan obligations, their obligations to “have regard” to the Basin Plan salinity targets for managing water flows, and their mutual commitment to salinity management [
5].
The Basin Plan sets high-level objectives and targets for salinity and aims to guide the Basin states in developing water quality and salinity management plans within their individually developed Regional Water Resource Plans that cover tributaries and are consistent with end-of-valley targets. However, the Basin Plan has no mechanism for joint state action for managing salinity of the shared water resources of the Basin. BSM2030 is the vehicle through which the partner governments agree to implement individual, collective, and coordinated actions.
5. Salinity Management Actions
5.1. General
Under all three strategies, actions have been taken to reduce and manage the amount of salt in the River Murray and elsewhere in the Basin, including [
32]:
Reduce saline drainage by improved irrigation efficiency and better delivery systems, including where possible the re-use of drainage waters on-farm;
Divert saline groundwater before it enters the River Murray through salt interception and drainage diversion schemes;
Reduce groundwater recharge and flow by planting deep rooted perennials; and
Salinity impact zoning to direct new irrigation schemes to areas of low salinity impact.
Once validated through peer-reviewed modelling, the impacts of these actions are then entered as salinity credits on the salinity registers to offset salinity debits generated through irrigation or other development activities.
5.2. Reducing Saline Drainage
Water use efficiency programs aim to increase production from the same volume of water. This can occur from actions both off-farm and on-farm. For example, off-farm projects include: Irrigation channel rationalization, automation, and remediation; service point replacement and rationalization; decommissioning of irrigation land and associated infrastructure, with upgrade to remaining infrastructure; improved metering; replacing channels with pipes. On-farm actions include: Drainage reuse; laser grading; improving gravity channel surface irrigation; installing or improving pipe and riser equipment; installing or improving sprinklers; installing or improving micro or drip irrigation; automation, irrigation scheduling, and soil moisture monitoring; piping, plastic-lined or upgraded channel; and improving pipes.
There are both private and public benefits from such measures. Improvements in water use efficiency may lead to increased area of production or to some of the water “saved” to be traded. Additionally, when water is scarce more efficient systems allow current agricultural production to be maintained. Recently, the Commonwealth and state governments have subsidized irrigation efficiency measures in order to achieve water savings with the recovered water being allocated for the environment.
These improvements also lead to reduced recharge to underlying groundwater systems, and less surface water returns, with both these outcomes reducing the return flows to rivers and streams. It also meant less reliance on sub-surface drainage and groundwater pumping to control water tables. Where salt interception schemes are in use, pumping costs may be reduced and less water diverted to disposal basins. The result is less reliance on engineered solutions and more sustainable agricultural systems.
5.3. Salt Interception Schemes
Salt interception schemes have been a central management strategy in the River Murray. They are large-scale pumping schemes that divert saline groundwater and drainage water before it enters the rivers. In most cases, a bore and pump system, extracts the groundwater and pumps it to a salt management basin some distance from the river, from where the saline water either evaporates or seeps into the groundwater system [
41].
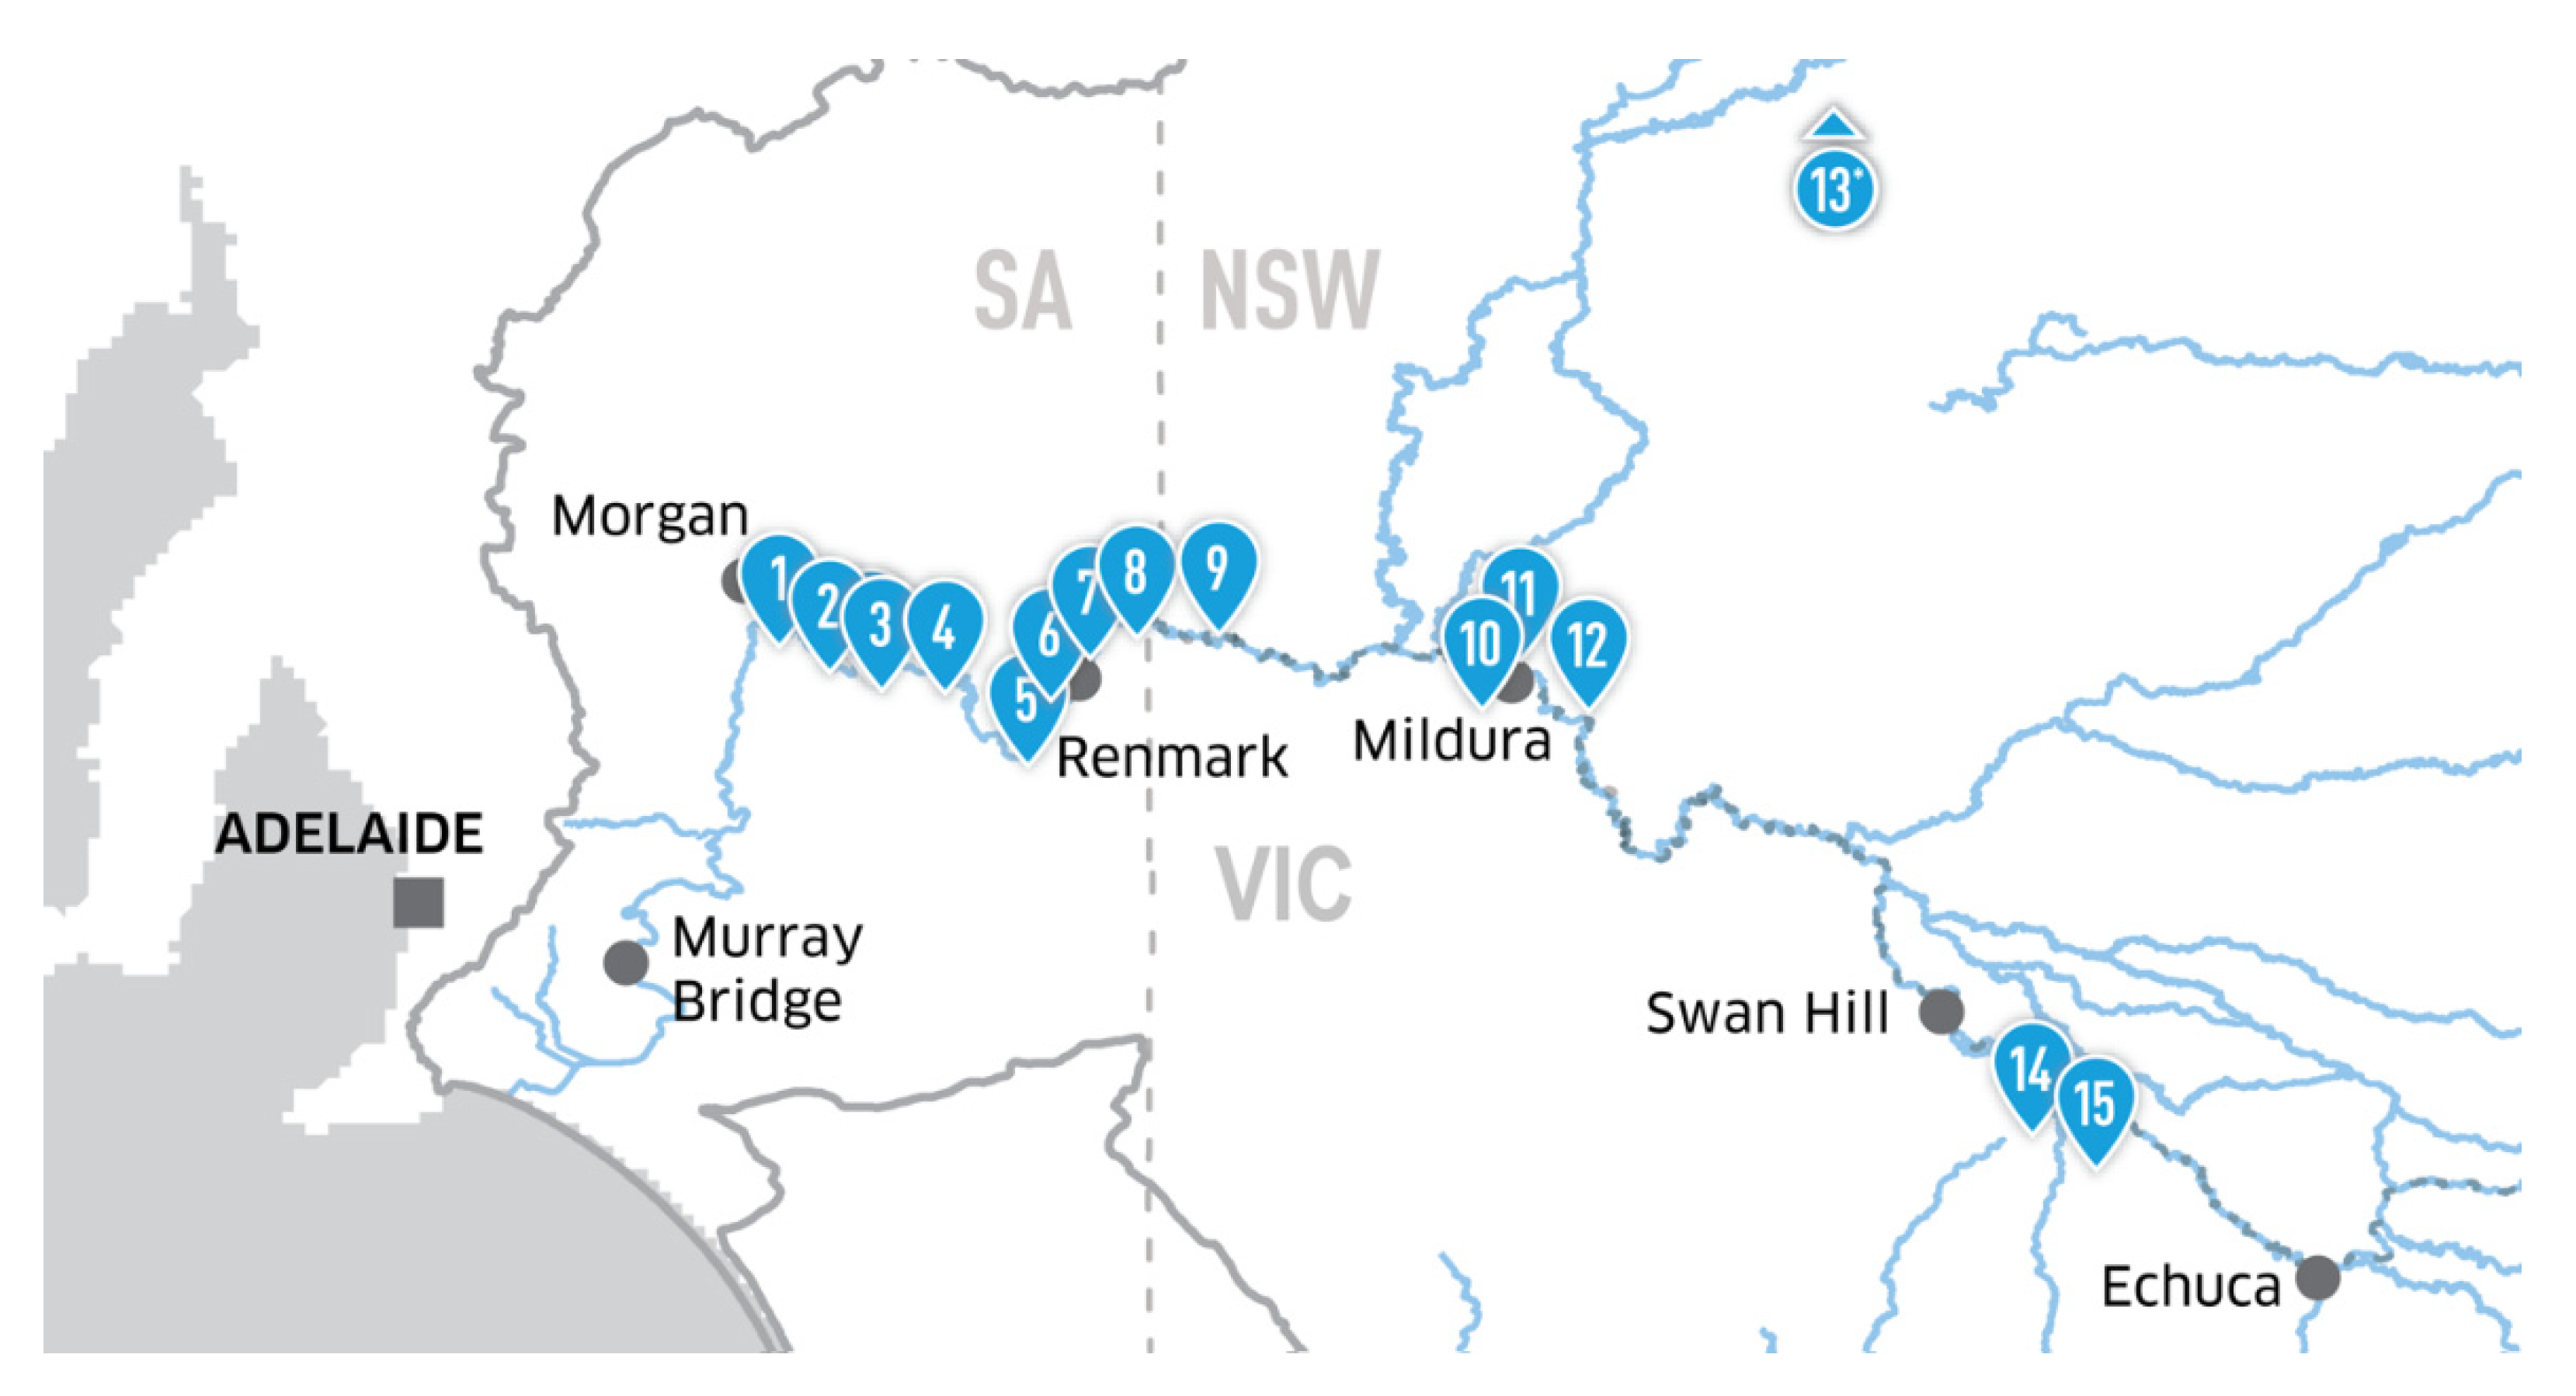
By 2015, salt interception schemes had diverted on average 400,000 ton of salt annually away from the river and nearby landscapes and delivered approximately 150 EC of salinity benefits. Currently, there are fifteen salt interception schemes, mostly located along the River Murray, that are shared between governments (
Figure 6). It is estimated that approximately 300 bores are associated with the current schemes [
4]. These schemes are more effective during low flow periods and specifically control peak river salinities during extended droughts. Salt interception can also provide protection for environmental values by reducing saline groundwater inflows, lowering water tables, and entraining fresh groundwater from streams.
Salt interception schemes produce large volumes of saline water, that need to be dealt with. Most of the saline water is diverted to regional disposal basins, where it is concentrated by evaporation and either use for productive purposes or seeps to regional groundwater systems. Many regional disposal basins are salt lakes distant from the river, which limits any groundwater returns to the river. Some salt is harvested for productive purposes in agriculture and industry, but overall use is low compared to the salt generated by these schemes. There are also engineered disposal basins within irrigation areas to dispose of water from pumping of shallow aquifers or drainage. There have been trials of aquaculture and irrigation of salt-tolerant vegetation, where the generated water is not particularly saline.
Other disposal options have been considered, but not used, mainly due to cost. These include a pipeline to the sea [
42] and injection to deep aquifers. While disposal basins are relatively cheap, there is always a risk in salt stored on the land surface and in shallow groundwater. Fortunately, the salt does not contain trace elements such as selenium, that has caused difficulties for the environment in the San Joaquin Valley in the USA [
43]. One of the benefits of disposal basins is they are (or become) saline wetlands that can attract birds and have social amenity values in semi-arid areas.
There are high costs associated with implementation (e.g., drilling, installation of bores, pumps, and pipes to disposal basins), groundwater pumping and maintenance of these salt interception schemes. For example, Meissner [
44] reported that the cost of constructing a salt interception scheme consisting of 49 wells in the region between Lock 3 and Holder in South Australia, cost around AU
$21 million in 1992, and the annual running cost is around AU
$1.5 million. MDBA [
24] estimated that the total operating cost of the current salt interception scheme is approximately AU
$5–6 million per annum [
4].
These high costs provide motivation for decreasing the reliance on salt interception schemes. The potential for more adaptive operation of the current salt interception scheme is being investigated. This could include only running pumps when salt interception is required, decommissioning pumps if pumping efficiency cannot be maintained, and mothballing schemes. There are now very few opportunities for further salt interception as nearly all of the economically justifiable situations are currently being used.
5.4. Salinity Impact Zoning
Water reform since the 1990s has led to trading of water to higher-value agriculture where one effect has been the transfer of irrigation water from the Riverine Plains to the Mallee regions of Victoria and South Australia. The salinity impacts of this trade needs to be managed under the offset scheme.
South Australia and Victoria introduced a “salinity impact zoning” system, which enabled continuing economic development in both states that minimized the associated potential increase in river salinity. This planning process divides potential development areas into their likely impact on River Murray salinity. Trade of water and new developments are encouraged through policies to shift to low impact zones. The lower impact zones are often further from the river, which leads to significantly delayed impacts [
45].
The benefits from such zoning is illustrated by the situation in the Victorian Mallee [
46]. Between 1994 and 2012, the total irrigated area in this region increased by more than 150%. Without the salinity impact zoning system, and the associated new irrigation development guidelines, this increased irrigation area would have resulted in a salinity debit (that Victoria would have had to fully offset) of almost 25 EC compared to the actual salinity impact of 6 EC (in 2006).
6. Current Status of Salinity in the MDB
The Basin Salinity Target was met for the first time in 2010 (
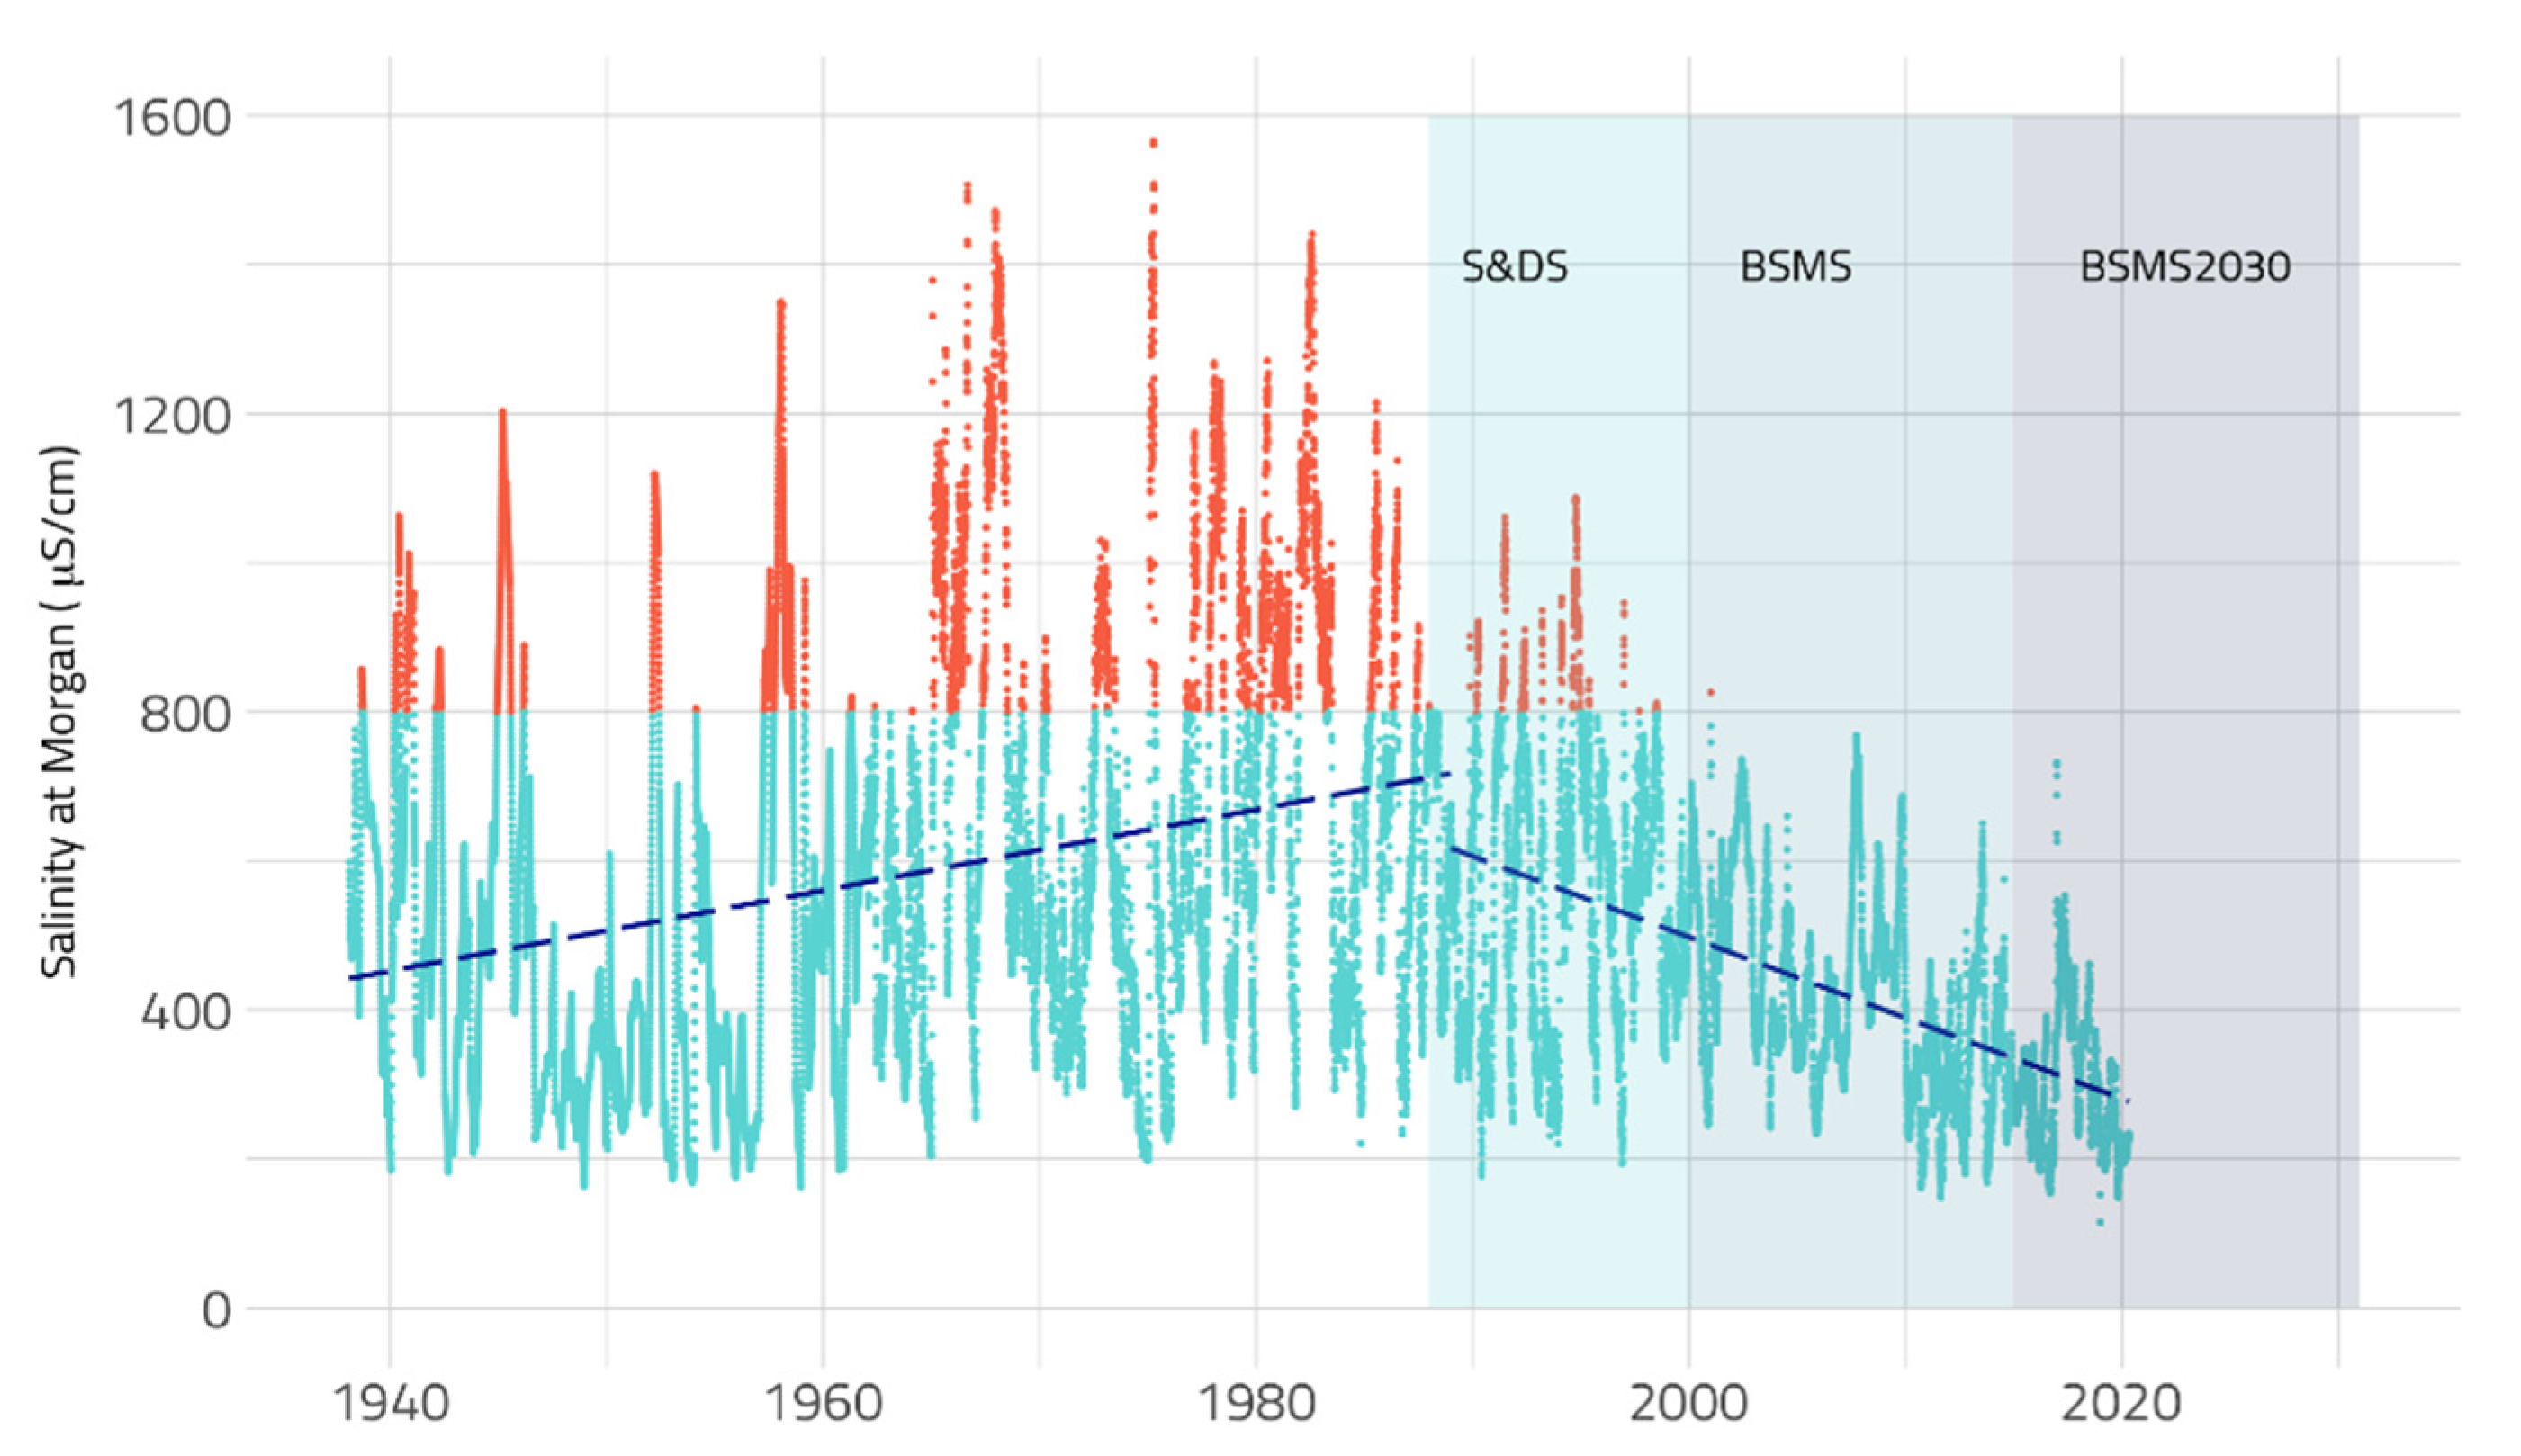
Figure 7). The reduction in salinity at Morgan since 1988 (shown in both
Figure 3 and
Figure 7) is due to both salinity management actions (e.g., improved irrigation practices, catchment programs and significant investment in the construction and operation of salt interception scheme) and more recently to a drier climate (
Figure 2).
Biswas and Mosely [
47] have reported on River Murray water quality over almost 40 years (1978–2015). They analyzed long-term water quality data at 15 sites along the River Murray, and as expected, salinity increased from above Hume Reservoir to Murray Bridge in South Australia. Additionally, the data showed increase in salinity at Torrumbarry, Euston and Lock 5 until the early 1980s, and then salinity in the River Murray reduced after the implementation of the salinity management strategies (see
Figure 5).
Additionally, investigations showed that salinity in the tributary catchments and valleys was cyclical in nature, and that, for most areas, the predicted maximum future impacts will not be substantially worse than was seen during the wet years of the 1990s.
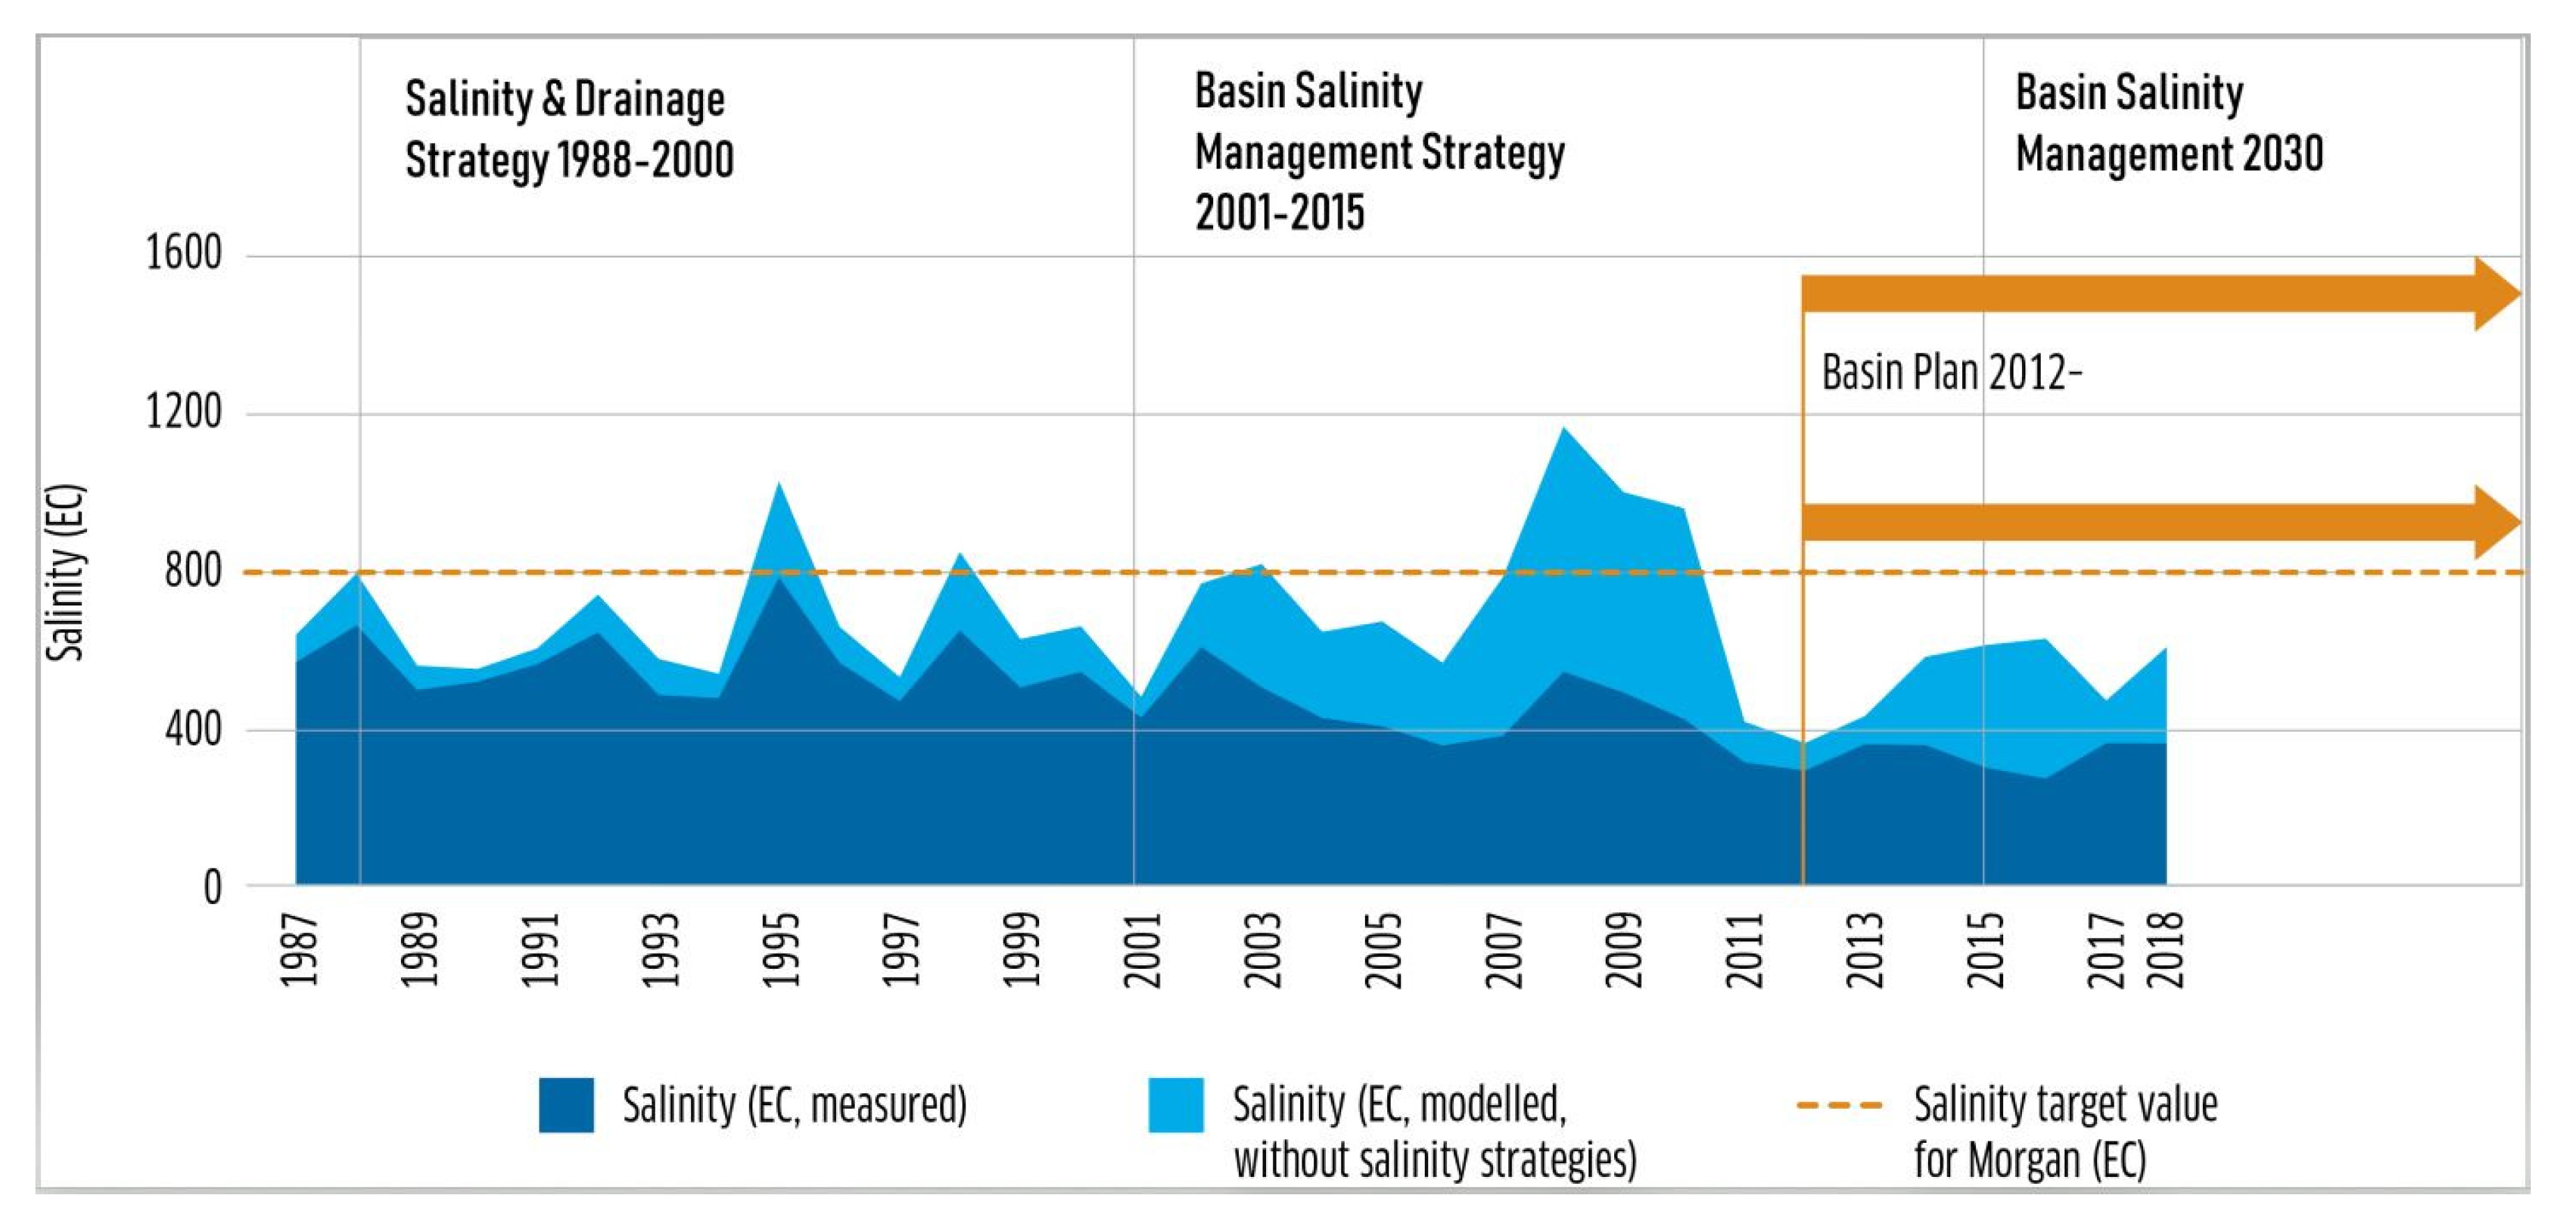
The joint works and measures undertaken by the partner governments through the Salinity and Drainage Strategy and the BSMS delivered an approximate 150 EC average daily salinity benefit to the River Murray at Morgan (against a target of 141 EC).
Figure 8 shows the effect of the salinity management strategies on the (modelled) River Murray salinity at Morgan.
Thus, it was clear that by the end of the BSMS in 2015 that joint action on salinity had largely achieved the aim of reducing salinity in the River Murray. This coincided with the dry period since 1995, which also contributed to lower salinity. The Basin landscapes will continue to export salt, and salinity is forecast to gradually increase as the delayed salinity impacts of land clearing and historical irrigation development become manifest. The available salinity credits may be used to offset future irrigation developments, but there is obviously an ongoing need to manage current salinity levels as well as future increases.
A range of factors influence how much salt is exported each year from the river system to the ocean, including: River regulation; changed land management practices; complex groundwater systems; and the highly variable nature of the hydrological conditions in the Basin. During periods of low flow, such as in 2017–2019, preventing salt entering the river through the salt interception schemes built over the past three decades, is more important than exporting salt to the ocean. But during periods of high flow, such as the floods of late 2016, salt interception schemes play less of a role in reducing river salinity, as there is greater dilution and more salt is exported.
The achievement of the Basin Plan salt export objective should be viewed in the wider context of overall salinity management. The Plan seeks to prevent, where feasible, salt mobilization downstream, but it is not feasible or desirable to prevent all salt from moving downstream. Salt interception is only effective at maintaining water quality at lower river flows, while during times of higher flows, the lower river salinity means that further interception is not required. At these higher flows, salt moves downstream towards the river mouth and is flushed to the ocean. Some flushing of salt from floodplains, wetlands, and the Lower Lakes is also required to maintain their condition. This requirement for salt flushing has been recognized in the Basin Management Strategies through additional dilution flows and in the Basin Plan in the setting of an objective for salt export. Meeting the joint and potentially conflicting objectives on water quality and salt flushing depends on tailoring salinity management to flows.
7. Future
The salinity management strategies operative in the MDB since 1988 have successfully reduced salinity in the River Murray so that the goal of ensuring the salinity at Morgan in South Australia is less than 800 EC for 95% of the time has been achieved.
However, it is clear that all landscapes will continue to export salt and there will be an ongoing need to manage current salinity levels as well as any future increases [
4]. Salinity impacts are forecast to gradually increase over time with the largest increases in salt loads predicted to come from the lower reaches of the Mallee region arising from relatively recent (post-1988) irrigation development and the delayed salinity impact from past land and water management activities, including clearing of native vegetation and historic irrigation development (pre-1988) [
4]. Relatively small changes in salinity impacts from the Northern Basin, Riverine Plains, and Southern Uplands are expected (
Figure 4).
Additionally, the predicted changes in the MDB, and particularly in the southern Basin, due to climate change over the next 30–50 years, will significantly influence future salinity impacts. Predictions are that the Basin will be hotter, drier (less winter-spring rainfall in the southern Basin) and with more frequent and longer droughts [
48,
49]. The implications of these changes for salinity are unclear. On the one hand increased droughts should to lead reduced salt loads and impacts, but this may be partially offset by any increased flooding and groundwater recharge from higher-intensity rainfall or lesser dilution effects from reduced run-off. The changes in climate are also likely to affect the spatial distribution, size, crop types, and management of irrigated agriculture in the MDB, and this may dominate the direct effects of climate on salt discharge.
Clearly, there will be a need for on-going research and development to address knowledge gaps, provide a contemporary approach to future investments for salinity management, and to better understand the impacts of climate change on salinity in the MDB.
8. Conclusions
Salinity problems in the southern MDB have been apparent since the 1960s. Concerted and cooperative action by the Commonwealth and Basin state governments since the early 1980s has seen the development and implementation of innovative salinity management strategies since 1988 that have successfully resulted in salinity now being largely under control, but still requiring on-going active management.
Under these strategies, partner governments undertook joint actions including: Reducing saline drainage through improved irrigation efficiency and better delivery systems; salt interceptions schemes to divert an average of about 400,000 tons of salt per year away from the river; the availability of more dilution water as a result of the Basin Plan; and the introduction of salinity impact zoning to exclude irrigation developments from high salinity risk areas. These actions have provided significant salinity benefit to the River Murray system resulting in the salinity target at Morgan of 800 EC for 95% of the time being now met.
Predictions are that salinity impacts will gradually increase over time with the largest increases in salt loads predicted to come from the lower reaches of the Mallee region arising from relatively recent irrigation development (post-1988) and the delayed salinity impact from past land and water management activities including clearing of native vegetation and historic irrigation development (pre-1988). Further, while it is likely that climate change will lead to a hotter, drier and more variable climate (particularly more frequent droughts) in the MDB, just what this will mean for salinity in the Basin is currently uncertain. However, this uncertainty is recognized and BSM2030 is investing in key knowledge gaps to ensure that the risks are well understood in time for the next review and the next strategy in 2030.
The three salinity management strategies—Salinity and Drainage Strategy (1988–2000), Basin Salinity Management Strategy (2001–2015), and Basin Salinity Management 2030 (2016–2030) collectively, represent a salinity management framework that has retained the commitment of all Basin governments for over thirty years with continued commitment through till 2030 when it will be reviewed again. From a policy perspective, this is an extraordinary success story. In our view, there are a number of design factors that have contributed to both its success and its longevity. These include:
Salinity is a serious problem with environmental, economic and social impacts—many community sectors were affected, the issue itself was not contested and there was significant pressure on governments for action.
The management framework based on a cap-and-offset process, combined with a clear and measurable target (i.e., salinity at Morgan), provided an elegant policy solution—it enabled economic development to continue to occur in regions while still providing ways to reduce overall salinity to meet the agreed target.
The salinity registers provided a formal, transparent process for acknowledging (and keeping track of) both impacts that increased salinity (debits) and actions that reduced salinity (credits)
The whole framework had a strong technical underpinning, including modelling river salinity and modelling the impacts of all actions on the register—models were required to be accredited and were peer reviewed.
The process was truly adaptive and enabled new knowledge to be included along the way. All actions and models were subject to a 5-year review and the strategies themselves were subject to mid-term and final reviews. Each strategy continued the focus of the previous ones but were adapted to deal with contemporary and emerging issues.
There was regular independent auditing of the entire framework, including jurisdictional actions, modelling, technical studies, register management and salinity monitoring—the independent audit reports were presented to the council of joint governments together with jurisdictional responses and made public.
The management strategies could show results—the target at Morgan (although modelled) provided a simple, credible and effective way of showing the results of a multi-decadal, multi-million-dollar program of actions to a range of audiences including funding governments, communities, and scientists.


