Analysis of the Performance of Bank Filtration for Water Supply in Arid Climates: Case Study in Egypt

 ,
,  , ,
, ,  and
and
Abstract
:1. Introduction
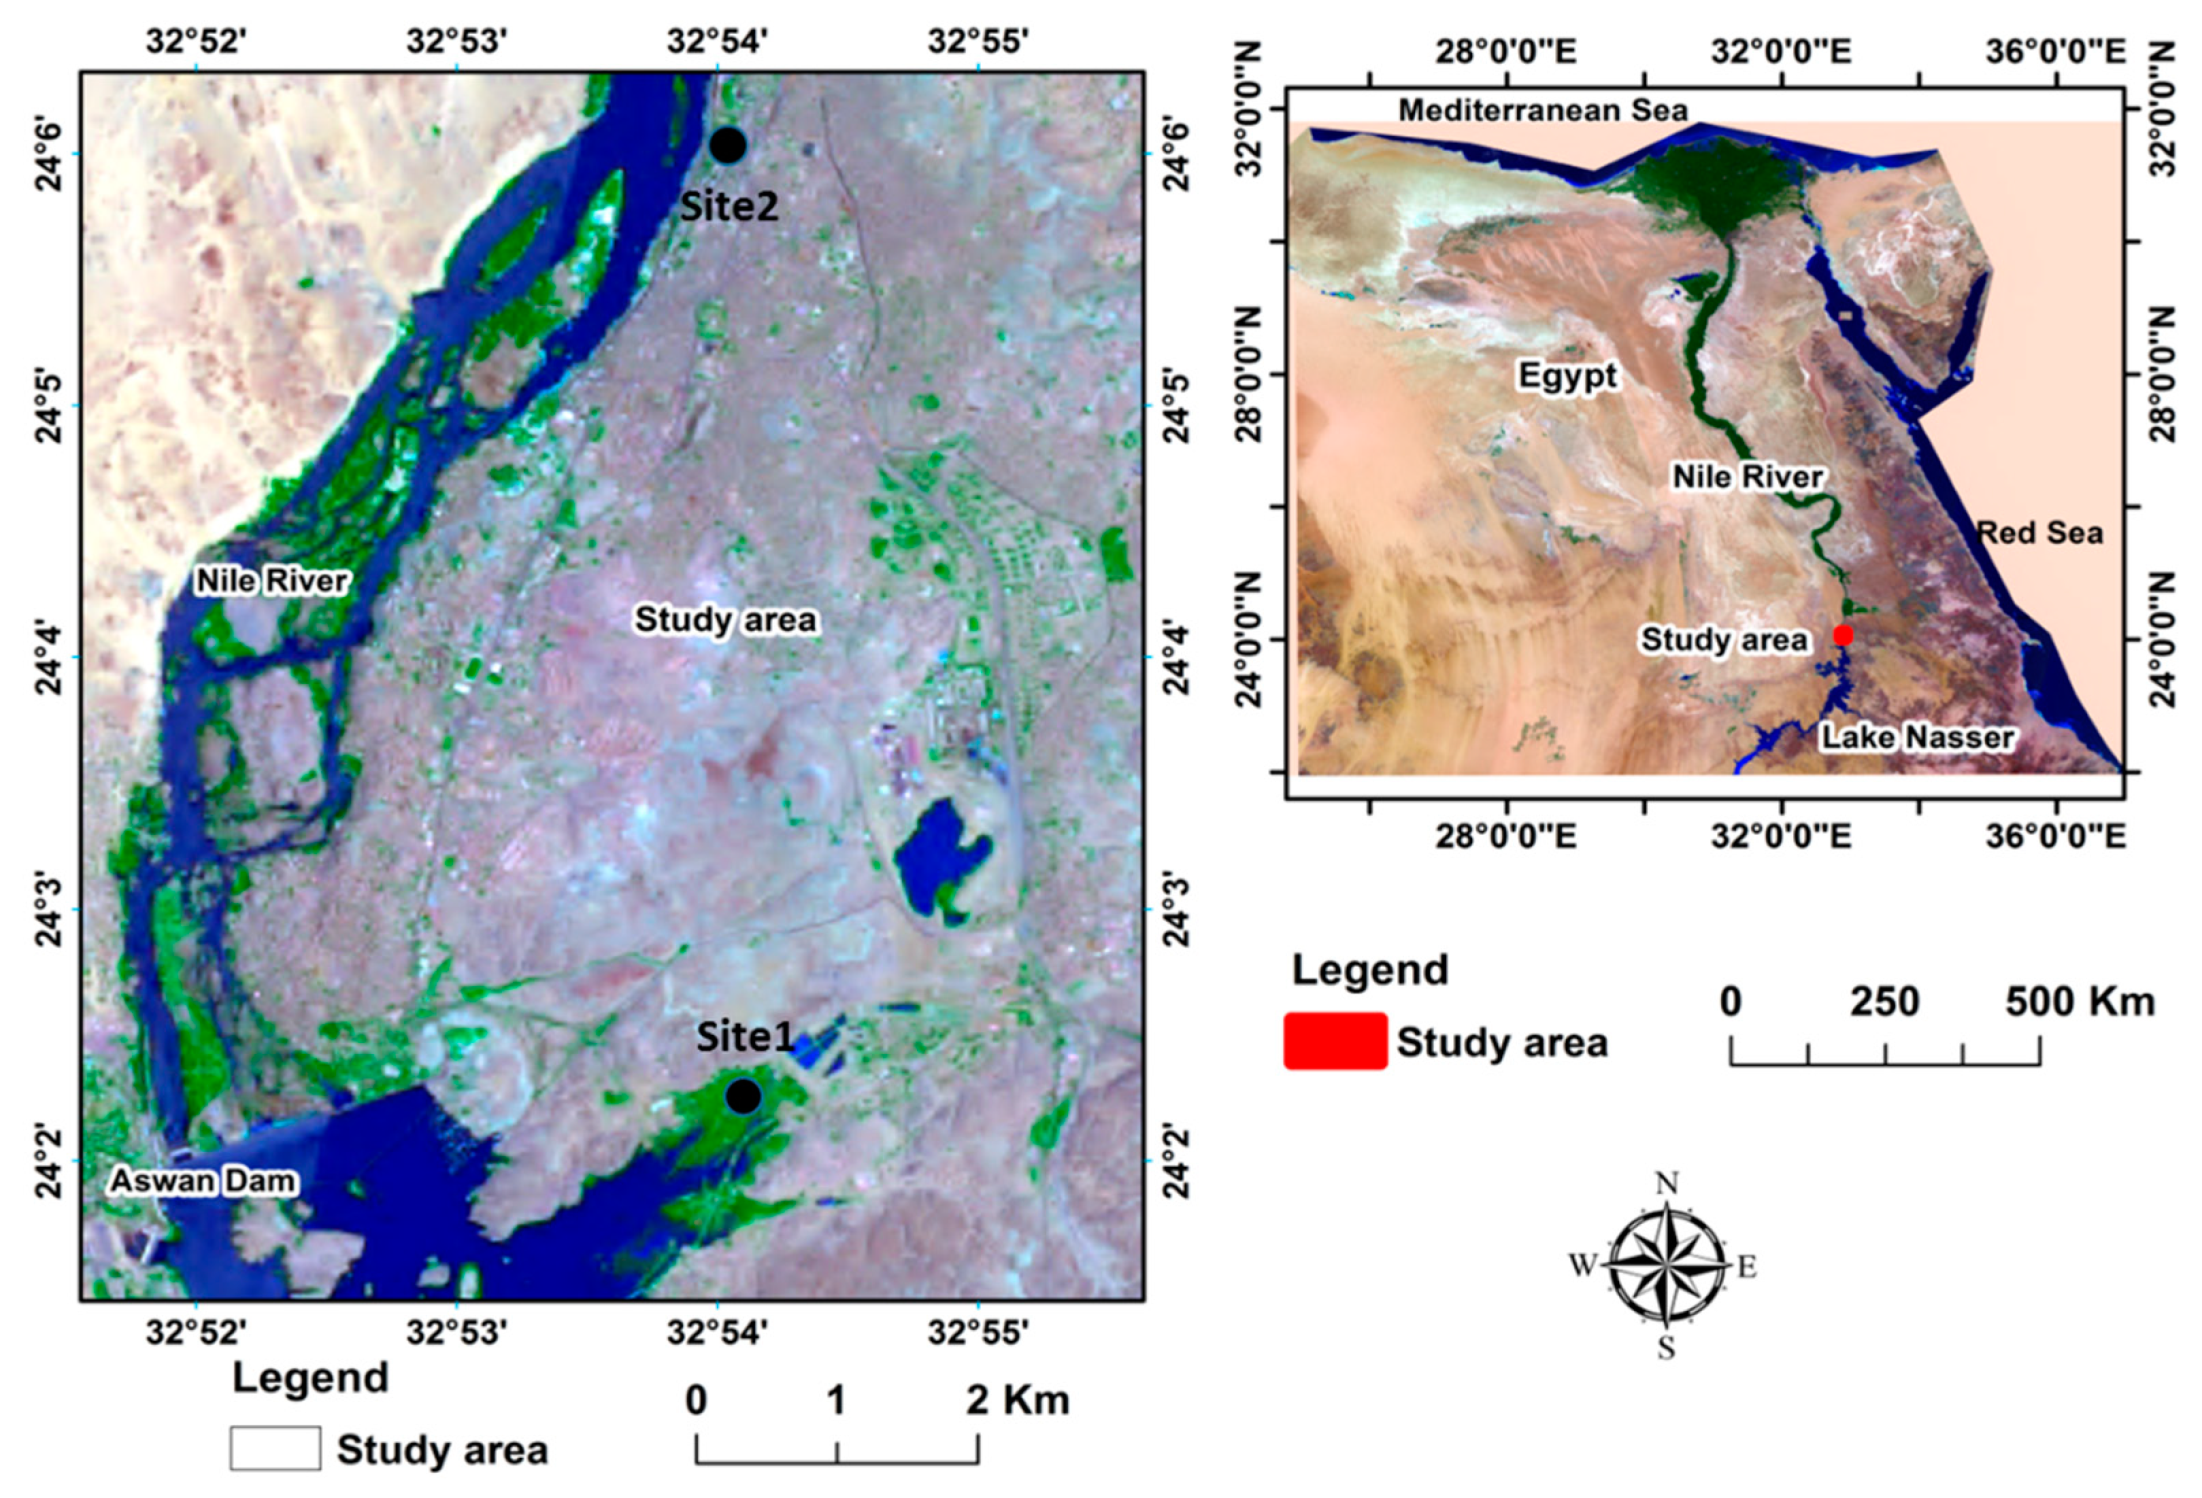
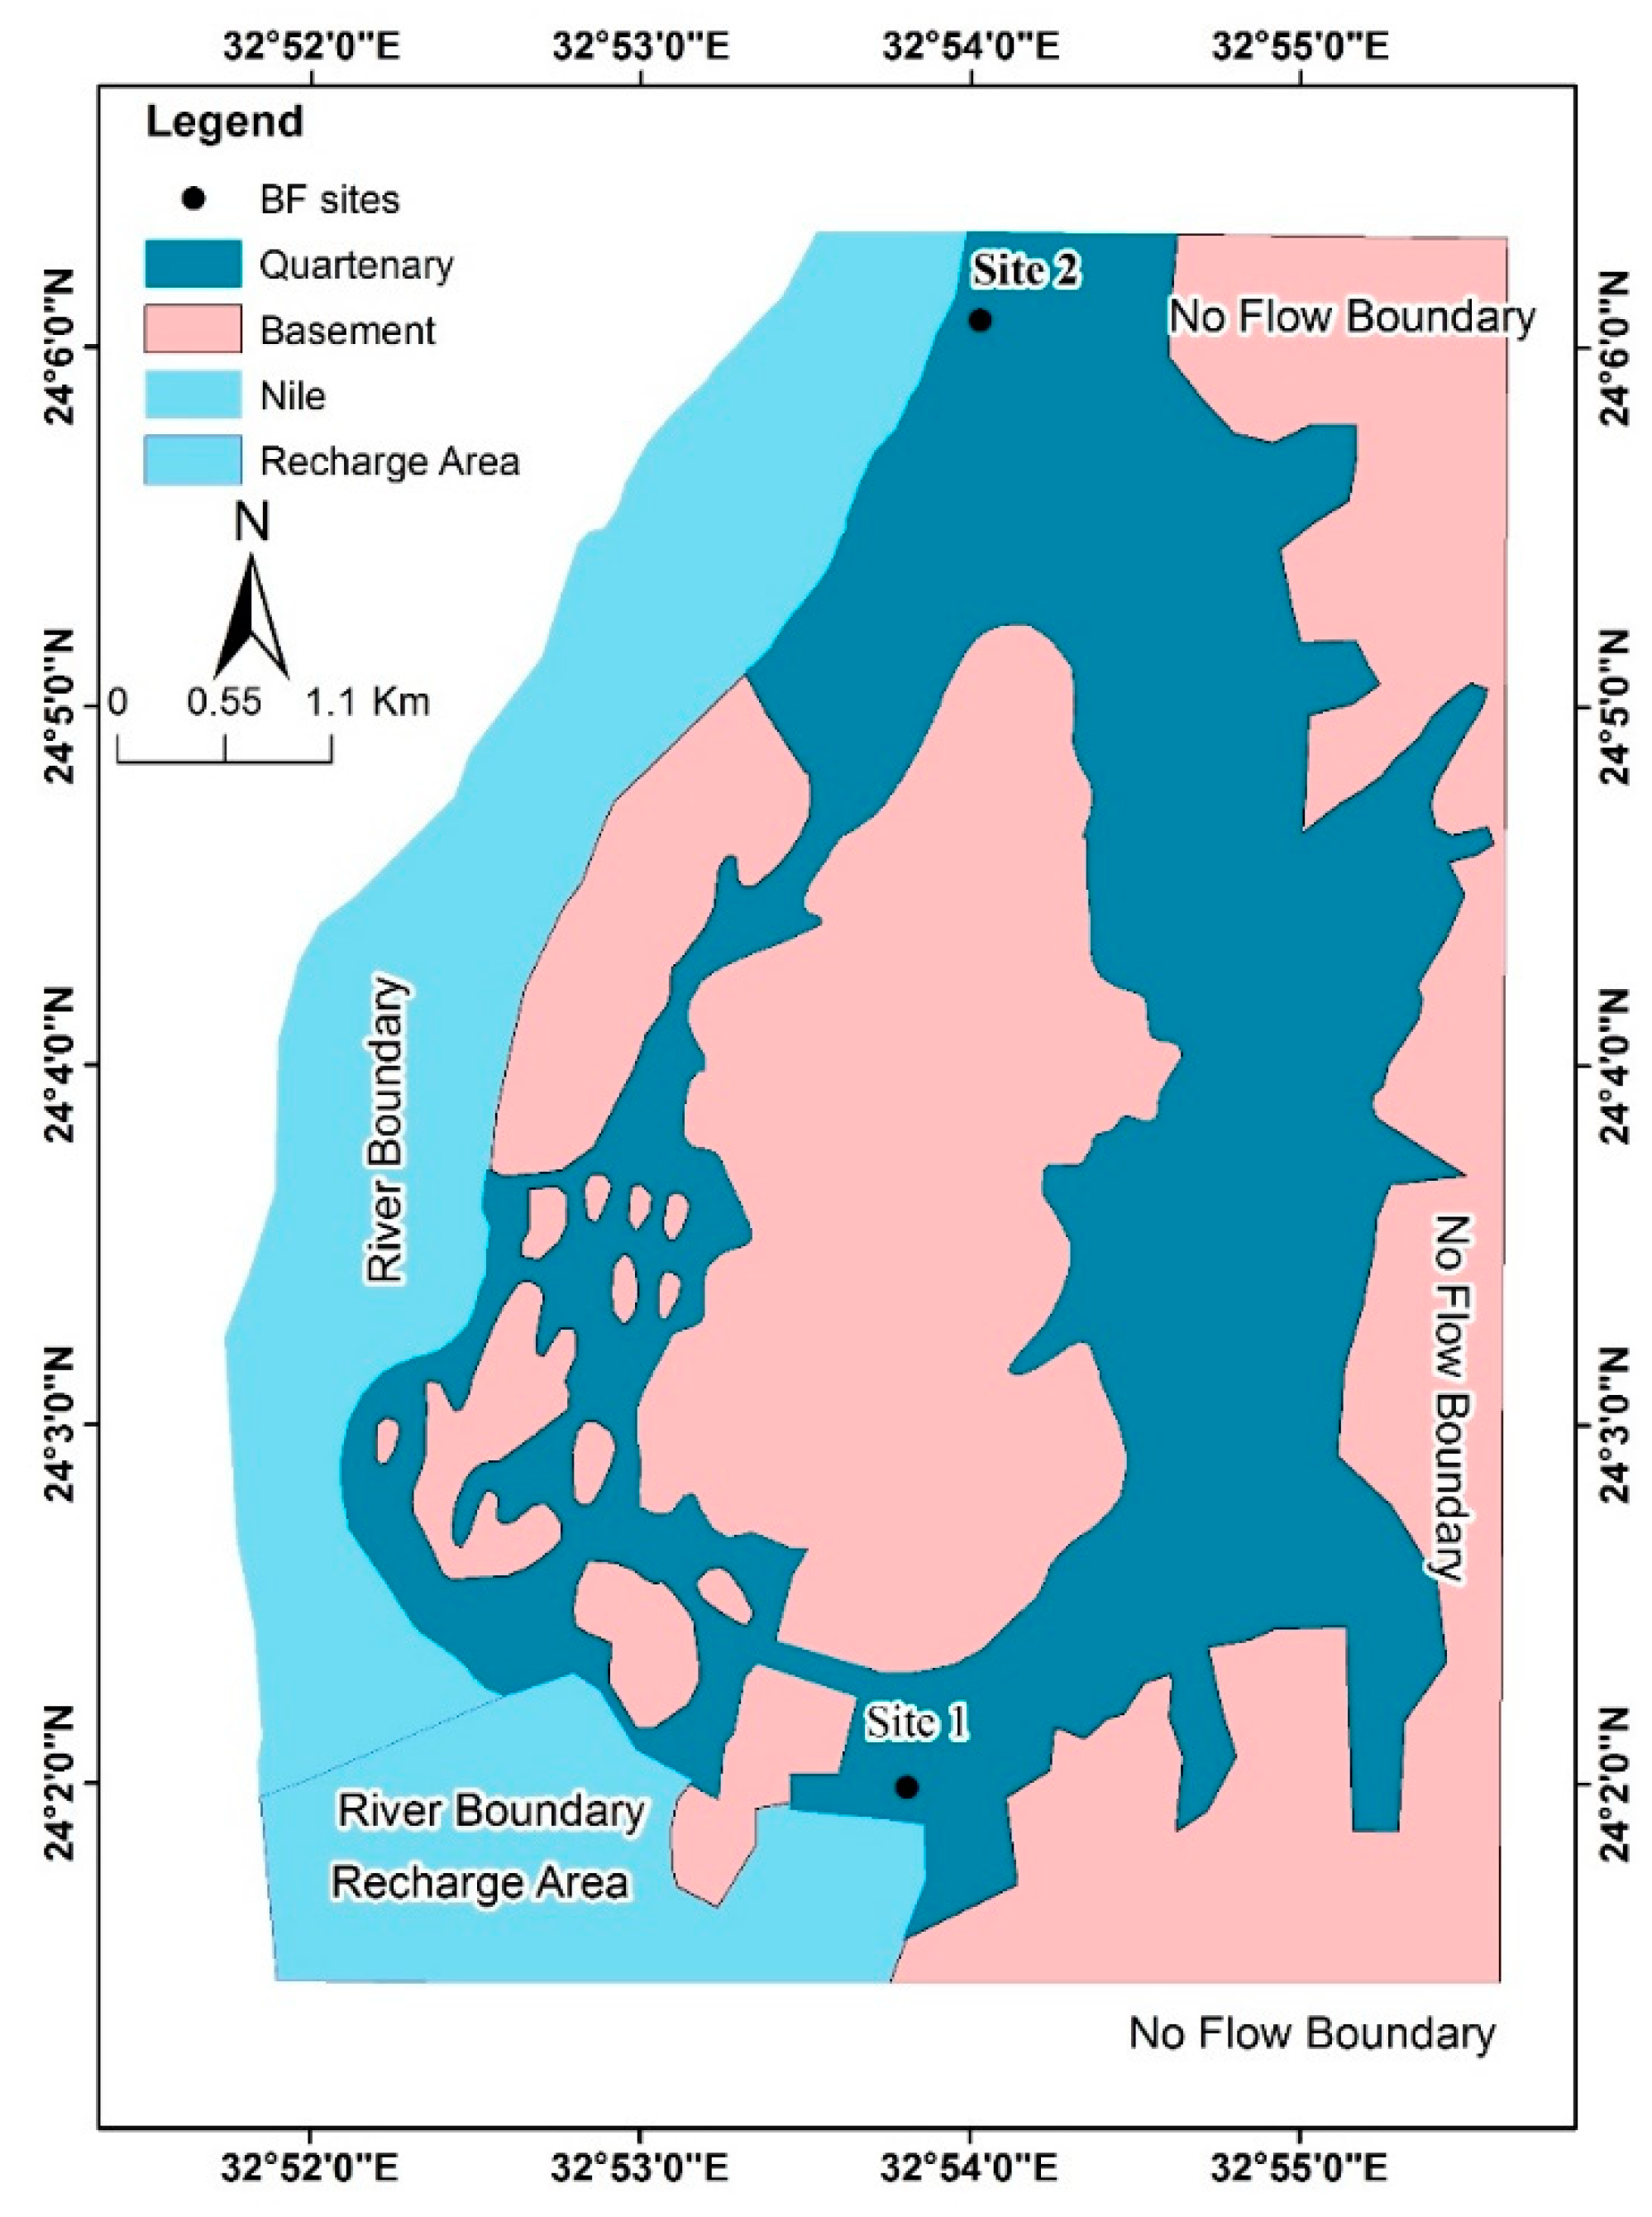
2. Study Area
3. Research Methods
3.1. Hydrological Model
3.1.1. Data Preparation
3.1.2. Model Development
3.1.3. Model Calibration
3.2. Development of BF Management Scenarios
3.3. Water Quality Characterization
3.4. Cost Analysis
4. Results and Discussion
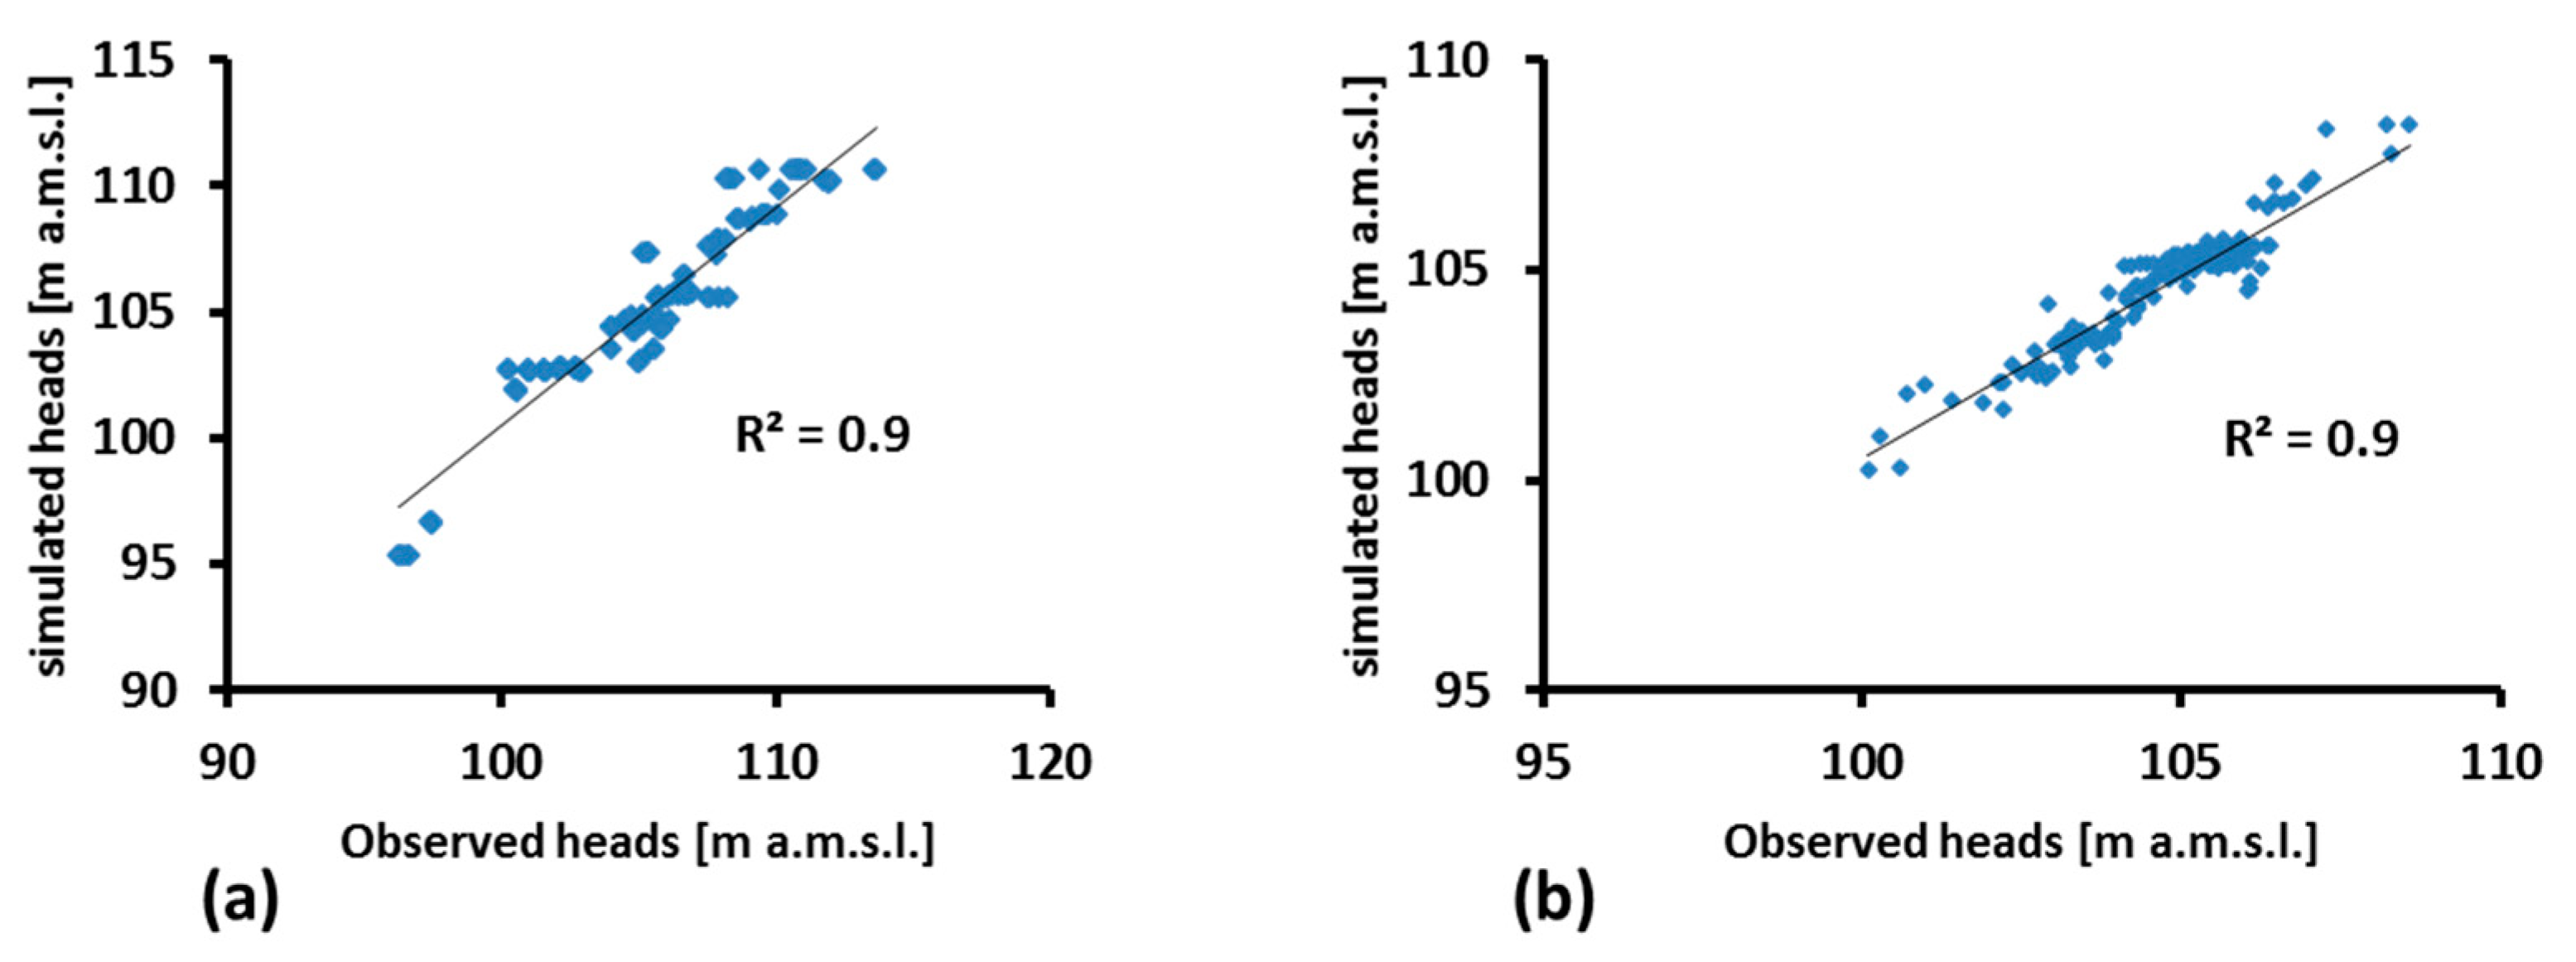
4.1. Calibration of the Model
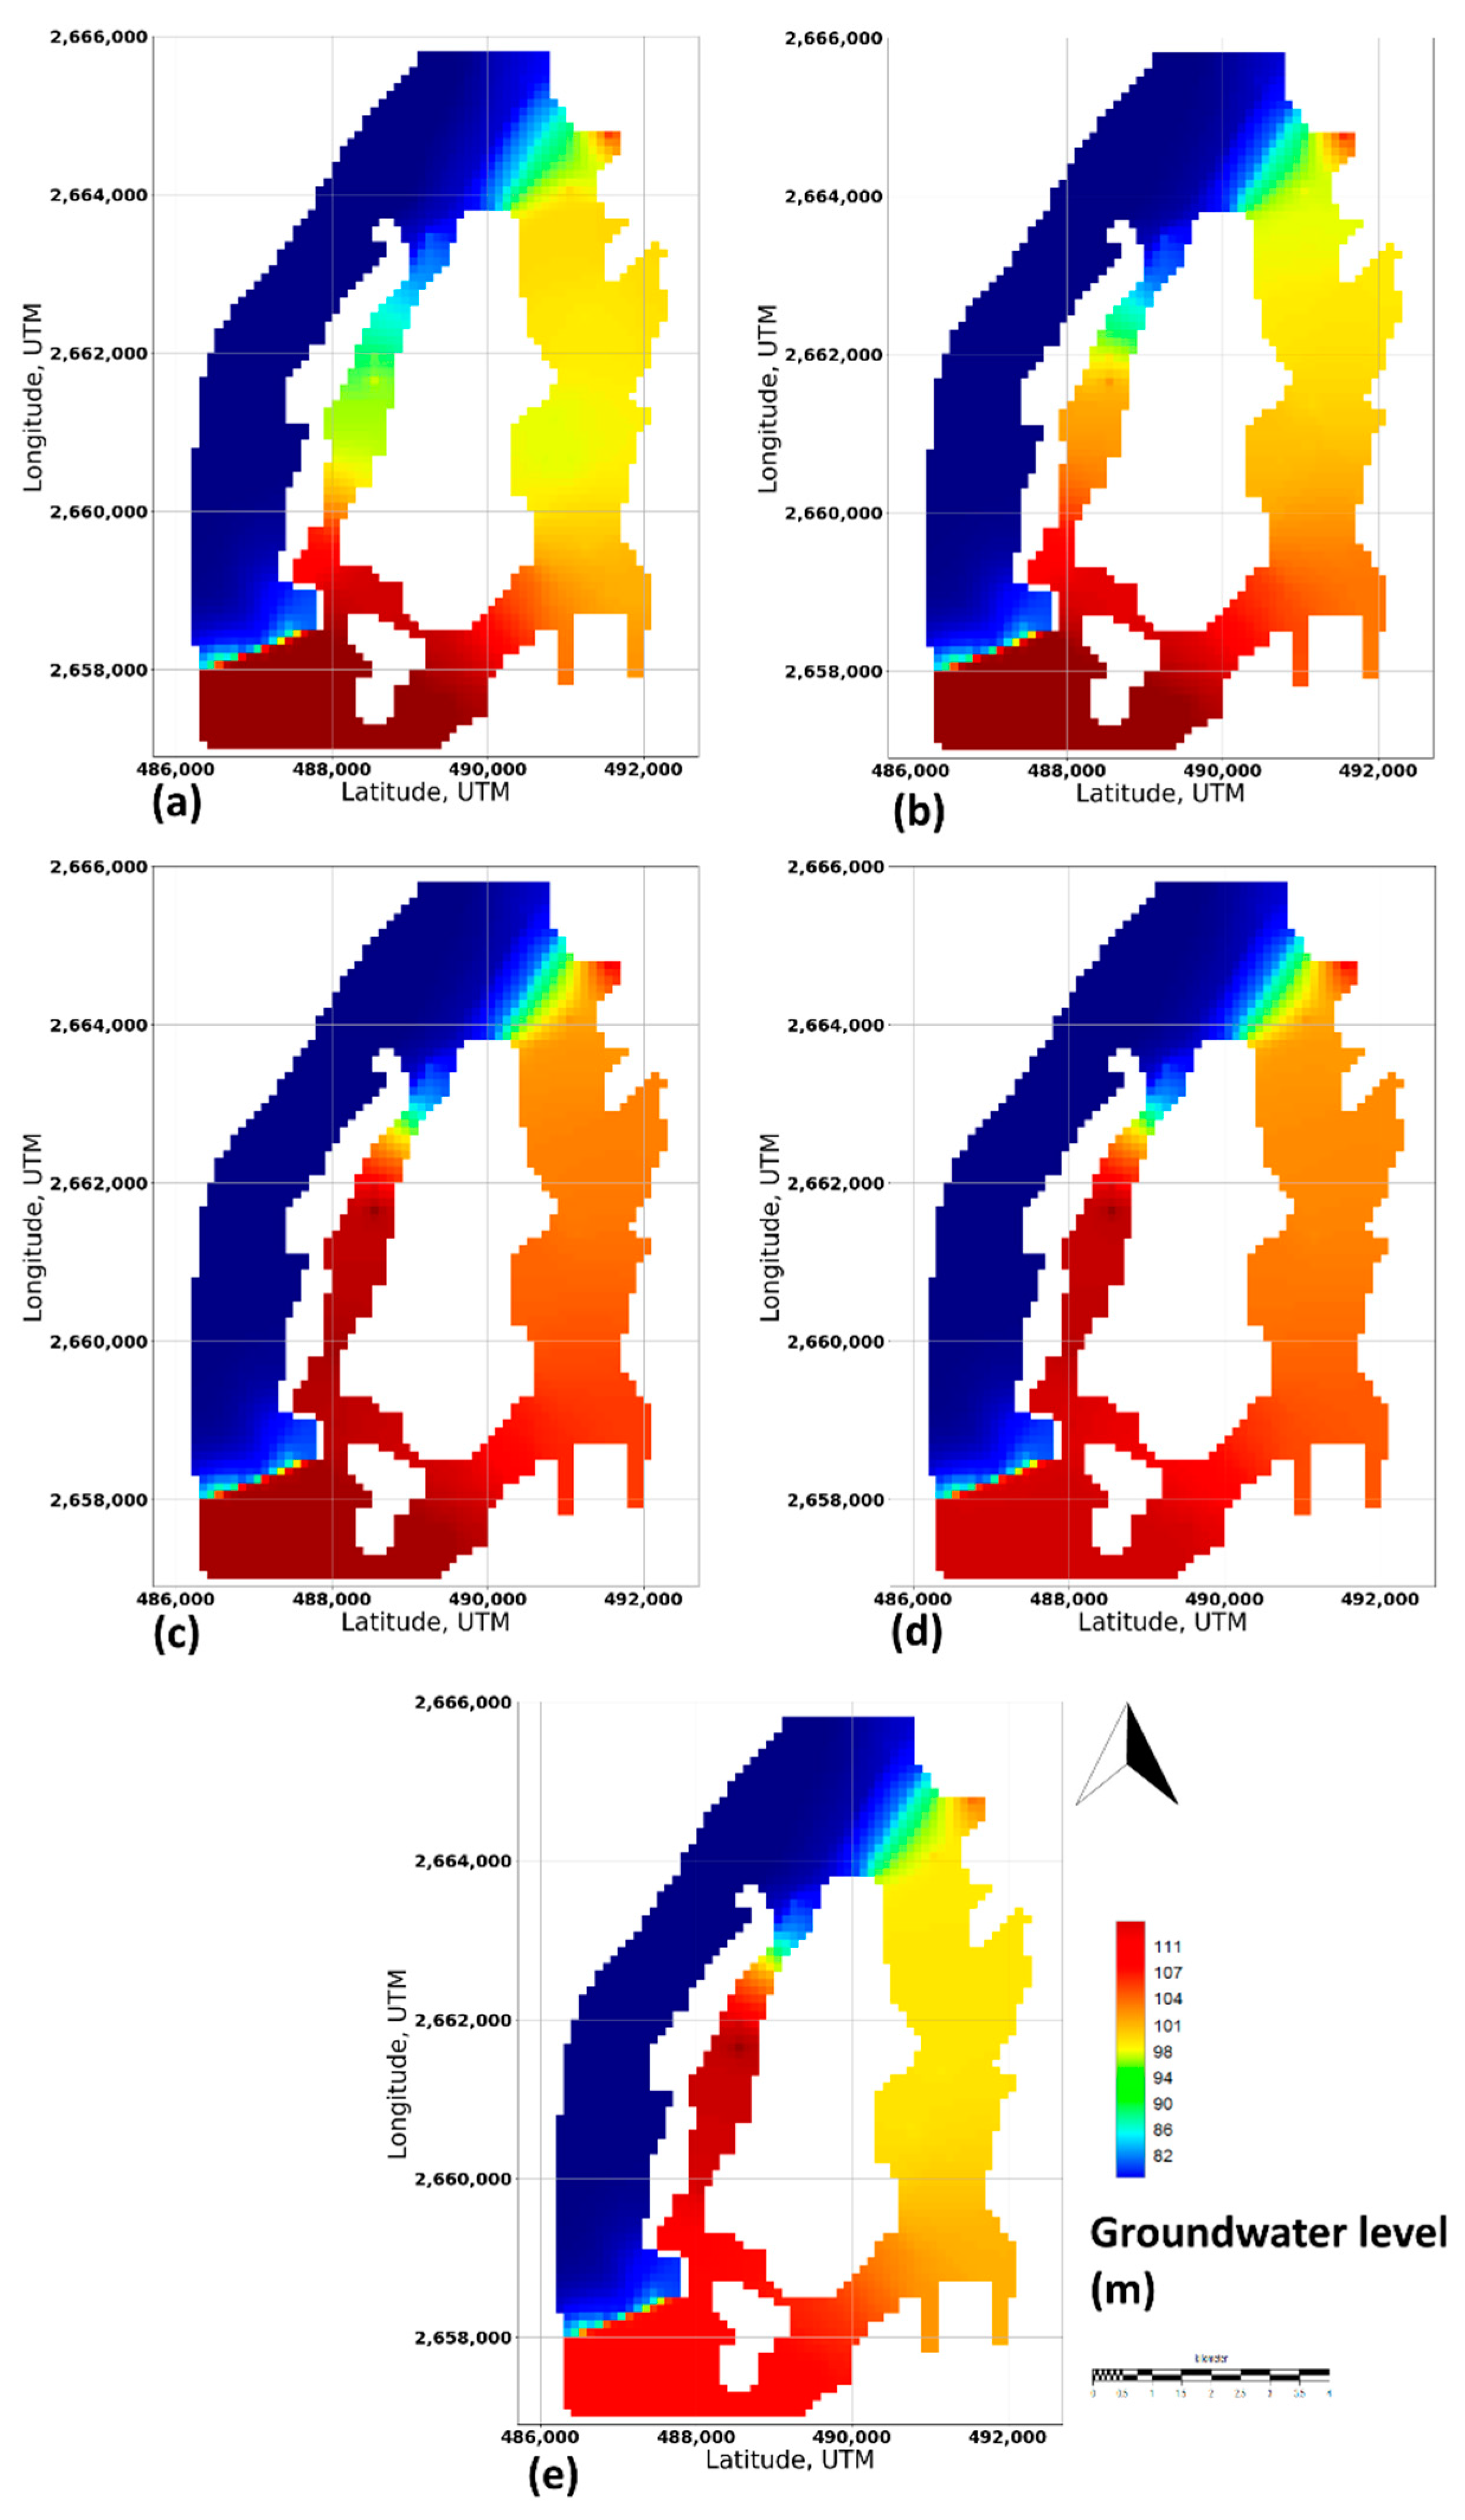
4.2. Aswan Aquifer Model (Current Situation)
4.3. Bank Filtration Management Scenarios
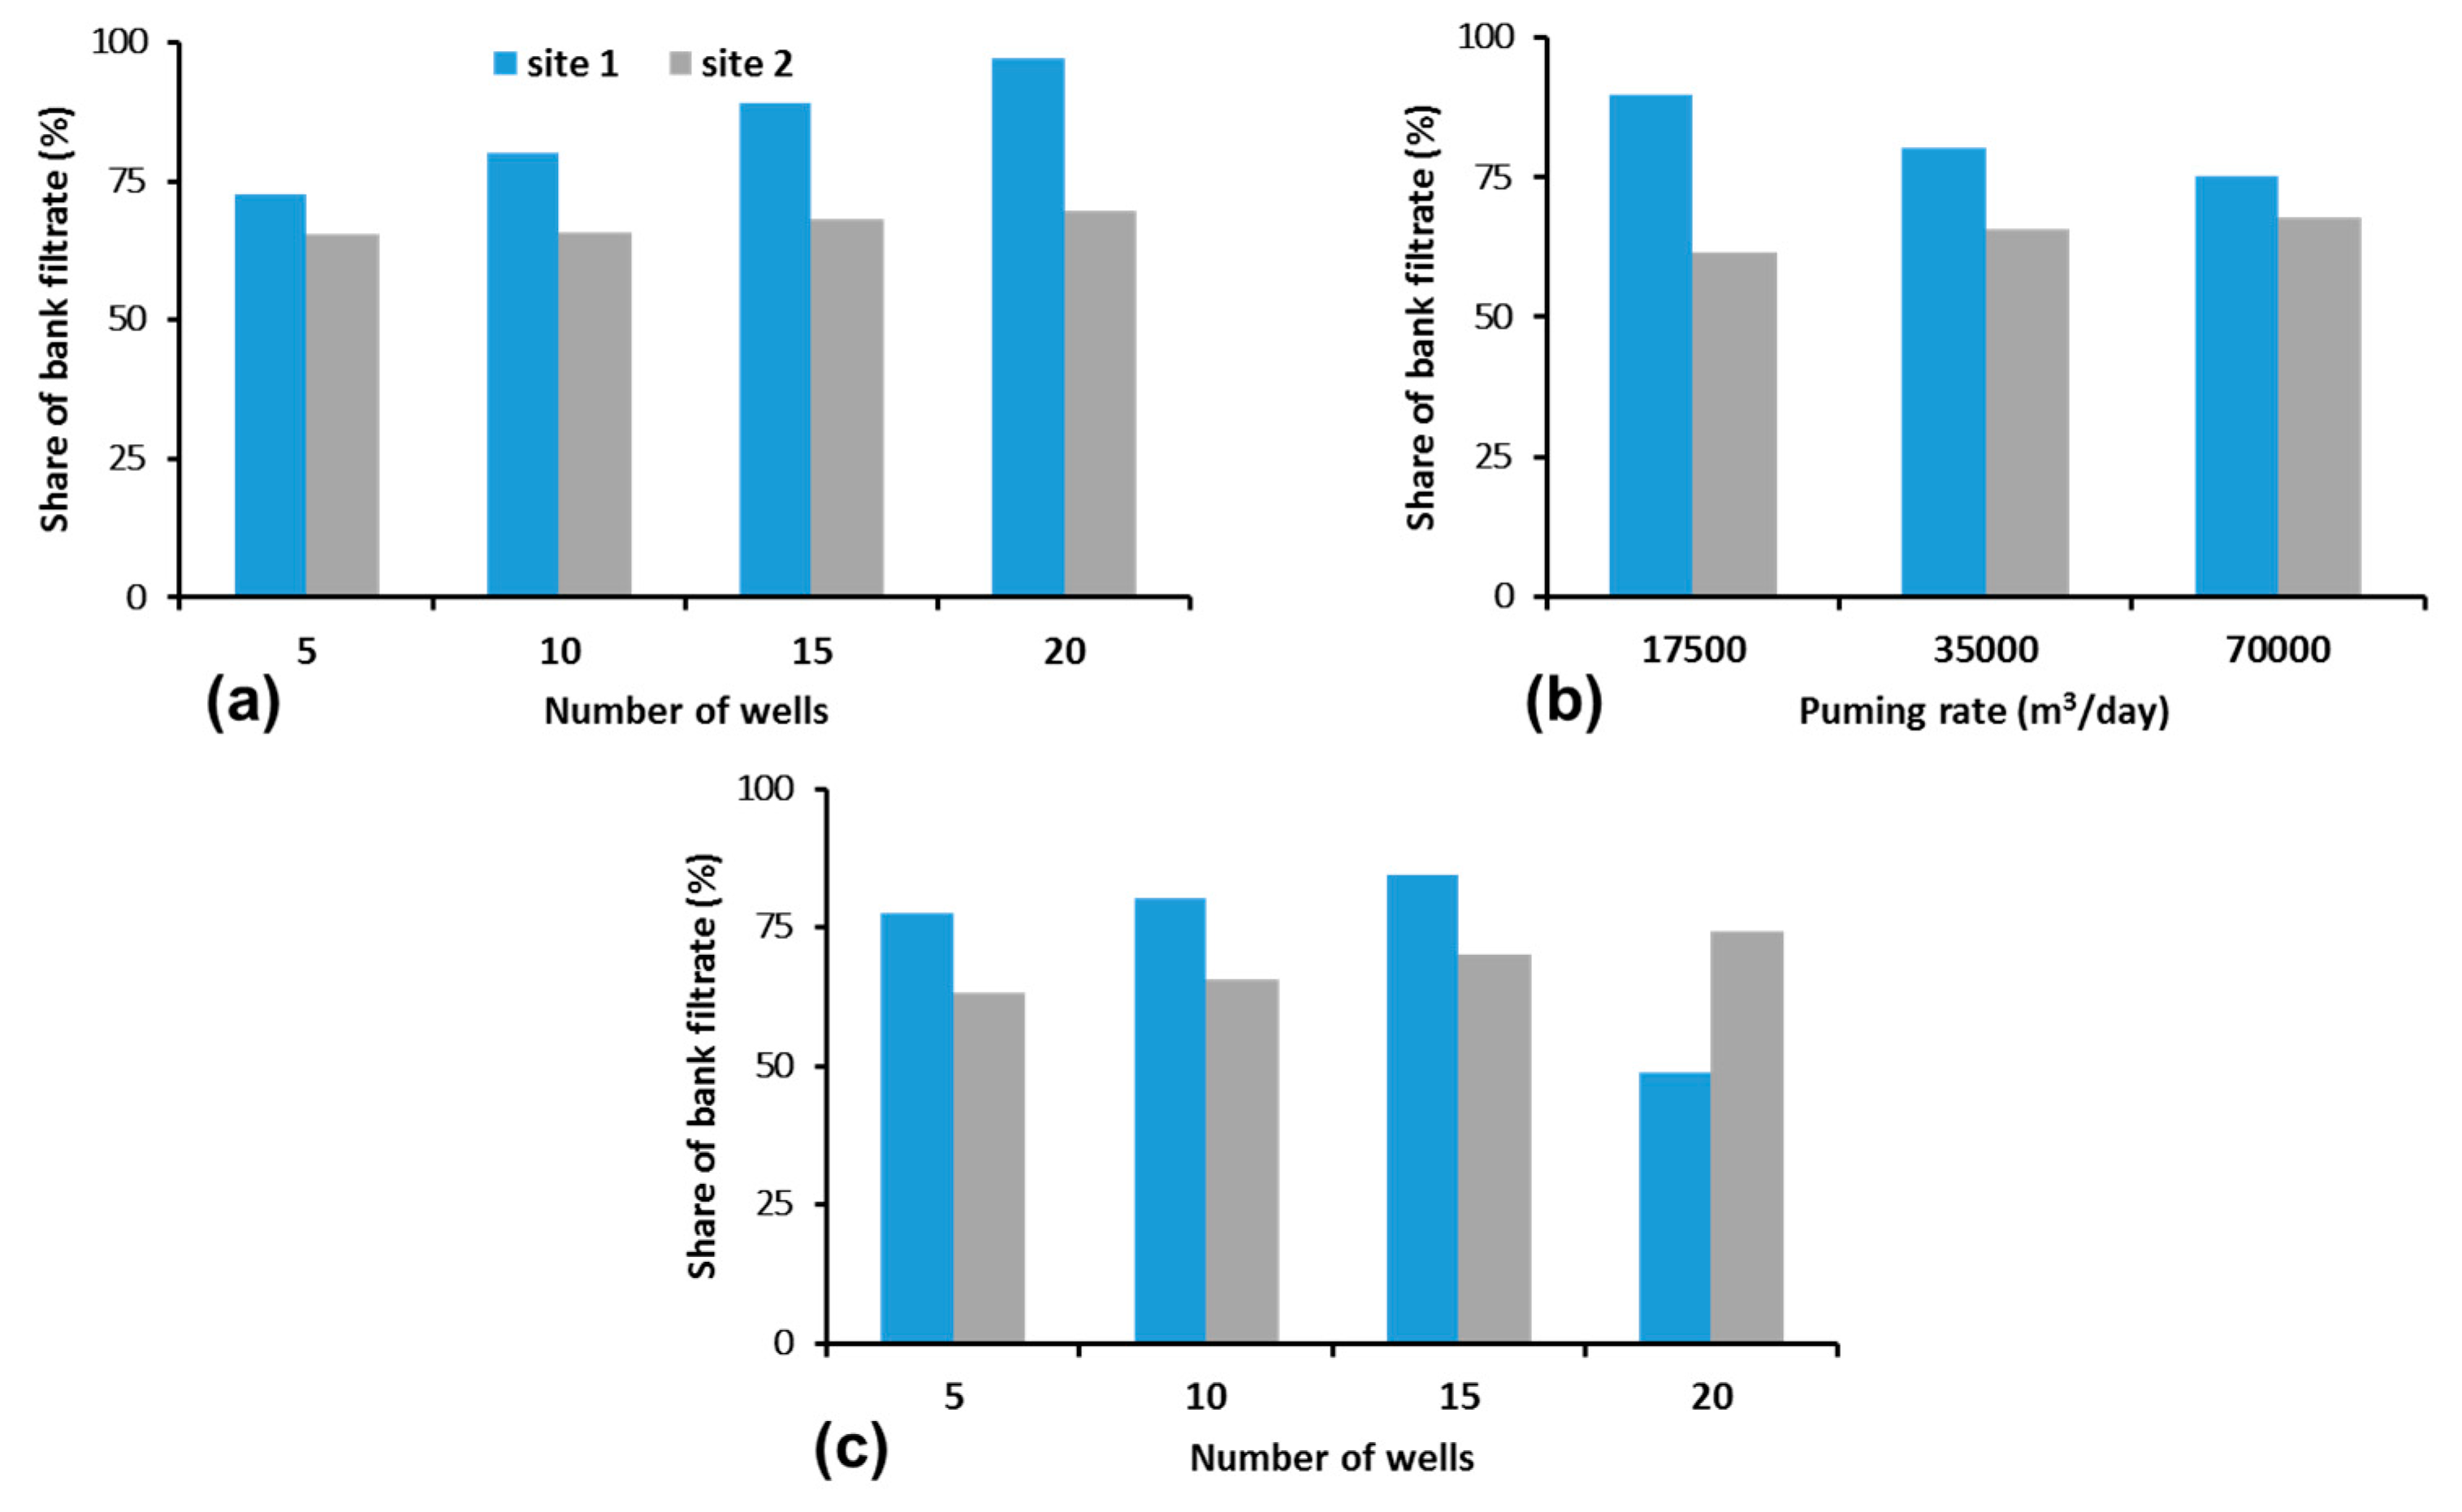
4.3.1. Effect of Number of Wells and Pumping Rate on BF Performance
- Scenario 1 (effect of the number of wells): Four simulations were conducted based on the number of wells; 5, 10, 15, and 20 wells, where the production capacity was the same (35,000 m3/day) in each simulation. The production capacity was divided equally on the number of wells, so that, in each simulation, each well has the same pumping rate.
- Scenario 2 (effect of pumping rate): Three simulations were conducted based on the pumping rates (35,000, 17,770, and 70,000 m3/day). The number of wells in each simulation was constant (10 wells).
- Scenario 3 (effect of increasing the number of wells and pumping rate simultaneously): A different groups of 5, 10, 15, and 20 wells were simulated with production capacity of 17,500, 35,000, 52,500, and 70,000 m3/day, respectively.
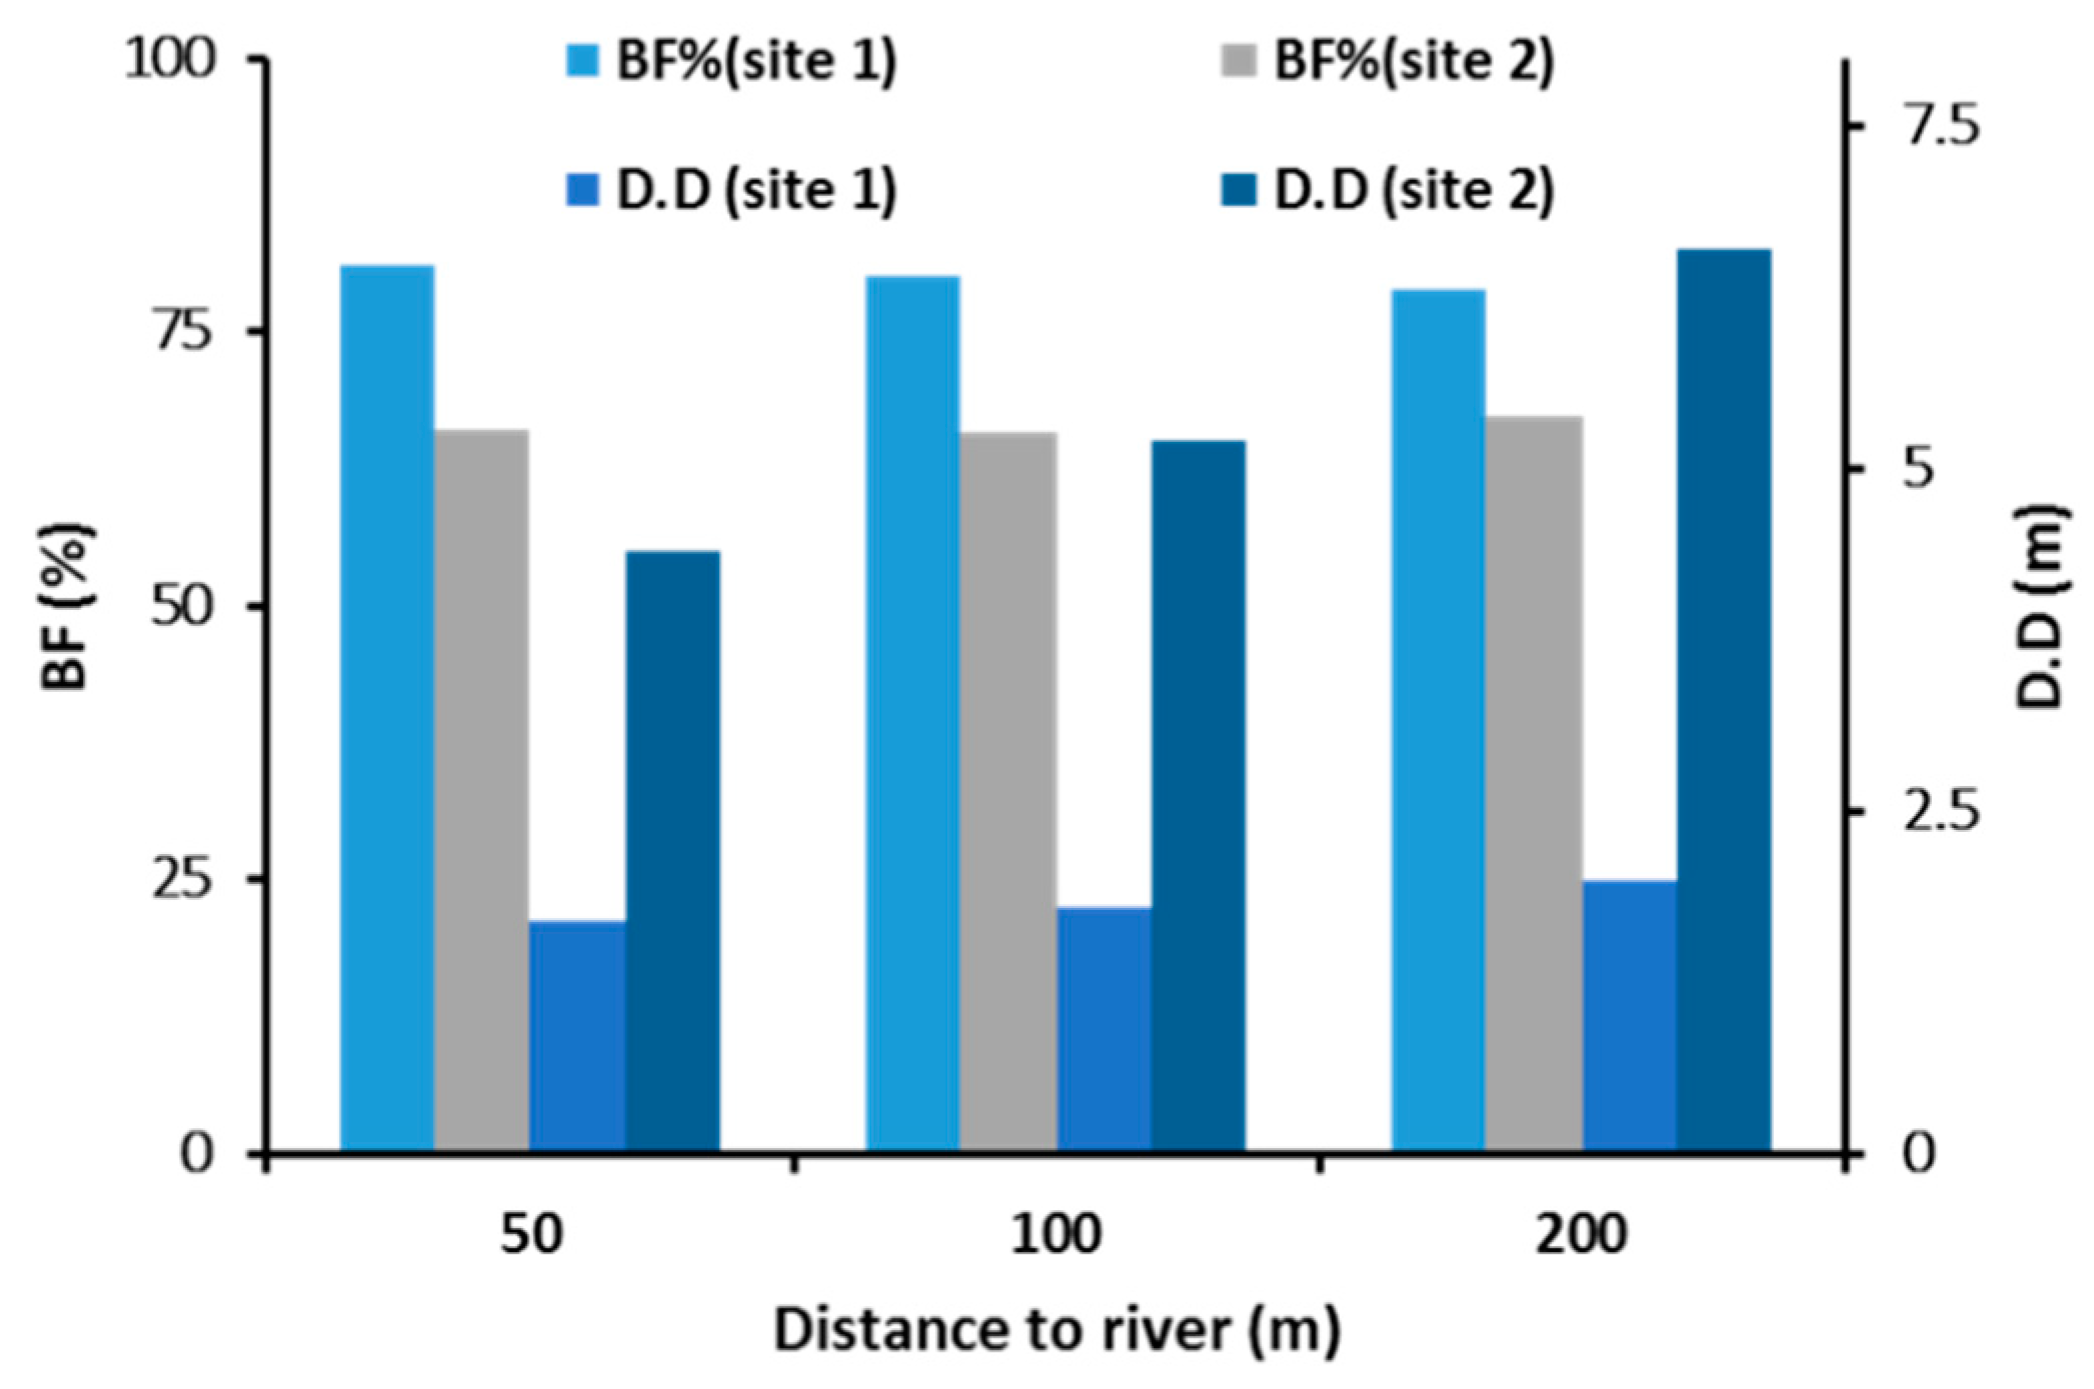
4.3.2. Effect of Distance of the Well from River on BF Performance
4.3.3. Effect of Well Spacing on BF Performance
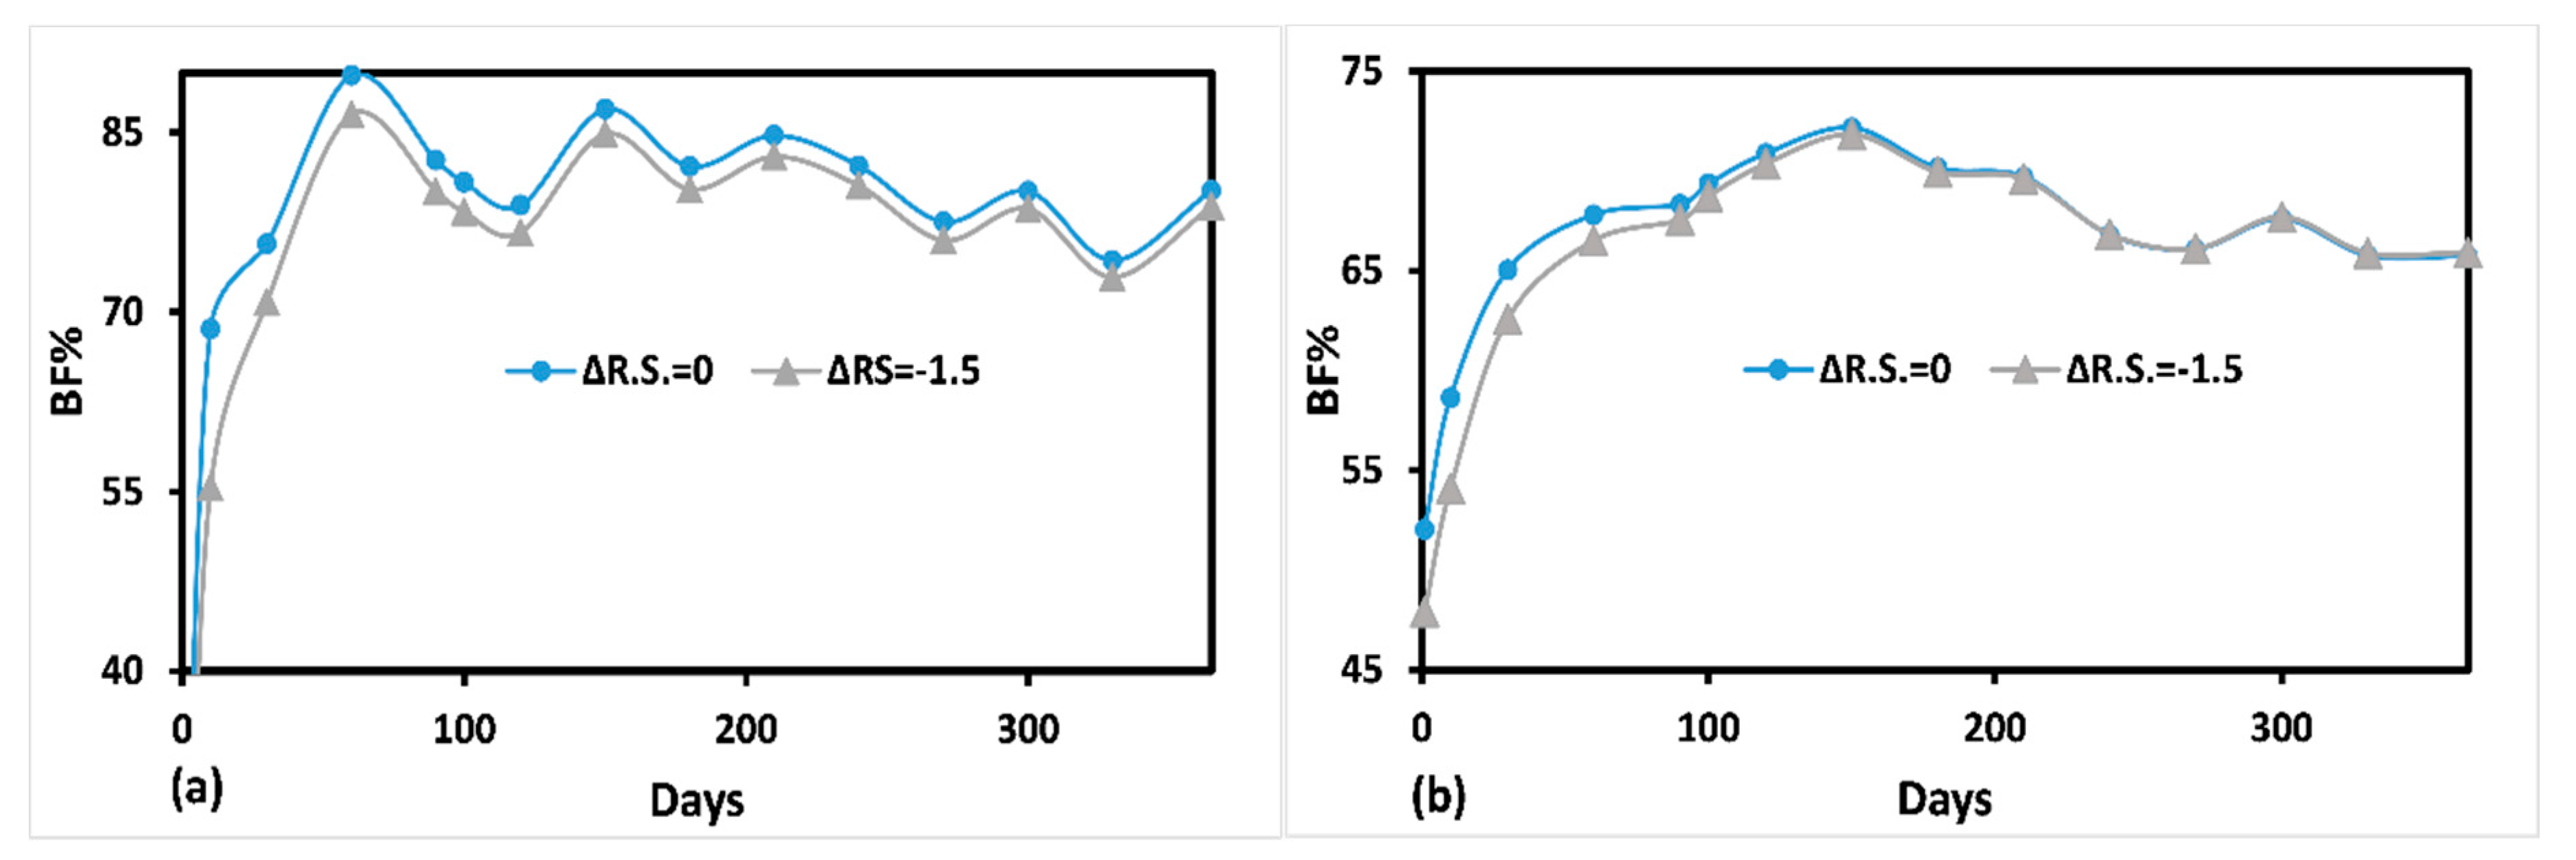
4.3.4. Effect of River Stage on BF Performance
4.4. Bank-Filtrate Chemistry
4.5. Economic Analysis
5. Conclusions
Supplementary Materials
Author Contributions
Funding
Acknowledgments
Conflicts of Interest
References
- Aboulroos, S.; Satoh, M. Challenges in exploiting resources—General conclusion. In Irrigated Agriculture in Egypt: Past, Present and Future; Satoh, M., Aboulroos, S., Eds.; Springer International Publishing: Cham, Switzerland, 2017; pp. 267–283. [Google Scholar] [CrossRef]
- Ghodeif, K.; Grischek, T.; Bartak, R.; Wahaab, R.; Herlitzius, J. Potential of river bank filtration (RBF) in Egypt. Environ. Earth Sci. 2016, 75, 1–13. [Google Scholar] [CrossRef]
- Shamrukh, M.; Abdel-Wahab, A. Water pollution and riverbank filtration for water supply along River Nile, Egypt. In Riverbank Filtration for Water Security in Desert Countries; Shamrukh, M., Ed.; Springer: Dordrecht, The Netherlands, 2011; pp. 5–28. [Google Scholar] [CrossRef]
- Wahaab, R.A.; Salah, A.; Grischek, T. Water quality changes during the initial operating phase of riverbank filtration sites in upper Egypt. Water 2019, 11, 1258. [Google Scholar] [CrossRef] [Green Version]
- Badr, E.-S.A. Spatio-temporal variability of dissolved organic nitrogen (DON), carbon (DOC), and nutrients in the Nile River, Egypt. Environ. Monit. Assess. 2016, 188, 580. [Google Scholar] [CrossRef] [PubMed]
- Ray, C.; Melin, G.; Linsky, R.B. (Eds.) Riverbank Filtration: Improving Source-Water Quality; Water Science and Technology Library; Kluwer Acad. Publ: Dordrecht, The Netherlands, 2002; ISBN 978-1-4020-1133-7. [Google Scholar]
- Sandhu, C.; Grischek, T.; Börnick, H.; Feller, J.; Sharma, S.K. A water quality appraisal of some existing and potential riverbank filtration sites in India. Water 2019, 11, 215. [Google Scholar] [CrossRef] [Green Version]
- Boving, T.B.; Patil, K.; D’Souza, F.; Barker, S.F.; McGuinness, S.L.; O’Toole, J.; Sinclair, M.; Forbes, A.B.; Leder, K. Performance of riverbank filtration under hydrogeologic conditions along the upper Krishna River in Southern India. Water 2018, 11, 12. [Google Scholar] [CrossRef] [Green Version]
- Pan, W.; Huang, Q.; Huang, G. Nitrogen and organics removal during riverbank filtration along a reclaimed water restored river in Beijing, China. Water 2018, 10, 491. [Google Scholar] [CrossRef] [Green Version]
- Romero-Esquivel, L.G.; Grischek, T.; Pizzolatti, B.S.; Mondardo, R.I.; Sens, M.L. Bank filtration in a coastal lake in South Brazil: Water quality, natural organic matter (NOM) and redox conditions study. Clean Techn. Environ. Policy 2017, 19, 2007–2020. [Google Scholar] [CrossRef]
- Hamdan, A.; Sensoy, M.; Mansour, M. Evaluating the effectiveness of bank infiltration process in new Aswan City, Egypt. Arab. J. Geosci. 2013, 6, 4155–4165. [Google Scholar] [CrossRef]
- Bartak, R.; Grischek, T.; Ghodeif, K.; Wahaab, R. Shortcomings of the RBF Pilot Site in Dishna, Egypt. J. Hydrol. Eng. 2014, 05014033. [Google Scholar] [CrossRef]
- El-Nashar, W.Y.; Elyamany, A.H. Managing risks of the Grand ethiopian renaissance dam on Egypt. Ain Shams Eng. J. 2018, 9, 2383–2388. [Google Scholar] [CrossRef]
- Abdelhalim, A.; Sefelnasr, A.; Ismail, E. Response of the interaction between surface water and groundwater to climate change and proposed megastru cture. J. Afr. Earth Sci. 2020, 162, 103723. [Google Scholar] [CrossRef]
- Beyene, T.; Lettenmaier, D.P.; Kabat, P. Hydrologic impacts of climate change on the Nile River Basin: Implications of the 2007 IPCC scenarios. Clim. Chang. 2010, 100, 433–461. [Google Scholar] [CrossRef]
- Grützmacher, G.; Wessel, G.; Klitzke, S.; Chorus, I. Microcystin elimination during sediment contact. Environ. Sci. Technol. 2010, 44, 657–662. [Google Scholar] [CrossRef] [PubMed]
- Wintgens, T.; Nättorp, A.; Elango, L.; Asolekar, S.R. (Eds.) Natural Water Treatment Systems for Safe and Sustainable Water Supply in the Indian Context, Saph Pani; IWA Publishing: London, UK, 2016; ISBN 978-1-78040-710-4. [Google Scholar]
- Maeng, S.K.; Ameda, E.; Sharma, S.K.; Grützmacher, G.; Amy, G.L. Organic micropollutant removal from wastewater effluent-impacted drinking water sources during bank filtration and artificial recharge. Water Res. 2010, 44, 4003–4014. [Google Scholar] [CrossRef] [PubMed]
- Sandhu, C. A Concept for the Investigation of Riverbank Filtration Sites for Potable Water Supply in India. Ph.D. Thesis, Faculty of Civil Engineering and Architecture, Dresden University of Applied Sciences, and Faculty of Environmental Sciences, Dresden, Germany, 2015. [Google Scholar]
- Selim, S.; Hamdan, A.; Rady, A. Groundwater rising as environmental problem, causes and solutions: Case study from aswan city, upper Egypt. Open J. Geol. 2014, 4, 324–341. [Google Scholar] [CrossRef] [Green Version]
- Hamdan, A.; Abdel Rady, A. Vulnerability of the groundwater in the Quaternary aquifer at El Shalal-Kema area, Aswan, Egypt. Arab J. Geosci. 2011, 6, 337–358. [Google Scholar] [CrossRef]
- Misahah al-Jiyulujiyah, A.-M.; Attia, M.I. Deposits in the Nile Valley and the Delta; Government Press: Cairo, Egypt, 1954. [Google Scholar]
- McDonald, M.G.; Harbaugh, A.W. A Modular Three-Dimensional Finite-Difference Ground-Water Flow Model; Open-File Report 83-875; U.S. Geological Survey: Reston, VA, USA, 1988. [Google Scholar]
- Environmental Systems Research Institute (ESRI). ArcGIS Desktop: Release 10; Environmental Systems Research Institute: Redlands, CA, USA, 2011. [Google Scholar]
- Farr, T.G.; Kobrick, M. Shuttle radar topography mission produces a wealth of data. Eos Trans. Am. Geophys. Union 2000, 81, 583–585. [Google Scholar] [CrossRef]
- Cressie, N. The origins of kriging. Math. Geol. 1990, 22, 239–252. [Google Scholar] [CrossRef]
- Shamrukh, M.; Corapcioglu, M.Y.; Hassona, F.A.A. Modeling the effect of chemical fertilizers on groundwater quality in the Nile Valley aquifer. Ground Water 2001, 39, 59–67. [Google Scholar] [CrossRef]
- El-Zehairy, A.A.M.E. Assessment of Lake—Groundwater Interactions: Turawa Case, Poland. Master’s Thesis, University of Twente Faculty of Geo-Information and Earth Observation (ITC), Enschede, The Netherlands, 2014. [Google Scholar]
- Pollock, D.W. Documentation of Computer Programs to Compute and Display Pathlines Using Results from the U.S. Geological Survey Modular Three-Dimensional Finite Difference Ground-Water Flow Model; U.S. Geological Survey: Reston, VA, USA, 1989. [Google Scholar]
- Harbaugh, A.W. A Computer Program for Calculating Subregional Water Budgets Using Results from the U.S. Geological Survey Modular Three-dimensional Groundwater Flow Model; Open-File Report 90–392; USGS: Reston, VA, USA, 1990; p. 46. [Google Scholar]
- Maeng, S.K.; Lee, K.-H. Riverbank filtration for the water supply on the Nakdong River, South Korea. Water 2019, 11, 129. [Google Scholar] [CrossRef] [Green Version]
- Abdelrady, A.; Sharma, S.; Sefelnasr, A.; Abogbal, A.; Kennedy, M. Investigating the impact of temperature and organic matter on the removal of selected organic micropollutants during bank filtration: A batch study. J. Environ. Chem. Eng. 2019, 7, 102904. [Google Scholar] [CrossRef]
- Leenheer, J.A.; Croué, J.-P. Peer reviewed: Characterizing aquatic dissolved organic matter. Environ. Sci. Technol. 2003, 37, 18A–26A. [Google Scholar] [CrossRef] [Green Version]
- Coble, P.G. Characterization of marine and terrestrial DOM in seawater using excitation-emission matrix spectroscopy. Mar. Chem. 1996, 51, 325–346. [Google Scholar] [CrossRef]
- Gabor, R.S.; Baker, A.; McKnight, D.M.; Miller, M.P. Fluorescence indices and their interpretation. In Aquatic Organic Matter Fluorescence; Baker, A., Reynolds, D.M., Lead, J., Coble, P.G., Spencer, R.G.M., Eds.; Cambridge University Press: Cambridge, UK, 2014; pp. 303–338. [Google Scholar] [CrossRef]
- Lamontagne, S.; Taylor, A.R.; Batlle-Aguilar, J.; Suckow, A.; Cook, P.G.; Smith, S.D.; Morgenstern, U.; Stewart, M.K. River infiltration to a subtropical alluvial aquifer inferred using multiple environmental tracers. Water Resour. Res. 2015, 51, 4532–4549. [Google Scholar] [CrossRef] [Green Version]
- Zhu, Y.; Zhai, Y.; Teng, Y.; Wang, G.; Du, Q.; Wang, J.; Yang, G. Water supply safety of riverbank filtration wells under the impact of surface water-groundwater interaction: Evidence from long-term field pumping tests. Sci. Total Environ. 2020, 711, 135141. [Google Scholar] [CrossRef] [PubMed]
- Sharma, S.K.; Chaweza, D.; Bosuben, N.; Holzbecher, E.; Amy, G. Framework for feasibility assessment and performance analysis of riverbank filtration systems for water treatment. J. Water Supply Res. Technol.-AQUA 2012, 61, 73–81. [Google Scholar] [CrossRef]
- Abdelrady, A.; Sharma, S.; Sefelnasr, A.; Kennedy, M. Characterisation of the impact of dissolved organic matter on iron, manganese, and arsenic mobilisation during bank filtration. J. Environ. Manag. 2020, 258, 110003. [Google Scholar] [CrossRef] [PubMed]
- WHO. Guidelines for Drinking-Water Quality, 4th ed.; World Health Organization: Geneva, Switzerland, 2011; p. 564. ISBN 978 92 4 154815 1. [Google Scholar]
- Dragon, K.; Górski, J.; Kruć, R.; Drożdżyński, D.; Grischek, T. Removal of natural organic matter and organic micropollutants during riverbank filtration in Krajkowo, Poland. Water 2018, 10, 1457. [Google Scholar] [CrossRef] [Green Version]
- Nagy-Kovács, Z.; Davidesz, J.; Czihat-Mártonné, K.; Till, G.; Fleit, E.; Grischek, T. Water quality changes during riverbank filtration in Budapest, Hungary. Water 2019, 11, 302. [Google Scholar] [CrossRef] [Green Version]
- Maeng, S.K.; Sharma, S.K.; Magic-Knezev, A.; Amy, G. Fate of effluent organic matter (EfOM) and natural organic matter (NOM) through riverbank filtration. Water Sci. Technol. J. Int. Assoc. Water Pollut. Res. 2008, 57, 1999–2007. [Google Scholar] [CrossRef] [Green Version]
- Schoenheinz, D. DOC as Control Parameter for the Evaluation and Management of Aquifers with Anthropogenic Influenced Infiltration. Ph.D. Thesis, Faculty of Forestry, Geo and Hydro Sciences, Dresden University of Technology, Dresden, Germany, 2004. [Google Scholar]
- Abdelrady, A.; Sharma, S.; Sefelnasr, A.; Kennedy, M. The Fate of Dissolved Organic Matter (DOM) during bank filtration under different environmental conditions: Batch and column studies. Water 2018, 10, 1730. [Google Scholar] [CrossRef] [Green Version]
- Grünheid, S.; Amy, G.; Jekel, M. Removal of bulk dissolved organic carbon (DOC) and trace organic compounds by bank filtration and artificial recharge. Water Res. 2005, 39, 3219–3228. [Google Scholar] [CrossRef] [PubMed]
- Kedziorek, M.A.M.; Geoffriau, S.; Bourg, A.C.M. Organic matter and modeling redox reactions during river bank filtration in an alluvial aquifer of the Lot River, France. Environ. Sci. Technol. 2008, 42, 2793–2798. [Google Scholar] [CrossRef] [PubMed]
- Awad, J.; van Leeuwen, J.; Chow, C.; Drikas, M.; Smernik, R.J.; Chittleborough, D.J.; Bestland, E. Characterization of dissolved organic matter for prediction of trihalomethane formation potential in surface and sub-surface waters. J. Hazard. Mater. 2016, 308, 430–439. [Google Scholar] [CrossRef] [PubMed]


| Well Spacing (m) | Distance to River (m) | Site 1 | Site 2 | ||||
|---|---|---|---|---|---|---|---|
| D.D (m) | BF% | Travel Time (day) | D.D (m) | BF% | Travel Time (day) | ||
| 50 | 50 | 1.3 | 91 | 12–25 | 3.4 | 70 | 15–30 |
| 100 | 1.6 | 92 | 22–47 | 4 | 71 | 25–35 | |
| 200 | 1.8 | 92 | 103–175 | 5.5 | 73 | 53–70 | |
| 25 | 50 | 2 | 81 | 7–25 | 6.6 | 66 | 7–30 |
| 100 | 1.8 | 80 | 11–50 | 5.2 | 66 | 18–40 | |
| 200 | 2 | 79 | 72–150 | 6.6 | 67 | 43–65 | |
| Well Spacing (m) | Pumping Rate (m3/day) | Site 1 | Site 2 | ||||
|---|---|---|---|---|---|---|---|
| D.D (m) | BF% | Travel Time (day) | D.D (m) | BF% | Travel Time (day) | ||
| 50 | 1750 | 1.2 | 99 | 36–90 | 2.1 | 63 | 47–60 |
| 3500 | 1.6 | 92 | 22–47 | 4 | 71 | 25–35 | |
| 7000 | 1.8 | 84 | 14–45 | 5.2 | 75 | 12–17 | |
| 25 | 1750 | 1.3 | 90 | 21–95 | 2.6 | 62 | 40–80 |
| 3500 | 1.8 | 80 | 11–50 | 5.2 | 66 | 18–40 | |
| 7000 | 2 | 75 | 7–40 | 8.7 | 68 | 25–35 | |
| Parameter | Unit | MDL | River Nile | Aswan Dam Lake | BF (Site1) | BF (Site2) | GW | Egyptian Standards |
|---|---|---|---|---|---|---|---|---|
| pH | 8.2 ± 0.6 | 7.9 ± 0.5 | 8.41 ± 0.3 | 8.3 ± 0.5 | 8.4 ± 0.3 | 6.5–8.5 | ||
| Conductivity | µs/cm | 2 | 234 ± 12 | 225 ± 8 | 288 ± 25 | 376 ± 38 | 438 ± 26 | - |
| turbidity | NTU | 0.1 | 1.5 ± 0.6 | 1.2 ± 0.7 | 0.23 ± 0.1 | 0.28 ± 0.1 | 0.75 ± 0.2 | 1 |
| NH4+ | mg/L | 0.2 | n.d. | n.d. | 0.42 ± 0.2 | 0.61 ± 0.1 | 0.64 ± 0.2 | 0.5 |
| NO2- | mg/L | 0.02 | 0.14 ± 0.1 | 0.1 ± 0.08 | 0.05 ± 0.02 | 0.28 ± 0.1 | 0.37 ± 0.1 | 0.2 |
| NO3- | mg/L | 0.2 | 2.63 ± 0.4 | 2.22 ± 0.6 | 0.71 ± 0.1 | 5.8 ± 1.3 | 4.3 ± 0.8 | 45 |
| Fe | µg/L | 3 | n.d. | n.d. | 20 ± 3 | 145 ± 21 | 330 ± 37 | 300 |
| Mn | µg/L | 5 | 42 ± 9 | n.d. | 14 ± 5 | 211 ± 27 | 432 ± 41 | 400 |
| DOC | mg/L | 0.5 | 3.90 | 3.60 | 4.30 | 4.90 | 5.50 | - |
| SUVA254 | L/ mg.m | – | 1.56 | 1.33 | 2.16 | 2.04 | 2.73 | - |
| P1 | R.U. | – | 0.32 | 0.20 | 0.41 | 0.74 | 1.10 | - |
| P2 | R.U. | – | 0.12 | 0.09 | 0.14 | 0.25 | 0.46 | - |
| P3 | R.U. | – | 0.23 | 0.22 | 0.11 | 0.14 | 0.19 | - |
| Unit | BF | GW | Low–Capacity WTP | High-Capacity WTP | |
|---|---|---|---|---|---|
| Production capacity | (m3/day) | 2160 | 2160 | 2160 | 8640 |
| Capital cost | (Million EGP/Unit) | 0.5 | 0.8 | 5.0 | 35.0 |
| Chemicals, operation and energy cost/year | (Million EGP/Unit) | 0.5 | 0.5 | 1.0 | 1.8 |
| NPV | (Million EGP) | 6.2 | 5.9 | 0.9 | 7.6 |
| PBP | (years) | 0.5 | 0.7 | 8.2 | 6.3 |
© 2020 by the authors. Licensee MDPI, Basel, Switzerland. This article is an open access article distributed under the terms and conditions of the Creative Commons Attribution (CC BY) license (http://creativecommons.org/licenses/by/4.0/).
Share and Cite
Abdelrady, A.; Sharma, S.; Sefelnasr, A.; El-Rawy, M.; Kennedy, M. Analysis of the Performance of Bank Filtration for Water Supply in Arid Climates: Case Study in Egypt. Water 2020, 12, 1816. https://doi.org/10.3390/w12061816
Abdelrady A, Sharma S, Sefelnasr A, El-Rawy M, Kennedy M. Analysis of the Performance of Bank Filtration for Water Supply in Arid Climates: Case Study in Egypt. Water. 2020; 12(6):1816. https://doi.org/10.3390/w12061816
Chicago/Turabian StyleAbdelrady, Ahmed, Saroj Sharma, Ahmed Sefelnasr, Mustafa El-Rawy, and Maria Kennedy. 2020. "Analysis of the Performance of Bank Filtration for Water Supply in Arid Climates: Case Study in Egypt" Water 12, no. 6: 1816. https://doi.org/10.3390/w12061816