Article

Modelling of Flood Inundation due to Levee Breaches: Sensitivity of Flood Inundation against Breach Process Parameters

by
Yohannis Birhanu Tadesse
* and
Peter Fröhle
Institute of River and Coastal Engineering, Hamburg University of Technology, 21073 Hamburg, Germany
*
Author to whom correspondence should be addressed.
Water 2020, 12(12), 3566; https://doi.org/10.3390/w12123566
Submission received: 11 November 2020 / Revised: 11 December 2020 / Accepted: 15 December 2020 / Published: 18 December 2020
(This article belongs to the Section Hydraulics and Hydrodynamics)

Abstract

:
This paper analyses the sensitivity of flood inundation due to river levee breach against breach process parameters using the 1996 Awash River levee breach case at Wonji, Ethiopia. A parametric levee breach model integrated into the 2D hydrodynamic numerical model Telemac-2D is used to simulate a levee breach flood event at Wonji, Ethiopia. Levee breach process parameters are systemically varied to find out their effect on the flood inundation. The analysis of the model results shows that the flood inundation is sensitive to the final breach dimensions and breach location. However, the parameters describing the levee breach development have negligible influence on the flood inundation. This implies that final breach dimension and breach location in an event of levee breach are the most important and decisive parameters affecting the resulting inundation of the flood plain, and as such should be given due consideration when creating flood inundation maps due to levee breach.

1. Introduction

Riverine flood plains have attracted human habitation due to their provision of important resources such as water, fertile soil and favourable landscape [1,2]. In the course of time many flood plains are changed to agricultural fields, residential villages, towns and cities, and manufacturing and industrial areas, including valuable historical heritages [2,3,4]. In many cases such reclaimed flood plains are protected from flooding with levees. The levees, nonetheless, never guarantee absolute protection against floods [5,6] for several reasons. The first reason stems from the design concept. Levees are designed to protect against floods based on specific design values, e.g., a specific design water level, a specific design discharge or an event with a specific probability of occurrence. Independent of the individual design considerations, there is always some remaining probability of exceedance of the design value at any time in the future. In addition, extreme hydro-meteorological events are expected to increase in the future due to climate change [7]. This increases the probability of the occurrence of a given event and the exceedance of the design value. Secondly, levees, like other civil structures, deteriorate (settlement etc.) over time [8] even with good inspection and maintenance. Furthermore, levees are designed and constructed according to the state of art at the time of construction, and errors during design and construction are possible.
Flood disasters associated with levee breaches are not uncommon, if not frequent [8]. Levee breach flooding often leads to unprecedented economic damage and loss of human lives. Some historical levee breach flood disasters reported in the literature include the 1996 Wonji levee breach flood in Ethiopia [9,10], the 2005 New Orleans flood in USA [11,12], the 2002 and 2013 levee breaches of Elbe River and its tributaries in Germany [6], among others.
This calls for authorities to be prepared for flood events (see, e.g., European Flood Directive) and prepare flood hazard maps and emergency plans for communities, businesses, and other stakeholders living in flood plains behind levees so that consequences in case of flooding can be reduced. Flood hazard maps can be prepared using numerical flood inundation modelling for different levee breach scenarios. The modelling of flood inundation [13] due to levee breach is better undertaken with a 2D hydrodynamic numerical model that has an integrated levee breach model [14,15,16]. While 2D hydrodynamic numerical flood modelling is a well-established subject, levee breach modelling is still a research subject [8,14].
There are three major type of breach models: empirical, parametric and physical-based breach models [8,17]. The latter two can model the flow splitting during levee breaches, into to the flow to the flood plain and the flow in the main river channel [18], if they are integrated into a 2D hydrodynamic numerical model. These breach models are also suitable for integration into a hydrodynamic numerical model for modelling the resulting flood inundation.
Empirical breach models are commonly used for reservoir dam breaks to calculate the discharge through the dam break as a function of water level in the reservoir, inflow into the reservoir, reservoir height, and area of the opening due to the dam break [8]. In the case of levee breaches, the flow splits into (1) the flow through the breach and (2) the flow remaining in the river channel [18,19]. The flow through the breach is dependent on (i) the breach dimensions, (ii) the river width influenced by the breach, (iii) the velocity in the river channel and (iv) the flow depth in the river channel [19]. These complicated relationships make it difficult to calculate the discharge through the breach empirically, and therefore using 2D hydrodynamic numerical models of the flow field is imperative.
Parametric breach models describe the levee breaching process by making simplifying assumptions on the location, initiation, development, number, and shape of the levee breach, often based on experience, good engineering judgment and historical levee breaches. The breach parameters are often the number of breaches, breach location, final breach width, final breach level, initial breach width, breach duration (time taken for the breach to its final state), type of breach (piping versus overtopping), etc. [9,14].
Physical-based breach models model the levee breaching process using morphodynamic equations [14] coupled with hydrodynamic numerical model. That is, physically-based breach models couple 2D shallow water equations with sediment transport equations (such as Meyer–Peter and Muller formulas) and bed evolution equations (such as Exner equation). Such models are reported by Refs. [14,20,21,22,23,24,25,26,27,28], among others. Although physical-based breach models are the right choice from the point of view of modelling the breaching process, their applicability to real cases is limited. The widely available sediment transport and bed evolution equations are not developed for levee breach flow conditions. Moreover, attempts to develop sediment transport and bed evolution equations for levee breach conditions are limited to levee breaching due to overtopping flow [8] and they often require the use of empirical parameters (e.g., erodibility parameter [14]). In this regard, parametric breach models are the suitable approach for practical applications of the modelling of flood inundation due to levee breach. In addition, physical-based models can be seen as a special case of parametric breach models whose breach parameters are determined by sediment transport and bed evolution equations.
Much of the literature is rather focused on the modelling of the breaching processes. While this is important, some of the processes that are sought to be modelled in detail have a limited impact on the resulting flood inundation. The objective of this investigation is to identify the important breaching processes with regard to the resulting flood inundation. No such study is known to the Authors with the exception of Ref. [29], which analysed the sensitivity of outflow discharge due to dam break against breach parameters. The current investigation is novel in that it systematically analyses the effects of the levee breaching processes (defined via breach parameters) on the resulting flood inundation. For this purpose, a historical Awash River levee breach flood event at Wonji, Ethiopia [9] is modelled with a parametric breach model integrated into the hydrodynamic model Telemac-2D. The parametric breach model is integrated into Telemac-2D by Ref. [9]. To quantify the sensitivity of the modelled flood inundation against the breach parameters, a number of hydrodynamic numerical simulations are carried out by systematically varying the breach parameters. The considered breach parameters are breach location, breach start time, final breach level, final breach width, breach duration and type of breach (mode of breach).
The results of the analysis show that the modelled flood inundation is sensitive to breach location, final breach level and final breach width, but insensitive or marginally sensitive to breach duration, breach start time and type of breach. This implies that the breach parameters—breach location, final breach level and final breach width—need to be chosen for a given application with care and conservatively, so as not to underestimate the resulting flood inundation extent and depth, which could have high implications for flood risk assessments.

2. Methodology

2.1. Approach

The approach for the analysis is shown schematically in Figure 1. A hydrodynamic numerical model is set up for the levee breach case at Wonji, Ethiopia. The 1996 Awash River levee breach at Wonji, Ethiopia is chosen as a good documentation and descriptions of the levee breaching processes were available to the authors.
For the investigation, the hydrodynamic numerical model Telemac-2D [30] and a parametric levee breach model integrated into Telemac-2D by Ref. [9] are used. The sensitivity of the modelled flood inundation is quantified by systematically varying the breach parameters and comparing the corresponding modelled flood discharge through the breach and flood inundation depth at a selected location in the flood inundation area. In the following sections, further details on the hydrodynamic numerical model Telemac-2D and the breach model are given.

2.2. Telemac-2D

Telemac-2D solves the hydrodynamic 2D flow equations in the horizontal directions (also known as shallow water equations). It is part of the open Telemac-Mascaret suite of solvers, which are in the public domain. The software suites are developed and maintained by a consortium of organisations, of which Electricité de France Research and Development (EDF R&D) is the main developer and maintainer of Telemac-2D [31].
Telemac-2D gives the option to discretise the governing equations either with the finite volume or the finite element methods. In this investigation, the finite element method in combination with a semi-implicit time stepping scheme is used since the computation time of the finite element method is much lower than the finite volume option without a significant difference in accuracy [30]. The resulting algebraic equations are then solved with the conjugate gradient method. For further details on Telemac-2D, the reader is referred to the user manual [32] and the book of the major developer of Telemac-2D [30]. Telemac-2D is suitable for modelling levee breach-type flows [31,32,33].

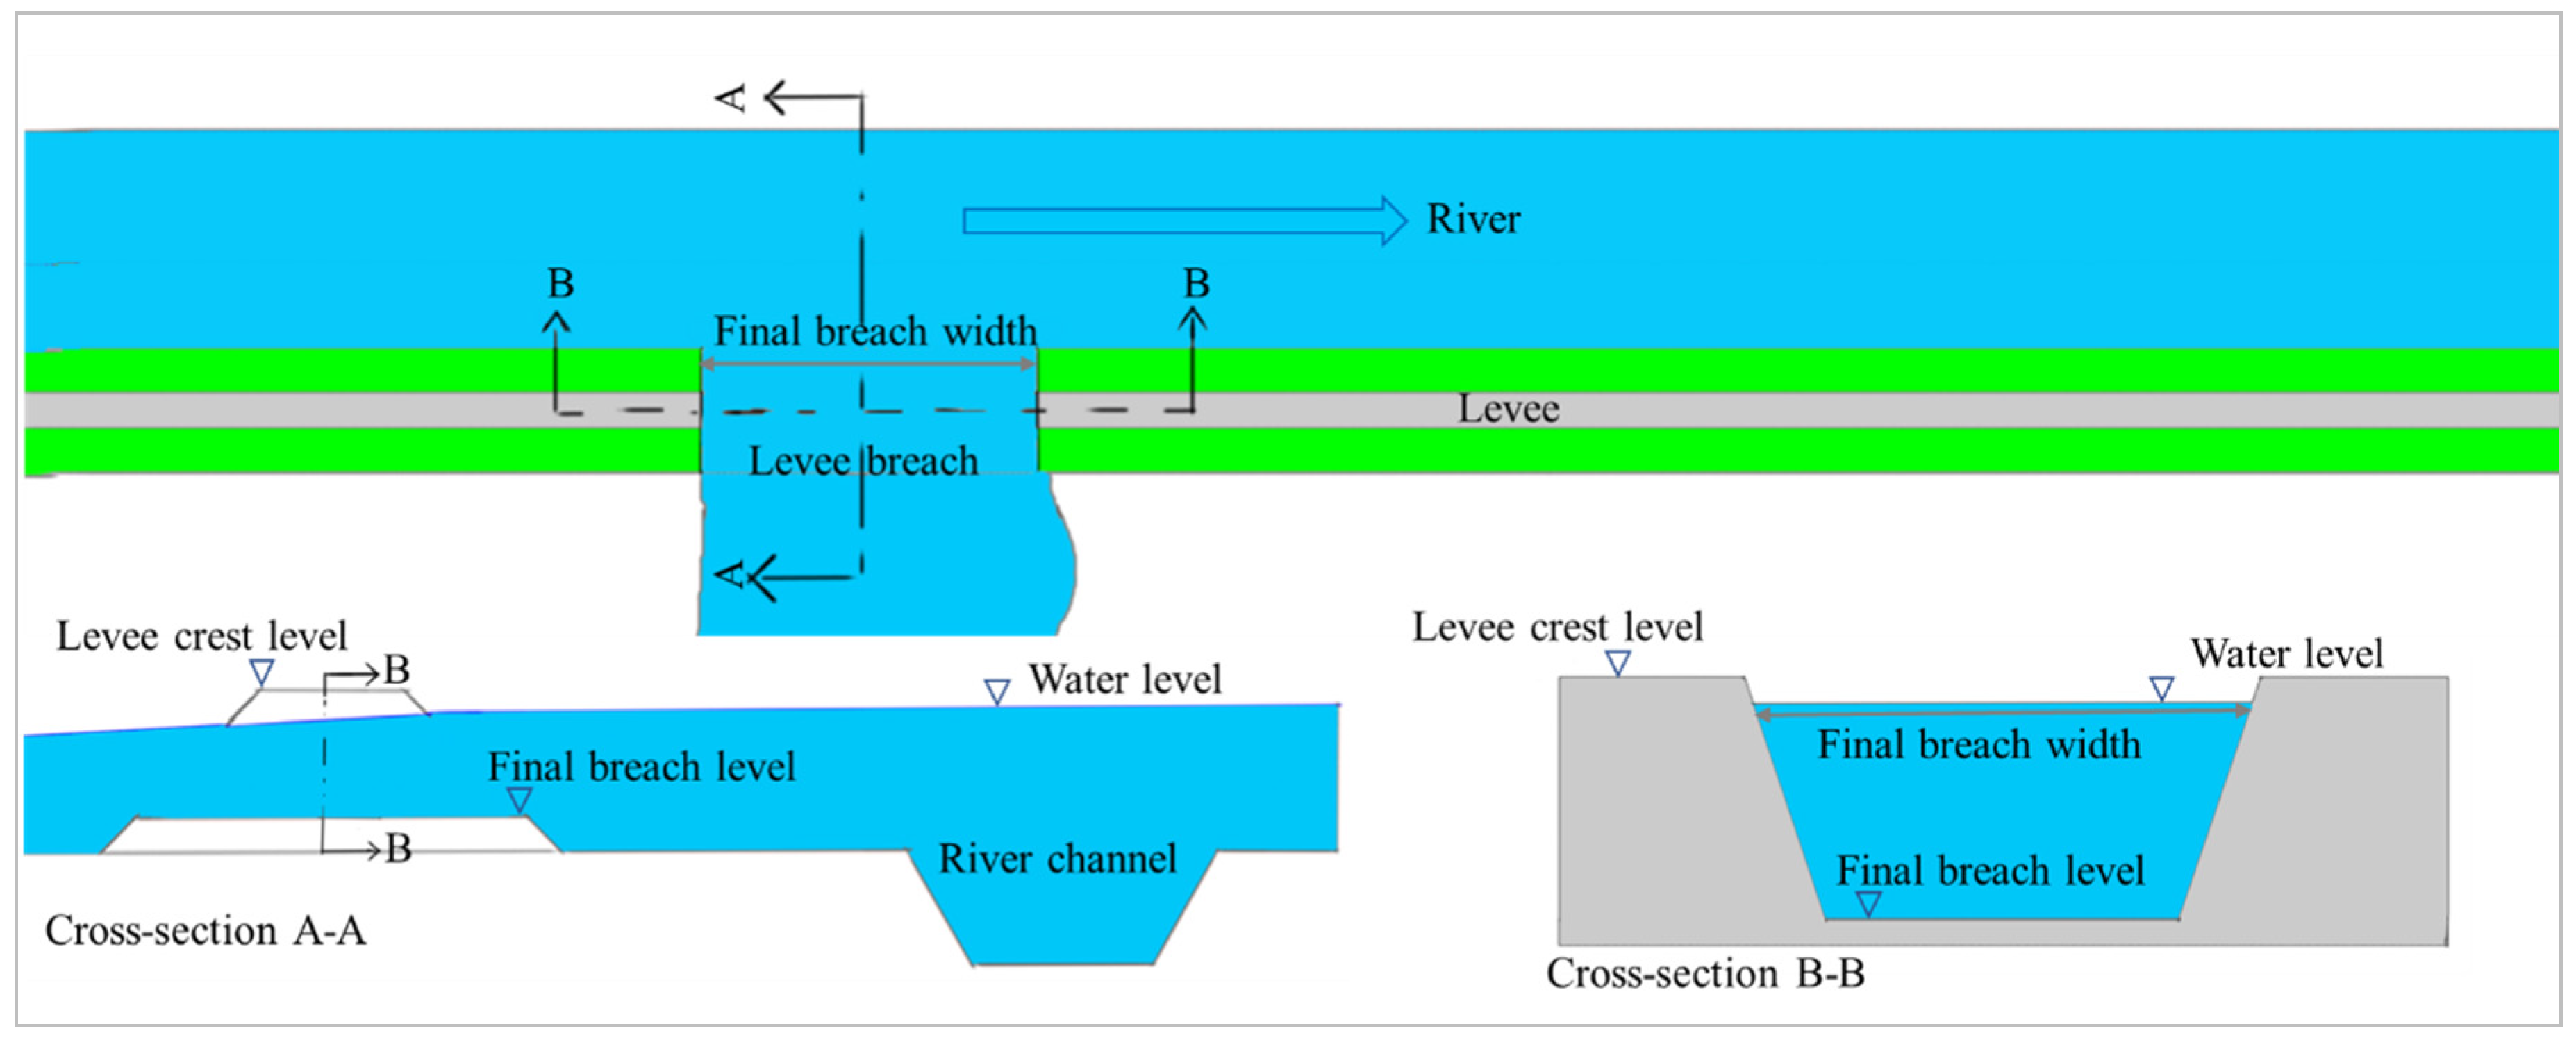
2.3. The Breach Model Used in This Investigation

The levee breach model used for this investigation is a parametric breach model investigated and then implemented in Telemac-2D by Ref. [9]. The breach model simulates the breaching process via inputting information about the breach location, condition for breach initiation, erosion type, breach duration, initial breach width, final breach width and final breach level. Breach is created by lowering the elevation of the mesh nodes according to the parameters defining the breaching process.
In this model breaches are initiated at pre-defined locations if the conditions for breach initiation are fulfilled. The condition for breach initiation is given by one of the following three options. Breach is started (a) at a specified time, (b) when the water level is greater than the levee crest level or (c) when the water level is greater than a specified value.
Once the breach is initiated, the levee breaching processes is imposed in two ways. The first option (Option 1) is the lowering of the levee level for the entire breach width (final breach width) without consideration of lateral breach growth over the breach duration. In the second option (Option 2), the lowering of the levee level takes place in two steps. First, the levee level for width beginning with the initial breach width at the centre of the final breach width is lowered in a tenth of the breach duration to the final breach level. The horizontal breach expansion rate is the same as in the second step. Then, horizontal expansion of the breach continues until the final breach width over the breach duration is attained. Figure 2 shows a sketch of the final breach dimensions of a levee breach at the indicated position.

2.4. The Levee Breach Case: The 1996 Awash River Levee Breach at Wonji

2.4.1. The Study Area

This study uses the 1996 levee breach flood event of Awash River at Wonji, Ethiopia. The flood event inundated Wonji Shoa Sugar Factory (WSSF) and WSSF’s sugar cane plantation. WSSF and its sugar cane plantation are found in the upper Awash River basin downstream of Koka Hydropower Dam (KHD) some 100 km south of the capital Addis Ababa near the town of Adama, Ethiopia (Figure 3).
Since Wonji is located only about 20 km downstream of KHD, Awash River flow at Wonji is directly related to water release from the KHD reservoir. In its normal operation the KHD regulates the Awash River flow downstream of it. However, in exceptional cases of high water inflow into the KHD reservoir, the water level in the reservoir exceeds the design water level and the flood gates of the dam need to be opened to avoid a rather catastrophic phenomena of dam failure. High-water level in the reservoir usually occurs following days-long heavy rainfall in the upstream catchment. Besides this, the KHD reservoir has lost much of its capacity to sedimentation [34,35]. This leads to higher water levels in the reservoir even if the inflow into the reservoir and the outflow from the reservoir are unchanged.
Opening of the flood gates during high-water levels in KHD reservoir results in flood flows in the Awash River downstream of KHD. This often poses a high probability of flooding at Wonji. To decrease the probability of flooding at Wonji, levees have been constructed along the banks of Awash River. About 20 km critical reach of Awash River at Wonji are protected by levees on both banks of the river [36]. The levees are simple construction from earth material available in the vicinity with approximately 1:2 (vertical:horizontal) side slopes, an average bottom width of 9 m, a height of 3 m and a top width of 3 m [36].

2.4.2. The 1996 Awash River Levee Breach at Wonji, Ethiopia

Following days-long heavy rainfall in the catchment of KHD in August 1996, the flood level of KHD reservoir reached critical level. To prevent the catastrophic failure of the dam, the flood gates of the dam were opened. The released flow caused a high flow level in Awash River downstream of KHD and breached the levee at Wonji. The levee breach led to widespread flooding affecting WSSF’s sugar cane plantation, residential houses of employees of the factory, offices of the factory and private agricultural works.
Data on the levee breach are compiled from personal communication with levee foreman of WSSF (Mr. Desta), reports given by disaster relief organisations and the government, and news outlets. According to Mr. Desta, an eyewitness of the flood and levee foreman of WSSF, one levee breach occurred upstream of the office area (see Figure 3). The levee breach had an approximate breach width of 100 m and was eroded to the ground level. The breach occurred on 24 August 1996 [37] and the time taken for the breach to develop to its final state is not documented. In the literature, breach times varying from instantaneous breach to several hours are considered [38,39,40]. It is shown by previous studies that breach time does not significantly influence the resulting flooding [39,41]. Thus, in consultation with the levee foreman, a breach time of about an hour is considered realistic. Following the levee breach, extensive flooding of the WSSF and its sugar cane plantation is reported [10,37]. It is documented that flood marks in the office buildings of WSSF reached window beam levels (see Figure 3 for the location of the office building) (Mr. Desta, pers. comm.), which are approximately 0.90 m above the ground level. In addition, Ref. [10] reported wide-spread flooding on 27 August 1996 with increasing water levels.

3. Model Set Up

A hydrodynamic numerical model is set up for the Awash River reach from KHD to Awash II Dam at Awash Melkasa town. The model area encompasses the river channel, the Wonji flood plains on both sides of the river, and the levees on both banks of the river (see Figure 3). Data required for the model set up were obtained from Ethiopian Mapping Agency, Ministry of Water Resources (Ethiopia), WSSF and freely available sources.

3.1. Computational Mesh

The model area is discretised into triangular mesh with spatially varying resolution. The levee is discretised by at least three mesh nodes between the levee foot and crest, and the size of the triangles is on average 1.5 m2. This high mesh resolution ensures that the levee is represented in the model accurately. The river channel is discretised by more than ten mesh nodes over the cross-section and the size of the triangles is on average 21 m2. The flood plain is discretised with mesh element sizes of about 1.2 ha. In total the computational mesh has about 725,000 triangular mesh elements. Figure 4 shows excerpts of the computational mesh.
Topographic data of the model area were obtained from two sources. For the flood plains, geo-referenced topographic maps were obtained from Ethiopian Mapping Agency. According to this topographic map, the flood plains in Wonji lie at approximately 1538 m a.m.s.l. For Awash River and the levees, river cross-sections of Awash River for about 20 km of the river in Wonji area (for the reach where levees are built) are obtained from Civil Engineering section of WSSF (see Figure 3). For the part of the river without cross-section data, the data gap is filled by interpolation and, respectively, extrapolation of the existing cross-section data.

3.2. Boundary and Initial Conditions

The upstream boundary of the model area is KHD (see Figure 3). Discharge measurement at the KHD gauging station is used as the upstream boundary condition. Figure 5a–c show hydrographs of three flood events at the KHD as well as Wonji gauging stations.
The downstream boundary of the model area is Awash II Dam (see Figure 3 and Figure 4). Awash II Dam is a concrete gravity dam about 16 m high and 88 m long, and has a storage capacity of 6 Mm3 [42]. The water level at maximum capacity is 1539.04 m a.m.s.l. The dam operates like a weir and is overflown when the water level exceeds the maximum level. Thus, the downstream boundary condition of the model is a stage–discharge relationship. Since exact stage–discharge curve for the weir is unavailable, the stage–discharge relationship is derived using the overflow formula for broad-crested weirs given by Equation (1) [43,44].
Q = 2 3 b C d g h o 3 2
In Equation (1), Q, b, Cd, g and ho stand respectively for overflow discharge, width of the weir, discharge coefficient, acceleration due to gravity and upstream total head. The discharge coefficient considers losses due to friction, the effect of the upstream slope of the weir and the shape of the weir crest, among other factors. Experiments show that the discharge coefficient for a broad-crested weir can be very low [43]. An average discharge coefficient value of 0.55 is adopted. The upstream total head ho is approximated by the upstream water depth over the crest level. The width of the dam is 88 m. Therefore, the stage–discharge relationship at Awash II Dam is established by calculating the values of stage (depth over crest plus the crest level of the dam) for various Q values and is shown in Figure 5d.
Initial conditions are also required. Initial conditions specify the values of the variables (depth and velocity of flow) at the start of the simulation. For all simulations in this work, the initial conditions are a water depth of 4 m in the river channel and 0 m for the rest of the model domain, and a velocity of 0 m/s for the entire domain. To exclude the effect of initial conditions, all simulations are run with a sufficient warm-up phase of several days, which is much higher than the time required for the water in the model domain to flow out of the model.

3.3. Model Calibration and Validation

The model is calibrated against the flood event in August 1998. The model calibration parameters are bottom resistance and turbulence loss coefficients. For the simulations, the bottom resistance loss law of Nikuradse and the constant eddy viscosity turbulence model are used. In the process of calibration, several simulations with different river bottom roughnesses (Ks-value) and eddy viscosity coefficients (Vis.) are undertaken. Figure 6a shows the simulated discharge hydrographs for different Ks-values and the measured discharge at Wonji gauging station, and Figure 6b shows the simulated discharge hydrographs for different eddy viscosity coefficients and the measured discharge.The model replicates the measured discharge with an average 8% difference between the measured and simulated discharges at Wonji for this flood event. For further use, we adopted a Ks-value of 0.10 m and an eddy viscosity value of 2.0 m2/s.
Furthermore, the model is validated against the August 1996 flood event that caused the levee breach and the extensive flooding at Wonji, Ethiopia. The modelled water depth at the office location corresponding to the available breach information (see Section 2.4) is shown in Figure 7. The modelled maximum water depth at the office location is 0.87 m. This is in good agreement with the eyewitness information that the flood level at the office location during the flood event reached window beam levels. The window beam levels are at 0.90 m above the ground level. In addition, the modelled water depth increases on 27 August 1996, which is in agreement with the report of Ref. [10].

4. Sensitivity Analysis of the Breach Model Parameters

As described in Section 2.3, the levee breach model used in this study uses breach parameters to describe the levee breaching processes. The major parameters are breach duration, breach start time, final breach width, final level of breach and breach growth mode. For real levee breaching cases, these parameters are associated with high uncertainty as they depend on factors such as characteristics of levee material, flow in the river, maintenance situation of the levee, quality of construction, etc. As a result, it is essential to analyse the sensitivity of the modelled flood inundation and extent to these breach parameters. This helps to find out the important parameters affecting the resulting flood inundation. In the following sections, the sensitivity of the modelled water depth in the hinterland (at office locations, see Figure 3 for the location) and the discharge through the breach (breach discharge) to each of the major breach parameters is analysed.

4.1. Breach Duration

To determine the sensitivity of the modelled water depth in the hinterland and the modelled breach discharge to breach duration, the breach duration is varied within the range of the historical breach duration of 1 h. Numerical simulations for breach duration of 30 min, 1 h and 2 h were undertaken. Water depth in the hinterland and breach discharge obtained from the model runs for the respective breach durations (BD) are compared in Figure 8. The results show that the modelled flood inundation is insensitive to the breach duration.

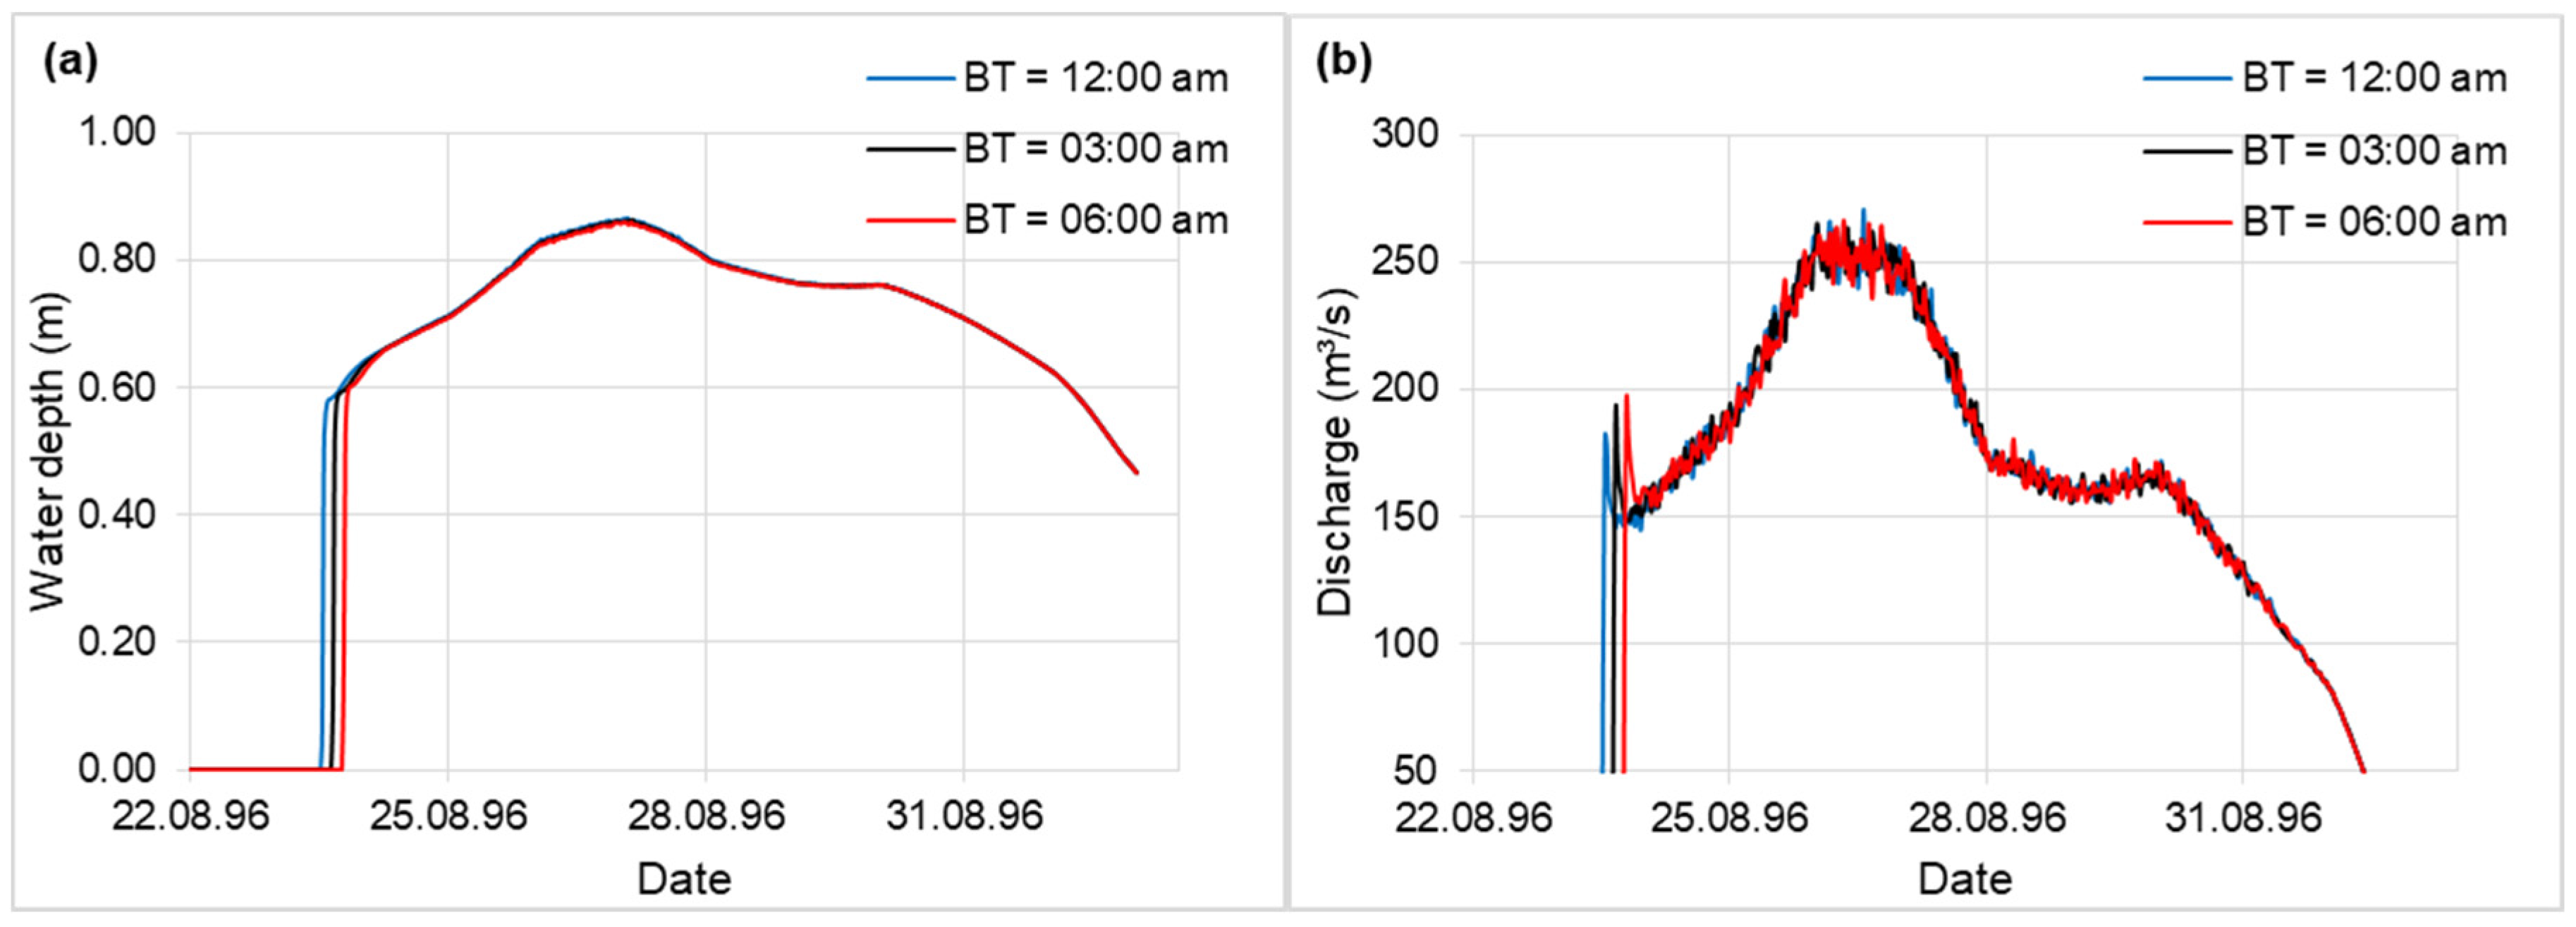
4.2. Breach Start Time (Breach Initiation)

The breach initiation options of the levee breach model are highlighted in Section 2.3. For the analysis here, breach initiation by specifying breach start time is used. This is to have control over the breach start time, which helps to make certain the comparison of the sensitivity of the modelled water depth in the hinterland and the modelled breach discharge against breach start time.
To determine the sensitivity of the modelled water depth in the hinterland and the modelled breach discharge to breach start time, hydrodynamic numerical simulations for three breach start times (BT) at 00:00 a.m., 03:00 a.m. and 06:00 a.m. on 24.08.1996 are carried out. Water depth in the hinterland and breach discharge obtained from the model runs for the respective breach start times are compared in Figure 9. As can be observed from Figure 9, for the breach start times analysed here, the breach start time affects only the beginning of inundation. The peak inundation depth and breach discharge are insensitive to the breach start time.

4.3. Final Breach Width

The sensitivity of the modelled water depth in the hinterland and the modelled breach discharge to final breach width is analysed by running hydrodynamic numerical model simulations for a final breach width (BW) of 50 m, 100 m and 150 m. The final levee breach width of the August 1996 levee breach is about 100 m. Water depth in the hinterland and breach discharge obtained from the model runs for the respective final breach widths are compared in Figure 10. As can be observed from Figure 10, the modelled water depths at the office location and the modelled breach discharges increase with the increasing final breach width.

4.4. Final Breach Level

In the event of a levee breach, the levee may erode only to some level and not to the ground level, depending on the prevailing hydrodynamic and morphodynamic conditions. The sensitivity of the modelled water depth in the hinterland and the breach discharge to final breach level is analysed by running hydrodynamic numerical simulations for final breach levels BL = 0 m (levee erodes to the ground level) and BL = 1.5 m (levee erodes to half its height, which is 3 m). The simulation results are shown in Figure 11. As can be observed from Figure 11, the modelled water depth at the office location as well as the breach discharge increase with the final breach level. Simulations for further final breach levels are avoided as the results for the two cases show the sensitivity clearly.

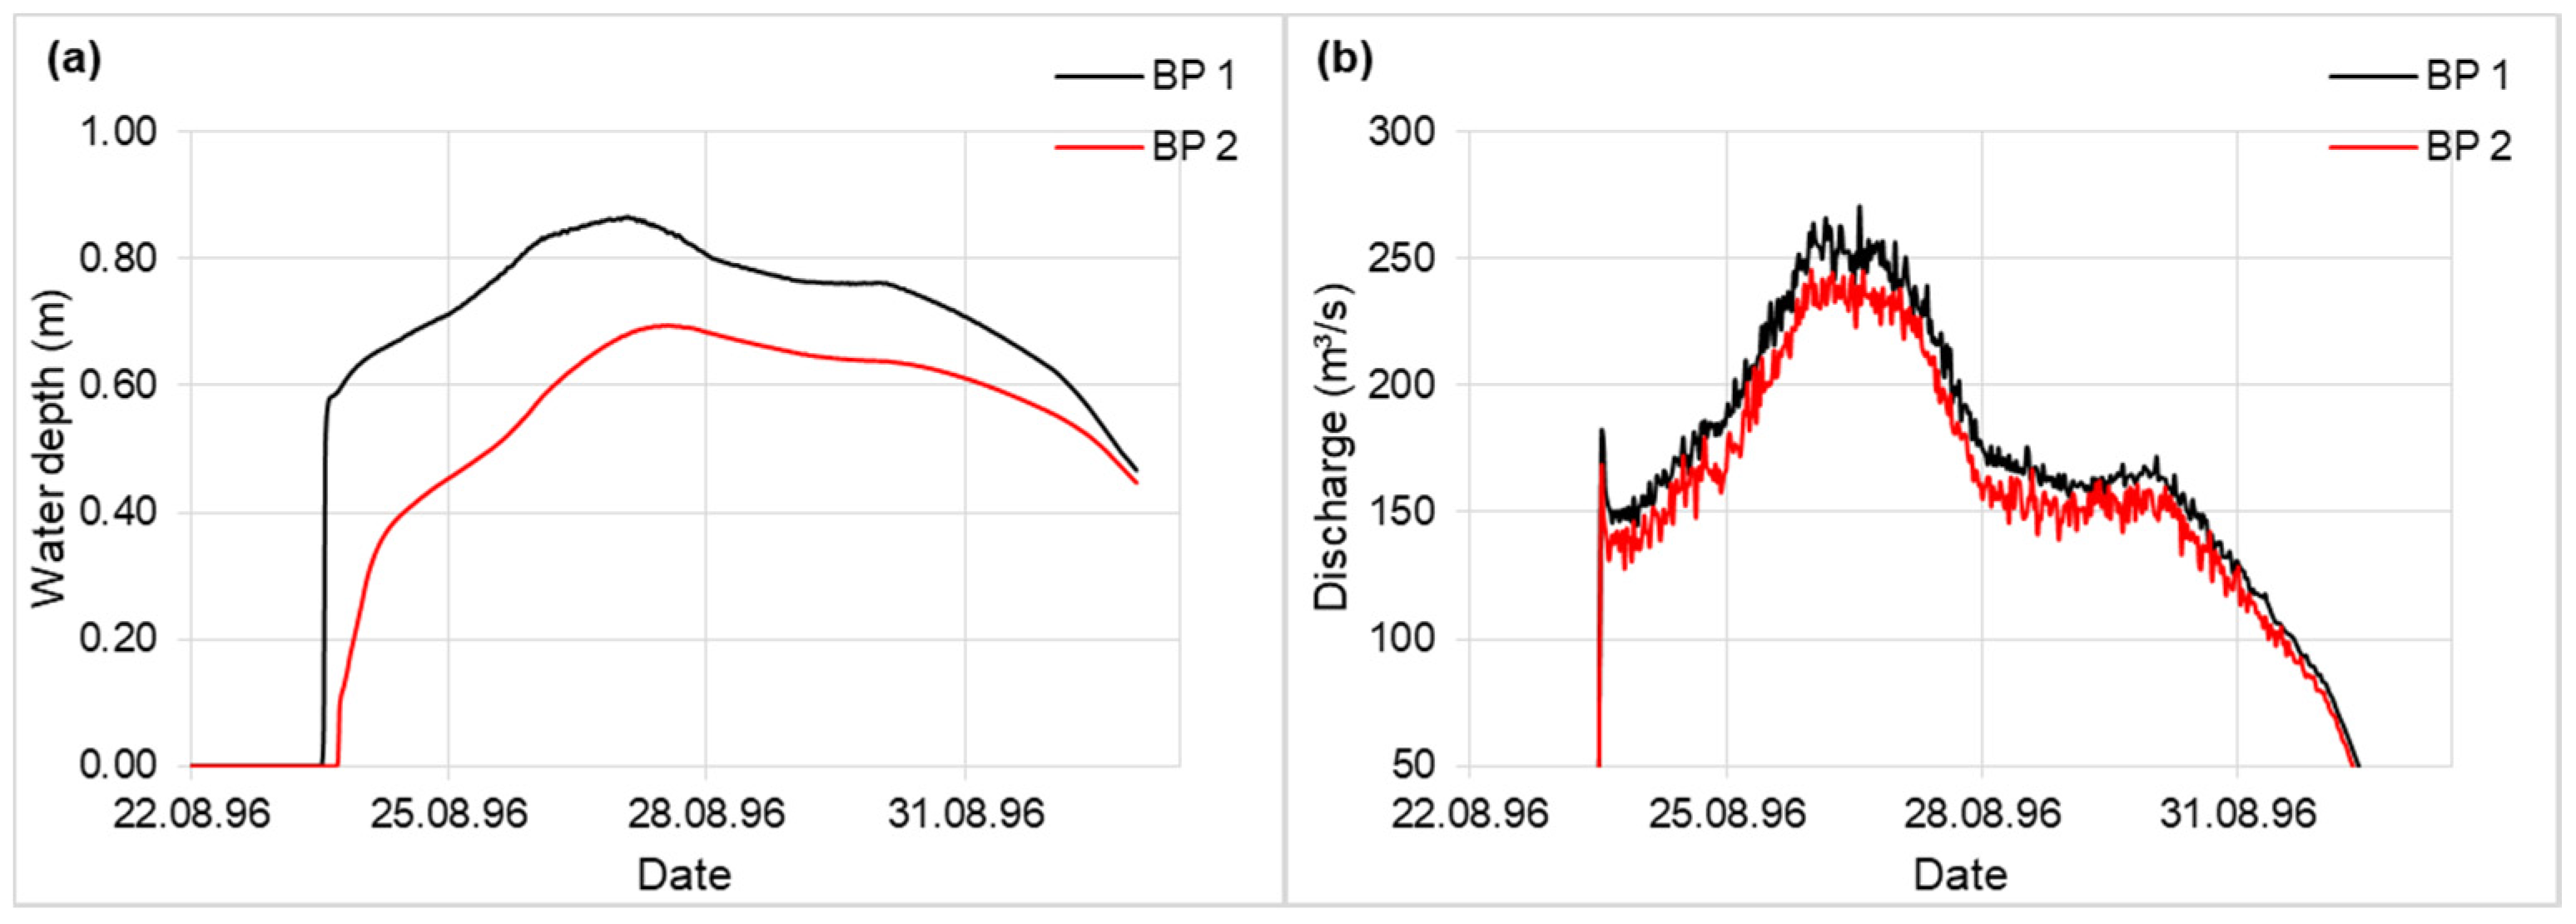
4.5. Breach Location
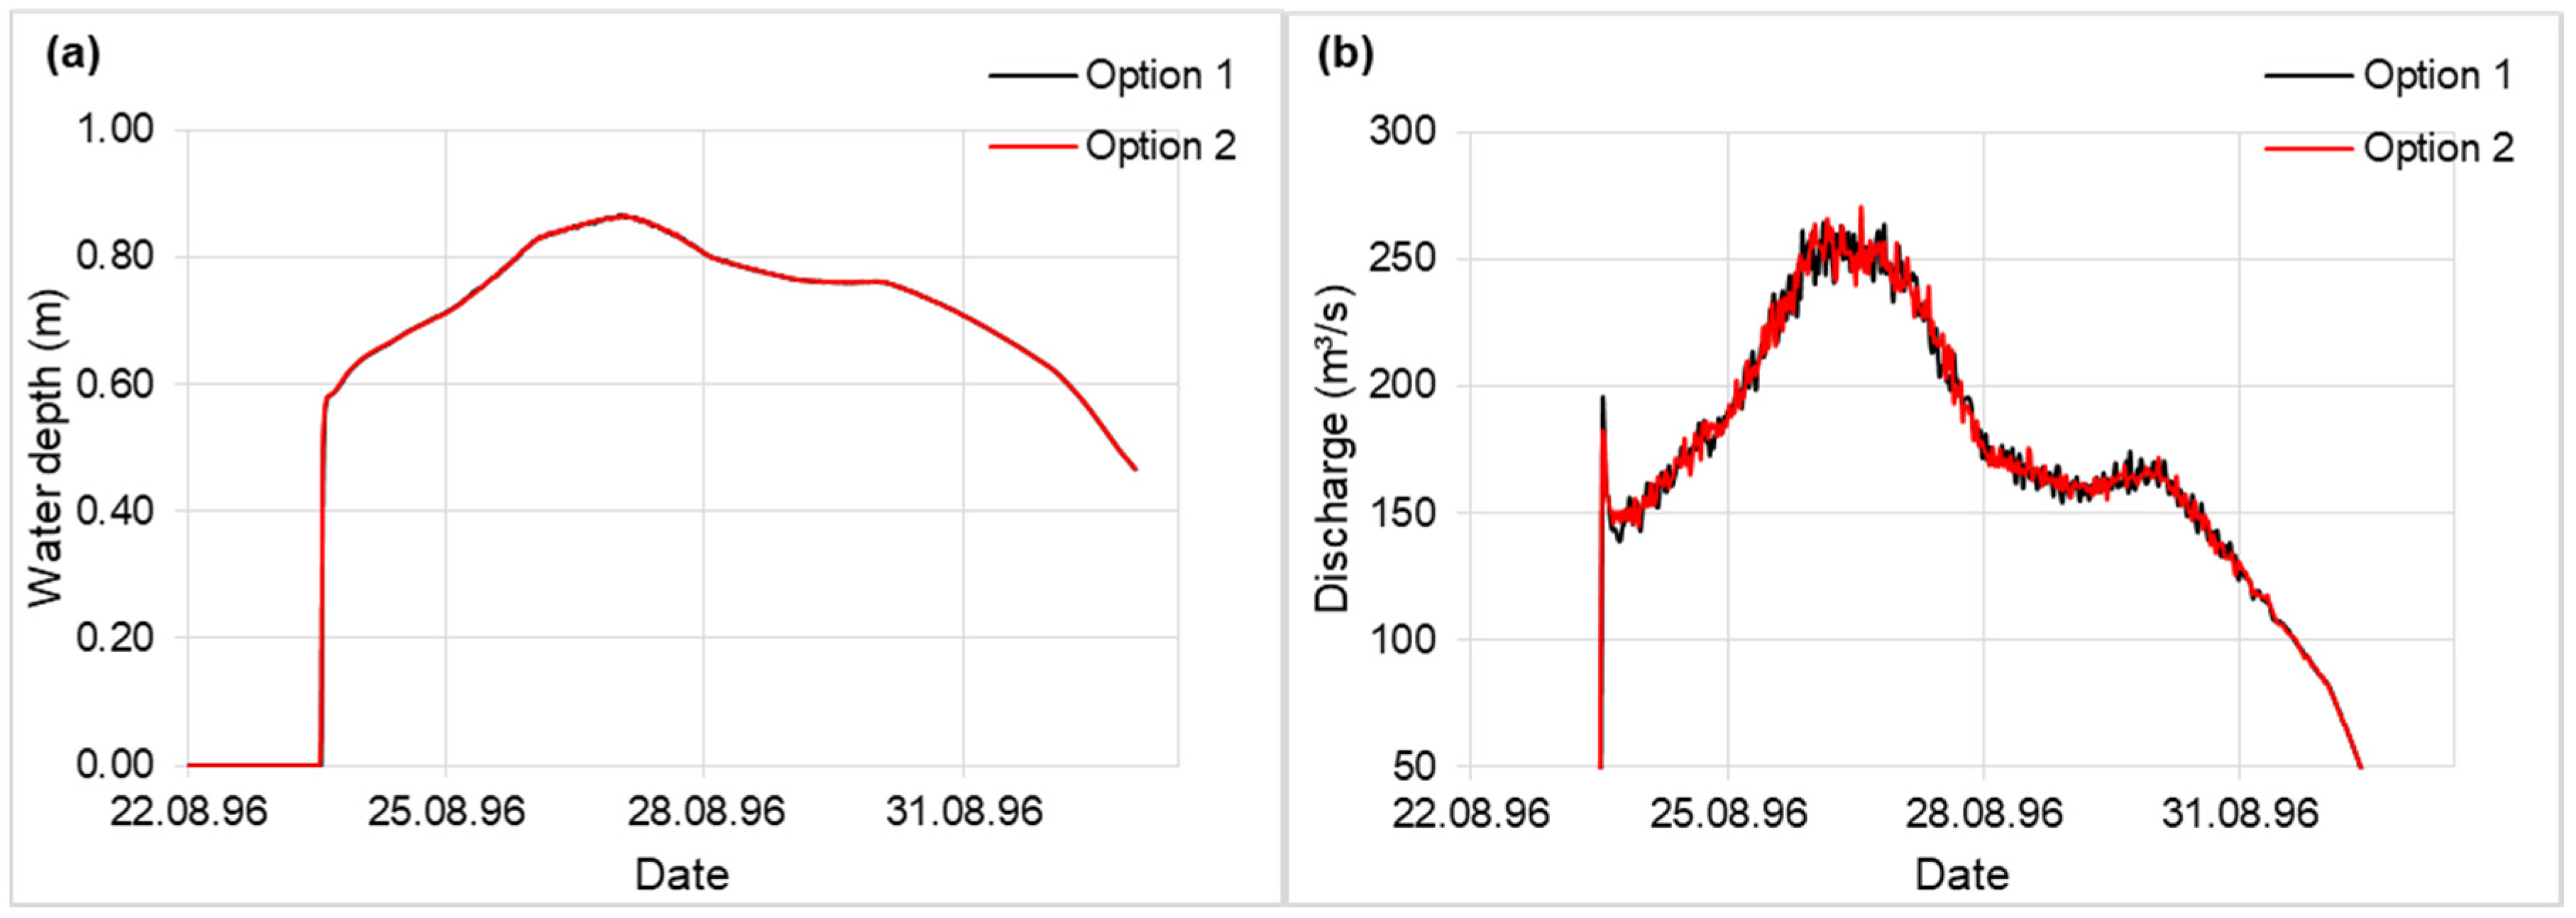
The sensitivity of the modelled water depth in the flood plain and the breach discharge to breach location is analysed by running hydrodynamic numerical simulations for two breach locations (BP 1 and BP 2) shown in Figure 4. The results for water depth at the office location in the flood plain and breach discharge from the simulations are extracted and shown in Figure 12. The results show that the water depth at the office location is sensitive to the beach location, but breach discharge is only marginally sensitive to breach location. Simulations for further breach locations are avoided as the results with the two cases show the sensitivity clearly.

4.6. Erosion Type

The levee breach model has two levee-lowering options (erosion options) (see Section 2.3). The sensitivity of the modelled water depth at the office location and breach discharge to the levee lowering options is tested by running hydrodynamic numerical simulations. The water depth at the office location and the breach discharge are extracted from the simulations results and shown in Figure 13. The results of the simulations show that the levee-lowering method affects neither the water depth at office location nor the breach discharge.

5. Discussion

The integrated modelling of the levee breaching processes and the consequent flood inundation reproduced the historical levee breach flood at Wonji. An integrated modelling approach is also used successfully by Refs. [14,16,45], among others. This study employed a parametric breach model integrated into the hydrodynamic numerical model Teleamc-2D to analyse the effect of the levee breaching processes on flood inundation, and determine the important levee breaching processes and parameters. This knowledge is crucial in order to direct research efforts towards the relevant processes and parameters.
Two important aspects can be observed from the sensitivity analysis presented in Section 4. The model results (Figure 8, Figure 9, Figure 10, Figure 11, Figure 12 and Figure 13) show that the flood inundation due to levee breach (i) depends on the breach parameters of final breach width, final breach level and breach location and (ii) is not, or is marginally, influenced by the breach parameters of breach start time, breach duration and levee-lowering method (erosion type).
This means that the flood inundation due to the levee breach is rather a function of the final breach dimensions and the breach location. The final breach dimensions strongly influence the flow through the levee breach (breach discharge), in other words, the volume of water getting into the flood plain. Thus, the breach model parameters that influence the breach discharge also affect the depth and extent of inundation of the flood plain proportionally.
Breach location affects the spatial variation of the inundation depth without affecting the breach discharge significantly. That is, breach location affects the resulting consequence of a levee breach flooding. To determine the maximum consequence resulting from levee breach, a number of levee breach locations should be systematically analysed. Such systematic analysis is also useful to prioritise the order of levee segments for maintenance and strengthening. The levee segment with the maximum consequence in the case of breach is to be maintained and strengthened first.
The levee breach parameters describing the breaching processes (breach development), which are breach start time, breach duration and levee-lowering method (erosion type), have no or only marginal influence on the flood inundation. This means that the breach development has no significant influence on the flood inundation. The flood duration in the application case spans over several days. In this regard, the results in this paper apply to river floods lasting over several days. For flood events lasting for short periods, such as flash floods, the levee breaching processes can have a significant influence on the volume of water flowing into the hinterland, and affect the depth and extent of inundation. The case studies by Refs. [16,45], for example, show such dependency. According to Ref. [16], the total water volumes through the breach in their case studies are influenced by the characteristics of the flood wave in the river.
Thus, the determination of final levee breach dimensions and location are critical for flood hazard mapping of the hinterland. The uncertainty associated with the existing methods and models for forecasting breach location and final breach dimensions are high [8,16,17]. It is imperative that these methods and models are further improved. Physical-based breach models can play a significant role in this regard. However, for this, the focus of physical-based models should not be only on the exact modelling of the levee breaching process using sediment transport and erosion rate equations, as is often encountered in the literature, but also on the accurate estimation of the final breach dimensions. In addition, methods for the reliable estimation of breach location should be developed. This aspect is often neglected in the literature. One strategy followed in the literature is to undertake model runs for different breach location scenarios, and to consider the worst scenario in terms of the consequence (e.g., flooded area) [16,40,46].

6. Conclusions

In this paper, a parametric levee breach model integrated into the hydrodynamic numerical model Telemac-2D is successfully used to reproduce the August 1996 Awash Levee breach flood event at Wonji, Ethiopia. Using this historical flood event, the sensitivity of the flood inundation against the levee breach model parameters is systematically analysed. From the sensitivity analysis of the model results, the following conclusions are drawn.
  • Flood inundation due to levee breach depends on the final dimensions of the levee breach and the breach location. The final breach dimensions affect the consequence of the levee breach as the amount of water that can flow into the hinterland is the function of the breach dimensions.
  • The breach location affects the consequence of the levee breach even if the discharge through the breach is not significantly influenced.
  • The process of the levee breaching (breach development) has marginal to no influence on the resulting flood inundation. This is shown, however, for floods lasting over several days. Consequences of levee breaches due to flash floods lasting for short period could be sensitive to the levee breaching processes.
  • Accurate and reliable methods for determining the final breach dimensions and breach location are important for a more accurate flood inundation estimation.

Author Contributions

Conceptualization, Y.B.T. and P.F.; methodology, Y.B.T.; software, Y.B.T.; validation, Y.B.T. and P.F.; formal analysis, Y.B.T.; investigation, Y.B.T.; resources, Y.B.T.; data curation, Y.B.T.; writing—original draft preparation, Y.B.T.; writing—review and editing, Y.B.T. and P.F.; visualization, Y.B.T.; supervision, P.F.; project administration, Y.B.T. Both authors have read and agreed to the published version of the manuscript.

Funding

This research was partially funded by Bundesministerium für Bildung und Forschung (BMBF), grant number IPS 20/06P2. The APC was supported by the funding programme *Open Access Publishing* of Hamburg University of Technology (TUHH).

Acknowledgments

We acknowledge support for the Open Access fees by Hamburg University of Technology (TUHH) in the funding programme *Open Access Publishing*. The first author is grateful to The German Ministry of Education and Research (BMBF) for their financial support for his PhD research through the IPSWaT scholarship under contract number IPS 20/06P2.

Conflicts of Interest

The authors declare no conflict of interest.

References

  1. Tomscha, S.A.; Gergel, S.E.; Tomlinson, M.J. The spatial organization of ecosystem services in river-floodplains. Ecosphere 2017, 8, e01728. [Google Scholar] [CrossRef]
  2. Tockner, K.; Stanford, J.A. Riverine flood plains: Present state and future trends. Environ. Conserv. 2002, 29, 308–330. [Google Scholar] [CrossRef] [Green Version]
  3. Hohensinner, S.; Habersack, H.; Jungwirth, M.; Zauner, G. Reconstruction of the characteristics of a natural alluvial river–floodplain system and hydromorphological changes following human modifications: The Danube River (1812–1991). River Res. Appl. 2004, 20, 25–41. [Google Scholar] [CrossRef]
  4. Gardiner, J.; Starosolszky, Ö.; Yevjevich, V. (Eds.) Defence from Floods and Floodplain Management; Springer: Dordrecht, The Netherlands, 1995. [Google Scholar]
  5. Özer, I.E.; Van Damme, M.; Jonkman, S.N. Towards an International Levee Performance Database (ILPD) and Its Use for Macro-Scale Analysis of Levee Breaches and Failures. Water 2019, 12, 119. [Google Scholar] [CrossRef] [Green Version]
  6. Merz, B.; Elmer, F.; Kunz, M.; Mühr, B.; Schröter, K.; Uhlemann-Elmer, S. The extreme flood in June 2013 in Germany. La Houille Blanche 2014, 57, 5–10. [Google Scholar] [CrossRef] [Green Version]
  7. IPCC. Managing the Risks of Extreme Events and Disasters to Advance Climate Change Adaptation: A Special Report of Working Groups I and II of the Intergovernmental Panel on Climate Change; Field, C.B.V., Barros, T.F., Stocker, D., Qin, D.J., Dokken, K.L., Ebi, M.D., Mastrandrea, K.J., Mach, G.-K., Plattner, S.K., Allen, M., et al., Eds.; Cambridge University Press: Cambridge, UK, 2012. [Google Scholar]
  8. ASCE/EWRI Task Committee on Dam/Levee Breaching Earthen Embankment Breaching. J. Hydraul. Eng. 2011, 137, 1549–1564. [CrossRef]
  9. Tadesse, Y.; Fröhle, P. An Integrated Approach to Simulate Flooding Due to River Dike Breach. In Proceedings of the 11th International Conference on Hydroinformatics (HIC 2014): Informatics and the Environment: Data and Model Integration in a Heterogeneous Hydro World; Piasecki, M., Ed.; Curran: Red Hook, NY, USA, 2015; pp. 418–425. [Google Scholar]
  10. Ahrens, J.D. Koka Dam-River Awash Floods. Report of the Joint UN Assessment Team. Available online: http://www.africa.upenn.edu/eue_web/Awash29aug.htm (accessed on 19 August 2019).
  11. Sills, G.L.; Vroman, N.; Wahl, R.E.; Schwanz, N.T. Overview of New Orleans Levee Failures: Lessons Learned and Their Impact on National Levee Design and Assessment. J. Geotech. Geoenviron. Eng. 2008, 134, 556–565. [Google Scholar] [CrossRef] [Green Version]
  12. Van Emelen, S.; Soares-Frazão, S.; Riahi-Nezhad, C.K.; Chaudhry, M.H.; Imran, J.; Zech, Y. Simulations of the New Orleans 17th Street Canal breach flood. J. Hydraul. Res. 2012, 50, 70–81. [Google Scholar] [CrossRef]
  13. Nones, M.; Caviedes-Voullième, D. Computational advances and innovations in flood risk mapping. J. Flood Risk Manag. 2020, 13, 13. [Google Scholar] [CrossRef]
  14. Dazzi, S.; Vacondio, R.; Mignosa, P. Integration of a Levee Breach Erosion Model in a GPU-Accelerated 2D Shallow Water Equations Code. Water Resour. Res. 2019, 55, 682–702. [Google Scholar] [CrossRef]
  15. Apel, H.; Merz, B.; Thieken, A.H. Influence of dike breaches on flood frequency estimation. Comput. Geosci. 2009, 35, 907–923. [Google Scholar] [CrossRef] [Green Version]
  16. Viero, D.P.; D’Alpaos, A.; Carniello, L.; Defina, A. Mathematical modeling of flooding due to river bank failure. Adv. Water Resour. 2013, 59, 82–94. [Google Scholar] [CrossRef]
  17. Morris, M.; Hassan, M.; Kortenhaus, A.; Geisenhainer, P.; Visser, P.; Zhu, Y. Modelling breach initiation and growth. Flood Risk Manag. 2008, 581–591. [Google Scholar] [CrossRef]
  18. Roger, S.; Köngeter, J.; Schüttrumpf, H.; Erpicum, S.; Archambeau, P.; Pirotton, M.; Schwanenberg, D.; Dewals, B.J. Hybrid modelling of dike-break induced flows. In River Flow 2010 // River flow 2010: Proceedings of the 5th International Conference on Fluvial Hydraulics, Braunschweig, Germany, 8–10 June 2010; Dittrich, A., Ed.; Bundesanst. für Wasserbau: Karlsruhe, Germany, 2010; pp. 523–531. [Google Scholar]
  19. Kamrath, P.; Disse, M.; Hammer, M.; Köngeter, J. Assessment of Discharge through a Dike Breach and Simulation of Flood Wave Propagation. Nat. Hazards 2006, 38, 63–78. [Google Scholar] [CrossRef]
  20. Canelas, R.; Murillo, J.; Ferreira, R.M.L. Two-dimensional depth-averaged modelling of dam-break flows over mobile beds. J. Hydraul. Res. 2013, 51, 392–407. [Google Scholar] [CrossRef]
  21. Cantero-Chinchilla, F.N.; Castro-Orgaz, O.; Schmocker, L.; Hager, W.H.; Dey, S. Depth-averaged modelling of granular dike overtopping. J. Hydraul. Res. 2018, 56, 537–550. [Google Scholar] [CrossRef]
  22. Elalfy, E.; Tabrizi, A.A.; Chaudhry, M.H. Numerical and Experimental Modeling of Levee Breach Including Slumping Failure of Breach Sides. J. Hydraul. Eng. 2018, 144, 04017066. [Google Scholar] [CrossRef]
  23. Hoffmans, G.; Van Rijn, L. Hydraulic approach for predicting piping in dikes. J. Hydraul. Res. 2018, 56, 268–281. [Google Scholar] [CrossRef]
  24. Li, S.; Duffy, C.J. Fully coupled approach to modeling shallow water flow, sediment transport, and bed evolution in rivers. Water Resour. Res. 2011, 47, 61. [Google Scholar] [CrossRef]
  25. Mizutani, H.; Nakagawa, H.; Yoden, T.; Kawaike, K.; Zhang, H. Numerical modelling of river embankment failure due to overtopping flow considering infiltration effects. J. Hydraul. Res. 2013, 51, 681–695. [Google Scholar] [CrossRef] [Green Version]
  26. Murillo, J.; García-Navarro, P. An Exner-based coupled model for two-dimensional transient flow over erodible bed. J. Comput. Phys. 2010, 229, 8704–8732. [Google Scholar] [CrossRef]
  27. Onda, S.; Hosoda, T.; Jaćimović, N.M.; Kimura, I. Numerical modelling of simultaneous overtopping and seepage flows with application to dike breaching. J. Hydraul. Res. 2018, 57, 13–25. [Google Scholar] [CrossRef]
  28. Yang, Y.-S.; Yang, T.-T.; Qiu, L.-C.; Han, Y. Simulating the Overtopping Failure of Homogeneous Embankment by a Double-Point Two-Phase MPM. Water 2019, 11, 1636. [Google Scholar] [CrossRef] [Green Version]
  29. Singh, K.P.; Snorrason, A. Sensitivity of outflow peaks and flood stages to the selection of dam breach parameters and simulation models. J. Hydrol. 1984, 68, 295–310. [Google Scholar] [CrossRef]
  30. Hervouet, J.-M. Hydrodynamics of Free Surface Flows: Modelling with the Finite Element Method; John Wiley & Sons, Ltd.: Chichester, UK; Hoboken, NJ, USA, 2007. [Google Scholar]
  31. Open Telemac-Mascaret (Telemac). Telemac-2d-Two-Dimensional Hydrodynamic. Available online: http://www.opentelemac.org/index.php/presentation?id=17 (accessed on 22 August 2019).
  32. Ata, R. Telemac2D User Manual: Version v7p3. 2018. Available online: http://www.opentelemac.org/index.php/manuals/viewcategory/13-telemac-2d (accessed on 3 September 2018).
  33. Tadesse, Y.; Fröhle, P. Modelling of river dike breach type physical test flow with Telemac-2D. In Proceedings of the 24th Telemac-Mascaret User Conference; Dorfmann, C., Zenz, G., Eds.; Verlag der Technischen Universität Graz: Graz, Austria, 2017; pp. 107–112. [Google Scholar]
  34. Abebe, H.M. Sedimentation in the Koka Reservoir, Ethiopia. In Hydropower in the new Millenium, Proceedings of the 4th International Conference on Hydropower Development; Honningsvag, B., Midttomme, G.H., Repp, K., Vaskinn, K., Westeren, T., Eds.; A.A. Balkema: Lisse, The Netherlands, 2001; pp. 345–350. [Google Scholar]
  35. Shahin, M.M.A. An overview of reservoir sedimentation in some African river basins. In Proceedings of the Yokohama Symposium, Yokohoma, Japan, 19–21 July 1993; pp. 93–100. [Google Scholar]
  36. Halcrow; SOGREAH; MCE. Awash River Basin Flood Control and Watershed Management Study Project: Working Paper 5; Report obtained from The Ministry of Water Resources, Federal Democratic Republic of Ethiopia; The Ministry of Water Resources, Federal Democratic Republic of Ethiopia: Addis Ababa, Ethiopia, 2005.
  37. Associated Press. 20,000 Ethiopians Evacuated. Available online: https://reliefweb.int/report/ethiopia/20000-ethiopians-evacuated (accessed on 19 August 2019).
  38. Vorogushyn, S.; Merz, B.; Apel, H. Development of dike fragility curves for piping and micro-instability breach mechanisms. Nat. Hazards Earth Syst. Sci. 2009, 9, 1383–1401. [Google Scholar] [CrossRef]
  39. Di Baldassarre, G.; Castellarin, A.; Brath, A. Analysis of the effects of levee heightening on flood propagation: Example of the River Po, Italy. Hydrol. Sci. J. 2009, 54, 1007–1017. [Google Scholar] [CrossRef]
  40. Vorogushyn, S.; Merz, B.; Lindenschmidt, K.-E.; Apel, H. A new methodology for flood hazard assessment considering dike breaches. Water Resour. Res. 2010, 46, 125. [Google Scholar] [CrossRef] [Green Version]
  41. Chatterjee, C.; Förster, S.; Bronstert, A. Comparison of hydrodynamic models of different complexities to model floods with emergency storage areas. Hydrol. Process. 2008, 22, 4695–4709. [Google Scholar] [CrossRef]
  42. International Bank for Reconstruction and Development. The Ethiopian Electric Light and Power Authority Project; International Bank for Reconstruction and Development: Washington, DC, USA, 1964. [Google Scholar]
  43. Jiang, L.; Diao, M.; Sun, H.; Ren, Y. Numerical Modeling of Flow Over a Rectangular Broad-Crested Weir with a Sloped Upstream Face. Water 2018, 10, 1663. [Google Scholar] [CrossRef] [Green Version]
  44. Tracy, H.J. Discharge Characteristics of Broad-Crested Weirs; Geological Survey Circular No. 397; United States Department of the Interior: Washington, DC, USA, 1957.
  45. Dou, S.-T.; Wang, D.-W.; Yu, M.-H.; Liang, Y.-J. Numerical modeling of the lateral widening of levee breach by overtopping in a flume with 180 bend. Nat. Hazards Earth Syst. Sci. 2014, 14, 11–20. [Google Scholar] [CrossRef] [Green Version]
  46. Mazzoleni, M.; Bacchi, B.; Barontini, S.; Di Baldassarre, G.; Pilotti, M.; Ranzi, R. Flooding Hazard Mapping in Floodplain Areas Affected by Piping Breaches in the Po River, Italy. J. Hydrol. Eng. 2014, 19, 717–731. [Google Scholar] [CrossRef]
Figure 1. Schematic diagram of the proposed approach for the sensitivity analysis.
Water 12 03566 g001
Figure 2. Sketch: Definition of levee breach (not to scale).
Water 12 03566 g002
Figure 3. Location of the study area—Wonji-Shoa Sugar Factory and its sugar cane plantation (background map courtesy of ESRI®, ArcGIS online service).
Water 12 03566 g003
Figure 4. Excerpt of the computational mesh.
Water 12 03566 g004
Figure 5. Awash River flow data: (a) hydrograph of the August 1996 flood flow at KHD and Wonji gauging stations; (b) hydrograph of the summer 1998 flood flow at KHD and Wonji gauging stations; (c) hydrograph of the August 1999 flood flow at KHD and Wonji gauging stations; (d) stage–discharge relationship of Awash River at Awash II derived using overflow equation for broad-crested weir.
Water 12 03566 g005
Figure 6. Model calibration: measured discharge hydrograph of summer 1998 at Wonji gauging station (a) compared with modelled discharge hydrographs for different Nikuradse’s roughness Ks-values, (b) compared with modelled discharge hydrographs for different eddy viscosity values (Vis.).
Water 12 03566 g006
Figure 7. Model validation: Modelled water depth at the office location corresponding to the breach information.
Water 12 03566 g007
Figure 8. For the indicated levee breach durations (BD) and the historical levee breach location of the August 1996 levee breach flood event at Wonji: (a) modelled water depth at an office location; (b) modelled breach discharge. The office location and the historical breach location are shown in Figure 3.
Water 12 03566 g008
Figure 9. For the indicated levee breach start times (BT) on 24.08.1996 and the historical levee breach location of the August 1996 levee breach flood event at Wonji, (a) modelled water depth at an office location and (b) modelled breach discharge. The office location and the historical breach location are shown in Figure 3.
Water 12 03566 g009
Figure 10. For the indicated final levee breach widths (BW) and the historical levee breach location of the August 1996 levee breach flood event at Wonji, (a) modelled water depth at an office location and (b) modelled breach discharge. The office location and the historical breach location are shown in Figure 3.
Water 12 03566 g010
Figure 11. For the indicated final breach levels (BL) (BL = 0 m (levee erodes to the ground level) and BL = 1.5 m (levee erodes to half its height, which is 3 m)) and the historical levee breach location of the August 1996 levee breach flood event at Wonji: (a) modelled water depth at an office location; (b) modelled breach discharge. The office location and the historical breach location are shown in Figure 3.
Water 12 03566 g011
Figure 12. For the two breach locations (BP 1 and BP 2) shown in Figure 4 and the August 1996 Awash River flood event: (a) modelled water depth at an office location; (b) modelled breach discharge. The office location is shown in Figure 3.
Water 12 03566 g012
Figure 13. For levee-lowering options (Option 1: only vertical breach growth; Option 2: vertical and lateral breach growth) and the historical levee breach location of the August 1996 levee breach flood event at Wonji: (a) modelled water depth at an office location; (b) modelled breach discharge. The office location and the historical breach location are shown in Figure 3.
Water 12 03566 g013
Publisher’s Note: MDPI stays neutral with regard to jurisdictional claims in published maps and institutional affiliations.

