Article

Planktonic Invertebrates in the Assessment of Long-Term Change in Water Quality of the Sorbulak Wastewater Disposal System (Kazakhstan)

1
Institute of Zoology of Republic of Kazakhstan, Almaty 050060, Kazakhstan
2
Kazakh Agency of Applied Ecology, Almaty 050010, Kazakhstan
3
Institute of Evolution, University of Haifa, Haifa 3498838, Israel
4
Faculty of Chemistry and Chemical Technology, Al-Farabi Kazakh National University, Almaty 050040, Kazakhstan
5
Faculty of Biology and Biotechnology, Al-Farabi Kazakh National University, Almaty 050040, Kazakhstan
*
Author to whom correspondence should be addressed.
Water 2020, 12(12), 3409; https://doi.org/10.3390/w12123409
Submission received: 17 October 2020 / Revised: 30 November 2020 / Accepted: 1 December 2020 / Published: 4 December 2020
(This article belongs to the Special Issue Assessment of Water Quality)

Abstract

:
The multicomponent composition of wastewater makes it challenging to assess its quality objectively, but the last one is a prerequisite for the safe re-use of wastewater. The solution to this problem should be aimed at finding criteria that make it possible to increase the objectivity of assessing the water quality of reservoirs with multicomponent pollution. This work analyzes the water quality of the Sorbulak wastewater disposal system in the summer of 2017, based on chemical variables and zooplankton structure and assess the long-term changes in the water quality of Sorbulak. According to the Kruskal–Wallis test, in 2017, the differences between the studied water bodies in the content of nutrients and heavy metals were mostly insignificant. From 2000–2002 to 2017, nitrate, nitrite nitrogen, and heavy metals in Sorbulak significantly decreased. Zooplankton communities consisted of a relatively small number of eurybiontic species resistant to environmental factors. The variability of the quantitative variables of zooplankton was associated with the nutrients. Males dominated the population of the cyclopoid copepods Acanthocyclops trajani. In 2000–2002 individuals with morphological anomalies were found in cyclopoid copepods populations, but were absent in 2017. The appearance of individuals with morphological anomalies was associated with copper or lead. The chemical data and structure of zooplankton communities indicated that the toxic pollution of Sorbulak decreased by 2017 compared to 2000–2002. Our results demonstrate that the structural variables of zooplankton communities could be successfully used to assess the water quality of water bodies with mixed pollution. We recommend using not only the traditional set of biological variables (abundance, biomass, diversity indices, and the average mass of an individual), but also data on the structure of species dominance, the sex structure of copepod populations, and the presence of individuals with morphological anomalies for monitoring of water bodies with mixed pollution.

1. Introduction

Due to socio-economic, demographic, and climatic reasons, the share of re-use wastewater for irrigation increases from year to year in different parts of the world [1,2] and especially in arid areas. However, such a policy of using water resources poses a serious threat to public health, due to the accumulation of toxic compounds in food [3,4,5], the risk of contracting infectious diseases [6], and the genotoxic properties of wastewater [7]. Water quality assessment [1,2,4,5,6,7] identifies the benefits and risks of recycling wastewater. The solution to this problem is fraught with specific difficulties, primarily due to the multicomponent composition of wastewater. Along with nutrients, wastewater contains a wide range of toxic compounds, including heavy metals [8,9], pesticides, surfactants [10], phenols, petroleum products [11].
A complete chemical analysis of all hazardous compounds that make up wastewater is impossible both physically and economically. Moreover, it is challenging to predict chemical reactions between pollutants [12]. As a result, it is impossible to obtain objective information on the wastewater hazard only based on chemical methods. In the Water Framework Directive [13], it is recommended to use an integrated approach to assess aquatic ecosystem health. It is based on a combination of chemical and biological methods, and it is increasingly being used in environmental research [14,15,16]. The informative value of the biological assessment is associated with the integrated response of living organisms to the entire complex of external conditions, including natural and anthropogenic factors [17,18,19,20].
The need for wastewater re-use also exists in Kazakhstan, located mainly in the zone of insufficient moisture. Sorbulak, together with ponds (referred to as “the Sorbulak wastewater disposal system”), is one of the largest disposal systems in Kazakhstan and the world. Treated municipal and industrial wastewater from an area with a total population of 2.5 million people is discharged mainly into Sorbulak [21]. The ponds are designed to divert part of the wastewater when there is a threat of overflow from Sorbulak. In this case, water is discharged through a canal from the ponds into the Ili river and then enters Lake Balkhash, the largest fishing water body in Kazakhstan, after the Caspian and Aral Seas. The content of many pollutants in treated wastewater exceeds the maximum permissible concentration [22]. According to calculations [21], about 80 tons of suspended solids, 1.4 thousand tons of iron, 45 tons of copper, 29 tons of chromium, 1 ton of lead, 27 tons of cadmium, and the same amount of zinc and strontium entered Sorbulak with wastewater from 1973 to 1998.
The volume of wastewater entering Sorbulak has decreased in recent decades, due to socio-economic reasons [21]. However, in some years, there is a threat of a breakthrough in the barrier dams and the inflow of a large volume of polluted water into the fishery water bodies located below, including Balkhash Lake and the Ili River [8,23,24,25]. A comprehensive assessment of the water quality of Sorbulak reservoir and ponds is required to select the ways of re-using the large volume of water accumulated in these water bodies. Until now, such studies have not been carried out in Kazakhstan. Published articles provide fragmented data on the content of the primary pollutants in water, soil, the muscle tissue of fish [8,9,22,26,27,28], and the structure of zooplankton communities in Sorbulak [8,26,27,28]. Information on the pollution of wastewater ponds is absent, although, given their role, assessing the ecological state of these ponds is an urgent task.
A traditional set of biological variables is currently used to assess the organic pollution of aquatic ecosystems [17,18,19,20]. It includes data on the species composition, abundance, biomass, diversity indices, less often data on the size structure of aquatic communities. Criteria for the biological assessment of water bodies with toxic or mixed pollution have not been established. We assumed that, in addition to the above biological variables, data on the structure of species dominance, sex structure, and the appearance of individuals with morphological anomalies in populations of copepods could increase the efficiency of assessing the water quality of reservoirs with mixed pollution. We tested our hypothesis in the Sorbulak wastewater disposal system, which is characterized by multicomponent pollution.
The work aimed to analyze the water quality of Sorbulak and the ponds of the disposal system in the summer of 2017 based on the chemical variables and an expanded set of structural variables of zooplankton, as well as assess the long-term changes in water quality in Sorbulak in 2000–2017.

2. Materials and Methods

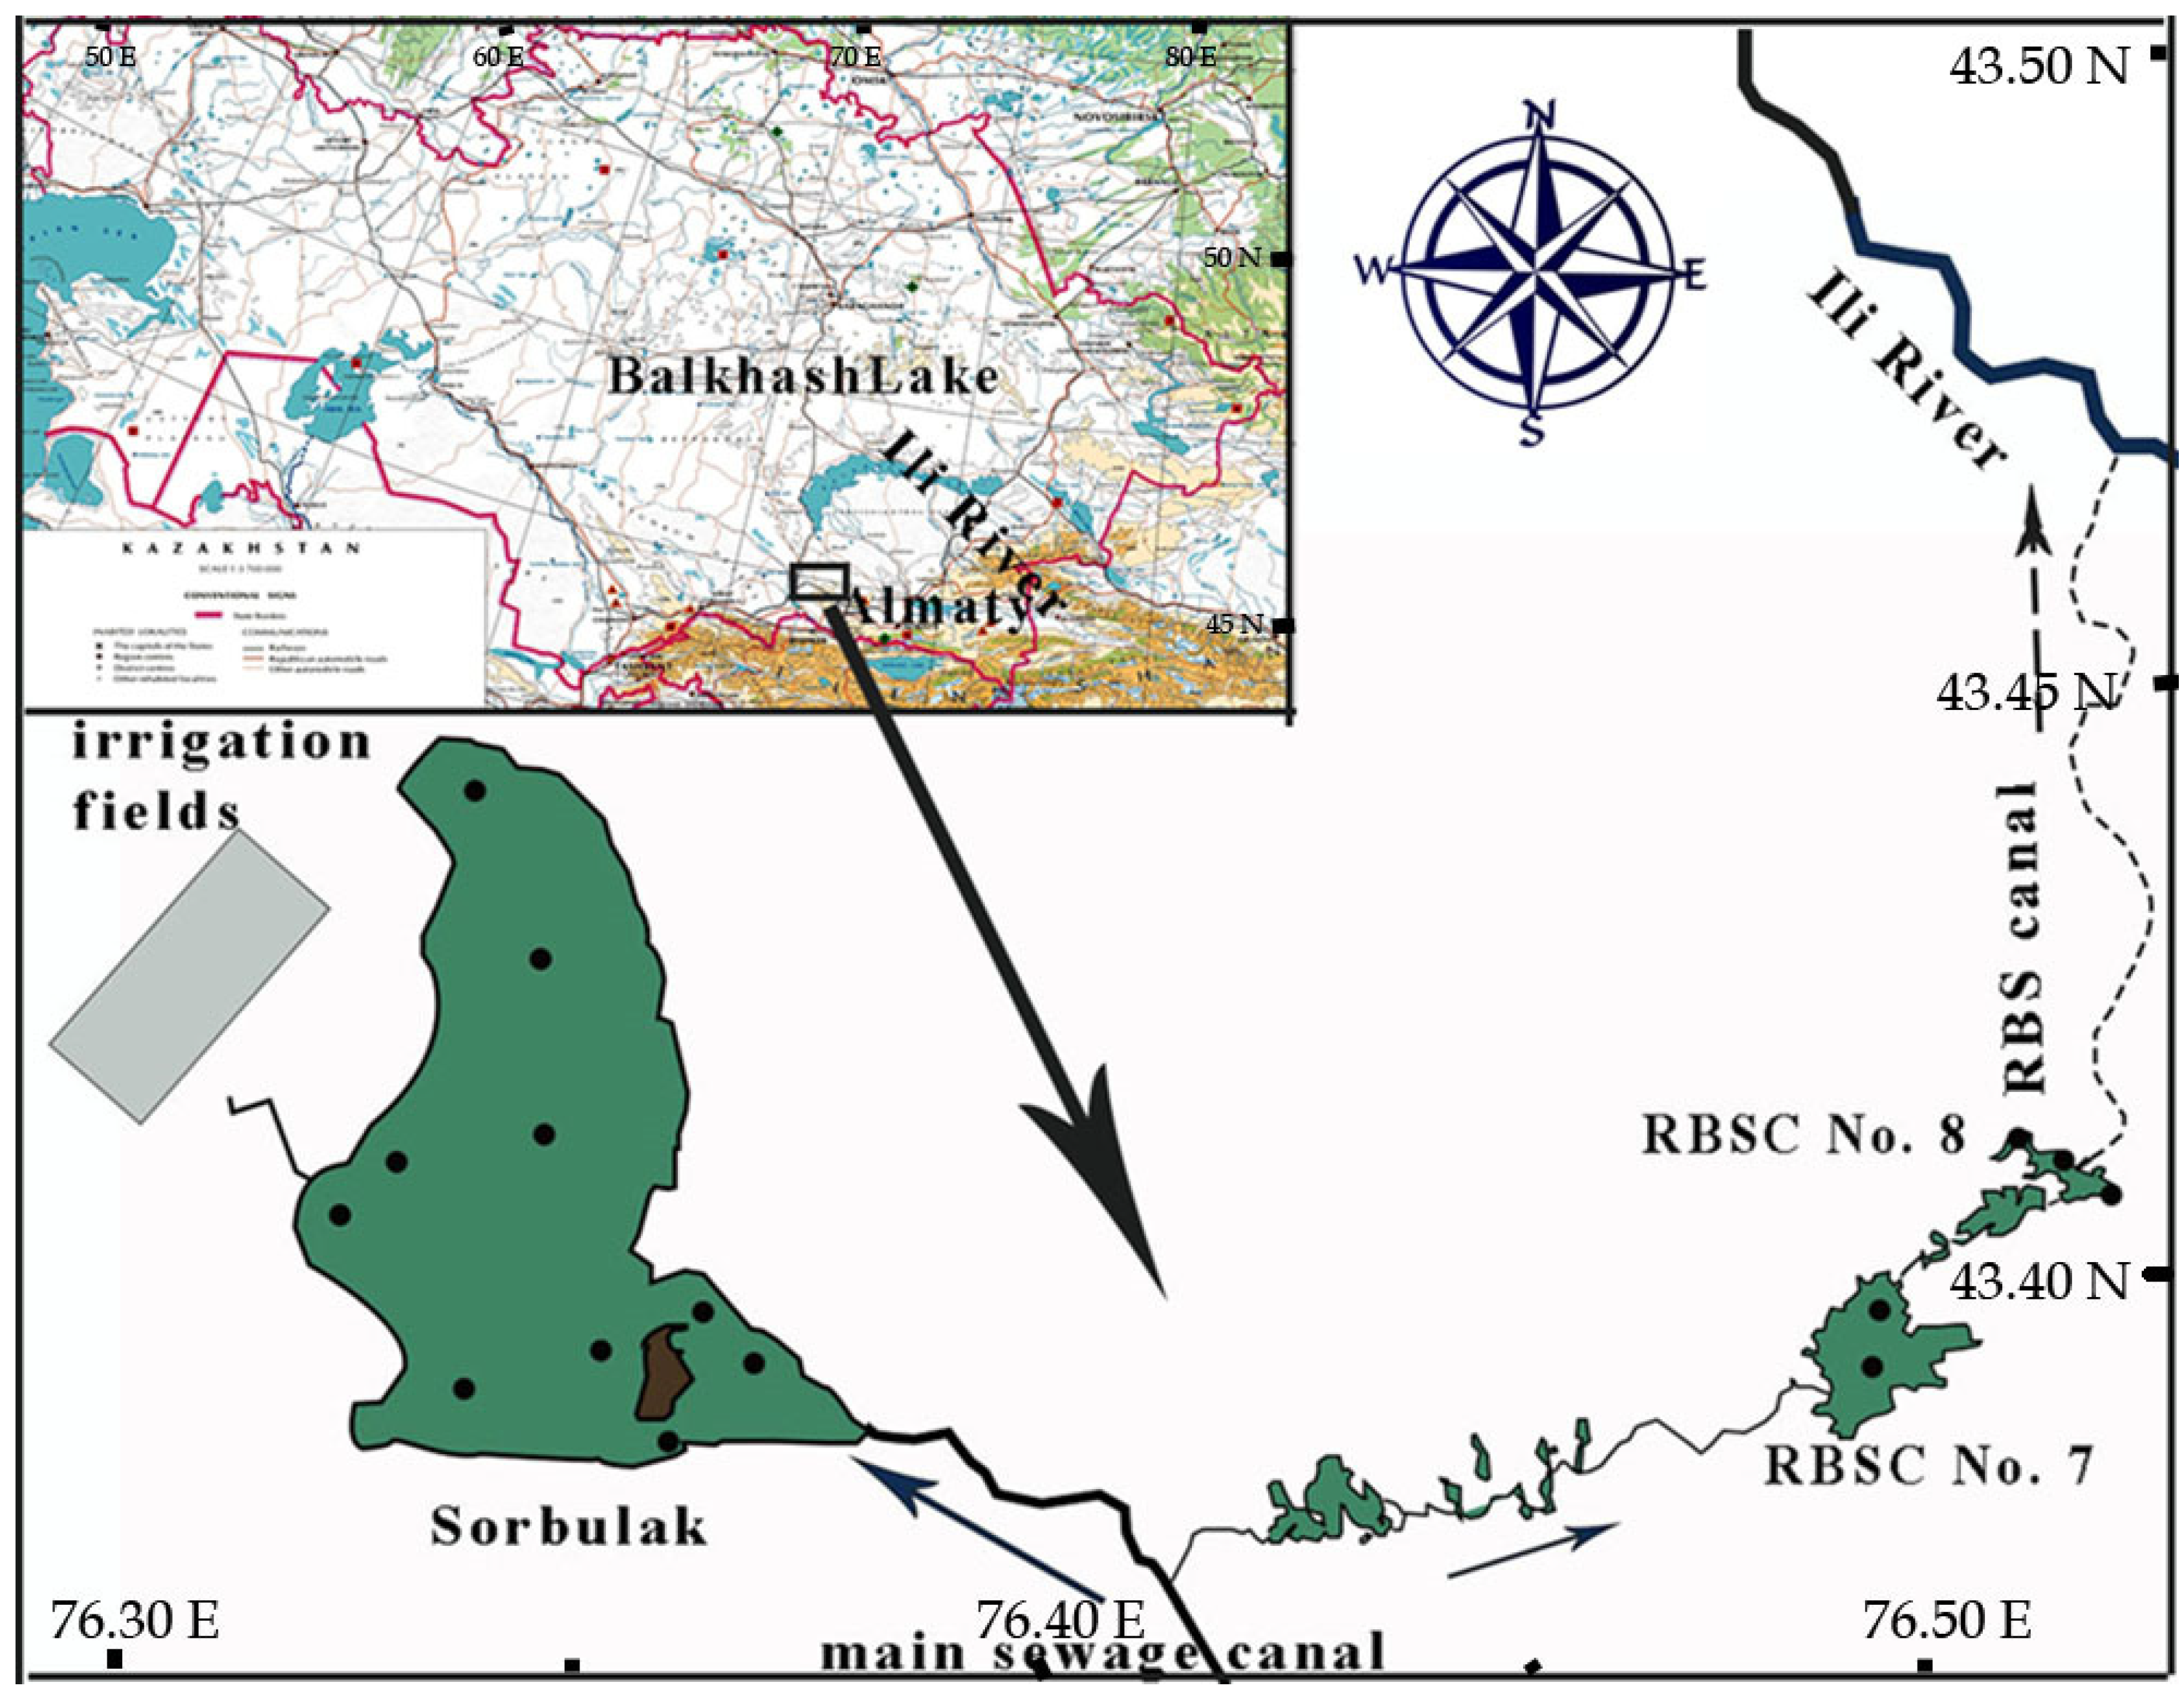
2.1. Description of Study Area

2.1.1. Climate

The territory is a part of a semi-arid zone that is characterized by a continental climate. Summers are dry and hot, with a maximum air temperature of up to +45 °C and an average July temperature of +25.5 °C. Winter is cold, with a minimum temperature of up to −40.0 °C. Frequent winds are characteristic. The average annual precipitation is 100–200 mm, with a maximum in April–May [29].

2.1.2. Physical and Geographical Characteristic of Sorbulak Wastewater Disposal System

Sorbulak is located 40–50 km north of Almaty (South-East Kazakhstan) (Figure 1). The reservoir was constructed in 1973 by filling the natural depression of the relief with wastewater that was treated at a sewage treatment plant. Wastewater enters Sorbulak through the main sewage canal. It originates at the wastewater treatment plant located 12 km northwest of Almaty and enters into the southeastern part of the reservoir. Domestic wastewater share accounts for up to 35–40%, industrial wastewater—up to 11–35%, atmospheric precipitation—up to 19%, groundwater—up to 9% of the total water volume [21].
Wastewater was planned to be used for irrigation of about 22.8 thousand hectares of land to prevent overflow and breakthrough of the barrier dam of Sorbulak; less than 3.0 thousand hectares remained by 2000. Irrigated fields are situated several kilometers northwest of the shoreline. The watering of fields is carried out, due to the canal, which originates in the western bay of Sorbulak. For an emergency, the Right-Bank Sorbulak Canal (RBSC) with a length of 63 km was additionally built in the 1990s. There are eight ponds on the canal referred to as RBSC ponds. Pond No. 7 is the largest. Pond No. 8 is the last in the system. In case of an emergency (for example, when the volume of water in Sorbulak approaches the maximum permissible level), part of the sewage is discharged through the canal into ponds, bypassing Sorbulak. Then, from the last pond, water is released into the Ili River through the RBS canal.
Sorbulak is shaped like an irregular triangle. RBSC ponds are with an indented shoreline. According to the average depth (Table 1), Sorbulak and ponds belong to the type of shallow water bodies [30]. The water area and volume of RBSC ponds vary significantly and depend on the discharged wastewater volume. Sorbulak is characterized by relatively high water transparency, while the values of this variable in ponds are low.

2.2. Field Sampling

The studies of Sorbulak were performed in the summer of 2000, 2001, 2002, and 2017. RBSC ponds were studied only in the summer of 2017. A total of 45 zooplankton samples were taken altogether with samples to determine nutrients and heavy metals. The measures of the temperature and pH of the surface water layers were taken in the field environment by using the Hanna HI 98129 instrument in parallel with sampling. The transparency of the water was measured using a Secchi disk. Coordinate referencing of the stations was done by Garmin eTrex GPS-navigator.
Zooplankton samples were collected using a small Juday plankton net (input diameter 12 cm, mesh size 64 μm) by pulling it from the bottom to the surface. Surface water samples were taken at the same stations to determine the total dissolved solids (TDS), total hardness, nitrites, nitrates, ammonia, phosphates, iron, manganese, fluorine, silicon, heavy metals, and permanganate index [31]. We collected chemical and biological samples according to the state water quality monitoring program, approved in the Republic of Kazakhstan [32] for shallow unstratified water bodies [33]. Samples for analysis of TDS were taken in 1-L plastic containers. Samples for determining the nutrients were taken in 0.5 L glass containers and fixed with 1 mL of chloroform. Samples for determining the amount of easily oxidizable organic matter (permanganate index PI) were taken in 0.3 L glass containers and fixed with two ml concentrated sulfuric acid. Water samples for analysis of heavy metals were taken in 0.5 L plastic containers and fixed with concentrated chemically pure nitric acid. From 2000 to 2002, only four heavy metals (Cd, Cu, Pb, and Zn) were determined, while in 2017, additionally Cr and Ni. All samples were stored in a refrigerator and delivered to the laboratory within 1–2 days after collection.

2.3. Laboratory Analysis

Conventional methods of chemical analysis of water samples were used [34,35]. All water samples were analyzed in triplicate or quadruplicate. Nitrite nitrogen, nitrate nitrogen, ammonium nitrogen, phosphates, silicon, manganese, and iron were determined photometrically. Depending on the type of analysis, Griss’s or Nessler’s reagents, metallic cadmium, ammonium molybdate in combination with ascorbic or sulfosalicylic acid were used. The permanganate index (PI) was determined in acidic conditions by the Kubel method. Method sensitivity is 0.002 mg/dm3; method accuracy is ±4%. The total hardness was determined by the volumetric complexometric method with black eriochrome or black chromogen.
Analysis of samples for heavy metals was carried out in the analytical laboratory “KAZEKOANALIZ” (accreditation certificate No. KZ.I.02.1017) according to the Interstate standard [36]. Heavy metal measuring was performed by mass spectrometry with inductively coupled plasma using Agilent 7500 A manufactured by Agilent Technologies, Santa Clara, USA (National Standard RK ISO). Abundance Sensitivity of Agilent 7500 A: Low Mass < 5 × 10⁻⁷, High Mass < 1 × 10⁻⁷.
Zooplankton samples were processed with standard methods [37,38] using guides to the species identifications [39,40,41,42]. A sample was brought to a certain volume (150–500 cm3) to calculate the quantitative variables of planktonic invertebrates. After thorough mixing, three sub-samples were taken from the sample using a 1 mL stamp-pipette. In this sub-sample, all encountered individuals and age stages of certain species (the most numerous) were counted in Bogorov’s cell. Then the sample was concentrated to a volume of 125–150 cm3. Three sub-samples were retaken from it, where less abundant age stages or species were counted. The whole procedure was repeated once more, while the sample was concentrated to a volume of 50 cm3. In the end, the sample, with its volume of 20–25 mL, was viewed in its entirety for counting large and rare species of planktonic invertebrates. The results of counting individuals are recalculated per 1 m3 using the formula (separately for each sample dilution):
N = n × ( V 1 / V 2 ) V 3
where N is the abundance (ind./m3), n is the number of individuals in a portion (specimens), V1 is the dilution volume (cm3), V2 is the subsample volume (cm3), V3 is the filtered water volume (m3). The filtered volume of water was calculated by the formula:
V 3 = h × π r 2  
where h is the length of the net pulling (water column height), and r is the radius of the inner ring of the Juday net.
The total abundance was found for each species of planktonic invertebrates. For each crustacean species, the total abundance was calculated by summing the abundance of individual age and size stages. The total abundance of zooplankton was determined by summing up the abundance of all species found in the sample.
For all species of planktonic invertebrates encountered, the mass of an individual was calculated according to formulas specific to each species [38]. We counted the number of mature females, females with eggs, and males separately to describe the sex structure of copepod populations.

2.4. Statistical Analysis

We applied statistical methods to describe the structure and assess the similarity of the species composition of zooplankton communities in the studied water bodies. Statistical analysis of the relationship between ecological and biological variables makes it possible to assess the indicator role of planktonic invertebrates in assessing the water quality of aquatic ecosystems.
The number of species per sample, an average individual mass of an organism, and Δ-Snannon were calculated to describe the zooplankton structure. An average individual mass of an organism (mg) was calculated as the total biomass divided by the total abundance of zooplankton for each sample. Shannon index was calculated both based on the abundance and the biomass of species in the sample [43,44] using Primer 6 Software (https://primer.software.informer.com/6.0/) [45]. The first version of the index is designated as Shannon Ab (bit/ind.), the second one as Shannon Bi (bit/mg) for the convenience of distinguishing them. We calculated the values of Δ-Shannon as an arithmetical difference between Shannon Bi and Shannon Ab. Δ-Shannon characterizes the structure of the dominance of species. In large-sized communities, the distribution of species by abundance is more uniform than by biomass. Accordingly, the Shannon Ab values are higher than the Shannon Bi, and Δ-Shannon is positive [46,47,48,49,50,51,52]. In disturbed communities, small species are dominated [53]; the Shannon Bi is higher than the Shannon Ab, and the values of Δ-Shannon are negative.
The calculation of community composition similarity was doing as the network analysis in JASP (Jeffrey’s Amazing Statistics Program) 0.9.0.0 (https://jasp-stats.org/) on the botnet package in R-Statistica (https://www.r-project.org/) [54]. JASP plot was created as a calculation result of the percentage of an abundance of species on the level similarity 50% and as significant only when p < 0.05. The line thickness between stations reflect the correlation value; blue is positive, red is negative.
Statistical data analysis was performed using the Statistica 10 Software [55]. We calculated mean values with standard errors for all variables (pH value, Total Dissolved Solids, hardness, PI, Si, Fe, Mn, Cd, Cr, Cu, Ni, Pb, N-NO2, N-NO3, N-NH4, PO4, abundance, and biomass of Rotifera, Cladocera, Copepoda, total zooplankton, Shannon Ab, Shannon Bi, Δ-Shannon, species number, average individual mass), excluding the sex ratio, because females or males of copepods were absent in some samples. The sex ratio was calculated for each water body for each sampling date by dividing the average abundance of males by the average abundance of females. Differences in the mean values of chemical and some biological variables between the periods 2000–2002 and 2017 were performed using the Kruskal–Wallis test.
We calculated the Spearman correlation coefficient (rS, p < 0.05) to assess the relationship between the environmental (pH value, Total Dissolved Solids, hardness, PI, Si, Fe, Mn, Cd, Cr, Cu, Ni, Pb, N-NO2, N-NO3, N-NH4, PO4) and biological variables (abundance and biomass of Rotifera, Cladocera, Copepoda, total zooplankton, Shannon Ab, Shannon Bi, Δ-Shannon, species number, average individual mass).
Principal component analysis (PCA) was performed using CANOCO 4.5 Software (https://canoco.software.informer.com/4.5/) based on 2000–2002 and 2017 [56]. We used PCA as a linear indirect gradient analysis because our data is represented by short lists of biological and environmental variables. PCA is also used to identify critical environmental gradients from environmental datasets. The identified gradients became the basis for a concise description and visualization of different taxa preferences of the habitat (niches) using the ordination diagram. For multivariate analysis, we took the external factors (temperature, depth, TDS, PI, N-NO2, N-NO3, N-NH4, PO4, PI, Si, Fe, Mn, Cd, Cr, Cu, Ni, Pb) and the structural variables of zooplankton communities (quantitative variables of Rotifera, Cladocera, Copepoda, total zooplankton, Shannon Ab, Shannon Bi, Δ-Shannon, species number, average individual mass). Moreover, we used the abundance of dominant planktonic invertebrates (Daphnia galeata, D. magna, D. pulex, Bosmina longirostris, Acanthocyclops trajani, Cyclops vicinus) and the sex ratio in the populations of cyclopoid copepods A. trajni and C. vicinus.

3. Results

3.1. Hydrochemical and Toxicological Characteristics of the Sorbulak Wastewater Disposal System

According to the chemical data (Table 2), in the summer of 2017, the water was alkaline, soft, and fresh in ponds, brackish and medium hardness in Sorbulak. The maximum concentrations of easily oxidizable organic matter (PI), silicon, nitrite nitrogen, nitrate nitrogen, phosphates, copper, and zinc were recorded in pond No. 7; iron in pond No. 8; ammonium nitrogen in Sorbulak. The content of manganese, cadmium, chromium, nickel, and lead in all water bodies was at a very low level. According to the Kruskal–Wallis test, statistically significant differences were found between the average content of nitrite nitrogen in Sorbulak and pond RBSC No. 7 (p = 0.002), and between pond RBSC No. 7 and No. 8 (p = 0.036).
In Sorbulak, TDS of water in 2017 remained at the 2000–2002 level (Table 3). According to the Kruskal–Wallis test, the content of easily oxidizable organic matter (p = 0.0001) and ammonium nitrogen (p = 0.001) increased and the content of Pb (p = 0.01), Zn (p = 0.006), Cu (p = 0.0009), Cd (p < 0.001), nitrite nitrogen (p < 0.02), and nitrate nitrogen (p < 0.002) decreased significantly from 2000–2002 to 2017.

3.2. The Structure of Zooplankton Communities

Forty-six species were recorded in the zooplankton, including twenty-three rotifers, fifteen cladocerans, and eight copepods (Table 4). In Sorbulak, the species richness of planktonic invertebrates in 2017 and 2000–2002 was the same, and higher than in the RBSC ponds. Rotifers Hexarthra mira, Keratella quadrata dispersa, Polyarthra sp., cladocerans Bosmina longirostris, Chydorus sphaericus, Daphnia galeata, Daphnia magna, Daphnia pulex, copepods Acanthocyclops trajani, Cyclops vicinus, and Sinodiaptomus sarsi were found in zooplankton during all study periods.
According to the JASP network plot (Figure 2), the highest similarity was found between planktonic invertebrates from ponds No. 7 and 8 in 2017 and between pond No. 8 in 2017 and Sorbulak in 2000 (blue lines). A significant similarity was also established between the species composition of zooplankton in Sorbulak in 2001 and 2002. In 2017, the zooplankton species composition in Sorbulak was somewhat similar to all other sampling sites. The most significant differences were revealed between the species composition in pond No. 7 in 2017 and Sorbulak in 2000 (red line). Differences in the species composition were mostly recorded between the community of pond No. 7 and other water bodies. Accordingly, pond No. 7 can be marked as a critical point for all calculated relationships, which shows some specific features of this water body.
The abundance of zooplankton had more than a fourfold range of fluctuations depending on the water body and research period (Table 5). The highest zooplankton abundance was in Sorbulak in 2001 and pond No. 7 in 2017. The average zooplankton biomass varied by 13.0 times. Its maximum values were recorded in 2017 in pond No. 7. Copepoda mostly dominated. Rotifera or Cladocera were subdominants. Cladocera dominated in biomass, with Copepoda playing a minor role.
The composition of the dominant species in the zooplankton slightly varied over the years (Table 6). Most often, cyclopoid copepods Acanthocyclops trajani, cladocerans of the genus Daphnia, and the rotifers Hexarthra mira dominated. The ratio of the above species in quantitative variables of zooplankton varied depending on the water body. In Sorbulak, the proportion of Hexarthra mira and Daphnia pulex was higher than in the zooplankton communities of RBSC ponds. Simultaneously, the dominance of Acanthocyclops trajani and Daphnia magna in ponds was more pronounced than in Sorbulak. In some years, rotifers Polyarthra, Asplanchna girodi, and Keratella quadrata were also included in the dominant complexes of the surveyed water bodies.
The abundance of the dominant species Acanthocyclops trajani varied significantly over the years of research, with extremums in pond No. 7 in 2017 and Sorbulak in 2001 (Table 7). Males dominated the population of A. trajani, with the minimum values in the RBSC ponds in 2017. The abundance of Cyclops vicinus was relatively low. Cyclops was not found in the RBSC ponds in 2017. Except for 2002, the sex ratio in the population of this species was equal or female-dominated.
Remarkably, that individuals with morphological anomalies were recorded in the populations of Cyclops vicinus and Acanthocyclops trajani only in 2000–2002. Most often, there was a shortening of one of the furcal rami, as well as shortening and deformation of the furcal setae (Figure 3). The abundance of such individuals was low, no more than 10–40 ind./m3, but they were found in 50–60% of the samples during the indicated research period. In the summer of 2017, individuals with morphological abnormalities were absent in copepod populations.
The average number of species of planktonic invertebrates per sample changed approximately twofold (Table 8). The maximum values of the variable were recorded in the zooplankton of Sorbulak in 2017. According to an average individual mass, the zooplankton communities were large in body size, especially in Sorbulak in 2000 and pond No. 8 in 2017. According to the Kruskal–Wallis test, the Shannon Ab values in RBSC ponds were statistically significantly lower than in Sorbulak. The average values of the Δ-Shannon index in the zooplankton of all water bodies were positive.

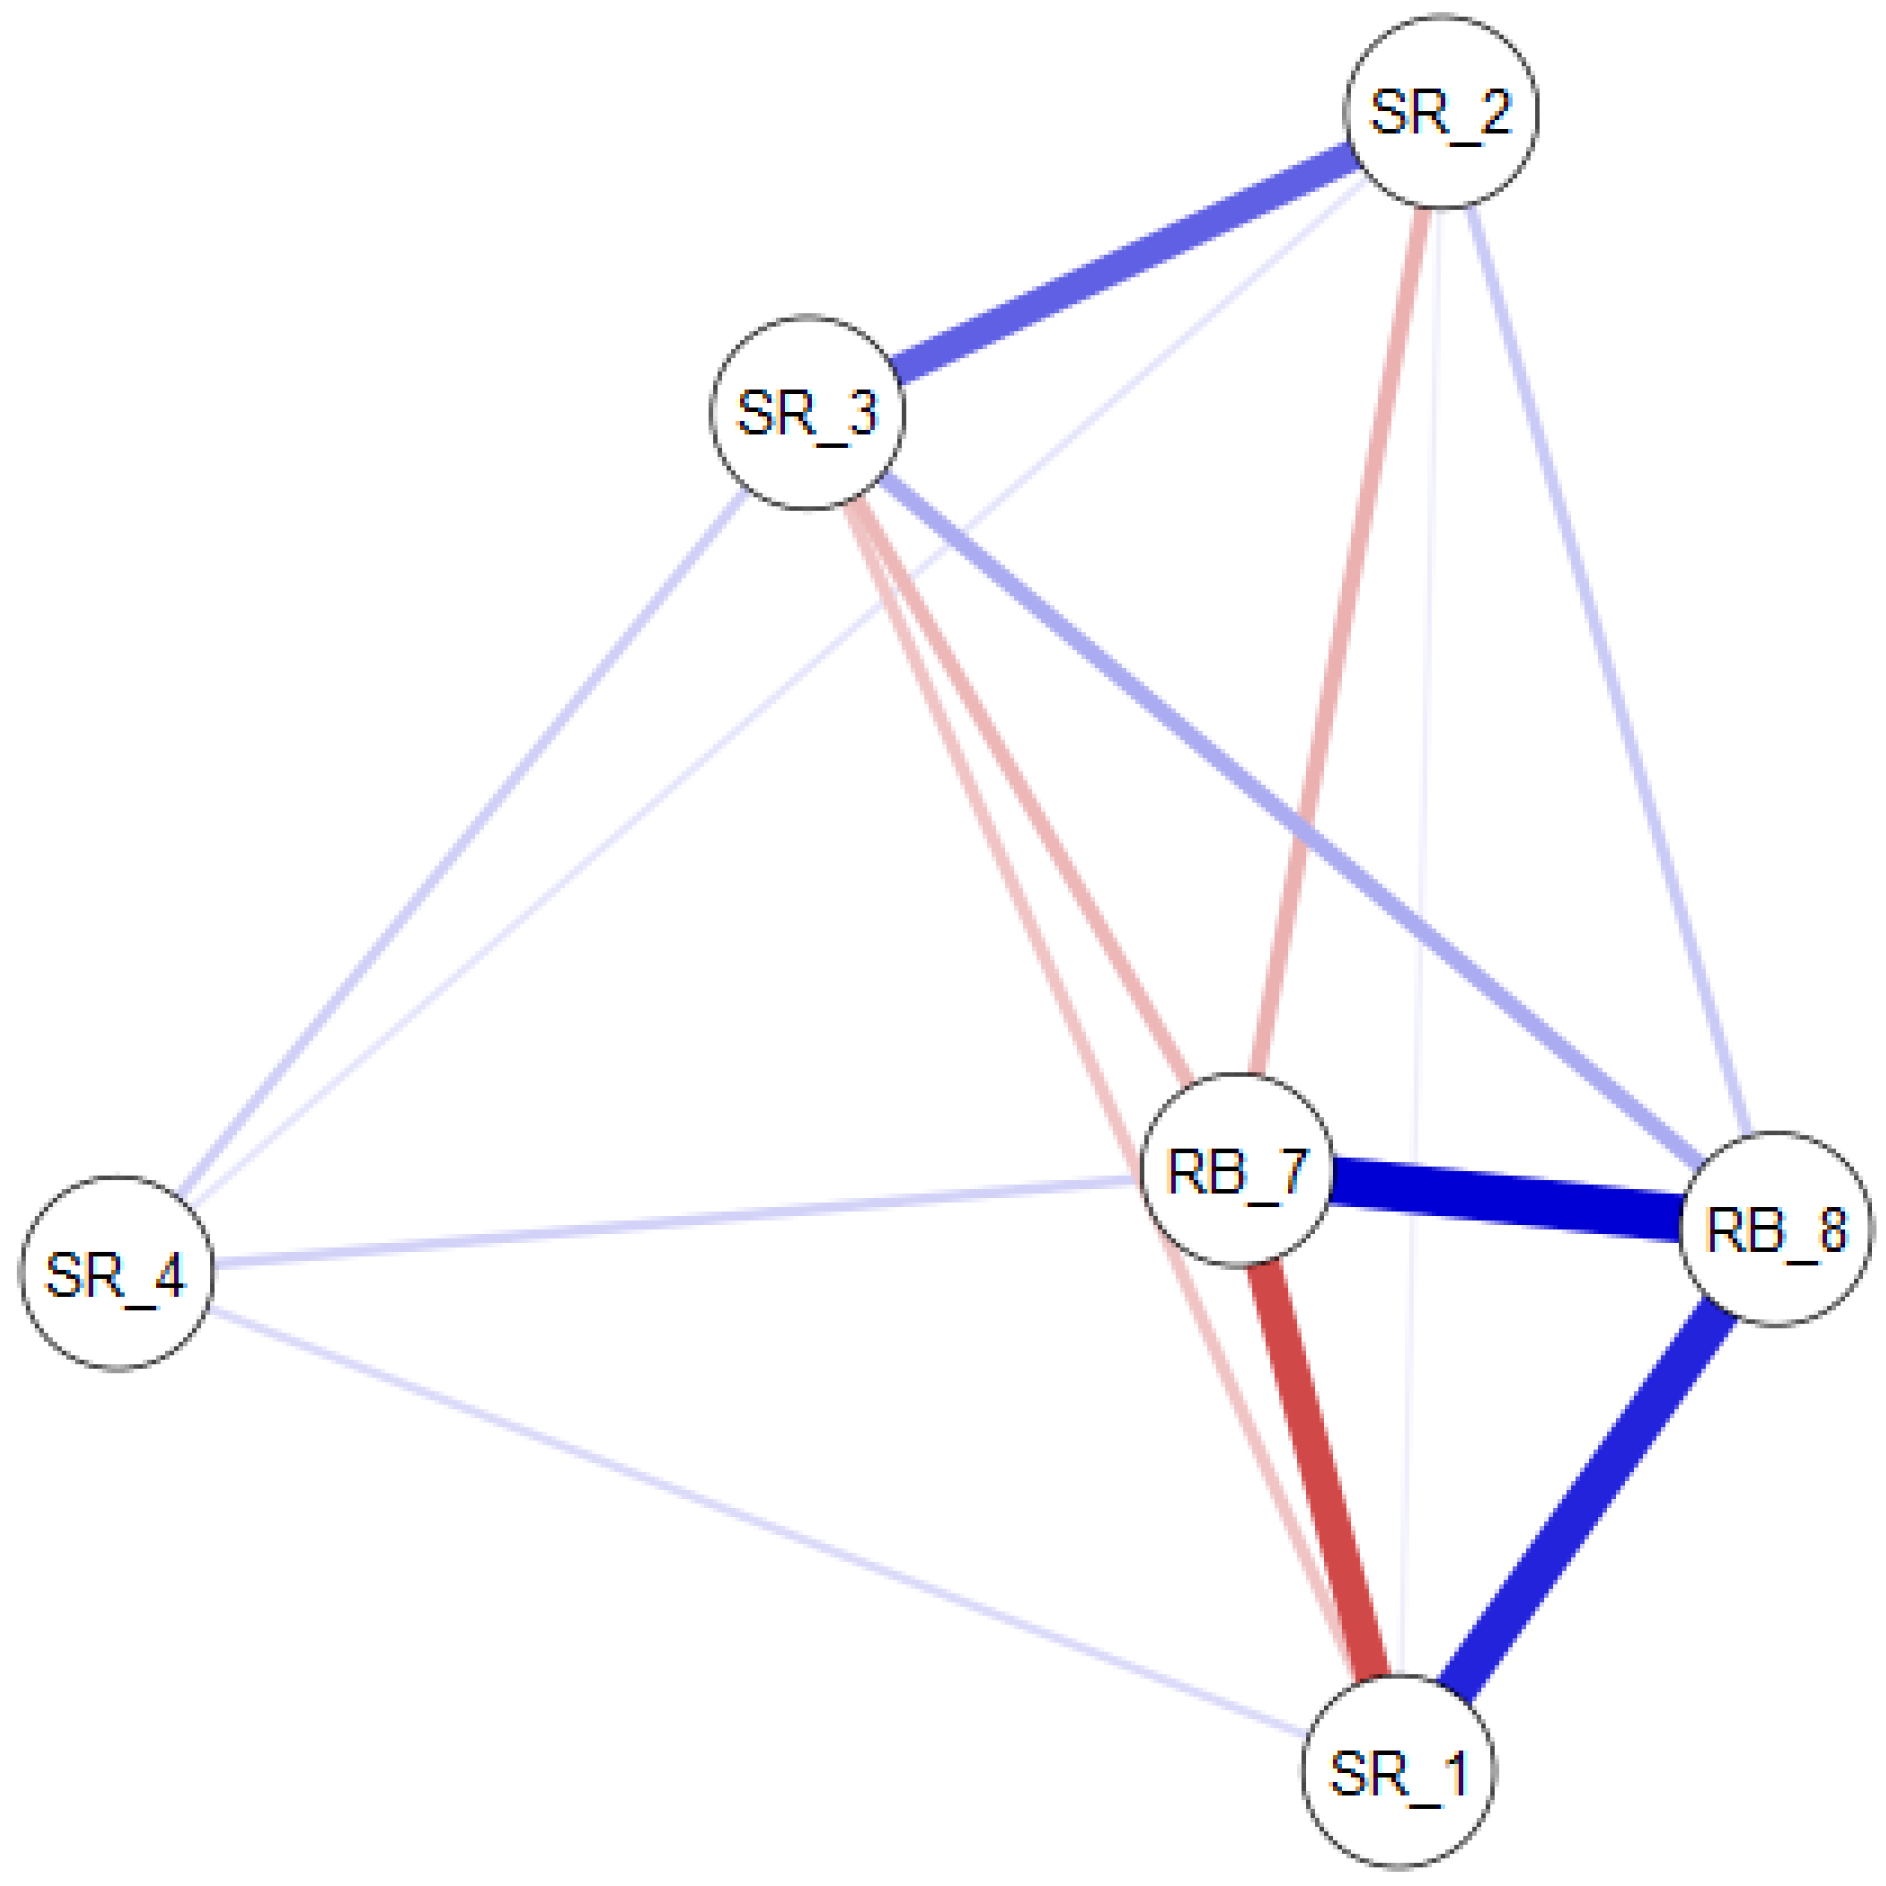
3.3. Nonparametric Correlation Analysis
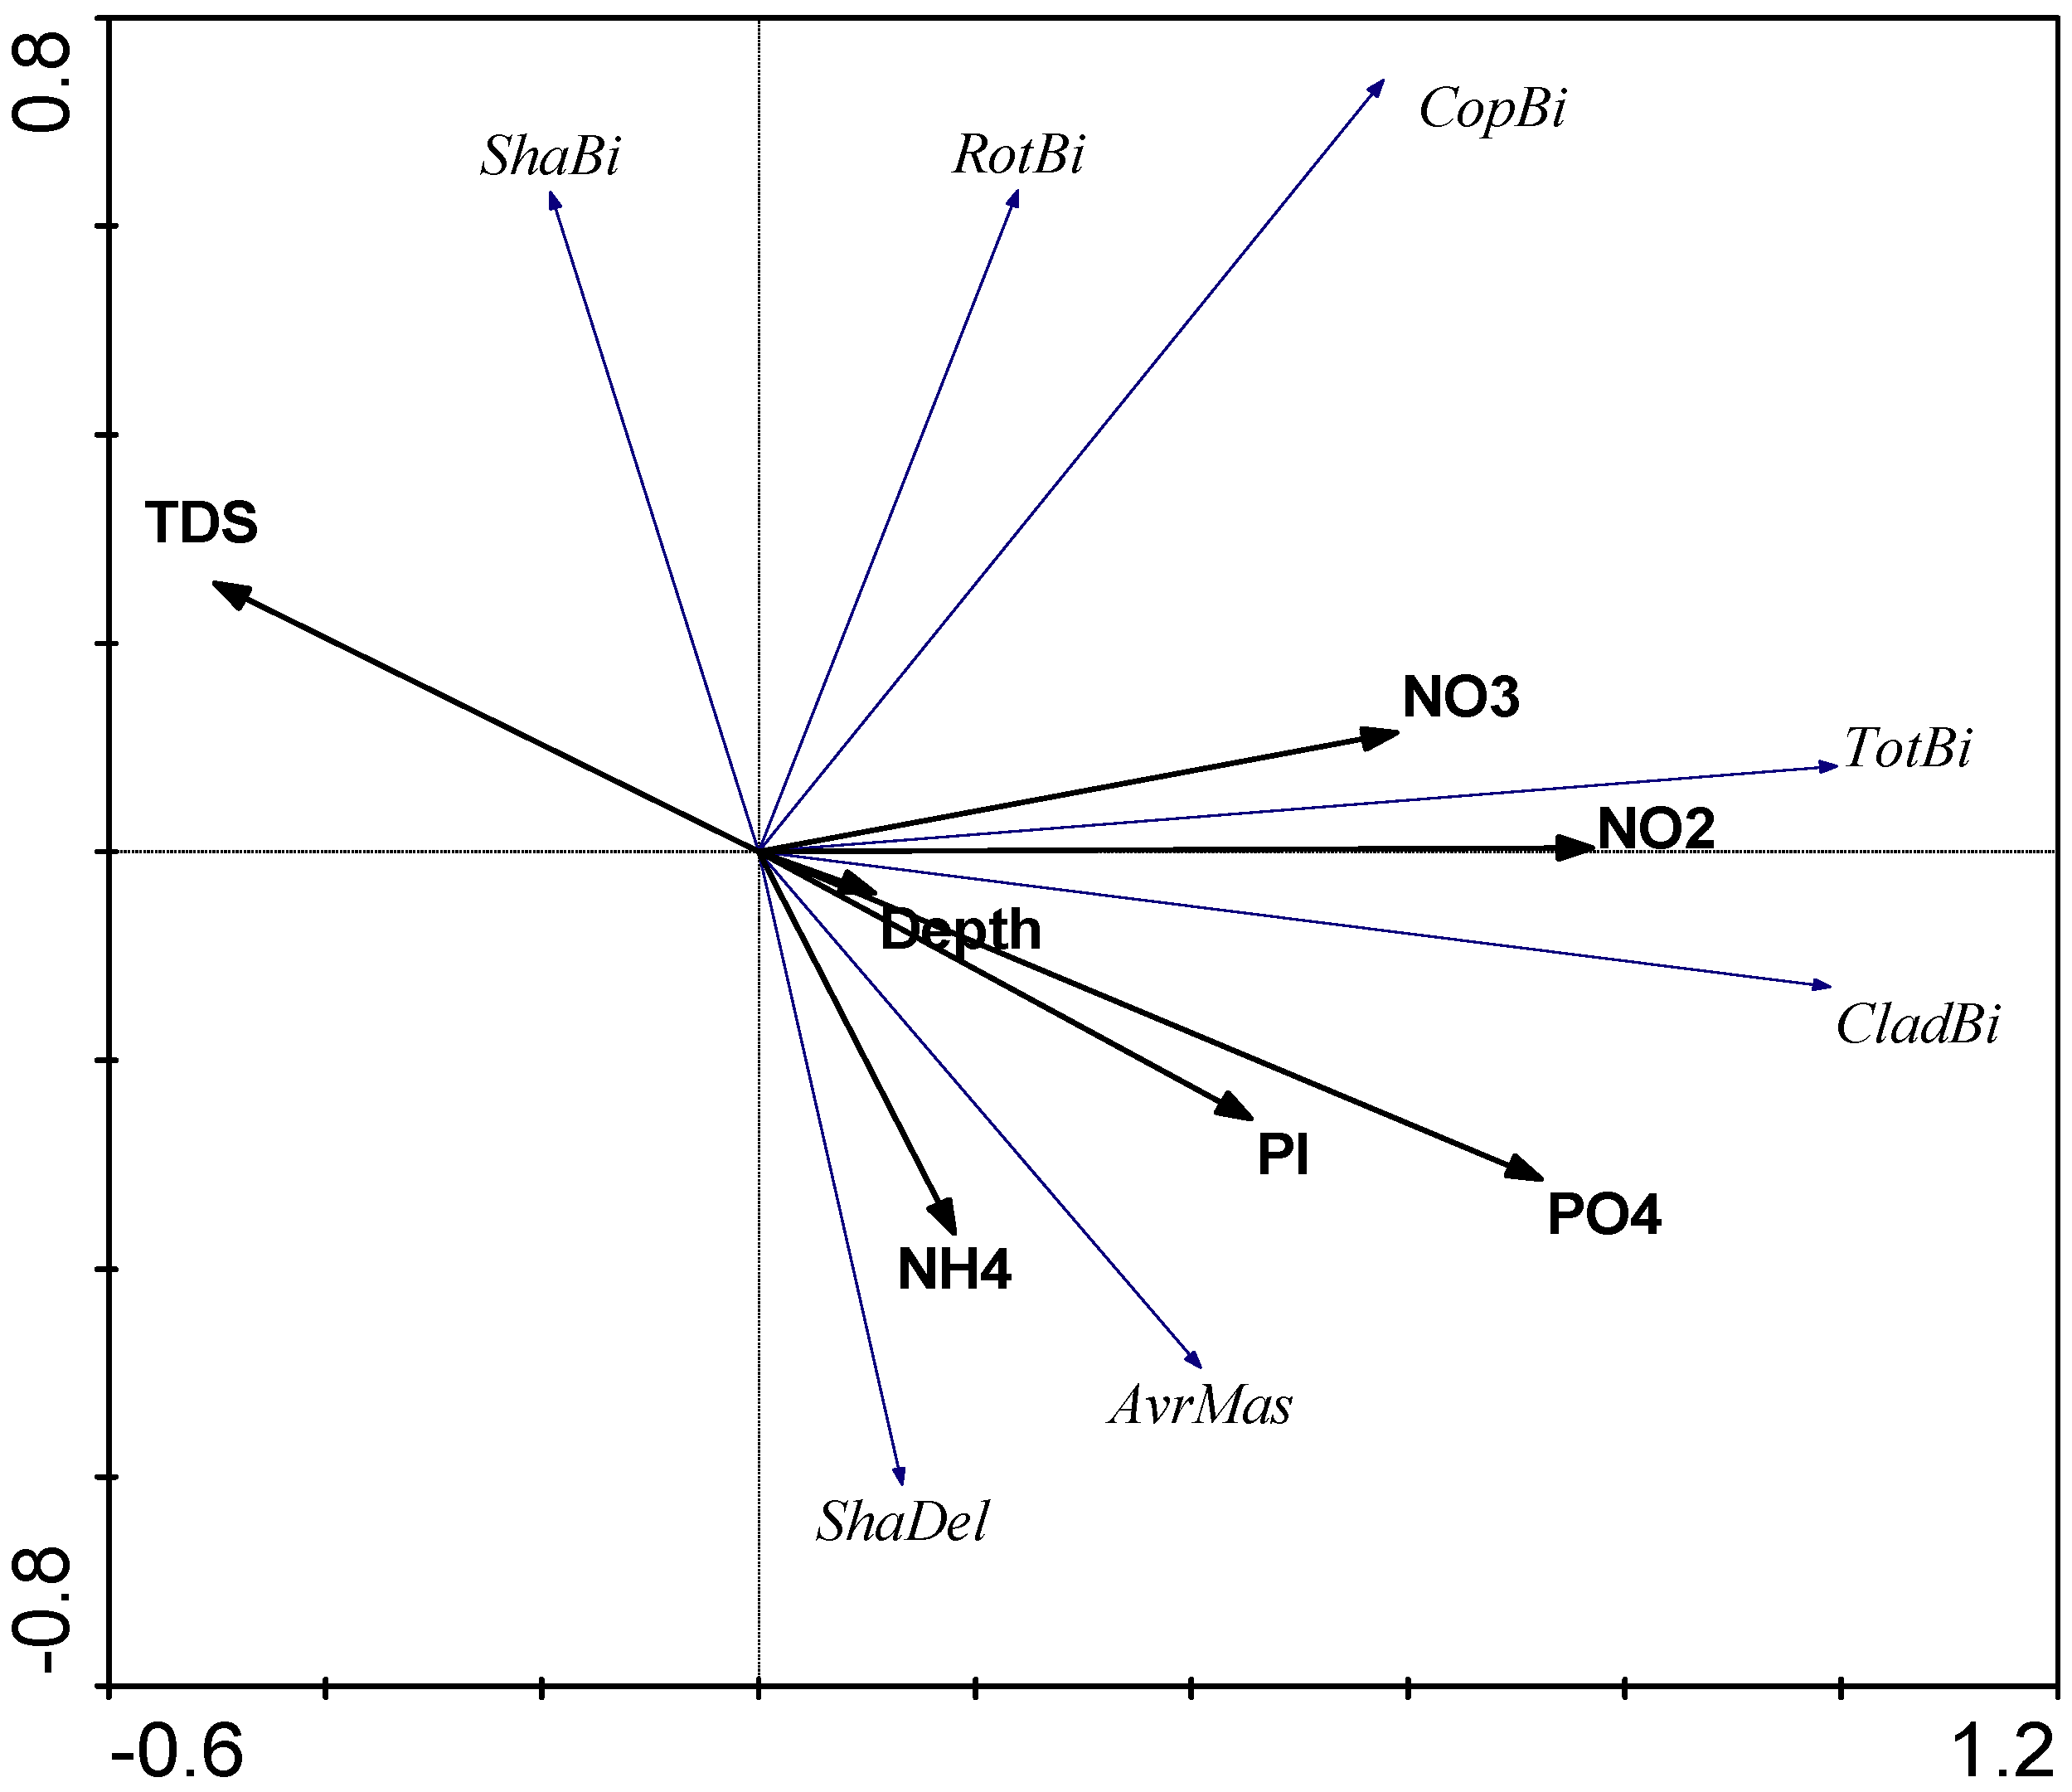
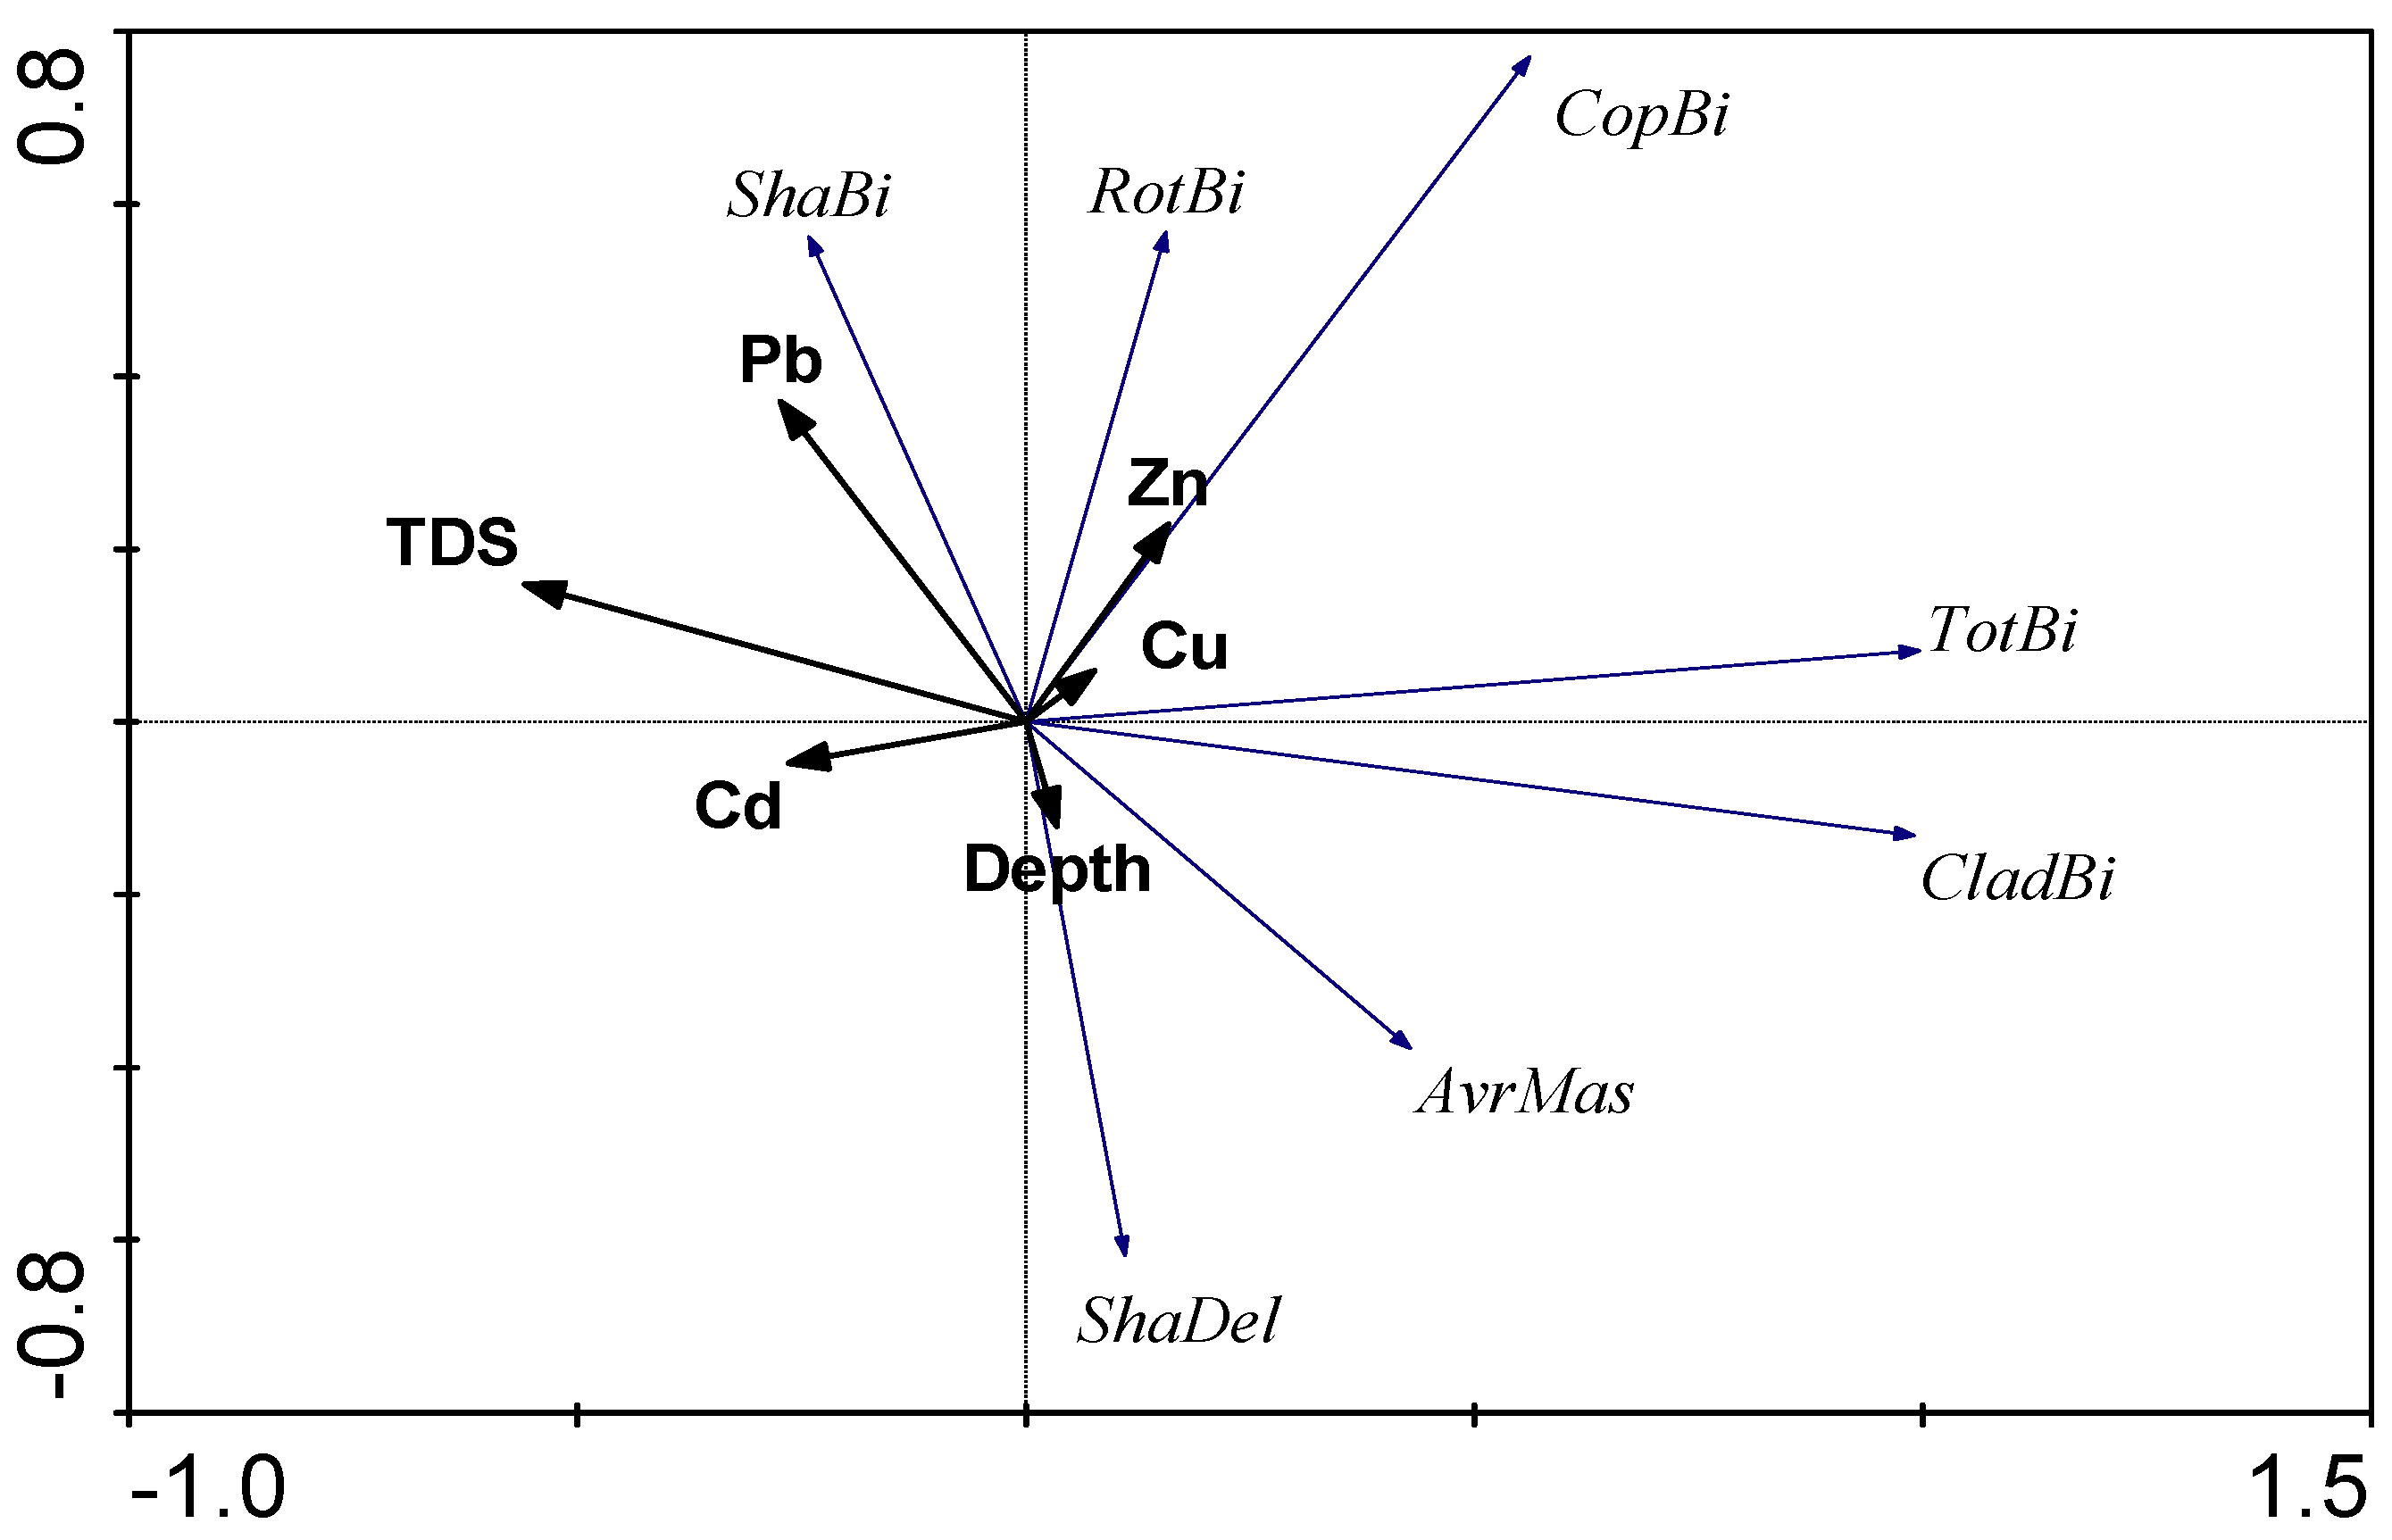
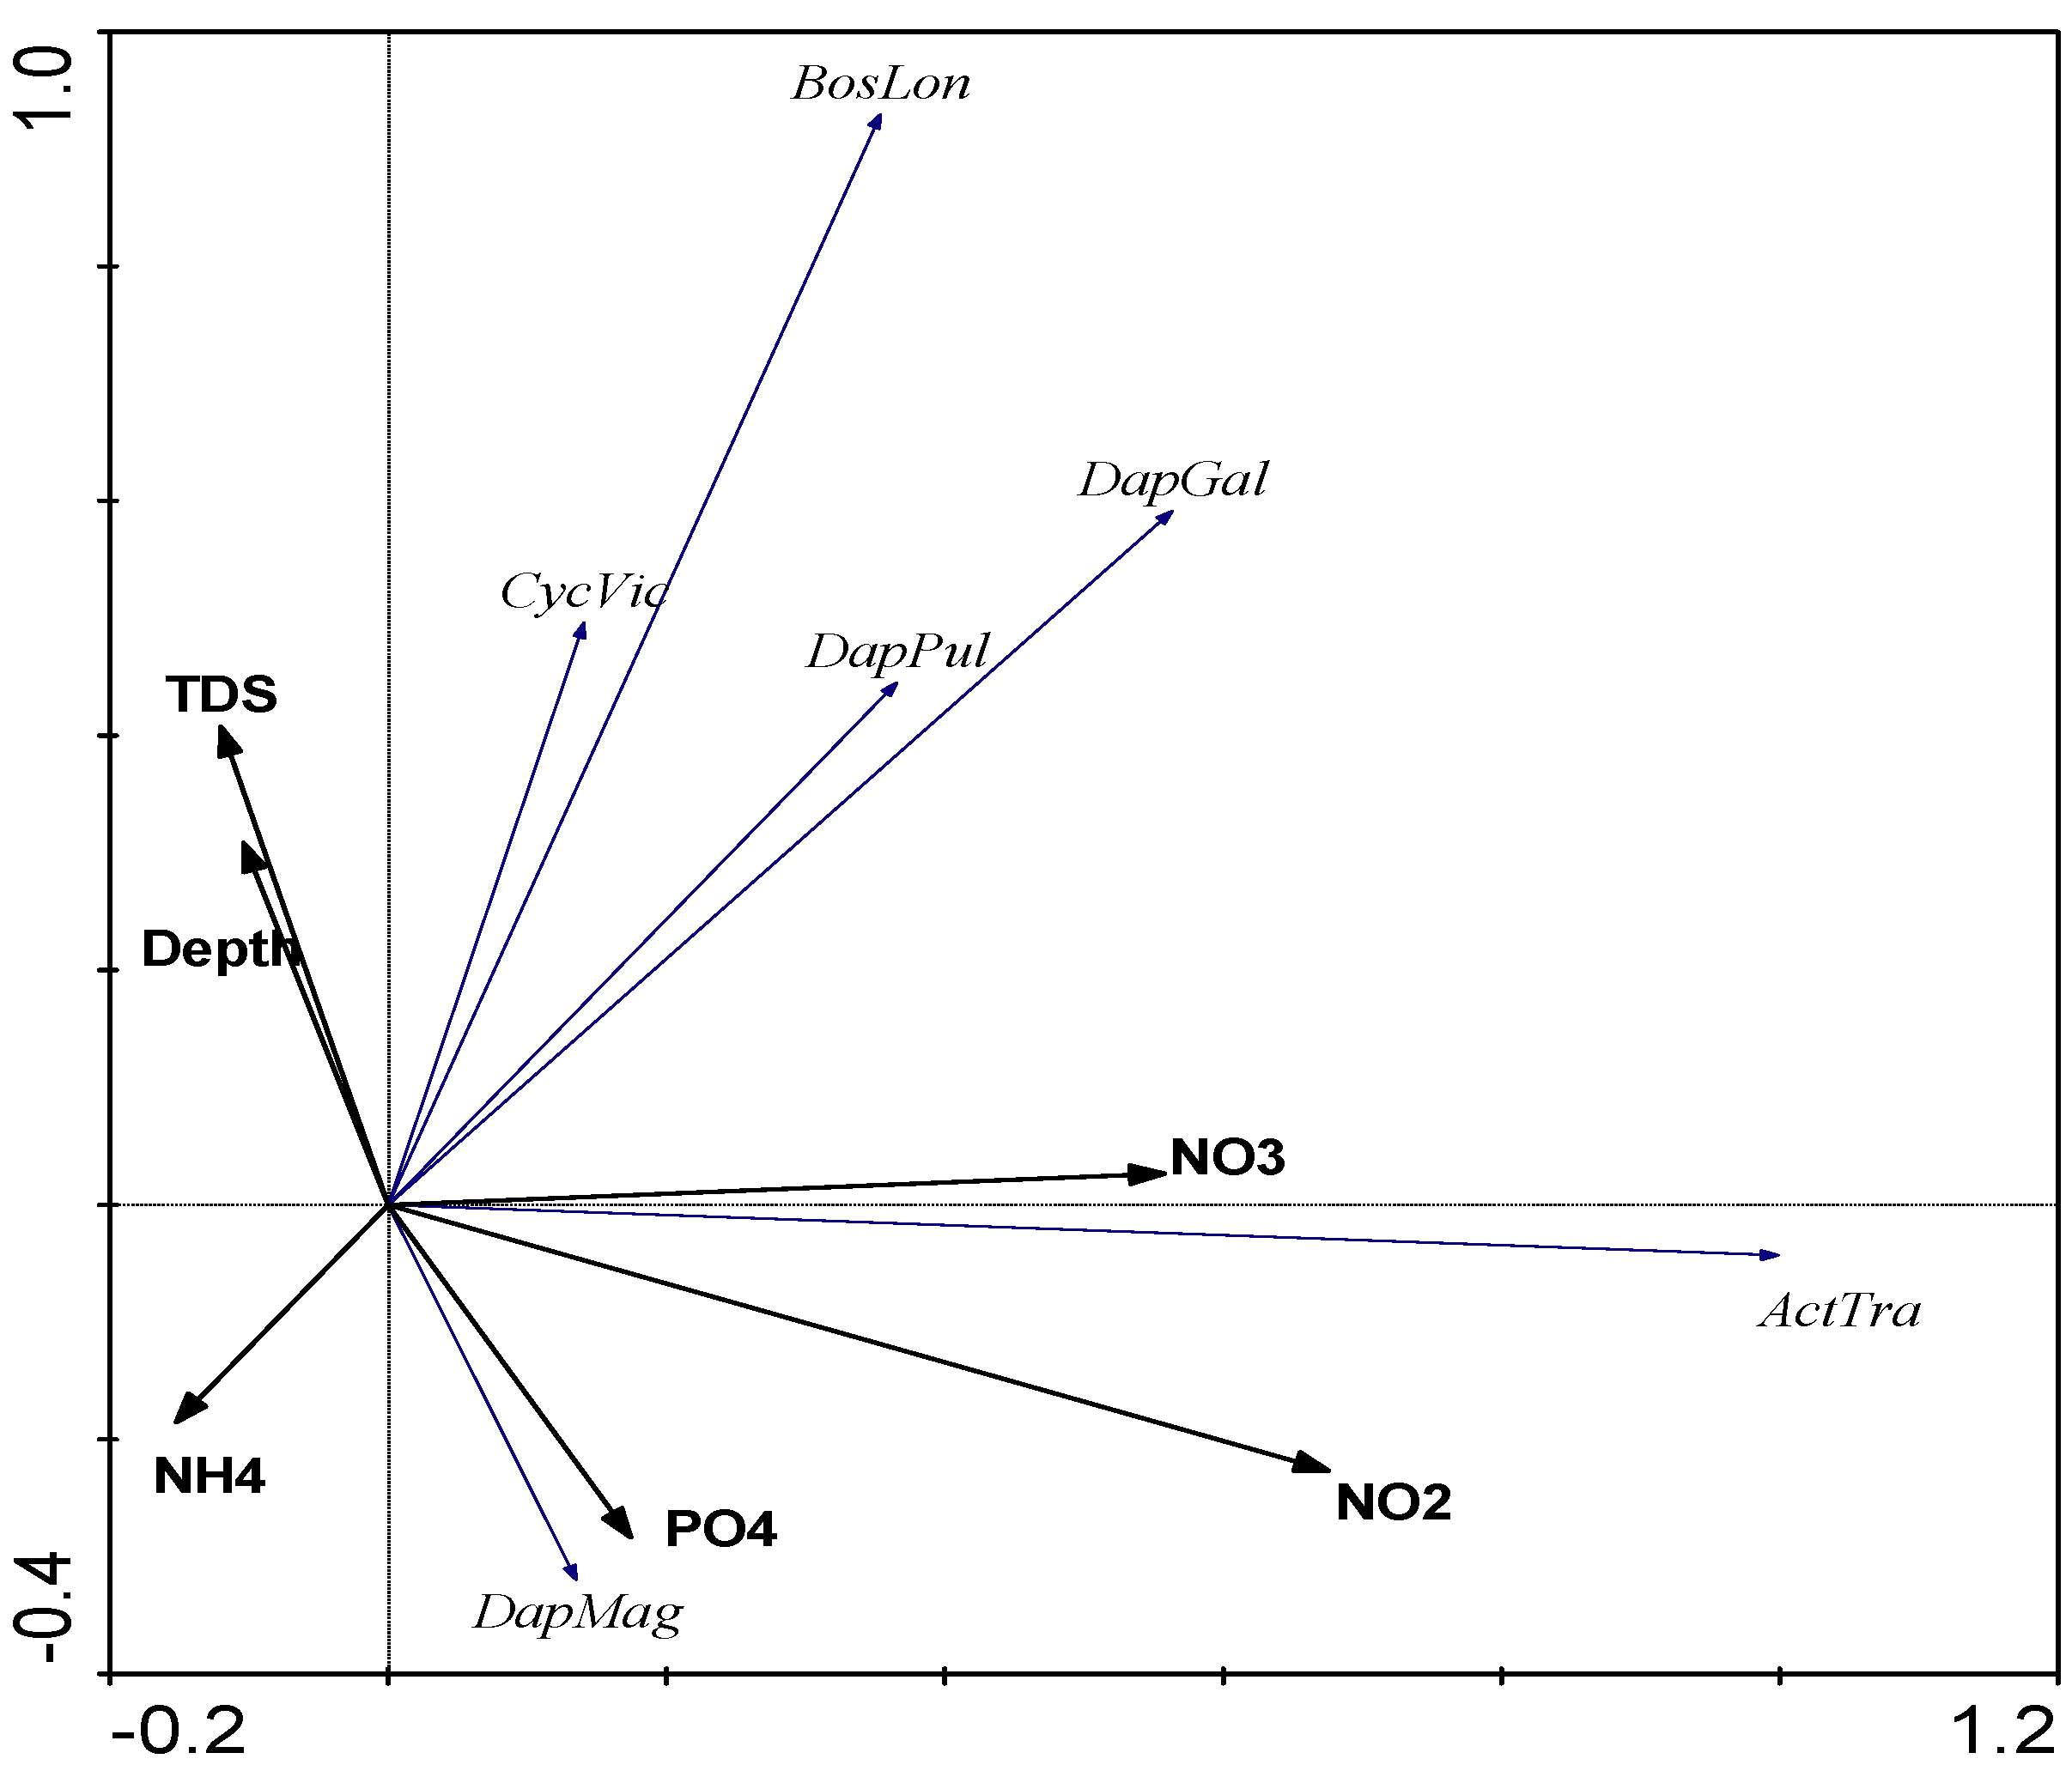
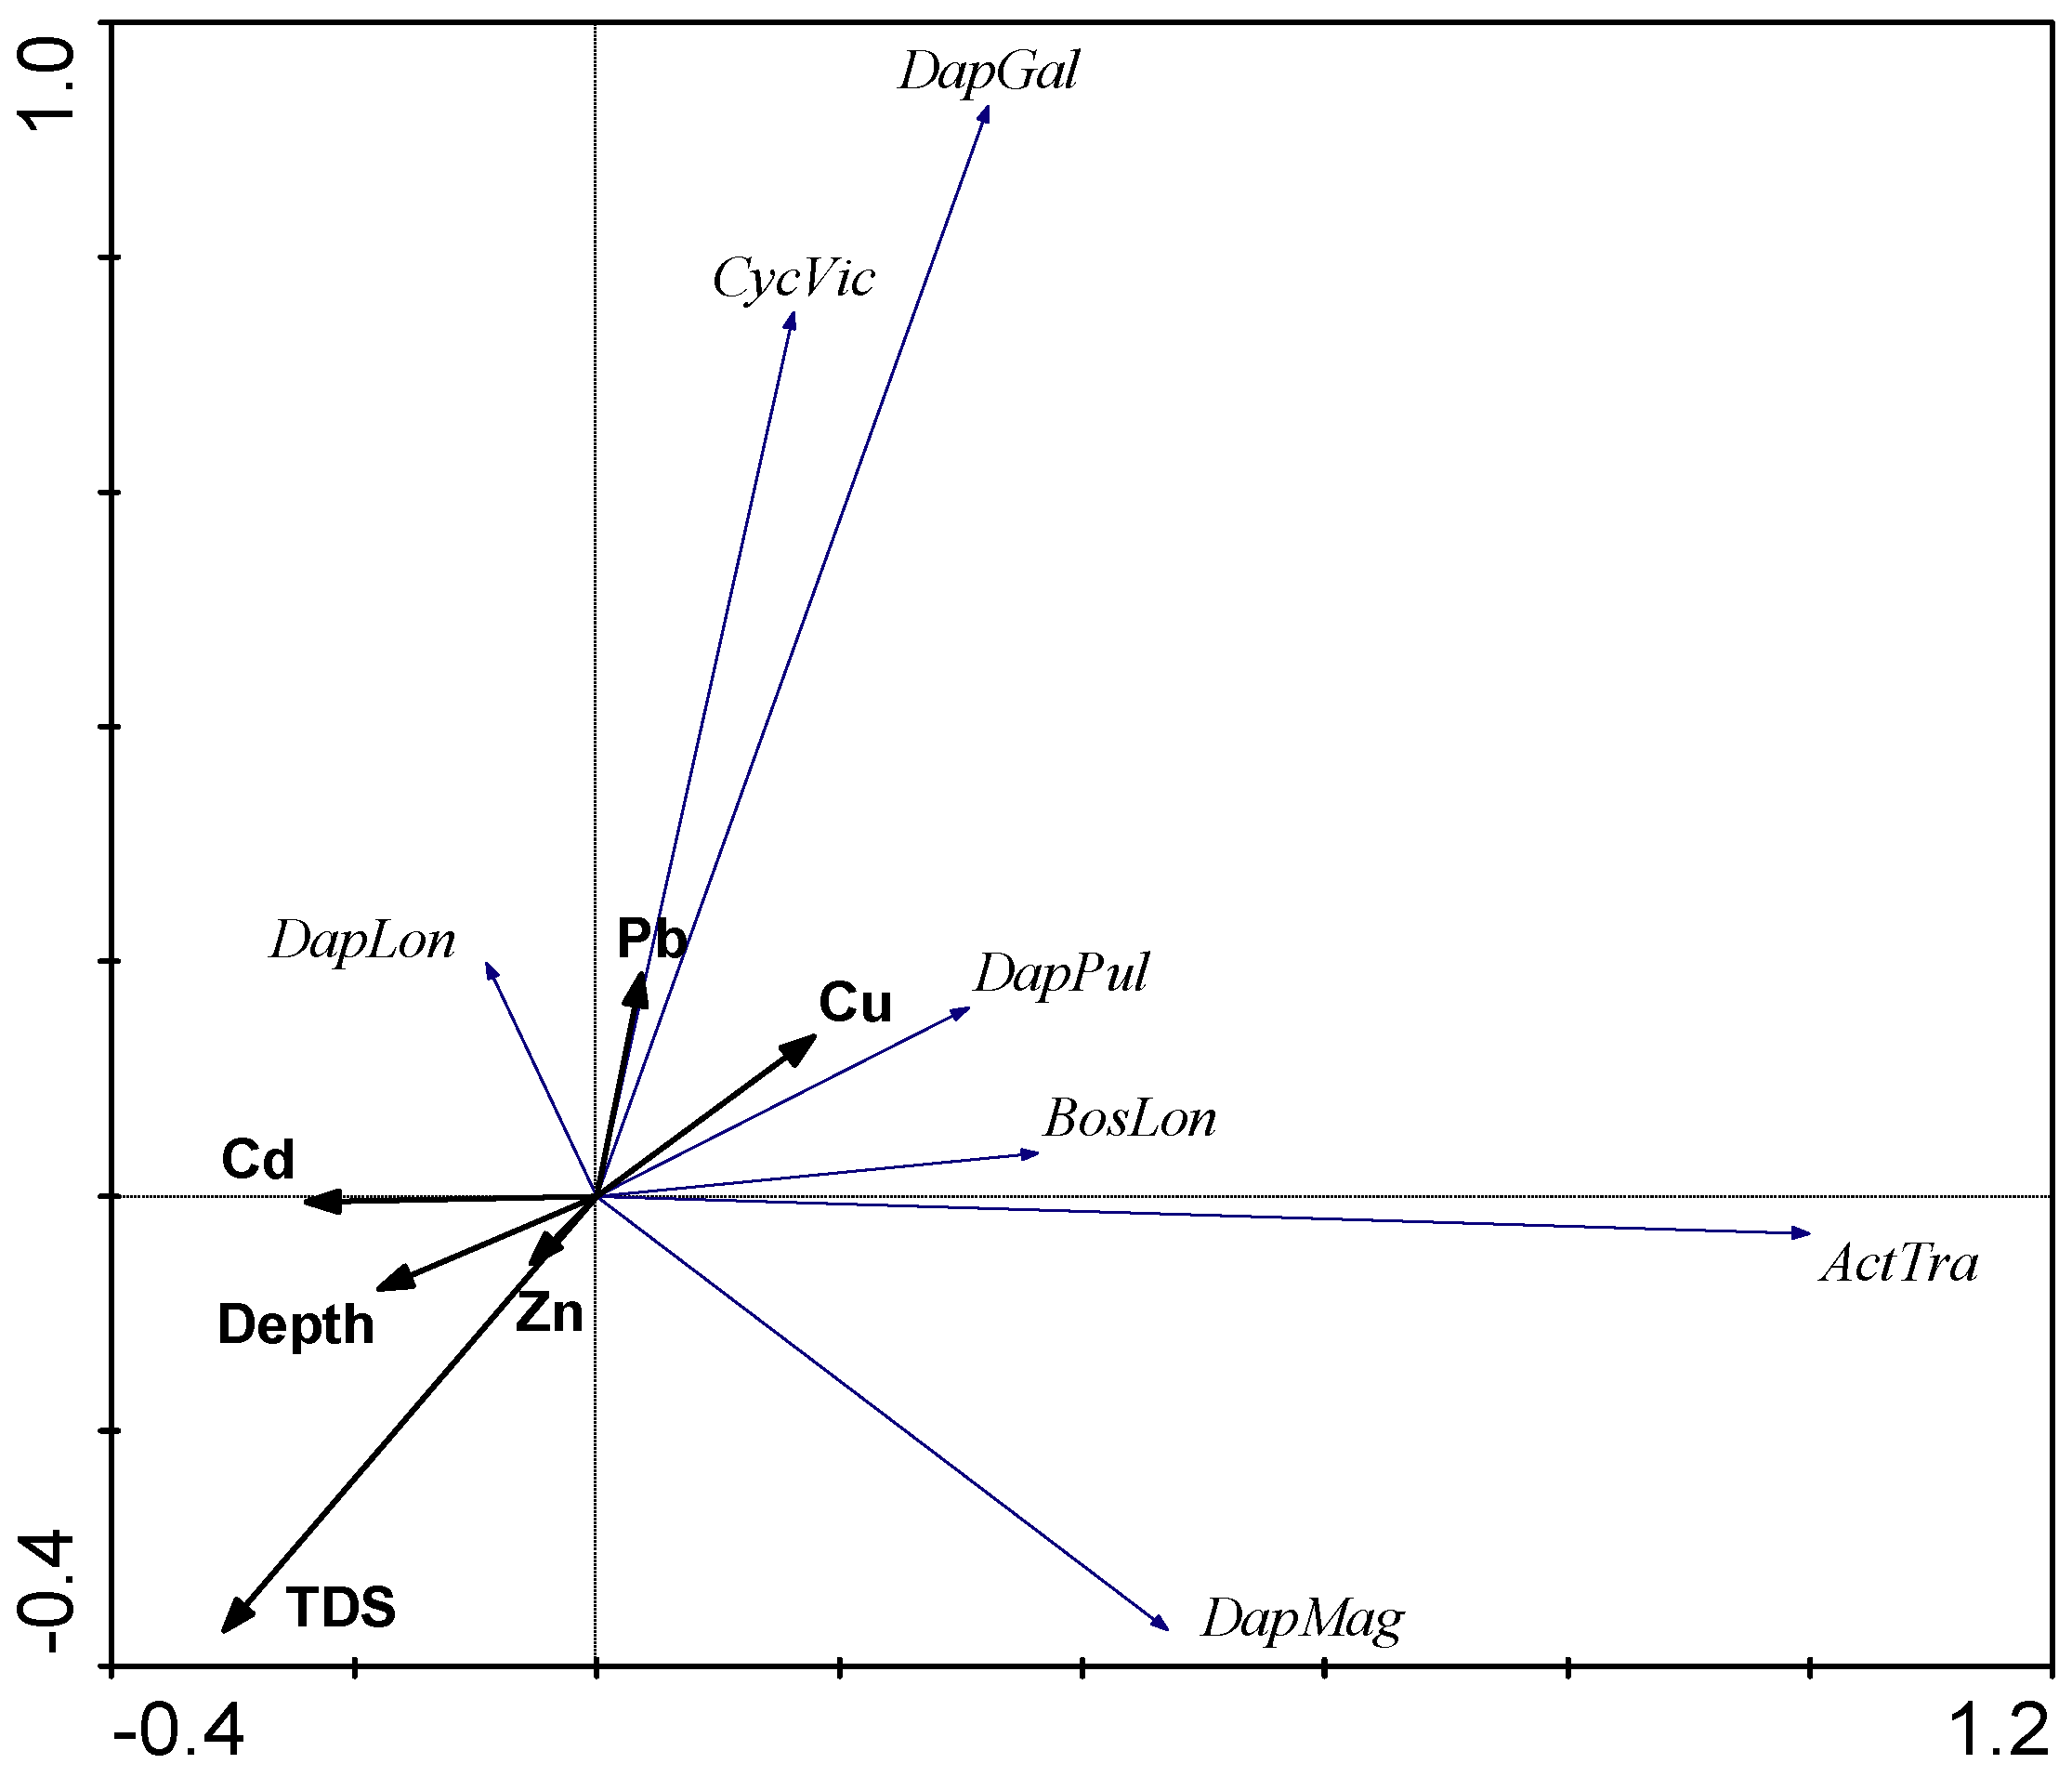
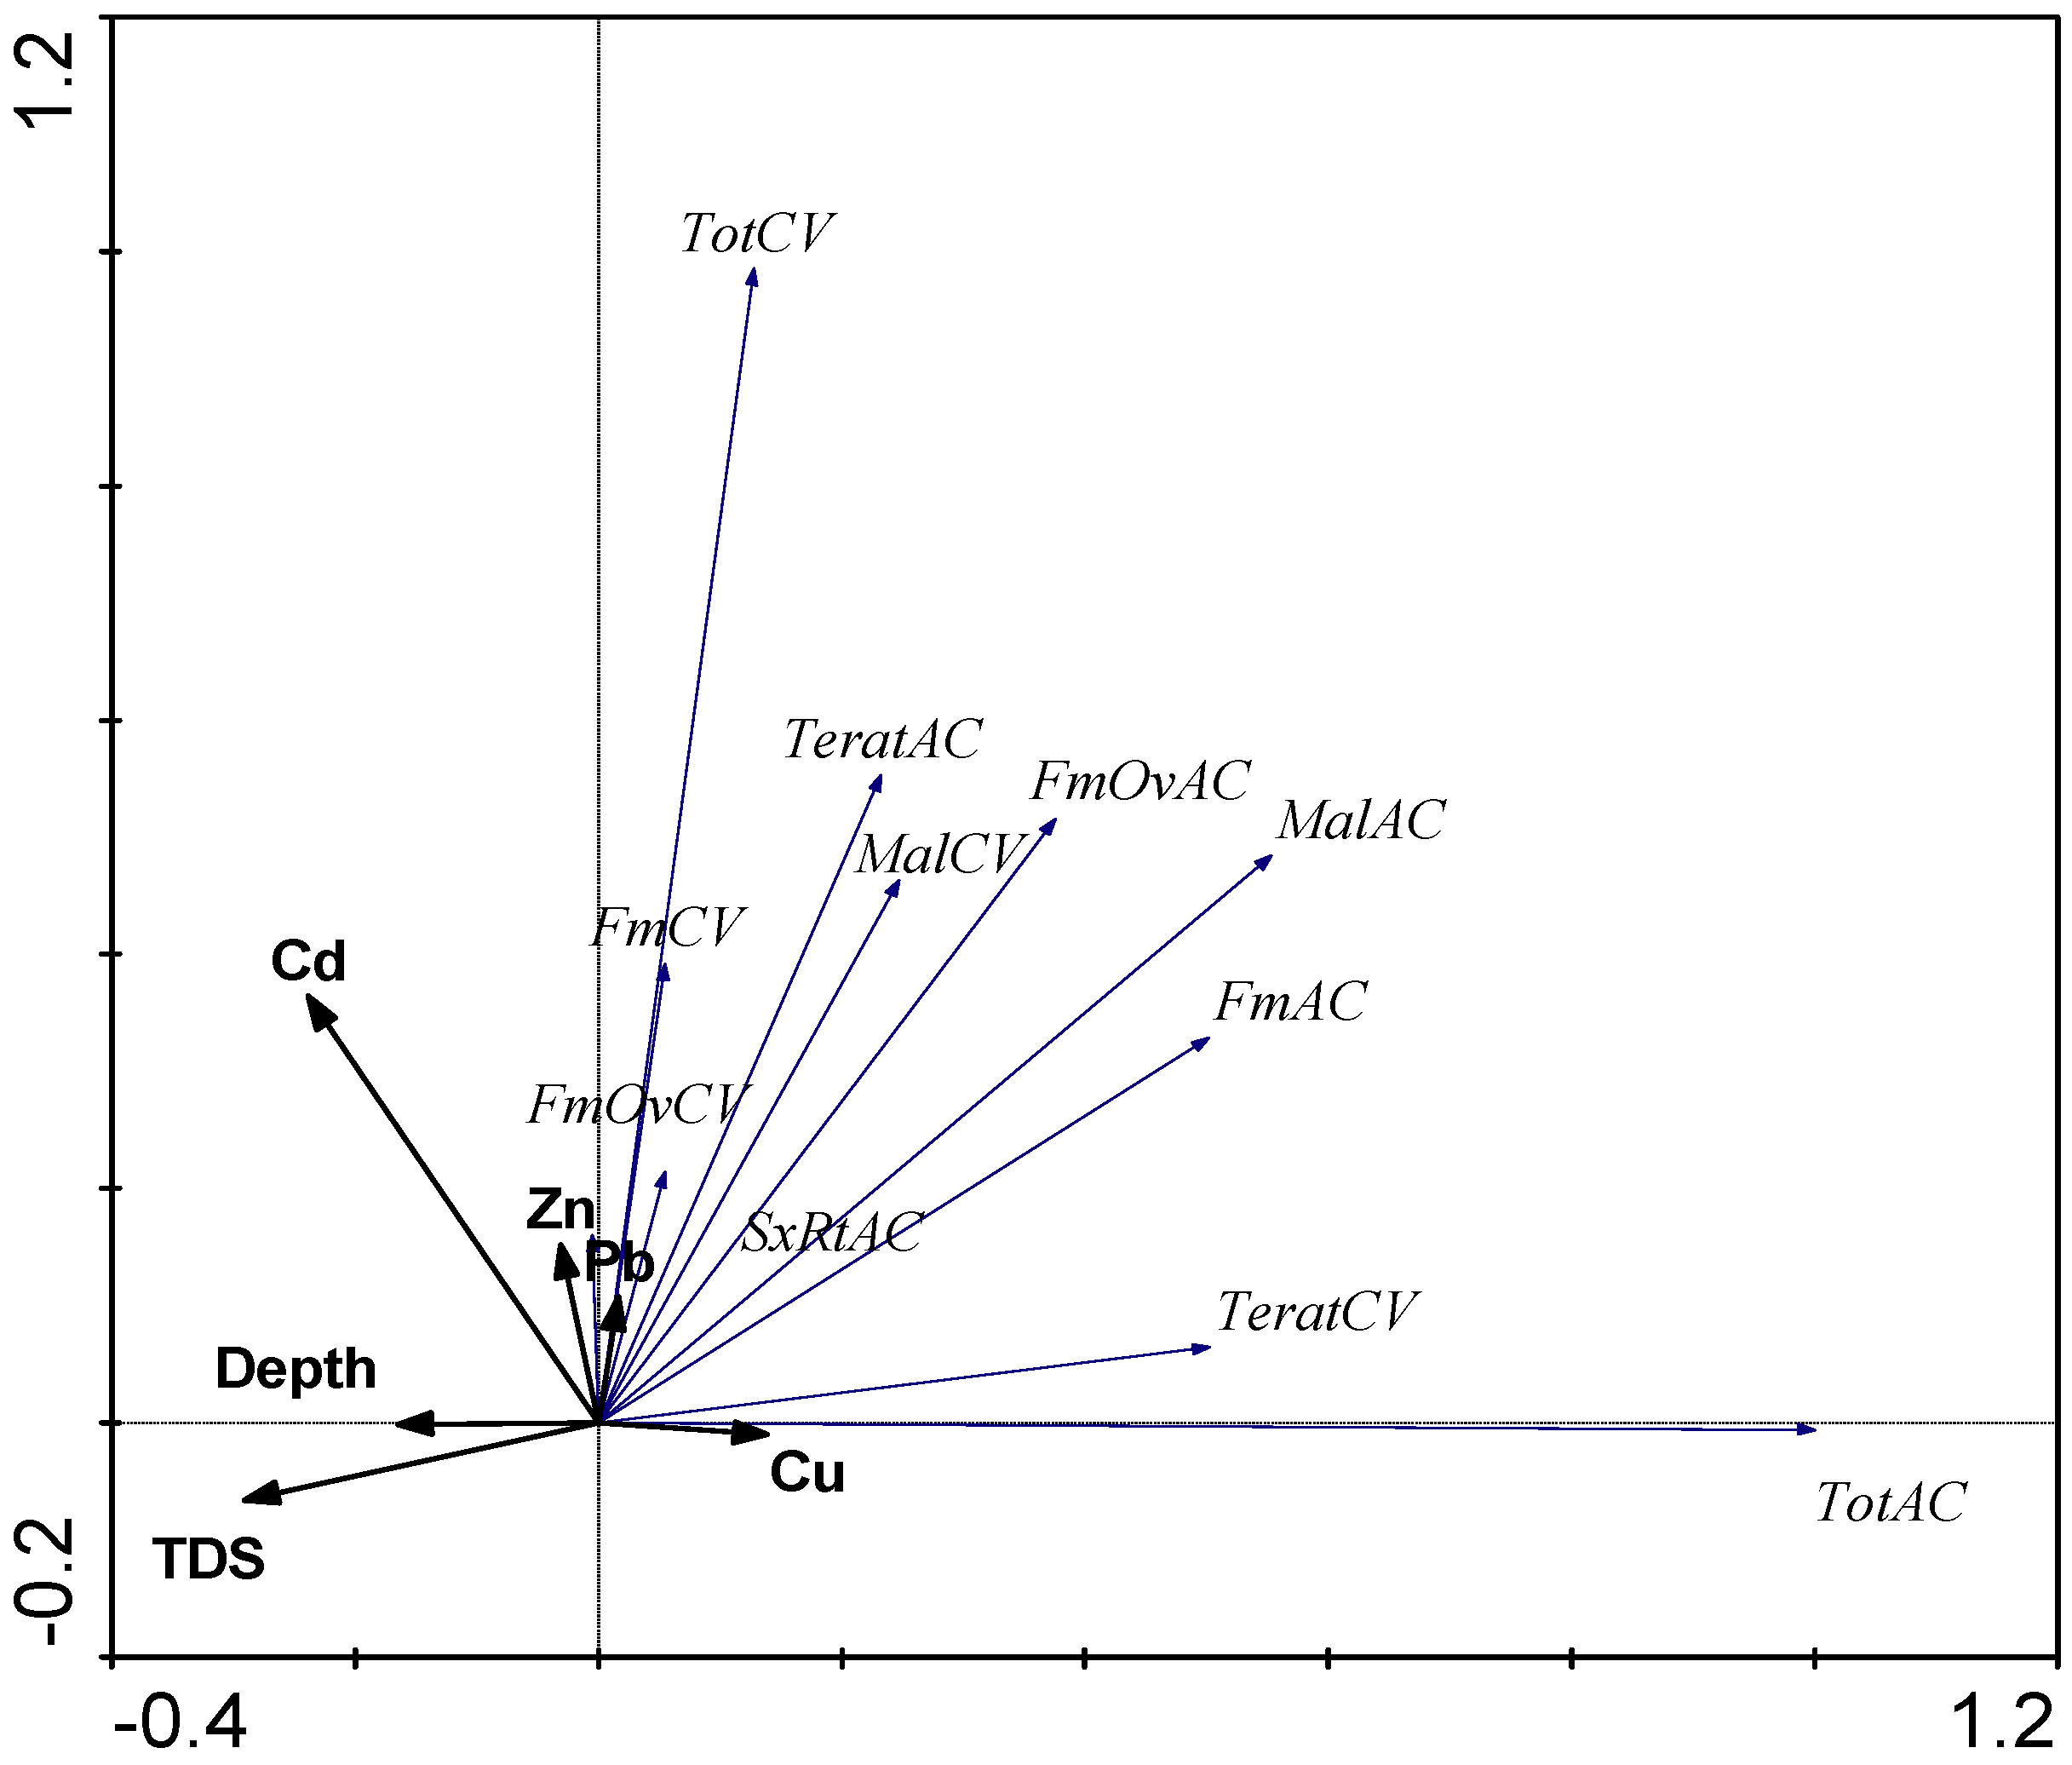
The values of Spearman’s rank correlation coefficients (rS) between environmental and biological variables are presented in Table 9. For rotifers, positive relationships were recorded with nitrite nitrogen, nitrate nitrogen, and TDS; negative relationships with copper and zinc content. For cladocerans, positive associations were revealed with the nitrite, nitrate, ammonium nitrogen, phosphates; negative relationships with TDS, manganese, cadmium, and lead content. For copepods, positive associations were established with nutrients, copper, zinc, and lead. The total quantitative variables of zooplankton showed a positive relationship with the content of nutrients and silicon; the relationship with the cadmium concentration was negative. The average mass of an individual increased with depth, as the rS values show. Positive relationships were recorded between the Δ-Shannon and Shannon Ab indices and depth, transparency, and TDS; the relationship between the Shannon Ab index and silicon was negative.

3.4. PCA Analysis

The PCA biplot (Figure 4) shows that total zooplankton biomass and Cladocera biomass were mainly associated with nitrite nitrogen, phosphates, to a lesser extent with depth, and PI; relationship with TDS was negative. The content of nitrate nitrogen partially determined Copepoda biomass. The values of the average mass of an individual and Δ-Shannon index were most closely related to ammonium nitrogen content and PI. Rotifera biomass and Shannon Bi values were negatively correlated with ammonium nitrogen, depth, and partially PI. The distribution of zooplankton abundance in the gradient of external factors was similar to the distribution of biomass.
Concerning toxic pollution (Figure 5), Copepoda and Rotifera biomass was most closely associated with copper and zinc and negatively correlated with cadmium. Cladocera biomass and the average mass of an individual in zooplankton communities were in a negative correlation with the content of lead, cadmium, and TDS. On the contrary, Shannon Bi was positively associated with lead and partially with depth.
As Figure 6 demonstrates, the abundance of Bosmina longirostris, Daphnia pulex, D. magna, D. galeata, and Cyclops vicinus were negatively associated with ammonium nitrogen. The relationship between Acanthocyclops trajani and nitrites as well as nitrates was positive, and the negative one was with depth and TDS. The abundance of D. magna was predominantly associated with phosphates and partly with ammonium nitrogen.
The PCA biplot shows (Figure 7) that the abundance of Daphnia longispina, D. galeata, and Cyclops vicinus was predominantly associated with lead; there was a negative connection between the last one and zinc. The abundance of D. pulex and Bosmina longirostris was correlated with copper. The abundance of D. magna showed a negative dependence on cadmium and lead; A.trajani—on cadmium content.
Figure 8 demonstrates that the abundance of mature individuals, individuals with morphological anomalies, and the dominance of males in the populations of A. trajani was associated with lead, and partially copper; the connection with TDS was negative. The total abundance and abundance of mature individuals in C. vicinus populations were associated with lead and zinc, but the abundance of individuals with morphological abnormalities was influenced by copper.

4. Discussion

4.1. Chemical Variables

According to chemical data, in 2017, the content of pollutants in the water of pond No. 7 was higher than in Sorbulak, but the differences in mean values were mostly insignificant. With the same composition of wastewater entering all reservoirs, some chemical parameters variability can be associated with the natural processes of self-purification of water bodies. The large volume of the water mass of Sorbulak [21] contributes to the more substantial dilution of the incoming pollutants in comparison with shallow-water ponds. The accumulation of contaminants in the bottom sediments of Sorbulak [9] leads to a decrease in their concentrations in the water column, as was observed in other large water bodies [57].
In the long-term aspect, the toxic pollution of Sorbulak varied significantly, which is generally typical for such water bodies [58]. Therefore, the content of Pb, Cd, Zn, Ni, and Co in water in 1985 did not exceed the maximum permissible level [26]. In 1997–2000, the content of heavy metals increased: Zinc up to 0.017–0.056, copper up to 0.004–0.029, lead up to 0.034–0.082, cadmium up to 0.004–0.009 mg/dm3 [59]. According to the Kruskal–Wallis test, from 2000–2002 to 2017, the content of nitrate, nitrite nitrogen, and heavy metals in Sorbulak water decreased significantly, which may be explained by socio-economic reasons. Despite the growth in Almaty and its environs, during the period under review, the volume of discharged wastewater decreased from 135.7 to 101.5 million m3 [21]. The share of industrial wastewater also decreased from 35% in 1997–1998 up to 11% in 2004, due to the closure of many industrial enterprises in Almaty. Moreover, the high abundance and biomass of phytoplankton in wastewater reservoirs (5891.7–6287.3 million cells/m3 and 4.8–5.6 g/m3) in the summer of 2017 [51] were one of the significant factors contributing to the purification of the water column of Sorbulak and ponds from heavy metals. It is known that the absorption of heavy metals by algae can be more intense than the accumulation in bottom sediments [60,61].

4.2. Biological Variables

4.2.1. Species Composition and Quantitative Variables

Zooplankton communities of the Sorbulak disposal system were characterized by relatively low species richness and high quantitative variables. This zooplankton structure is typical for water bodies with a high level of pollution [17,62,63,64,65]. Cyclopoid copepods Acanthocyclops trajani (in some periods together with Cyclops vicinus), Cladocera Bosmina longirostris, Daphnia pulex, Daphnia galeata, Daphnia magna, rotifers Hexarthra mira, Asplanchna girodi, Keratella quadrata dominated.
The eurybiontic species listed above are resistant to the influence of various external factors. A. trajani is common species in the water bodies of Kazakhstan with a high level of organic and toxic pollution [28,52,59,66,67]. Species of the genus Bosmina are resistant to industrial pollution [68]. The sensitivity of Daphnia species to heavy metals is species-specific and inversely proportional to body size [69]. D. pulex can physiologically adapt to a wide range of external conditions [70], including toxic pollution [71]. D. magna is the most tolerant of toxic effects among the species of this genus [72]. A. trajani, D. pulex, and D. magna dominated zooplankton in different periods of research, starting from the construction of Sorbulak [26], which confirms their high ecological plasticity.
In addition to toxic pollution, Cyanobacteria have a pronounced effect on the species composition of zooplankton. Filamentous cyanobacteria disrupt food collection in Daphnia by mechanically acting on the filter apparatus with long trichomes [73]. The intensity of this intervention depends on the water temperature, and body size of Daphnia. D. longispina is able better to break apart cyanobacterial trichomes when the water temperature rises. D. magna morphologically adapts to high-trophic water bodies dominated by filamentous blue-green algae, due to the thickening of the filter apparatus bristles [74]. Species of the genus Microcystis affect both the phytoplankton community itself, due to the deterioration of illumination and the zooplankton and ichthyofauna, due to the release of toxins and changes in pH [75]. The reaction of Daphnia to toxins of blue-green algae is species-specific [76]. Experimental and field studies have shown that Daphnia thrives in the presence of green algae, cryptophytes, chrysophytes, or diatoms [77,78,79].
In 2017, cyanobacteria were the absolute dominants in Sorbulak with average biomass of 4.9 g/m3 [51]. The biomass of green algae was almost fifteen times less (0.33 g/m3). In pond No. 7, in addition to blue-green algae with biomass of 4.7 g/m3, dinophytic algae were also represented with biomass of 0.55 g/m3. In pond No. 8, phytoplankton contained only cyanobacteria, with biomass of 4.8 g/m3. These differences in the composition of microalgae can be the reason for the change in the proportion of species of the genus Daphnia in the zooplankton of the surveyed water bodies. The share of D. magna in the zooplankton biomass increased from 10.6% in Sorbulak to 67.6% in pond No. 8 and 76.0% in pond No. 7. The share of D. pulex decreased from 72.7% in Sorbulak to 21.2% and 11.7% in ponds No. 8 and No. 7, respectively. It can be assumed that D. pulex is more sensitive to the influence of cyanobacteria, as its role in zooplankton decreased in ponds, where the dominance of blue-green algae was almost absolute. A significant decrease in the proportion of D. galeata in zooplankton by 2017 may be associated with the high sensitivity of this species to blue-green algae [80].
Bosmina longirostris was a part of the dominant complexes in zooplankton of Sorbulak until 2002. The decrease in this species’ role in zooplankton by 2017 is probably associated with the competition with large Daphnia magna. The maximum abundance of B. longirostris in Sorbulak was recorded in 2000–2001 when D. magna was absent. With an increase in the abundance of Daphnia by 2017, the number of B. longirostris decreased by 8.7 times. In the RBSC ponds, where D. magna was one of the dominant species in 2017, no Bosmina was found. In 1985, when D. magna dominated in zooplankton, Bosmina was also absent [26]. D. magna is able to minimize the food stress caused by the filamentous cyanobacteria by setae thickening [74]. Although B. longirostris is common species in cyanobacterial blooms [81], it is probably unable to compete with such a large cladoceran species as D. magna.

4.2.2. Structural Variables

According to the Shannon index values (1.74–2.41 bit/ind. and 1.70–2.09 bit/mg in Sorbulak and 1.19–1.26 and 1.16–1.17 in ponds), the diversity of zooplankton of the surveyed water bodies varied from low to moderate levels [17]. The Shannon index values were similar to those established for zooplankton communities in water bodies with a pronounced bloom of cyanobacteria [82].
An average individual mass of an organism is traditionally used to assess the organic pollution of aquatic ecosystems. The values of this variable (Table 8) corresponded to the level of eutrophic (Sorbulak, 2002–2002, 2017) or mesotrophic (Sorbulak, 2000; Sorbulak and ponds, 2017) water bodies [17].
Disturbances in the structure of species dominance can be additional indicators of stress factors for zooplankton. The structure of species dominance in communities can be described using Clarke’s W-statistics [83,84,85] or Δ-Shannon index [46,47,48,49,50,51,52]. In communities with large-sized species, the distribution of species by abundance is more uniform than by biomass. Accordingly, the Shannon Ab values are higher than the Shannon Bi, and Δ-Shannon is positive [46,47,48,49,50,51,52]. In disturbed communities, small species are dominated [53,83,84,85]; the Shannon Bi is higher than the Shannon Ab, and the values of Δ-Shannon are negative. Positive values of the Δ-Shannon index (Table 8) indicated the absence of pronounced stress for zooplankton communities in the surveyed wastewater water bodies. This is due to the predominance of planktonic invertebrates resistant to a wide range of organic and toxic pollution. The convergence of the biomass and abundance curves, with a value of the Δ-Shannon index of 0.03 (Table 8), was only recorded in the zooplankton of pond No. 7 in 2017. It can be associated with a very high copper content in the water in this period (Table 2).

4.2.3. The Influence of External Factors on the Quantitative Variables and Structure of Zooplankton Communities

Correlation and PCA analysis showed that the main factors of the spatiotemporal variability of the quantitative variables of zooplankton communities were the content of nutrients. This is because nutrients affect the composition and quantity of planktonic algae [86,87]; the latter, in turn, are food for planktonic invertebrates, especially Daphnia [88,89]. Copepoda was associated with copper and zinc content, which generally indicated their resistance to these metals. However, as a more toxic element [90], cadmium had a negative effect on copepods.
The response of planktonic invertebrates to toxic pollution is species-specific. Acanthocyclops trajani and Cyclops vicinus showed resistance to heavy metals. Our results confirm the literature data on the more excellent resistance of cyclopoid copepods to heavy metals compared to Daphnia [91]. In experiments on the assessment of chronic toxicity [92], cadmium suppressed the development of the cladocera Moina monogolica Daday at a concentration of 0.003 mg/dm3. In the period up to 2002, the cadmium content in Sorbulak was higher than the given value. However, cadmium, like lead, did not adversely affect Daphnia longispina, Daphnia pulex, and Daphnia galeata. The absence of a pronounced toxic effect of heavy metals on cladocerans in the wastewater reservoirs of the RBSC can be explained by various reasons, including the multidirectional interaction of pollutants with each other [12], the protective effect of the chemical composition of water [93] and food availability [94].
The influence of external factors on the sex structure of planktonic invertebrates is poorly studied. Typically, females are slightly more numerous than males in populations of cyclopoid copepods [95,96,97]. This is explained by the fact that one male can fertilize several females, and there is no need for an equal sex ratio [39,98]. Deviations from the normal sex ratio in crustacean populations are induced by stress factors, including changes in water temperature, TDS, and pH [99,100,101]. We have found that males’ dominance in populations of cyclopoid copepods reaches an extremely high level (from 3–5 to 50 males per female) under conditions of intense organic and toxic pollution of the environment [28,59,66,67,86,102]. Considering the reference data, the recorded dominance of males in the Acanthocylops trajani population indicated the presence of stress factors for this species during all periods of the study of the wastewater reservoirs. According to the PCA biplot, disturbances in the sex structure in the A. trajani populations were predominantly associated with heavy metals concentrations. According to sex theory [100], it can be considered an adaptive response of A. trajani to stressful environmental conditions.
Individuals with morphological anomalies were recorded continuously in Acanthocylops trajani and Cyclops vicinus populations from Sorbulak and ponds in 2000–2002 (Figure 3) and 1998 [62]. They were completely absent in the summer of 2017. According to the PCA biplot, the appearance of individuals with morphological abnormalities in the cyclopoid populations was associated with copper or lead. Copper is highly toxic to most living organisms [12,103,104]. For cyclopoid copepods, copper is more harmful than zinc, chromium, and nickel [105].

4.2.4. Indicator Role of Zooplankton in Assessing the Water Quality of Water Bodies with Multicomponent Pollution

Abundance, biomass, diversity indices, and size structure of zooplankton are traditionally used to evaluate organic pollution of water bodies [17]. A positive relationship between the quantitative variables of zooplankton communities and nutrients was also recorded in our studies. Heavy metals or other toxicants contained in wastewater partially neutralize the stimulating effect of nutrients on primary producers [106], and as a consequence, on planktonic invertebrates. The ratio of taxonomic groups, for example, cladocerans and copepods, can be used to assess the ecological state of water bodies with mixed pollution. We established a positive relationship between cyclopoid copepods and the content of heavy metals in water bodies of the Sorbulak system. The relationship between cladocerans and heavy metals was negative. Thus, the dominance of cyclops, which are the most resistant to toxicants [91], is one indicator of stress for zooplankton communities.
We can also use the structure of species dominance, the sex structure of copepod populations, and the presence of individuals with morphological anomalies to monitor water bodies with mixed pollution. We have previously shown that the structure of species dominance is a more sensitive indicator compared to the species composition [46,107]. This is because external factors first cause intrapopulation rearrangements (for example, changes in the ratio of age stages in crustacean populations and the size of adults). Then the percentage of species in the quantitative variables of communities changes, i.e., the structure of their dominance. The species composition changes when the gradient of external factors goes beyond a particular species tolerance limits.
The composition of species dominating in the zooplankton of the surveyed water bodies has been relatively constant, since the formation of Sorbulak. The positive values of the Δ-Shannon index in the zooplankton of the studied water bodies were due to the dominance of species resistant to multicomponent pollution.
The cyclopoid copepods with morphological anomalies were presented in Sorbulak in 2000–2002, and they were absent in 2017. A revealed association between these individuals and heavy metals can indicate the toxic pollution of water bodies investigated, as was shown earlier [67,86,105,106]. These results corresponded to the chemical analysis data on the decrease in the level of toxic pollution of wastewater reservoirs of the Right-Bank Sorbulak Canal in 2017 and demonstrated the interannual increase of water quality in it.
Thus, the comprehensive studies carried out allow us to conclude that the level of toxic pollution of the Sorbulak wastewater disposal system has decreased over the past fifteen years. In 2017, Sorbulak and ponds were mainly characterized by organic pollution. Sorbulak water can be used for irrigation as previously planned. Given the significant variability of all parameters, constant monitoring of the Sorbulak wastewater disposal system is required.

5. Conclusions

Our results demonstrated that zooplankton communities of water bodies with multicomponent pollution consist of a small number of eurybiontic species. The variability of the quantitative variables of zooplankton is associated with nutrients, and as a consequence, algal communities. In particular, Cyanobacteria can affect the species composition of cladocerans. The most resistant species to cyanobacterial bloom is, obviously, Daphnia magna. It can be assumed that the ratio of species of the genus Daphnia may be an indicator of cyanobacterial bloom impact, although additional studies are required for the conclusion. The dominance of cyclopoid copepods as the most resistant to a wide range of external factors is one of the indicators of stress for zooplankton, and in particular, the indicator of toxic pollution. Moreover, the dominance of males and the appearance of individuals with morphological anomalies in copepod populations is an indicator of chronic stress associated, among other things, with toxic environmental pollution. Hence, our results demonstrate that the zooplankton structure can be successfully applied to assess the water quality of reservoirs with mixed pollution. We recommend using not only the traditional set of biological variables (abundance, biomass, diversity indices, and the average mass of an individual), but also data on the structure of species dominance, the sex structure of copepod populations, and the presence of individuals with morphological anomalies.

Author Contributions

Conceptualization, methodology, writing, editing, E.K.; investigation, E.K., S.R., M.A.; N.A.; data curation, software, S.B.; formal analysis, S.B. All authors have read and agreed to the published version of the manuscript.

Funding

This research was funded by the Committee of Science, Ministry of Education and Science, Republic of Kazakhstan, grant number No. AP08855655.

Acknowledgments

The work was carried out under project No. AP08855655, Institute of Zoology, the Committee of Science, Ministry of Education and Science, Republic of Kazakhstan “Assessment of the ecological state of wastewater reservoirs of the system of the Right-Bank Sorbulak Canal for the development of the scientific basis for wastewater disposal.”

Conflicts of Interest

The authors declare no conflict of interest.

References

  1. Drechsel, P.; Evans, A.E.V. Wastewater use in irrigated agriculture. Irrig. Drainage Syst. 2010, 24, 1–3. [Google Scholar] [CrossRef]
  2. Alfarra, A.; Kemp-Benedict, E.; Hötzl, H.; Sader, N.; Sonneveld, B. A Framework for Wastewater Reuse in Jordan: Utilizing a Modified Wastewater Reuse Index. Water Resour. Manag. 2011, 25, 1153–1167. [Google Scholar] [CrossRef] [Green Version]
  3. Nan, Z.; Cheng, G. Accumulation of Cd and Pb in spring wheat (Triticum aestivum L.) grown in calcareous soil irrigated with wastewater. Bull. Environ. Contam. Toxicol. 2001, 66, 748–754. [Google Scholar] [CrossRef] [PubMed]
  4. Sharma, A.; Katnoria, J.K.; Nagpal, A.K. Heavy metals in vegetables: Screening health risks involved in cultivation along wastewater drain and irrigating with wastewater. SpringerPlus 2016, 5, 1–16. [Google Scholar] [CrossRef] [Green Version]
  5. Kaboosi, K. The assessment of treated wastewater quality and the effects of mid-term irrigation on soil physical and chemical properties (case study: Bandargaz-treated wastewater). Appl. Water Sci. 2017, 7, 2385–2396. [Google Scholar] [CrossRef] [Green Version]
  6. Kitajima, M.; Rachmadi, A.T.; Iker, B.C.; Haramoto, E.; Pepper, I.L.; Gerba, C.P. Occurrence and genetic diversity of human cosavirus in influent and effluent of wastewater treatment plants in Arizona. Arch. Virol. 2015, 160, 1775–1779. [Google Scholar] [CrossRef] [Green Version]
  7. Kocak, E. Investigation of potential genotoxic activity using the SOS Chromotest for real paracetamol wastewater and the wastewater treated by the Fenton process. J. Environ. Health Sci. Eng. 2015, 13, 66. [Google Scholar] [CrossRef] [Green Version]
  8. Matmuratov, S.A.; Bragin, B.I.; Stuge, T.S.; Troshina, T.T.; Akberdina, G.Z.; Krupa, E.G. To the assessment of the ecological situation in the area of the discharges of the Right-Bank Sorbulak Canal in the Ili River. In Geographic Foundations of Sustainable Development of the Republic of Kazakhstan; Kaganat: Almaty, Kazakhstan, 1998; pp. 281–286. (In Russian) [Google Scholar]
  9. Krupa, E.G.; Amirgaliev, N.A.; Shapovalov, V. Characteristics of the hydrocenosis of the Sorbulak storage pond in terms of toxicological and biological indicators. In Modern Problems of Aquatic Toxicology; Printhous: Borok, Russia, 2002; pp. 166–167. (In Russian) [Google Scholar]
  10. Berenzen, N.; Hűmmer, S.; Liess, M.; Schulz, R. Pesticide Peak Discharge from Wastewater Treatment Plants into Streams During the Main Period of Insecticide Application: Ecotoxicological Evaluation in Comparison to Run off. Bull. Environ. Contam. Toxicol. 2003, 70, 891–897. [Google Scholar] [CrossRef]
  11. Ibraev, T.T.; Lee, M.A. Some aspects of the influence of anthropogenic factors on the water resources of Kazakhstan. Water Manag. Kazakhstan 2010, 2, 20. (In Russian) [Google Scholar]
  12. Moore, J.W.; Ramamoorthy, S. Heavy Metals in Natural Waters Applied Monitoring and Impact Assessment; Springer: New York, NY, USA, 1984; p. 268. [Google Scholar]
  13. EC. The Directive 2000/60/EP of the European Parliament and of the Council establishing a framework for community action in the field of water policy. Off. J. Eur. Commun. 2000, L327. Available online: https://www.eea.europa.eu/policy-documents/directive-2000-60-ec-of (accessed on 22 December 2000).
  14. Papaioannou, A.; Mavridou, A.; Hadjichristodoulou, C.; Papastergiou, P.; Pappa, O.; Dovriki, E.; Rigas, I. Application of multivariate statistical methods for groundwater physicochemical and biological quality assessment in the context of public health. Environ. Monit. Assess. 2010, 170, 87–97. [Google Scholar] [CrossRef]
  15. Seitkaziev, A.S.; Seitkazieva, K.A. Criteria for assessing the quality of aquatic ecosystems in the Republic of Kazakhstan. In Bulletin of the Kazakh-German University; Special issue “Water Resources of Kazakhstan: Current State, Problems, and Ways of Their Solution”; Kazakh-German University: Almaty, Kazakhstan, 2014; Volume 2, pp. 94–101. [Google Scholar]
  16. Ochocka, A.; Pasztaleniec, A. Sensitivity of plankton indices to lake trophic conditions. Environ. Monit. Assess. 2016, 188, 622. [Google Scholar] [CrossRef] [Green Version]
  17. Andronikova, I.N. Structural and Functional Organization of Zooplankton of Lake Ecosystems of Various Trophic Types; Nauka: St. Petersburg, Russia, 1996; p. 189. (In Russian) [Google Scholar]
  18. Alvarado-Flores, J.; Rico-Martı´nez, R.; Adabache-Ortı´z, A.; Silva-Briano, M. Morphological alterations in the freshwater rotifer Brachionus calyciflorus Pallas 1766 (Rotifera: Monogononta) caused by vinclozolin chronic exposure. Ecotoxicology 2015, 24, 915–925. [Google Scholar] [CrossRef] [PubMed]
  19. Dembowska, E.A.; Mieszczankin, T.; Napiórkowski, P. Changes of the phytoplankton community as symptoms of deterioration of water quality in a shallow lake. Environ. Monit. Assess. 2018, 190, 95. [Google Scholar] [CrossRef] [PubMed] [Green Version]
  20. Svensson, O.; Bellamy, A.S.; Van den Brink, P.J.; Tedengren, M.; Gunnarsson, J.S. Assessing the ecological impact of banana farms on water quality using aquatic macroinvertebrate community composition. Environ. Sci. Pollut. Res. 2018, 25, 13373–13381. [Google Scholar] [CrossRef]
  21. Dostay, Z.D.; Tyumenev, S.D. Management of Water Supply and Sewerage of the City of Almaty; Euro Print: Almaty, Kazakhstan, 2009; p. 176. (In Russian) [Google Scholar]
  22. Bekkazinova, D.B.; Aleksanova, A.G. The content of heavy metals (Cd, Zn, Co, Ni, Cu) in the wastewater of the city of Almaty. Bull. Kazakh Natl. Med Univ. 2010, 2, 168–171. (In Russian) [Google Scholar]
  23. Tyumenev, S.D. Water Resources and Water Supply of the Territory of Kazakhstan; KazNTU: Almaty, Kazakhstan, 2008; p. 267. (In Russian) [Google Scholar]
  24. Timush, A.V. Seismotectonics of Kazakhstan lithosphere; Institute of Seismology: Almaty, Kazakhstan, 2011; p. 590. (In Russian) [Google Scholar]
  25. Krupa, E.; Slyvinskiy, G.; Barinova, S. The effect of climatic factors on the long-term dynamics of aquatic ecosystem of the Balkhash Lake (Kazakhstan, Central Asia). Adv. Stud. Biol. 2014, 6, 115–136. [Google Scholar] [CrossRef]
  26. Kiseleva, V.A. Seasonal dynamics of hydrocenoses of Lake M. Sorbulak (Almaty region) as a probable cause of summer-autumn migration of migratory birds. Selevinia 2014, 1–4, 137–143. (In Russian) [Google Scholar]
  27. Matmuratov, S.A.; Bragin, B.I.; Troshina, T.T.; Krupa, E.G. Features of the formation of the ecological and toxicological situation in the discharge zone of the Sorbulak canal into the Ili River. In Problems of Protection and Sustainable Use of Biodiversity of Fauna in Kazakhstan; Kaganat: Almaty, Kazakhstan, 1999; pp. 132–133. (In Russian) [Google Scholar]
  28. Krupa, E.G.; Stuge, T.S.; Akberdina, G.Z. Lower crustaceans from Sorbulak reservoirs under conditions of chronic wastewater impact. In Zoological Research in Kazakhstan; Institute of Zoology: Almaty, Kazakhstan, 2002; pp. 176–177. (In Russian) [Google Scholar]
  29. Rogovskaya, E.G. (Ed.) Scientific and Applied Reference Book on the Climate of the USSR; Series 3; Gidrometeoizdat: Leningrad, Russia, 1989; Issue 18, p. 440. (In Russian) [Google Scholar]
  30. Myakisheva, N.V. Multi-Criteria Classification of Lakes; Russian State Hydrometeorological University: St. Petersburg, Russia, 2009; p. 160. [Google Scholar]
  31. ISO 8467:1993. Water Quality. Determination of Permanganate Index. 1993. Available online: https://www.iso.org/standard/15669.html (accessed on 10 October 2020).
  32. Kazakhstan Hydrometeorological Service. Surface and Underground Resources Water, Their Use, and Quality (2017 Year); Annual Publication: Almaty, Kazakhstan, 2018. (In Russian) [Google Scholar]
  33. Romanova, S.M. Non-Drainage Reservoirs of Kazakhstan. In Hydrochemical Regime; Kazakh University: Almaty, Kazakhstan, 2008; Volume 1, p. 250. (In Russian) [Google Scholar]
  34. Semenov, A.D. Guidance on the Chemical Analysis of Land Surface Water; Gidrometeoizdat: Leningrad, Russia, 1977; p. 541. (In Russian) [Google Scholar]
  35. Fomin, G.S. Water Control of Chemical, Bacterial, and Radiation Safety According to International Standards; NGO Alternative: Moscow, Russia, 1995; p. 618. (In Russian) [Google Scholar]
  36. Interstate Standard 31 870-2012. Drinking Water. In Determination of Elements Content by Atomic Spectrometry Methods; Standardinform: Moscow, Russia, 2013. (In Russian) [Google Scholar]
  37. Kiselev, I.A. Research methods of plankton. In Life of the Fresh Water of the USSR; Pavlovsky, E.N., Zhadin, V.I., Eds.; Academy of Sciences: Moscow/Leningrad, Russia, 1956; pp. 188–253. (In Russian) [Google Scholar]
  38. Balushkina, E.V.; Vinberg, G.G. The relationship between the length and body weight of planktonic crustaceans. In Experimental and Field Studies of the Biological Foundations of Lake Productivity; Vinberg, G.G., Ed.; Institute of Lake and River Fishery: Leningrad, Russia, 1979; pp. 58–79. (In Russian) [Google Scholar]
  39. Rylov, V.M. Fauna of the USSR. Crustaceans. Freshwater Cyclopoida; Nauka: Moscow, Russia, 1948; p. 312. (In Russian) [Google Scholar]
  40. Kutikova, L.A. Rotifers of the Fauna of the USSR; Science: Leningrad, Russia, 1964; p. 744. (In Russian) [Google Scholar]
  41. Tsalolikhin, S.Y. Key to Freshwater Invertebrates in Russia and Adjacent Territories; Zoological Institute: St. Petersburg, Russia, 1995; Issue 2, p. 628. (In Russian) [Google Scholar]
  42. Krupa, E.G.; Dobrokhotova, O.V.; Stuge, T.S. Fauna of Calanoida (Crustacea: Copepoda) of Kazakhstan and Adjacent Territories; Etalon Print: Almaty, Kazakhstan, 2016; p. 208. (In Russian) [Google Scholar]
  43. Magurran, E. Ecological Diversity and its Measurement; Mir: Moscow, Russia, 1998; p. 184. ISBN 5-03-002404-2. (In Russian) [Google Scholar]
  44. Shitikov, V.K.; Rosenberg, G.S.; Zinchenko, T.D. Quantitative Hydroecology: Methods of Systemic Identification; Institute of Ecology of the Volga Basin of the Russian Academy of Sciences: Togliatti, Russia, 2003; p. 463. ISBN 5-93424-109-5. (In Russian) [Google Scholar]
  45. Clarke, K.R.; Gorley, R.N. PRIMER v5: User Manual/Tutorial; PRIMER-E Ltd Press: Plymouth, UK, 2001. [Google Scholar]
  46. Krupa, E.G.; Barinova, S.M.; Romanova, S.M.; Malybekov, A.B. Hydrobiological assessment of the high mountain Kolsay Lakes (Kungey Alatau, Southeastern Kazakhstan) ecosystems in climatic gradient. Br. J. Environ. Clim. Chang. 2016, 6, 259–278. [Google Scholar] [CrossRef]
  47. Krupa, E.G.; Barinova, S.S. Environmental variables regulating the phytoplankton structure in high mountain lakes. Res. J. Pharm. Biol. Chem. Sci. 2016, 4, 1251–1261. [Google Scholar]
  48. Krupa, E.G.; Barinova, S.M. The use of structural indicators of hydrocenoses in assessing the ecological state of water bodies in Kazakhstan. In Bioindication in Monitoring Freshwater Ecosystems; Institute of Lake Studies: St. Petersburg, Russia, 2017; pp. 165–170. (In Russian) [Google Scholar]
  49. Krupa, E.G.; Barinova, S.S.; Romanova, S.M. Zooplankton size structure in the Kolsay Mountain Lakes (Kungei Alatau, Southeastern Kazakhstan) and its relationships with environmental factors. Water Resour. 2019, 46, 403–414. [Google Scholar] [CrossRef]
  50. Krupa, E.G.; Barinova, S.S.; Isbekov, K.B.; Assylbekova, S.Z. The use of zooplankton distribution maps for assessment of ecological status of the Shardara reservoir (Southern Kazakhstan). Ecohydrol. Hydrobiol. 2018, 1852–1865. [Google Scholar] [CrossRef]
  51. Barinova, S.; Krupa, E.; Romanova, S. The role of planktonic algae in the ecological assessment of storage-reservoirs of the Ile-Balkhash basin (Kazakhstan). Transylv. Rev. Syst. Ecol. Res. Wetl. Divers. 2018, 20, 1–14. [Google Scholar] [CrossRef] [Green Version]
  52. Krupa, E.G.; Barinova, S.S.; Assylbekova, S.Z.; Isbekov, K.B. Structural indicators of zooplankton of the Shardara Reservoir (Kazakhstan) and the main influencing factors. Turk. J. Fish. Aquat. Sci. 2018, 18, 659–669. [Google Scholar] [CrossRef]
  53. Odum, Y. Ecology; Mir: Moscow, Russia, 1981; p. 328. (In Russian) [Google Scholar]
  54. Love, J.; Selker, R.; Marsman, M.; Jamil, T.; Dropmann, D.; Verhagen, A.J.; Ly, A.; Gronau, Q.F.; Smira, M.; Epskamp, S.; et al. JASP: Graphical statistical software for common statistical designs. J. Stat. Softw. 2019, 88, 1–17. [Google Scholar] [CrossRef] [Green Version]
  55. STATISTICA (Data Analysis Software System). Version 7.1. StatSoft, Inc.: Tulsa, OK, USA, 2007.
  56. Ter Braak, C.J.F.; Šmilauer, P. CANOCO Reference Manual and CanoDraw for Windows User’s Guide: Software for Canonical Community Ordination (Version 4.5); Microcomputer Power Press: Ithaca, NY, USA, 2002. [Google Scholar]
  57. Tytła, M.; Kostecki, M. Ecological risk assessment of metals and metalloid in bottom sediments of water reservoir located in the key anthropogenic “hot spot” area (Poland). Environ. Earth Sci. 2019, 78, 179. [Google Scholar] [CrossRef] [Green Version]
  58. Zubala, T.; Patro, M.; Boguta, P. Variability of zinc, copper and lead contents in sludge of the municipal stormwater treatment plant. Environ. Sci. Pollut. Res. 2017, 24, 17145–17152. [Google Scholar] [CrossRef] [Green Version]
  59. Krupa, E.G. Zooplankton of limnic and lotic ecosystems in Kazakhstan. In Structure, Patterns of Formation; Palmarium Academic Publishing: Saarbrucken, Germany, 2012. (In Russian) [Google Scholar]
  60. Zeng, J.; Zhao, D.; Ji, Y.; Wu, Q. Comparison of heavy metal accumulation by a bloom-forming cyanobacterium, Microcystis aeruginosa. Chin. Sci. Bull. 2012, 57, 3790–3797. [Google Scholar] [CrossRef] [Green Version]
  61. Benfares, R.; Seridi, H.; Belkacem, Y.; Inal, A. Heavy Metal Bioaccumulation in Brown Algae Cystoseira compressa in Algerian Coasts, Mediterranean Sea. Environ. Process. 2015, 2, 429–439. [Google Scholar] [CrossRef] [Green Version]
  62. Utz, L.R.; Bohrer-Morel, M.B.C. Characterization of the Zooplankton Community of the Secondary Wastewater Treatment System of an Oil Refinery in Southern Brazil. Biocienc. Porto Alegre 2008, 16, 1–14. [Google Scholar]
  63. Krupa, E.G.; Smirnova, D.A.; Amirgaliev, N.A.; Saduakasova, R.E. Long-term dynamics of zooplankton in the Shardara reservoir. Res. Results 2009, 4, 18–20. (In Russian) [Google Scholar]
  64. Razak, S.B.A.; Sharip, Z. Spatio-temporal variation of zooplankton community structure in tropical urban waterbodies along trophic and urban gradients. Ecol. Process. 2019, 8, 44. [Google Scholar] [CrossRef]
  65. Krupa, E.; Romanova, S.; Berkinbaev, G.; Yakovleva, N.; Sadvakasov, E. Zooplankton as Indicator of the Ecological State of Protected Aquatic Ecosystems (Lake Borovoe, Burabay National Nature Park, Northern Kazakhstan). Water 2020, 12, 2580. [Google Scholar] [CrossRef]
  66. Krupa, E.G.; Matmuratov, S.A. Quantitative development and sex structure of Acanthocyclops robustus (Copepoda, Cyclopoida) populations in water bodies of southeastern Kazakhstan. Tethys Aqua Zool. Res. 2002, 1, 191–194. (In Russian) [Google Scholar]
  67. Krupa, E.G. Population densities, sex ratios of adults, and occurrence of malformations in three species of Cyclopoid copepods in waterbodies with different degrees of eutrophy and toxic pollution. J. Mar. Sci. Technol. 2005, 13, 226–237. [Google Scholar]
  68. Leppänen, J.J. An overview of Cladoceran studies conducted in mine water impacted lakes. Int. Aquat. Res. 2018, 10, 207–221. [Google Scholar] [CrossRef] [Green Version]
  69. Vesela, S.; Vijverberg, J. Effect of body size on toxicity of zinc in neonates of four differently sized Daphnia species. Aquat. Ecol. 2007, 41, 67–73. [Google Scholar] [CrossRef] [Green Version]
  70. Schwerin, S.; Zeis, B.; Lamkemeyer, T.; Paul, R.J.; Koch, M.; Madlung, J.; Fladerer, C.; Pirow, R. Acclimatory responses of the Daphnia pulex proteome to environmental changes. II. Chronic exposure to different temperatures (10 and 20 °C) mainly affects protein metabolism. BMC Physiol. 2009, 9, 8. [Google Scholar] [CrossRef] [Green Version]
  71. Stollewerk, A. The Water Flea Daphnia—A ‘New’ Model System for Ecology and Evolution? J. Biol. 2010, 9, 1–4. Available online: http://jbiol.com/content/9/2/21 (accessed on 30 September 2020). [CrossRef] [Green Version]
  72. Sadeq, S.A.; Beckerman, A.P. The Chronic Effects of Copper and Cadmium on Life History Traits Across Cladocera Species: A Meta‑analysis. Arch. Environ. Contam. Toxicol. 2019, 76, 1–16. [Google Scholar] [CrossRef] [Green Version]
  73. Sikora, A.; Dawidowicz, P. Breakage of cyanobacterial filaments by small- and large-sized Daphnia: Are there any temperature-dependent differences? Hydrobiologia 2017, 798, 119–126. [Google Scholar] [CrossRef]
  74. Wejnerowski, L.; Cerbin, S.; Dziuba, M.K. Setae thickening in Daphnia magna alleviates the food stress caused by the filamentous cyanobacteria. Aquat. Ecol. 2017, 51, 485–498. [Google Scholar] [CrossRef] [Green Version]
  75. Lehman, P.W.; Teh, S.J.; Boyer, G.L.; Nobriga, M.L.; Bass, E.; Hogle, C. Initial impacts of Microcystis aeruginosa blooms on the aquatic food web in the San Francisco Estuary. Hydrobiologia 2010, 637, 229–248. [Google Scholar] [CrossRef] [Green Version]
  76. Pawlik-Skowrońska, B.; Toporowska, M.; Mazur-Marzec, H. Effects of secondary metabolites produced by different cyanobacterial populations on the freshwater zooplankters Brachionus calyciflorus and Daphnia pulex. Environ. Sci. Pollut. Res. 2019, 26, 11793–11804. [Google Scholar] [CrossRef] [Green Version]
  77. Peltomaa, E.T.; Aalto, S.L.; Vuorio, K.M.; Taipale, S.J. The importance of phytoplankton biomolecule availability for secondary production. Front. Ecol. Evol. 2017, 5, 128. [Google Scholar] [CrossRef] [Green Version]
  78. Taipale, S.J.; Aalto, S.L.; Galloway, A.W.; Kuoppamäki, K.; Nzobeuh, P.; Peltomaa, E. Eutrophication and browning influence on Daphnia nutritional ecology. Inland Waters 2019, 9, 374–394. [Google Scholar] [CrossRef]
  79. Taipale, S.J.; Kuoppamäki, K.; Strandberg, U.; Peltomaa, E.; Vuorio, K. Lake restoration influences nutritional quality of algae and consequently Daphnia biomass. Hydrobiologia 2020, 1–19. [Google Scholar] [CrossRef]
  80. Jung, S.; Kim, K.; Lee, Y.; Lee, J.; Cheong, Y.; Reza, A.; Kim, J.; Owen, J.S.; Kim, B. The effect of phosphorus removal from sewage on the plankton community in a hypertrophic reservoir. J. Ecol. Environ. 2016, 40, 9. [Google Scholar] [CrossRef] [Green Version]
  81. Adamczuk, M. Past, present, and future roles of small cladoceran Bosmina longirostris (O. F. Müller, 1785) in aquatic ecosystems. Hydrobiologia 2016, 767, 1–11. [Google Scholar] [CrossRef] [Green Version]
  82. Krztoń, W.; Kosiba, J.; Pociecha, A.; Wilk‑Woźniak, E. The effect of cyanobacterial blooms on bio‑ and functional diversity of zooplankton communities. Biodivers. Conserv. 2019, 28, 1815–1835. [Google Scholar] [CrossRef] [Green Version]
  83. Warwick, R.M. A new method for detecting pollution effects on marine macrobenthic communities. Mar. Biol. 1986, 4, 557–562. [Google Scholar] [CrossRef]
  84. Clarke, K.R. Comparison of dominance curves. J. Exp. Mar. Biol. Ecol. 1990, 138, 143–157. [Google Scholar] [CrossRef]
  85. Warwick, R.M.; Clarke, K.R. Relearning the ABC: Taxonomic changes and abundance/biomass relationships in disturbed benthic communities. Mar. Biol. 1994, 118, 739–744. [Google Scholar] [CrossRef]
  86. Moschonas, G.; Gowen, R.J.; Paterson, R.F.; Mitchell, E.; Stewart, B.M.; McNeill, S.; Glibert, P.M.; Davidson, K. Nitrogen dynamics and phytoplankton community structure: The role of organic nutrients. Biogeochemistry 2017, 134, 125–145. [Google Scholar] [CrossRef] [PubMed] [Green Version]
  87. Vuorio, K.; Järvinen, M.; Kotamäki, N. Phosphorus thresholds for bloom-forming cyanobacterial taxa in boreal lakes. Hydrobiologia 2019, 1–12. [Google Scholar] [CrossRef] [Green Version]
  88. Gasiūnaite, Z.R.; Olenina, I. Zooplankton-phytoplankton interactions: A possible explanation of the seasonal succession in the Kuršiu Marios lagoon. Hydrobiologia 1998, 363, 333–339. [Google Scholar] [CrossRef]
  89. Pogozhev, P.I.; Gerasimova, T.N. The Role of Zooplankton in the Regulation of Phytoplankton Biomass Growth and Water Transparency in Water Bodies Polluted by Nutrients. Water Resour. 2011, 38, 400–408. [Google Scholar] [CrossRef]
  90. Hoppenheit, M.; Sperling, K. On the dynamics of exploited populations of Tisbe holothuriae (Copepoda, Harpacticoidae). Helgol. Wiss. Meeresunters 1977, 29, 328–336. [Google Scholar] [CrossRef] [Green Version]
  91. Offem, B.O.; Ezekiel, O. Ayotunde Toxicity of Lead to Freshwater Invertebrates (Water fleas; Daphnia magna and Cyclop sp.) in Fish Ponds in a Tropical Floodplain. Water Air Soil Pollut. 2008, 192, 39–46. [Google Scholar] [CrossRef]
  92. Wang, Z.; Yan, C.; Zhang, X. Acute and chronic cadmium toxicity to a saltwater cladoceran Moina monogolica Daday and its relative importance. Ecotoxicology 2009, 18, 47–54. [Google Scholar] [CrossRef]
  93. Ha, J.-Y.; Kamo, M.; Sakamoto, M. Acute toxicity of copper to Daphnia galeata under different magnesium and calcium conditions. Limnology 2017, 18, 63–70. [Google Scholar] [CrossRef]
  94. Rodgher, S.; Espíndola, E.L.G.; Lombardi, A.T. Suitability of Daphnia similis as an alternative organism in ecotoxicological tests: Implications for metal toxicity. Ecotoxicology 2010, 19, 1027–1033. [Google Scholar] [CrossRef] [PubMed]
  95. Meshkova, T.M. Regularities in the Development of Zooplankton in Lake Sevan; AN ArmSSR: Yerevan, Armenia, 1975; p. 237. (In Russian) [Google Scholar]
  96. Maier, G. The seasonal cycle of Thermocyclops crassus (Fischer, 1853) (Copepoda: Cyclopoida) in a shallow, eutrophic lake. Hydrobiologia 1989, 178, 43–58. [Google Scholar] [CrossRef]
  97. Dvoretzky, V.G.; Pakhomova, N.A. Comparative characteristics of the populations of Oithona similis (Claus) in the waters of the Pechora Sea and the coastal zone of East Murman. Vestn. MGTU 2006, 9, 797–804. [Google Scholar]
  98. Mohamed, H.H.; Salman, S.D.; Abdullah, A.A.M. Some aspects of the biology of two Copepods: Apocyclops dengizicus and Mesocyclops isabellae from a Pool in Garmat—Ali, Basrah, Iraq. Turk. J. Fish. Aquat. Sci. 2008, 8, 239–247. [Google Scholar]
  99. Kiørboe, T. Sex, sex-ratios, and the dynamics of pelagic copepod populations. Oecologia 2006, 148, 40–50. [Google Scholar] [CrossRef]
  100. Geodakyan, V.A.; Smirnov, N.N. Sexual dimorphism and evolution of lower crustaceans. In Problems of Evolution; Vorontsov, N.N., Ed.; Nauka: Novosibirsk, Russia, 1968; Volume 1, pp. 30–36. (In Russian) [Google Scholar]
  101. Ikko, N.V. Features of Biology of Mass Littoral Gammarids (Crustacea, Amphipoda) in the Kola Bay. In Autoreferat Candidate of Biological Sciences: 25.00.28—Oceanology; Murmansk, Russia, 2009; p. 26. Available online: https://www.dissercat.com/content/ekologiya-mnogoshchetinkovykh-chervei-polychaeta-karskogo-morya (accessed on 22 December 2000). (In Russian)
  102. Krupa, E.G. Sex structure of populations of copepods (Copepoda: Cyclopoida, Calanoida) in water bodies of Kazakhstan. In Fauna of Kazakhstan and Adjacent Territories; Materials of the International Scientific. Conf.: Almaty, Kazakhstan, 2012; pp. 127–128. (In Russian) [Google Scholar]
  103. Mandil, R.; Prakash, A.; Rahal, A.; Singh, S.P.; Sharma, D.; Kumar, R.; Garg, S.K. In vitro and in vivo effects of flubendiamide and copper on cyto-genotoxicity, oxidative stress and spleen histology of rats and its modulation by resveratrol, catechin, curcumin and α-tocopherol. BMC Pharmacol. Toxicol. 2020, 21, 1–17. [Google Scholar] [CrossRef]
  104. Wong, C.K.; Pak, A.P. Acute and Subchronic Toxicity of the Heavy Metals Copper, Chromium, Nickel, and Zinc, Individually and in Mixture, to the Freshwater Copepod Mesocyclops pehpeiensis. Bull. Environ. Contam. Toxicol. 2004, 73, 190–196. [Google Scholar] [CrossRef]
  105. Cerbin, S.; Kraak, M.H.S.; de Voogt, P.; Visser, P.M.; Van Donk, E. Combined and single effects of pesticide carbaryl and toxic Microcystis aeruginosa on the life history of Daphnia pulicaria. Hydrobiologia 2010, 643, 129–138. [Google Scholar] [CrossRef] [Green Version]
  106. Kayser, H. Effect of zinc sulphate on the growth of mono- and multispecies cultures of some marine plankton algae. Helgolander Wiss. Meeresunters 1977, 30, 682–696. [Google Scholar] [CrossRef] [Green Version]
  107. Krupa, E.G.; Grishaeva, O.V. The structure of species dominance in the macrozoobenthos of the Small Aral Sea as an indicator of changes in water salinity. In Bioindication in the Monitoring of Freshwater Ecosystems: Abstracts of the 2nd International Conference; Lyubavich: St. Petersburg, Russia, 2011; p. 96. [Google Scholar]
Figure 1. Schematic map of sampling stations in the Sorbulak wastewater disposal system (South-Eastern Kazakhstan).
Water 12 03409 g001
Figure 2. The JASP network plot of the similarity (in R-statistics) of the composition of planktonic invertebrate in the Sorbulak wastewater disposal system, summer 2000–2002, 2017. Abbreviations: SR_1–Sorublak, 2000, SR_2–Sorublak, 2001, SR_3–Sorublak, 2002, SR_4–Sorublak, 2017, RB_7–pond RBSC No. 7, 2017, RB_8–pond RBSC No. 8, 2017. The line thickness between stations reflect the correlation value; blue is positive, red is negative.
Water 12 03409 g002
Figure 3. Individuals with morphological anomalies in the populations of Cyclops vicinus (ac) and Acanthocyclops trajani (df) from the Sorbulak wastewater disposal system, 2000–2002. Photo by E.G. Krupa.
Water 12 03409 g003
Figure 4. Principal component analysis (PCA) biplot of relationships between the content of nutrients, easily oxidizable organic substances and the structural variables of zooplankton communities in the Sorbulak wastewater disposal system, summer of 2000–2002, and 2017. The following abbreviations are used: RotBi—Rotifera biomass, CladBi—Cladocera biomass, CopBi—Copepoda biomass, TotBi—total zooplankton biomass, ShaBi—Shannon Bi, ShaDel—Δ-Shannon, AvrMas—an average mass of an individual. Black arrows are environmental factors; blue arrows are structural variables of zooplankton communities.
Water 12 03409 g004
Figure 5. PCA biplot of relationships between the content of heavy metals, depth, TDS, and structural variables of zooplankton communities in the Sorbulak wastewater disposal system, summer of 2000–2002, and 2017. The following abbreviations are used: RotBi—Rotifera biomass, CladBi—Cladocera biomass, CopBi—Copepoda biomass, TotBi—total zooplankton biomass, ShaBi—Shannon Bi, ShaDel—Δ-Shannon, AvrMas—an average mass of an individual. Black arrows are environmental factors; blue arrows are structural variables of zooplankton communities.
Water 12 03409 g005
Figure 6. PCA biplot of relationships between nutrient content, depth, TDS, and the abundance of dominant planktonic invertebrates in the Sorbulak wastewater disposal system, summer of 2000–2002, and 2017. The following abbreviations are used: BosLon–Bosmina longirostris, DapPul–Daphnia pulex, DapMag–Daphnia magna, DapGal–Daphnia galeata, ActTra–Acanthocyclops trajani, CycVic–Cyclops vicinus. Black arrows are environmental factors; blue arrows are the abundance of dominant species of planktonic invertebrates.
Water 12 03409 g006
Figure 7. PCA biplot of relationships between the content of heavy metals, depth, TDS, and the abundance of dominant planktonic invertebrates in the Sorbulak wastewater disposal system, summer of 2000–2002, and 2017. The following abbreviations are used: BosLon–Bosmina longirostris, DapPul–Daphnia pulex, DapMag–Daphnia magna, DapGal–Daphnia galeata, ActTra–Acanthocyclops trajani, CycVic–Cyclops vicinus. Black arrows are environmental factors; blue arrows are biological variables.
Water 12 03409 g007
Figure 8. PCA biplot of relationships between the content of heavy metals, depth, TDS, and the structure of populations of cyclops Acanthocyclops trajani and Cyclops vicinus in the Sorbulak wastewater disposal system, 2000–2002, and 2017. The following abbreviations were used: TotAC—total abundance of Acanthocyclops trajani, including FmAC—mature females, FmOvAC—females with eggs, MalAC—males, SxRtAC—ratio of males to females, TeratAC—abundance of individuals with morphological anomalies; TotCV—total abundance of Cyclops vicinus, including FmCV—mature females, FmOvCV—females with eggs, MalCV—males, SxRtCV—the ratio of males to females, TeratCV—bundance of individuals with morphological anomalies. Black arrows are environmental factors; blue arrows are biological variables.
Water 12 03409 g008
Table 1. Physical and geographical characteristics of the Sorbulak wastewater disposal system. RBSC—Right-Bank Sorbulak Canal.
VariableSorbulakRBSC No. 7RBSC No. 8
altitude above sea level, m620618615
water area, km2583.50.4
max water volume, km3100017.51.2
depth max, m20.06.07.0
depth average, m7.25.02.9
transparency, m1.50.20.5
temperature, °C27.028.527.8
Table 2. The environmental variables in the Sorbulak wastewater disposal system, mean values with standard error, summer 2017.
VariableUnitsSorbulak RBSC No. 7RBSC No. 8
pH 9.0 ± 0.68.5 ± 0.019.4 ± 0.06
TDSmg/dm31234.3 ± 37.8517.5 ± 20.0584.1 ± 40.1
Hardnessmg-eq. dm34.9 ± 0.032.3 ± 0.012.8 ± 0.3
PImg O2 dm311.2 ± 0.0421.8 ± 0.110.9 ± 0.9
Simg/dm32.1 ± 0.48.7 ± 0.18.3 ± 0.1
N-NO2mg/dm30.012 ± 0.0040.322 ± 0.020.006 ± 0.002
N-NO3mg/dm30.151 ± 0.0161.046 ± 0.0450.078 ± 0.023
N-NH4mg/dm30.453 ± 0.0700.362 ± 0.0450.275 ± 0.050
PO4mg/dm30.15 ± 0.070.80 ± 0.270.28 ± 0.02
Femg/dm30.70 ± 0.140.93 ± 0.191.20 ± 0.40
Mnmg/dm30.005 ± 0.0010.0 ± 0.00.003 ± 0.001
Cdmg/dm3<0.00001<0.00001<0.00001
Crmg/dm30.007 ± 0.00030.007 ± 0.00010.006 ± 0.0006
Cumg/dm30.001 ± 0.00080.043 ± 0.0420.001 ± 0.0001
Nimg/dm30.0051 ± 0.00030.006 ± 0.0030.005 ± 0.0001
Pbmg/dm30.0001 ± 0.00010.0001 ± 0.00010.0001 ± 0.0001
Table 3. The environmental variables of Sorbulak (mg/dm3), mean values with standard error, summer of 2000–2002.
VariablesJune–July 2000June–July 2001June–July 2002July–August 2002
TDS1079.5 ± 42.71240.8 ± 5.11166.5 ± 8.31129.9 ± 9.0
PI-6.4 ± 0.85.6 ± 0.65.7 ± 0.3
N-NO2-0.150 ± 0.0100.006 ± 0.00010.036 ± 0.005
N-NO3-1.400 ± 0.1801.020 ± 0.0100.590 ± 0.030
N-NH4-0.250 ± 0.0200.070 ± 0.0100.170 ± 0.020
PO4-0.130 ± 0.0100.070 ± 0.0200.100 ± 0.020
Cd0.004 ± 0.00020.005 ± 0.00010.078 ± 0.0050.007 ± 0.001
Cu0.007 ± 0.0010.005 ± 0.00040.002 ± 0.00030.024 ± 0.001
Pb0.006 ± 0.0010.030 ± 0.0020.022 ± 0.0020.047 ± 0.006
Zn0.047 ± 0.0020.023 ± 0.0050.014 ± 0.0030.030 ± 0.004
Table 4. Taxonomic composition of planktonic invertebrates in the Sorbulak wastewater disposal system, summer of 2000–2002, and 2017.
Taxon NameSorbulak
2000–2002
2017
SorbulakRBSC No. 7RBSC No. 8
Phylum Rotifera
Bdelloida gen.sp. +
Notommatidae gen.sp. +
Asplanchna girodi (Guerne)++
Brachionus angularis (Gosse) +
Brachionus calyciflorus dorcas Gosse+++
Brachionus plicatilis longicornis (Fadeev)++
Brachionus quadridentatus Hermann+
Brachionus rubens Ehrenberg+
Brachionus urceus (Linnaeus)+
Brachionus variabilis (Hempel) +
Euchlanis dilatata (Ehrenberg) +
Euchlanis sp.+
Hexarthra mira (Hudson)++++
Keratella quadrata dispersa Carlin++ +
Lecane luna (Muller) +
Lecane sp.+
Polyarthra major Burckhardt+
Polyarthra sp.+++
Pompholyx sulcata (Hudson)++
Synchaeta kitina (Roussel.) +
Synchaeta stylata (Wierzejski) +
Synchaeta sp.+
Trichocerca sp.+
Phylum: Arthropoda
Superorder Cladocera
Alona quadrangularis (O.F. Muller) +
Alona rectangula (Sars) +
Alona sp.+
Biapertura affinis (Leydig)+
Bosmina (Bosmina) longirostris (O.F. Muller)++ +
Ceriodaphnia pulchella (Sars) +
Chydorus sphaericus (O.F. Muller)++++
Daphnia (Ctenodaphnia) magna (Straus)++++
Daphnia (Daphnia) galeata (G.O. Sars)++ +
Daphnia (Daphnia) pulex (De Geer)++++
Daphnia (Daphnia) longispina (O.F. Muller)+
Diaphanosoma mongolianum (Veno)++
Leydigia leydigii (Schoedler) +
Macrothrix laticornis (Jurine)+
Simocephalus sp.+
Subclass Copepoda
Acanthocyclops trajani (Mirabdullayev et Defaye)++++
Cyclops scutifer (Sars) +
Cyclops vicinus (Uljanin)++ +
Cyclopoida gen.sp. +
Limnocletodes behningi (Borutzky) +
Sinodiaptomus sarsi (Rylov) ++
Acanthodiaptomus denticornis (Wierzejski)+
Ergasilus sieboldi Nordmann+
Total No. species:3129910
Table 5. The quantitative variables of zooplankton in the Sorbulak wastewater disposal system, mean values with standard error, summer 2000–2002, and 2017.
Water BodyYearRotiferaCladoceraCopepodaTotal
Sorbulakabundance, thousand ind./m3
200073.1 ± 61.168.4 ± 14.497.9 ± 20.3190.7 ± 34.3
2001174.2 ± 35.8157.8 ± 22.8305.5 ± 47.4637.4 ± 76.9
200249.2 ± 8.312.9 ± 1.384.5 ± 34.9146.7 ± 28.6
2017175.8 ± 86.627.7 ± 7.7102.0 ± 22.3305.4 ± 91.8
RBSC No. 7201758.0 ± 43.364.1 ± 11.9535.2 ± 113.8657.4 ± 102.4
RBSC No. 8201724.0 ± 10.416.7 ± 2.2146.0 ± 35.9186.7 ± 40.9
Sorbulakbiomass, g/m3
20000.10 ± 0.085.21 ± 1.201.12 ± 0.386.41 ± 1.31
20010.49 ± 0.094.89 ± 0.771.89 ± 0.277.31 ± 0.98
20020.10 ± 0.081.01 ± 0.280.20 ± 0.051.29 ± 0.38
20170.18 ± 0.072.32 ± 0.630.14 ± 0.022.65 ± 0.06
RBSC No. 720170.05 ± 0.0415.2 ± 4.851.78 ± 0.1617.00 ± 5.00
RBSC No. 820170.02 ± 0.015.45 ± 1.560.64 ± 0.376.11 ± 1.50
Table 6. Composition of dominant species in zooplankton communities in the Sorbulak wastewater disposal system, summer 2000–2002, and 2017.
Species NameAbundance, %Biomass, %Species NameAbundance, %Biomass, %
Sorbulak, 2000Cyclops vicinus29.713.1
Polyarthra sp.23.30.8Acanthocyclops trajani27.94.9
Daphnia galeata21.956.9Sorbulak, 2017
Daphnia longispina10.922.7Hexarthra mira15.51.3
Cyclops vicinus17.311.8Polyarthra sp.12.20.8
Acanthocyclops trajani28.75.5Daphnia magna0.310.6
Sorbulak, 2001Daphnia pulex4.172.7
Asplanchna girodi5.95.9Acanthocyclops trajani30.32.9
Keratella quadrata15.40.8RBSC No. 7, 2017
Hexarthra mira6.40.3Hexarthra mira7.10.3
Bosmina longirostris14.511.1Daphnia magna2,876,0
Daphnia galeata5.913.2Daphnia pulex3.011.7
Daphnia pulex0.141.1Acanthocyclops trajani79.710.3
Acanthocyclops trajani42.923.1RBSC No. 8, 2017
Sorbulak, 2002Hexarthra mira6.70.2
Keratella quadrata20.41.4Daphnia magna4.067.6
Polyarthra major12.21.3Daphnia pulex3,821,2
Daphnia pulex5.866.7Acanthocyclops trajani77.010.2
Table 7. The total abundance and sex ratio in the populations of Acanthocyclops trajani and Cyclops vicinus from the Sorbulak wastewater disposal system, mean values with standard error, summer 2000–2002, and 2017.
Water BodyYear, MonthTotal♀♀♀♀ov♂♂♂/♀
Acanthocyclops trajani
Sorbulak200058.7 ± 26.80.4 ± 0.20.08 ± 0.032.8 ± 1.65.8
2001360.3 ± 69.12.6 ± 0.60.6 ± 0.314.0 ± 7.84.4
200275.9 ± 16.63.8 ± 1.30.3 ± 0.28.7 ± 3.03.3
201792.7 ± 23.00.05 ± 0.030.02 ± 0.010.3 ± 0.14.3
RBSC No. 72017523.9 ± 125.210.8 ± 1.00.5 ± 0.412.8 ± 4.91.1
RBSC No. 82017143.6 ± 35.02.5 ± 2.10.6 ± 0.54.6 ± 4.31.5
Cyclops vicinus
Sorbulak200039.8 ± 14.80.8 ± 0.50.6 ± 0.31.0 ± 0.20.7
200126.8 ± 8.50.8 ± 0.40.3 ± 0.11.2 ± 0.91.0
200243.6 ± 17.20.2 ± 0.10.05 ± 0.011.1 ± 0.84.4
20178.1 ± 3.00.01 ± 0.010.01 ± 0.010.008 ± 0.0050.9
RBSC No.7201700000
RBSC No.820170.01 ± 0.010000
Table 8. Structural variables of zooplankton in the Sorbulak wastewater disposal system, mean values with standard error, summer 2000–2002, and 2017.
Water BodyYearSpecies NumberAverage Individual Mass, mgShannon AbShannon BiΔ Shannon
Sorbulak20008.7 ± 1.50.0343 ± 0.00472.18 ± 0.161.57 ± 0.220.62 ± 0.19
200112.1 ± 2.00.0117 ± 0.00112.41 ± 0.182.09 ± 0.160.32 ± 0.11
20029.0 ± 1.00.0096 ± 0.00302.21 ± 0.131.70 ± 0.170.50 ± 0.28
201716.1 ± 0.70.0182 ± 0.00542.48 ± 0.071.77 ± 0.300.71 ± 0.35
RBSC No 720178.5 ± 1.50.0253 ± 0.00361.19 ± 0.261.16 ± 0.300.03 ± 0.04
RBSC No 820177.7 ± 0.70.0379 ± 0.01391.26 ± 0.201.17 ± 0.310.10 ± 0.42
Table 9. Spearman’s rank correlation coefficients (rS) between environmental and biological variables in the Sorbulak wastewater disposal system, summer 2000–2002, 2017, at p < 0.05.
Biological VariableEnvironmental Variable rSBiological VariableEnvironmental Variable rS
Rotifera AbundanceN-NO20.356Copepoda BiomassN-NO20.560
N-NO30.438N-NO30.380
TDS0.501PO40.341
Cu−0.621Copepoda BiomassCu0.405
Zn−0.516Zn0.479
Cladocera AbundanceTDS−0.455Pb0.460
N-NO20.600Total AbundanceN-NO20.580
N-NO30.379N-NO30.462
PO40.468Total BiomassN-NO20.589
Cladocera BiomassN-NO20.464PO40.440
N-NO30.353Si0.535
PO40.405Cd−0.389
Mn−0.537Average MassDepth0.362
N-NH40.372Δ-ShannonDepth0.415
Cd−0.435Transparency0.415
Pb−0.401TDS0.401
Copepoda AbundanceTransparency−0.351Shannon AbDepth0.466
N-NO20.630Si−0.709
N-NO30.409TDS0.705
PO40.475Transparency0.476
Publisher’s Note: MDPI stays neutral with regard to jurisdictional claims in published maps and institutional affiliations.

