Review

Burning Water, Overview of the Contribution of Arjen Hoekstra to the Water Energy Nexus

by
Winnie Gerbens-Leenes
1,*,
Santiago Vaca-Jiménez
1,2 and
Mesfin Mekonnen
3
1
Integrated Research on Energy, Environment and Society (IREES), University of Groningen, Nijenborg 6, 9747 AG Groningen, The Netherlands
2
Scinergy, Facultad de Ingeniería Mecánica, Escuela Politécnica Nacional, Ladrón de Guevara E11·253, Quito 01-17-2759, Ecuador
3
Department of Civil, Construction and Environmental Engineering, University of Alabama, Tuscaloosa, AL 35487, USA
*
Author to whom correspondence should be addressed.
Water 2020, 12(10), 2844; https://doi.org/10.3390/w12102844
Submission received: 15 September 2020 / Revised: 9 October 2020 / Accepted: 10 October 2020 / Published: 13 October 2020
(This article belongs to the Special Issue In Memory of Prof. Arjen Y. Hoekstra)

Abstract

:
This paper gives an overview of the contribution of water footprint (WF) studies on water for energy relationships. It first explains why water is needed for energy, gives an overview of important water energy studies until 2009, shows the contribution of Hoekstra’s work on WF of energy generation, and indicates how this contribution has supported new research. Finally, it provides knowledge gaps that are relevant for future studies. Energy source categories are: 1. biofuels from sugar, starch and oil crops; 2. cellulosic feedstocks; 3. biofuels from algae; 4. firewood; 5. hydropower and 6. various sources of energy including electricity, heat and transport fuels. Especially category 1, 3, 4, 5 and to a lesser extent 2 have relatively large WFs. This is because the energy source derives from agriculture or forestry, which has a large water use (1,2,4), or has large water use due to evaporation from open water surfaces (3,5). WFs for these categories can be calculated using the WF tool. Category 6 includes fossil fuels and renewables, such as photovoltaics and wind energy and has relatively small WFs. However, information needs to be derived from industry.

1. Introduction

Water is needed for energy, and energy to provide water [1]. Energy needs water to make fuels available, e.g., for steam injections to pump up crude oil from an oil field [2], to make materials available for energy infrastructure, e.g., for steel and concrete [3] (Bosman), to cool power plants [2,4], to move turbines (hydropower) [4,5] or to grow biomass for bioenergy production [6,7]. On the other hand, also water supply needs energy [1]. Sometimes, this energy is for free (e.g., gravity fed canal systems and rainwater), sometimes energy input is needed, e.g., for pumping or desalination. Basically, energy to supply water is an indicator of the effort needed to make water available and ranges from zero (e.g., rain) to large (e.g., desalination).
Although water and energy are closely linked, water and energy policies have been often disconnected in the past [1]. Issues concerning water shortages or water quality have been solved by using more energy, e.g., falling groundwater tables cause larger energy needs for pumping and polluted discharge water requires more energy for cleaning. Issues concerning energy, and especially efforts to decrease carbon dioxide emissions, result in larger use of renewable energy [8]. Especially the use of the renewable energy source biomass has large water demands [1,7]. The examples show the importance of water and energy policy integration.
Water issues play at a local and river basin level. Water needs to be available where it is used, for example, farmers need rainwater for their crops, or else they need to irrigate their crops using groundwater or surface water. Arjen Hoekstra [1] added the global perspective showing the importance of trade, and the consumption perspective, showing the importance of human consumption choices. Separation of consumption and production locations causes water footprints (WFs) at other locations than where consumptions take place so that consumers might have a WF at the other side of the world. This creates the global dimension of water [1]. This global dimension is also important for energy, because fuels, materials for energy infrastructure and electricity are traded and might have a footprint that is not located at the place of energy consumption.
A number of studies on water energy relations and water use for energy have already been conducted before 2009. Most of the data was derived from grey literature from the US, for example from Gleick [9]. This meant that research depended on data from industry. Water footprint studies have made it possible to quantify water for bioenergy and hydropower, because the calculations use weather data, yield data and dam data that are publicly available. WF studies on energy started in 2009 with the publication of the WF of bioenergy [6] and many appeared since then. This generated new information on how much water is needed for specific renewable energy types, i.e., bioenergy and electricity from hydropower. The consumption approach was next used to assess the consequences of shifts in energy mixes towards larger supply of renewables, an important goal of present energy policies [1]. Those studies were based on data on water for energy from existing literature in combination with data from WF studies.
This paper focuses on water for energy studies. It aims to provide an overview of the most important contribution of the WF studies to scientific knowledge, and, in particular, the contribution of the Hoekstra studies. It explains, first, when water is needed for energy, then gives an overview of studies until 2009, shows the contribution of Hoekstra’s work, and shows how this contribution supported new research and shows existing knowledge gaps relevant for future studies.

2. Water and Energy Relationships

There are different energy types that need water for their production, including 1. biofuels from sugar, starch and oil crops; 2. cellulosic feedstocks; 3. biofuels from algae; 4. firewood; 5. hydropower and 6. various sources of energy including electricity, heat and transport fuels [1].
Biofuels and cellulosic feedstocks originate in agriculture, the largest water user, contributing 92% to humanities WF [10]. Agriculture grows crops that need water, either rainwater, green water, or irrigation water, blue water, defined as the surface or groundwater. Agricultural practices also pollute water creating a grey WF defined as the volume of water needed to dilute polluted water to accepted water quality standards where in the agricultural WF studies mostly nitrogen is taken into account assuming that 10% of the nitrogen applied is lost to groundwater [1]. This means that energy that originates in agriculture has a relatively large WF. For bioethanol, biodiesel and energy from cellulosic feedstocks, also some water is needed in the processing stage [11,12]. Algae produced for biofuels are grown in ponds or photobioreactors in water [13]. Algae types include both freshwater and saltwater algae. The saltwater algae, however, also use freshwater with added salt to control water quality [13]. Firewood originates in forestry growing trees needing water to grow. Trees not only have a large green WF though, but often also a blue one, because their roots are so deep that they also use groundwater [14]. Hydroelectricity is generated using surface water, e.g., a reservoir behind a dam. Here evaporation takes place that is generally allocated to the hydropower and other functions of the reservoir according to their economic value, e.g., irrigation or flood protection [15].
Although some power plants use air for cooling, most plants generating electricity need water for cooling. Globally the dominating cooling systems are once-through cooling (open loop cooling) and wet tower cooling (closed-cycle cooling) [2]. Once-through cooling withdraws surface water and returns this water after cooling to where it came from generating a water return flow with a higher temperature [2]. If plants withdraw freshwater, they generate a grey WF because water is needed to dilute the thermally polluted water to accepted water quality standards; if they withdraw salt water, the grey WF is zero. Wet tower cooling withdraws water that is evaporated in a cooling tower. This type of cooling generates a blue WF.
The feedstocks for power plants, heat and transport fuels are mainly fossil fuels, like coal, natural gas and crude oil [8]. These fuels also need water for mining [2]. For example, to mine crude oil often steam injections are applied [2]. The renewable energy sources PV, wind energy and geothermal energy need little water for operation, but for the construction materials, e.g., concrete or steel, water is needed in the construction phase [4]. Concentrated solar power is a renewable energy type that generates electricity using water for wet tower cooling, to move turbines and to clean mirrors [8].

3. Water and Energy Studies before 2009

Most of the literature before the introduction of the WF in energy systems (2009) was defined to serve two main purposes. First and foremost, to understand and quantify the use of water for cooling systems in thermoelectric generation. Second, to assess the use of water in the production of fuels for transportation. Both topics were mainly discussed and assessed in the US. During this period, one can highlight a number of publications that served the scientific community as a base to understand the importance of studying water use in energy systems.
Peter Gleick and his publications [9,16,17] were fundamentally the cornerstone of the subject before the introduction of the WF concept. He took many grey literature reports, from the US, regarding the use of water for electricity generation and fuels production and put them together in one publication providing the first comprehensive review of the volumes of water required to produce a unit of energy [17]. Other contributions in that period that have been used to understand and assess water use by energy systems are Inhaber [18], who took the base of Gleick and provided the additional perspective of the indirect use of water for energy systems; DOE [19], who also used Gleick as a base, but was one of the first reports to use a plain and understandable language to communicate key insights regarding the subject to non-academics (in this case to provide information to the US Congress); Sovacool and Sovacool [20], who were one of the first to introduce to the scientific community the idea that there are several energy expansion pathways that may generate trade-offs between energy production and water usage; Rio Carillo and Frei [21], who did an extensive research assessing water use for the Spanish energy systems providing a contrasting view to what was presented by Gleick for the US and Wu et al. [22], who addressed the freshwater requirement of the production of ethanol and gasoline for the transport sector, mainly for the US, but compared it to other places like Saudi Arabia and Canada. There are other examples, but their work was not so influential in the community (in terms of the number of citations) in relation to the ones described before, e.g., Vassollo and Döll [23].
Nonetheless, most of these publications were dispersed and, in some cases, they lacked a common terminology to understand water usage. Therefore, many of them started their discussions by providing a clear definition to what they consider water usage, and how they define the water usage system in terms of dividing the withdrawal and consumption of water.

4. Contribution of Water Footprint Analyses to the Scientific Community

4.1. Introduction Water Footprint Concept

Arjen Hoekstra introduced the water footprint (WF) concept in 2002 and defined it as the consumption of freshwater resources (cubic meters) consumed or polluted to produce a commodity in the full supply chain [24]. When combined with total consumption this gives the WF of an individual, a business or a nation. The first WF studies calculated WFs of crops from agriculture for food and feed purposes. In 2004, the study of Chapagain and Hoekstra into the WF of nations calculated the WFs per crop per country [25]. The database was later updated and extended by Mekonnen and Hoekstra [7]. When WFs of crops are known, it is an easy next step to also assess WFs of bioenergy derived from crops, the so termed first-generation bioenergy. In their database, Mekonnen and Hoekstra [7] also included the WFs of bioethanol and biodiesel that formed the basis for many WF studies that were done later.
The water footprint concept is a tool that is helpful to promote insight into human water consumption related to consumption of goods and services, including energy, showing how to make this water consumption more sustainable. For the assessment, the first step is to set the goals and scope, second do the WF accounting, third make a sustainability assessment and finally formulate a response [26]. In the case of bioenergy and hydropower, the tool is capable of quantifying the volumes of water consumed to provide a unit of energy when weather data, crop yields, energy from crops or electricity production is known. For other energy types, e.g., electricity from coal, petrol for transport or natural gas for heating, industry needs to provide data on the water consumption to make an energy source available. In that case, WF studies directly or indirectly rely on grey literature, or first-hand data, to assess WFs of energy consumption.
Before the introduction of the WF concept in the water for energy studies, the community described the use of freshwater into energy systems as water intensities. This term has been used even after the introduction of the WF concept, e.g., in publications of Macknick et al. [27], Meldrum et al. [28] and Spang et al. [29], among others. However, currently most of the literature has shifted to describe the freshwater use by energy systems as WFs, highlighting the importance of the WF concept introduced by Hoekstra. The concept became very popular, but it is important though to identify whether the original WF concept has been correctly applied in these studies.
On his personal website, Hoekstra [30] distinguished six different categories of WF of energy studies: 1. WFs of biofuels from sugar, starch and oil crops; 2. WFs of cellulosic feed stocks; 3. WFs of biofuels from algae; 4. WFs of firewood; 5. WFs of hydropower and 6. WFs of various sources of energy. The first five categories mainly focus on the second step of the WF accounting, i.e., calculate the WFs for specific energy sources, while the last category not only calculates WFs related to energy consumption, but also includes a sustainability assessment and a response. In the following sections, some key publications are described per category.

4.2. Water Footprint of Energy Studies

Freshwater and some renewable energy sources have an important aspect in common. Freshwater has a temporal and spatial dimension [1]. This is also the case for solar and wind energy and for hydropower, so that there is sometimes too much energy, sometimes too little or not at the location where the energy is needed. Biofuels, like the dominant fossil energy sources, do not have this disadvantage and can be stored. This makes biofuels an attractive energy source. However, biofuels originate in the agricultural system, the largest global water user. The next sections provide the WFs per energy category. An overview of all WFs is given in Table A1 in the Appendix A: overview of green, blue and grey water footprints for different energy types (m3/GJ).

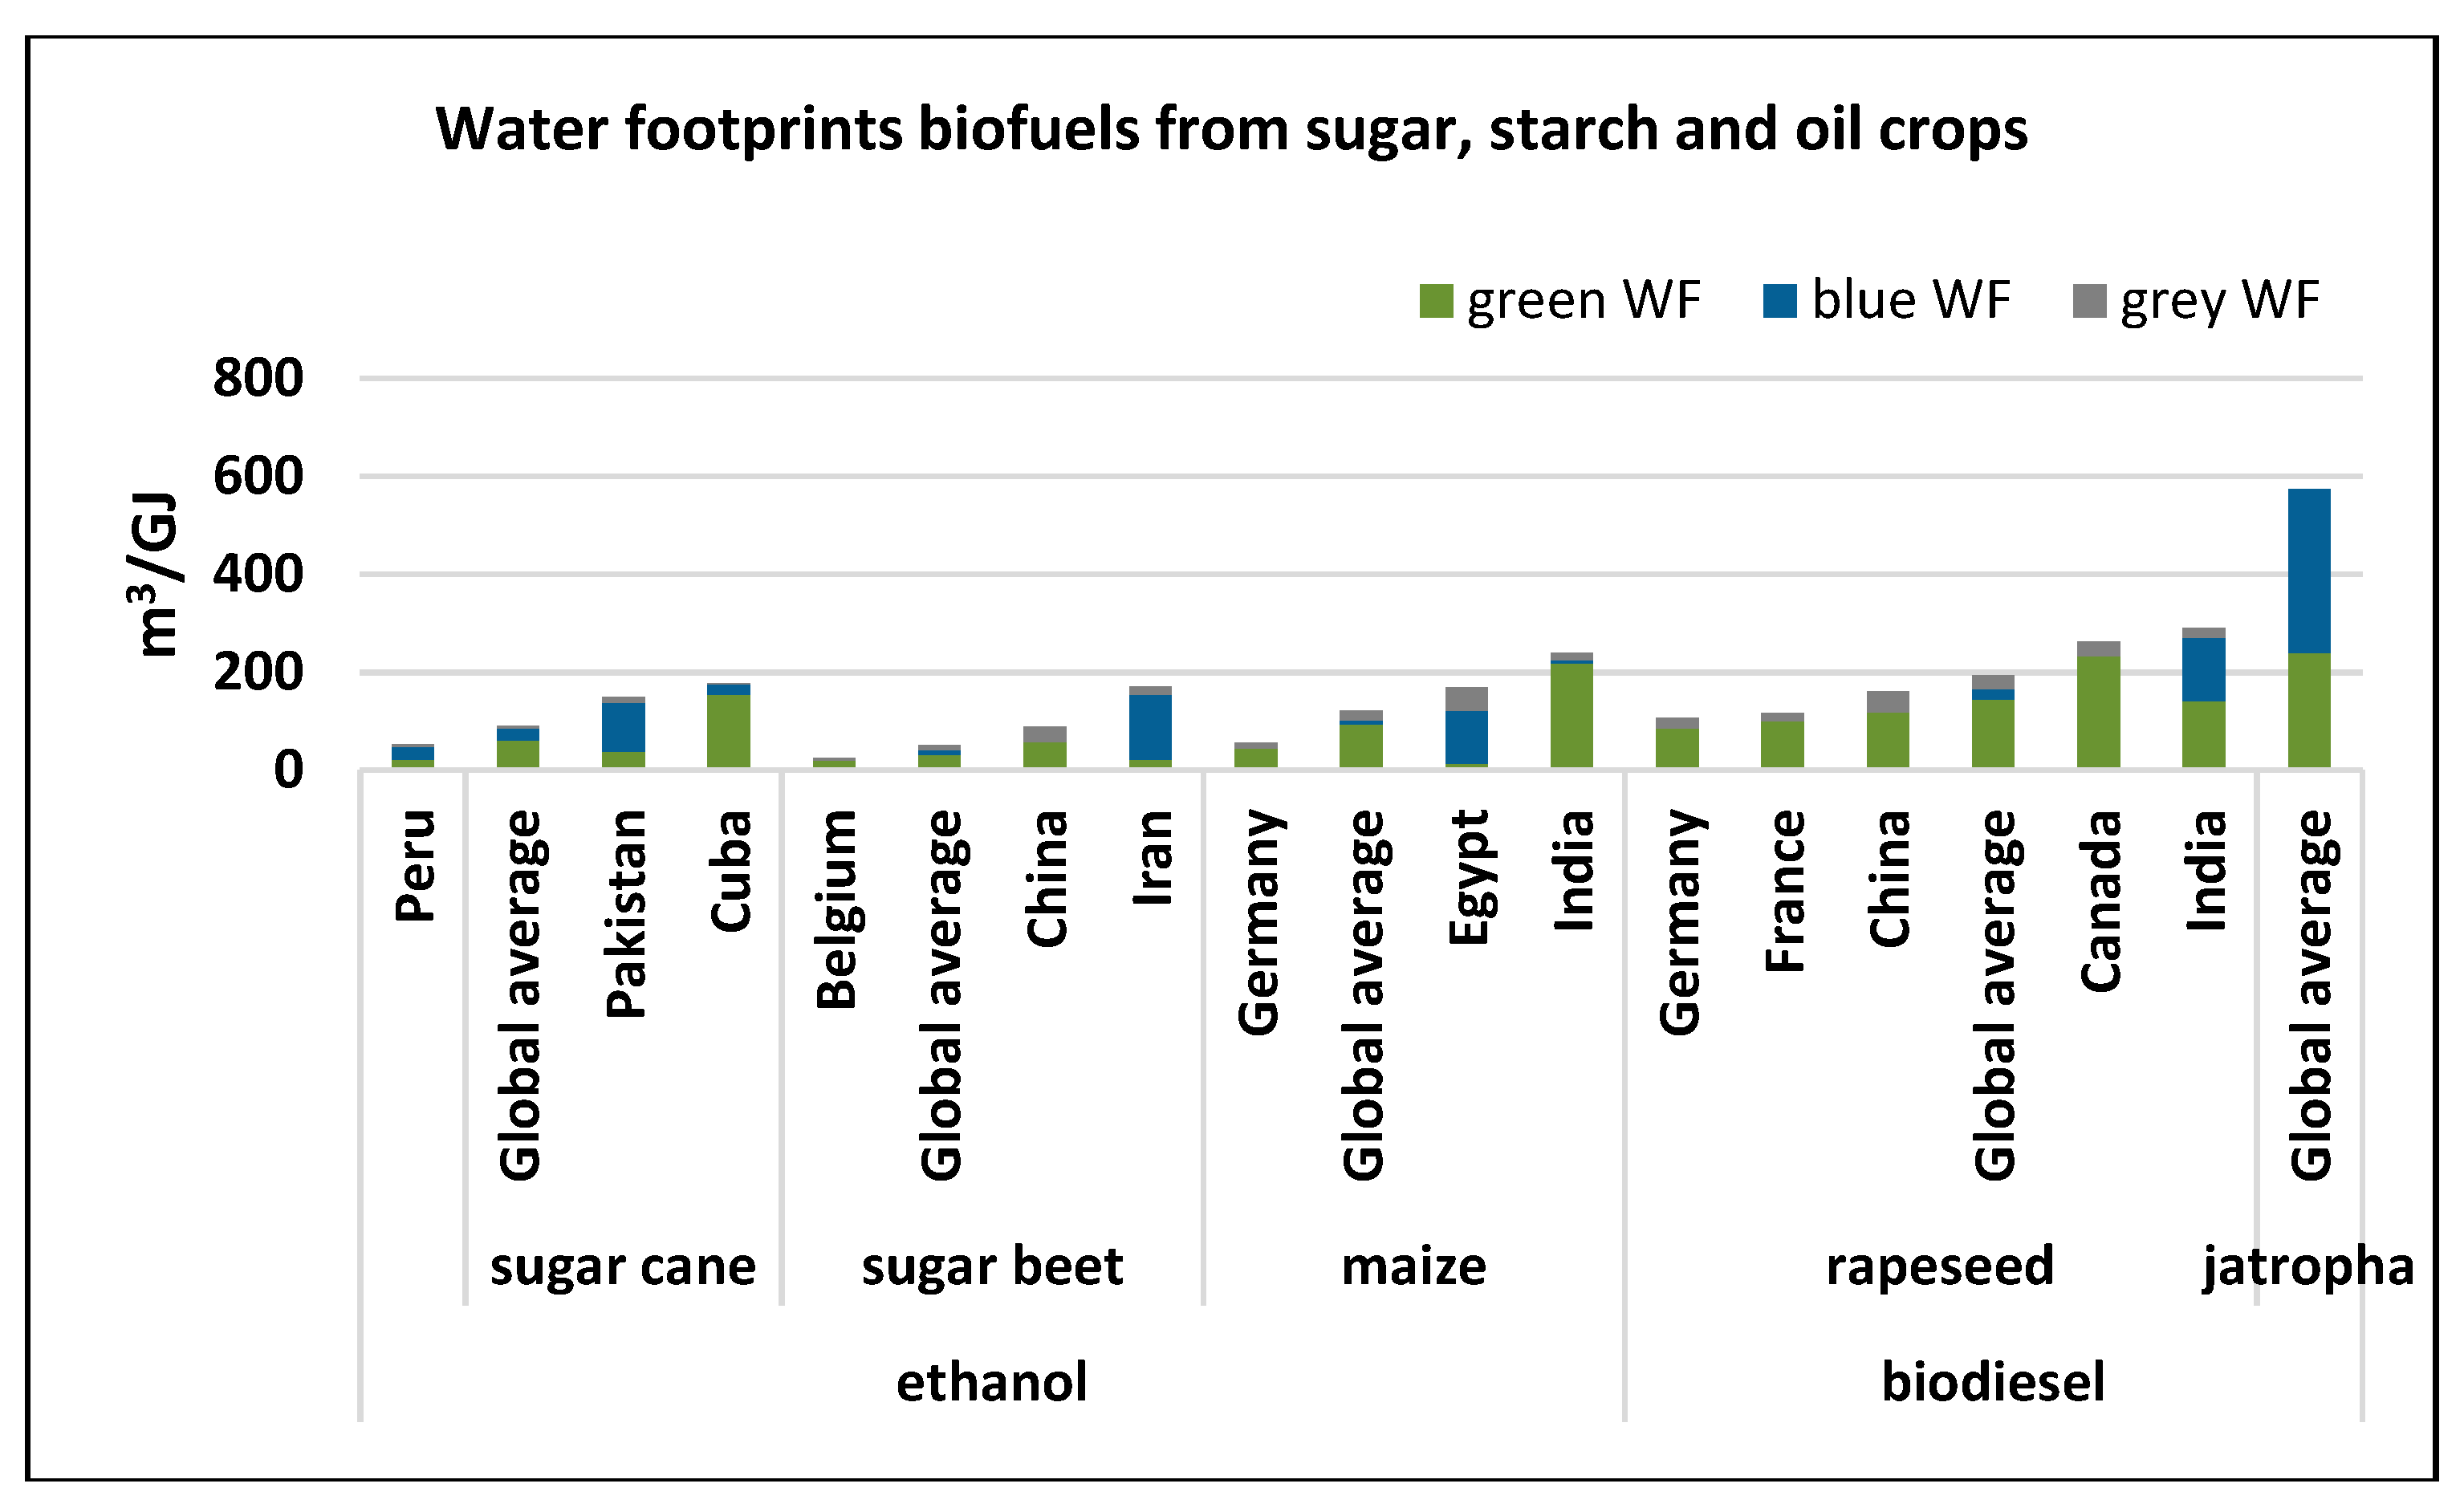
4.2.1. WFs of Biofuels from Sugar, Starch and Oil Crops

The first assessments of WFs of energy were done for biofuels [6,31] showing WFs for bioethanol and biodiesel derived from food or energy crops from different countries. Figure 1 shows WFs of biofuels from the main sugar, starch and oil crops (sugar cane, sugar beet, maize and rapeseed) for a selection of countries with large WF differences. The figure also gives the global average WFs.
The figure shows that there are differences among WFs of ethanol and biodiesel. In general, the WF of ethanol is smaller than the WF of biodiesel. The global average total WF of ethanol from sugar beet was the smallest, the global average total WF of ethanol from maize was the largest. However, the global average total WF of ethanol from sugar cane had a larger blue WF contribution. For biodiesel, especially the green and blue WFs of biodiesel from Jatropha were large. Apart from the WF differences, the studies also indicated that it did not matter whether a food crop, e.g., maize, or a cellulosic energy crop, e.g., Jatropha, was applied for biofuel, because they use the same water resources. In some cases, it is even better to use a food crop, e.g., sugar beet or maize, rather than an energy crop, e.g., Jatropha, from a WF perspective.
WFs are expressed per unit of yield. An interesting issue is that not always WFs go down when yields go up. This was shown for Jatropha [32]. That study also showed that Jatropha should only be grown on marginal lands, because it competes with cultivating food crops also growing under good conditions.
The quantification and comparison of specific WFs per crop is important; however, it is also relevant to put WFs in perspective and compare them with water availability. The study into WFs of bioethanol [11] not only showed WFs per unit of ethanol for the main producing countries, but also gave an indication of the relationship with water scarcity in Ukraine, India and Pakistan. Especially sugar cane grown in basins with water scarcity, e.g., in the Indus basin in Pakistan, shows that there are limits to the expansion of bioethanol production.
Biofuels are introduced in an attempt to decrease CO2 emissions, or carbon footprints (CFs). For example, the European Union (EU) promotes the use of transport fuels from renewable sources to decrease CFs in its member states. The directive 2009/28/EG from 2009 forces EU countries to derive at least 10% of their transport fuels from renewable energy sources in 2020 [33]. Carbon, water and land footprints are part of the footprint family. If policy stimulates to decrease carbon footprints, also effects on land and water footprints should be addressed to avoid trade-offs. The study of Holmatov et al. [34], for example, assessed not only the water but also the land and carbon footprints of two energy scenarios with large bioenergy contribution showing important trade-offs.

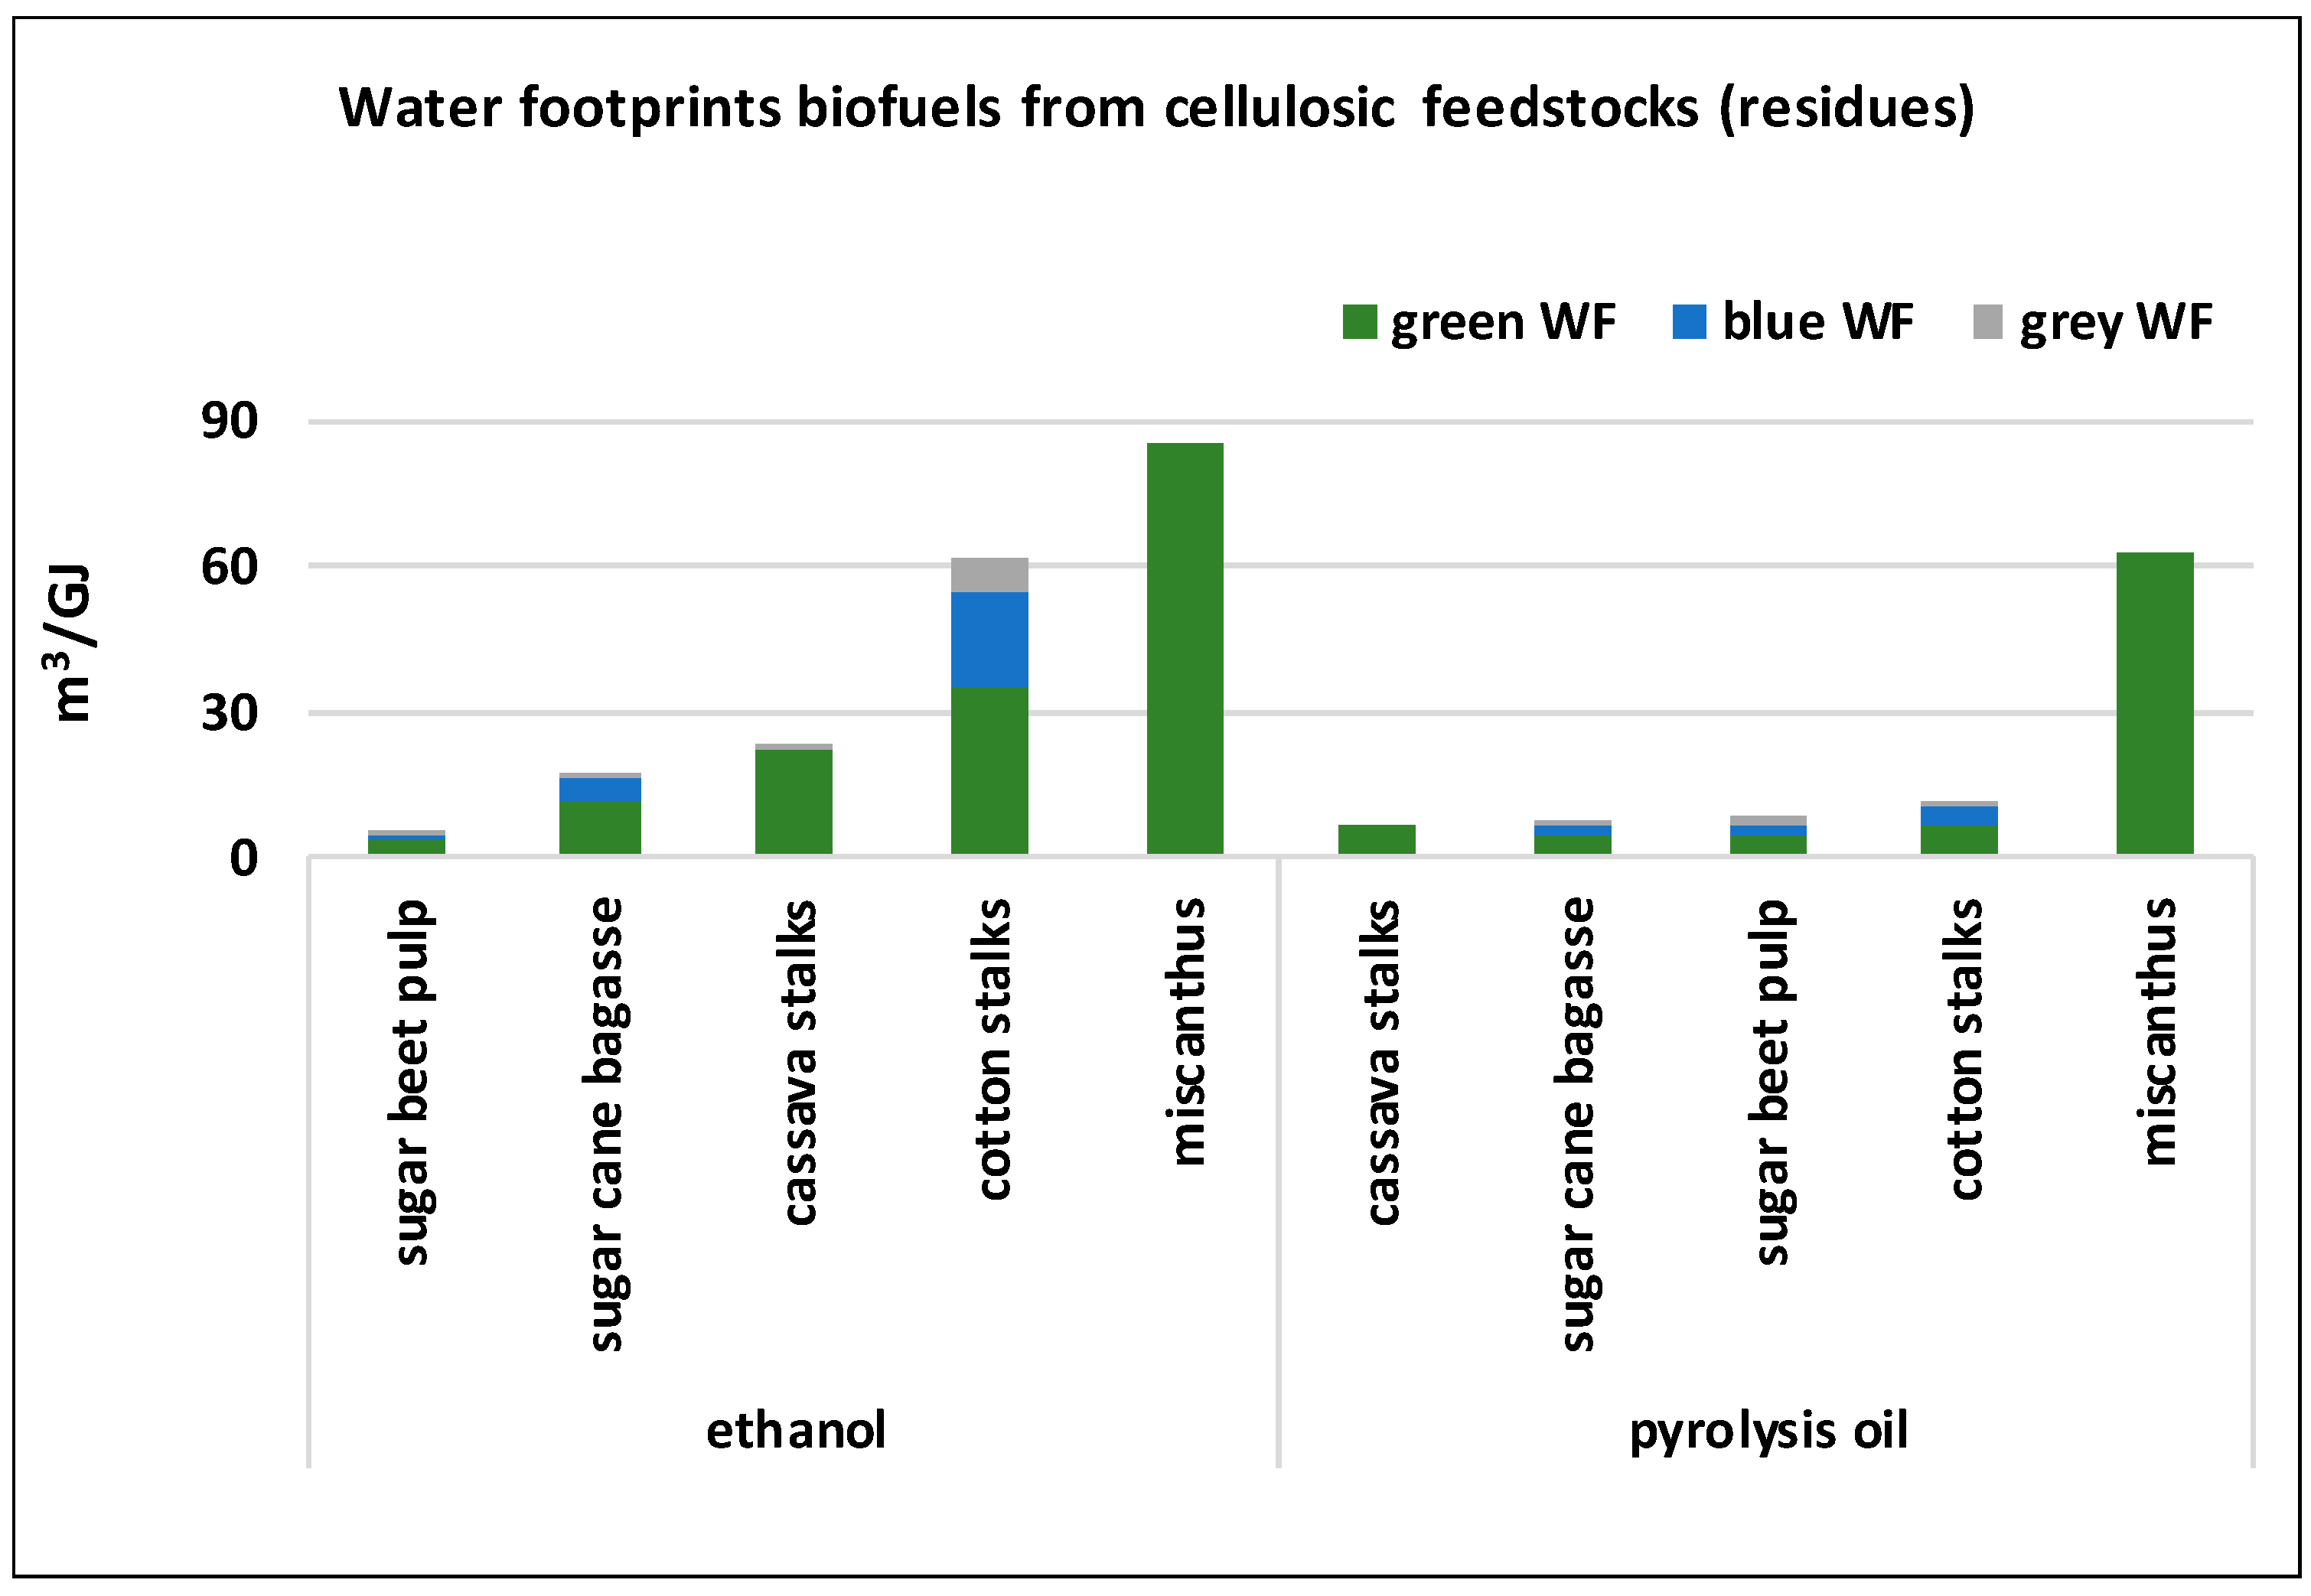
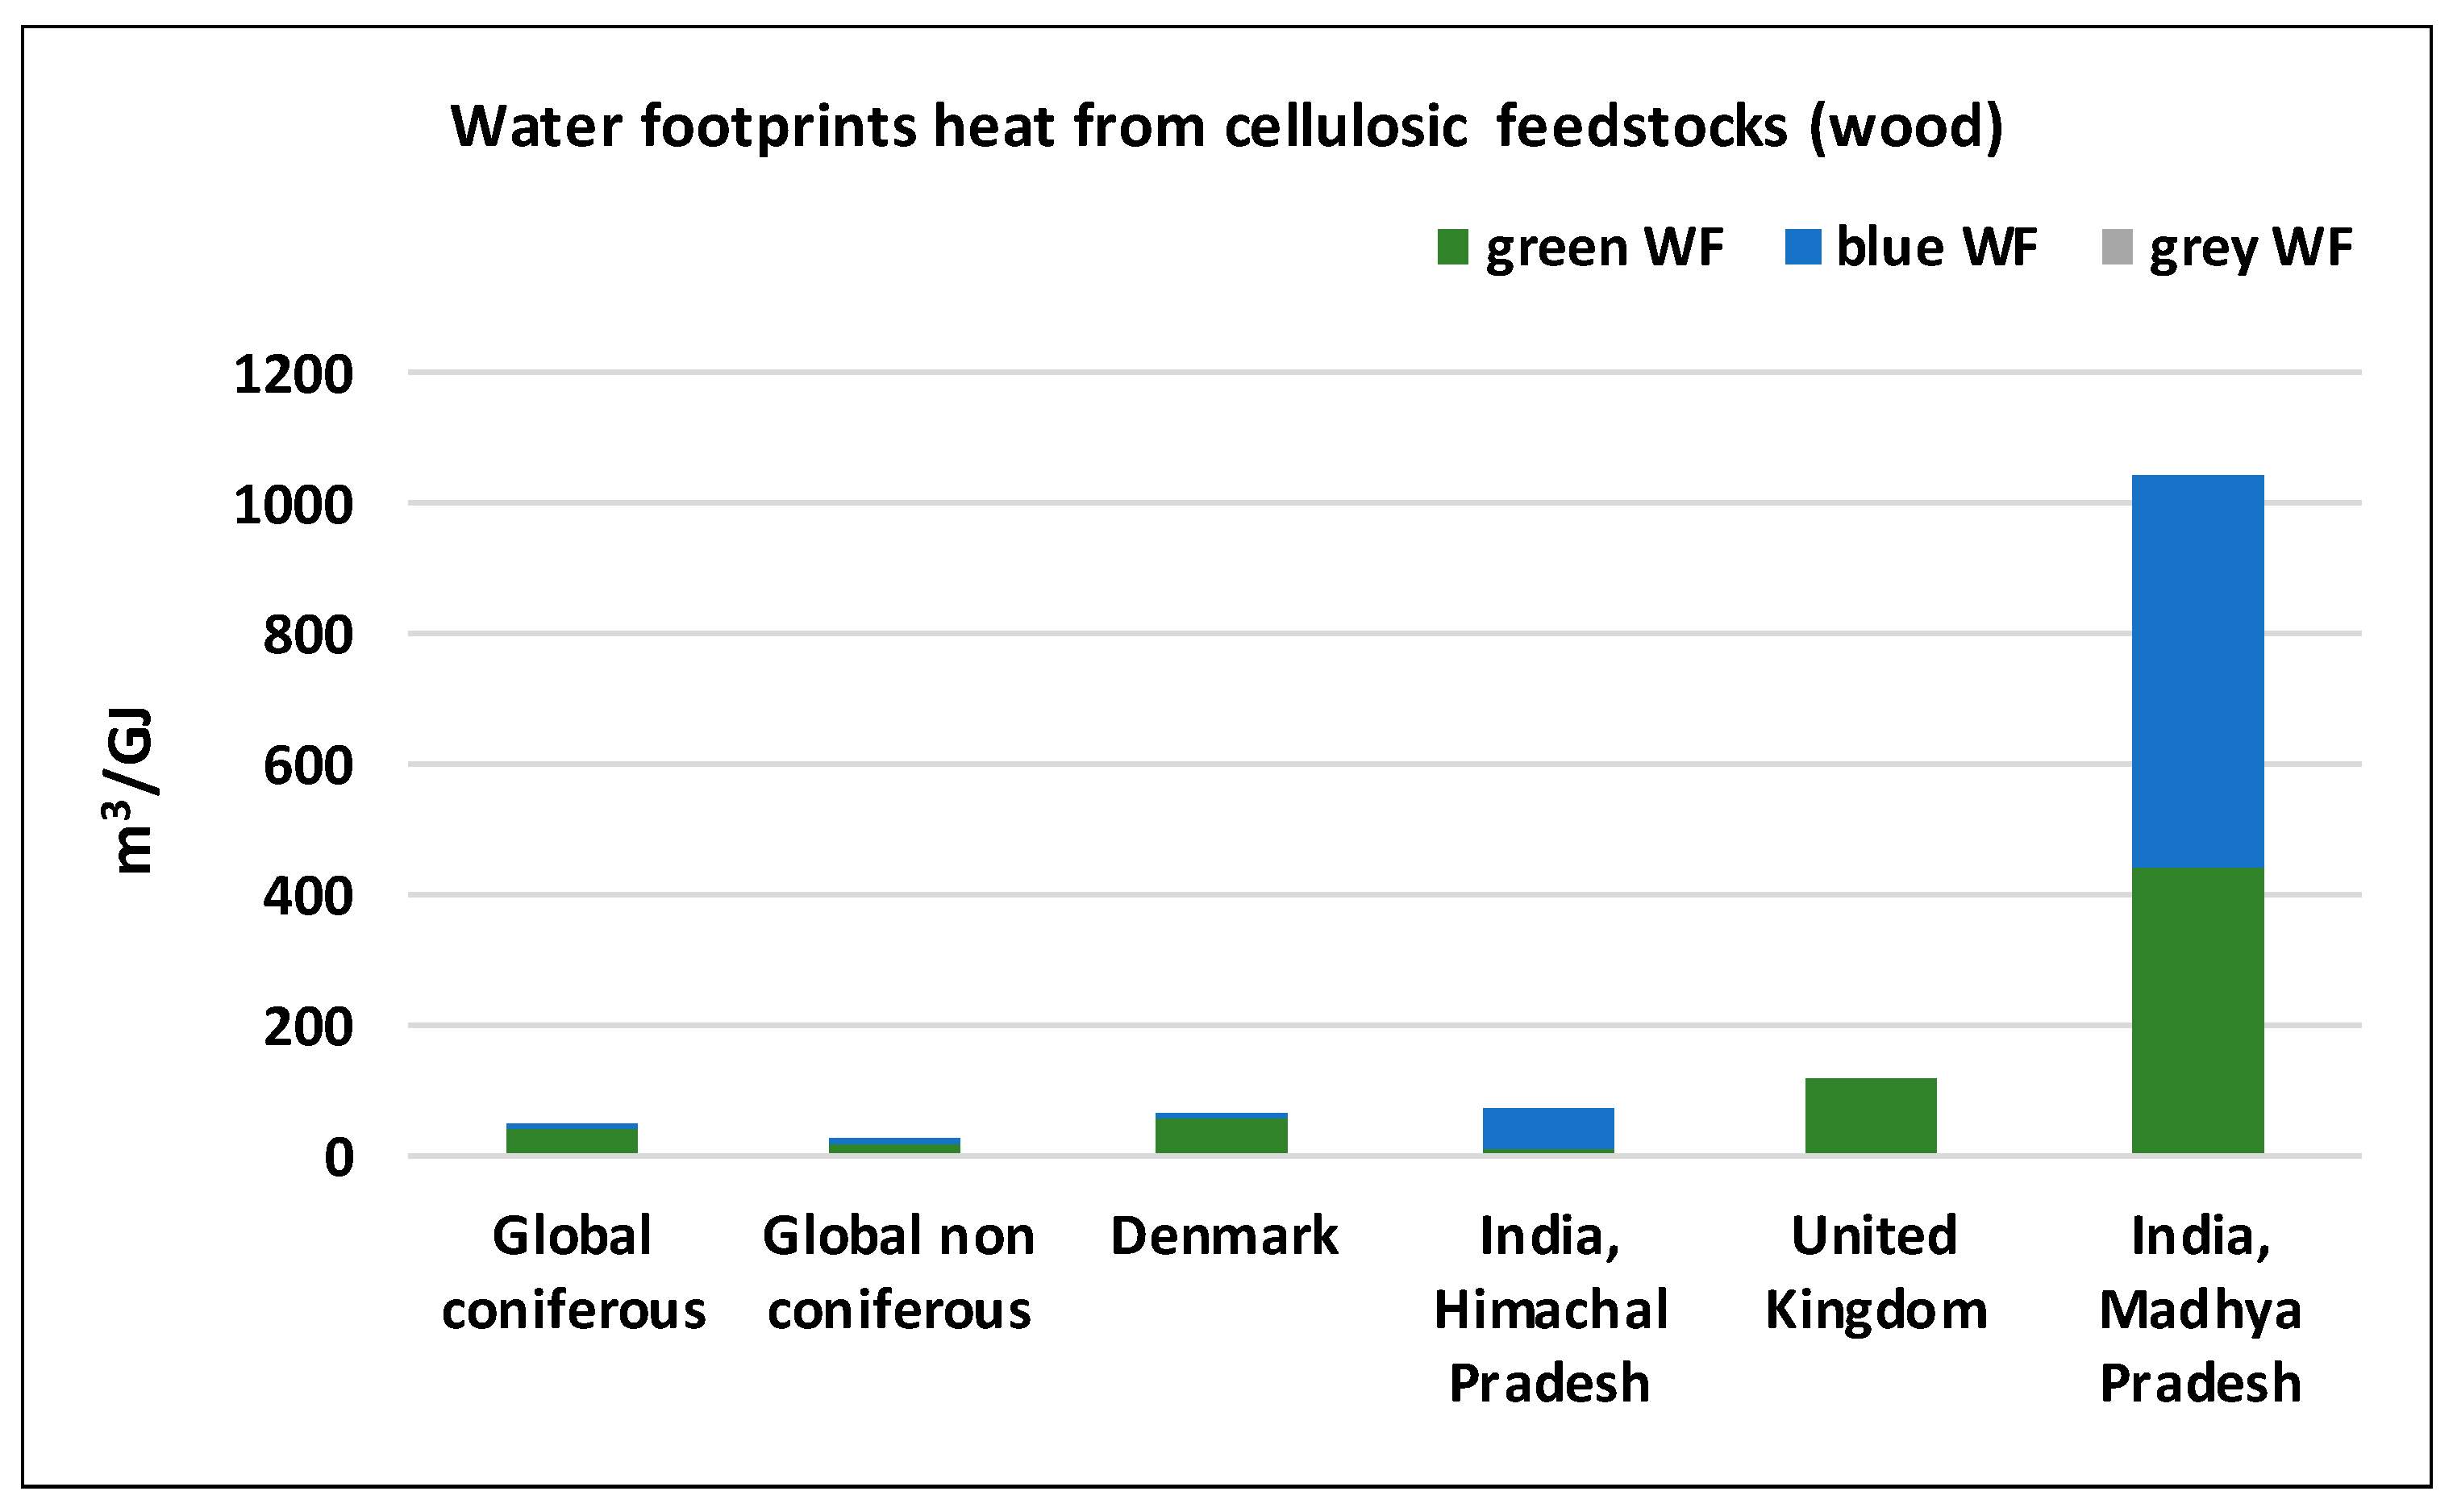
4.2.2. WFs of Cellulosic Feed Stocks

In general, the use of food crops for bioenergy has large disadvantages because water and land applied to produce bioenergy cannot be used for food production anymore [35]. Only if land and water resources are not available to grow food crops, energy crops, e.g., Miscanthus, for cellulosic feed stocks might be considered [1] (Hoekstra). Another option to produce cellulosic feed stocks for bioenergy is to convert agricultural residues from crops into energy carriers. The analysis of Mathioudakis et al. [12] gives an overview of conversion technologies from a water perspective to generate bioenergy from energy crops and crop residues. Figure 2 shows WFs for ethanol and pyrolysis oil from some cellulosic feedstocks, including crop residues and Miscanthus.
In general, WFs for ethanol from cellulosic feedstocks are larger than for pyrolysis oil. This is contrasting to the WFs of ethanol and biodiesel from food crops. Figure 2 shows that the green WF for biofuels from the energy crop Miscanthus was larger than for fuels from the crop residues. The study also gives a new perspective on WFs. When a crop is grown for food, the water requirement of the crop is fully allocated to the crop, while the non-edible parts, like stems, are considered wastes. However, if wastes have another function, e.g., the use for energy purposes, wastes are no longer wastes, but residues with a value. In that case the crop WF needs to be reallocated over the crop and the residue, as has been shown by [12]. An important issue in this respect, however, is whether these crop residues are really available or not. Mathioudakis et al. [12] assumed that 10% of the residues needs to return to the agricultural soils to enhance soil organic matter content. Additionally, other residue functions are possible, e.g., the use of straw in stables, so that studies need to take these other functions into account when calculating energy potentials from residues.
Figure 3 shows the WFs of wood, another cellulosic feedstock. A recent WF study on firewood [14] has made a new analysis on the WF of wood, showing that trees not only have a green WF but can also have a blue one, even when no irrigation is applied. Some trees not only use rainwater. If the roots reach the groundwater trees also have blue water consumption [14,36]. The new method to calculate WFs of trees was adopted for a study into the WFs of wood consumption in India where firewood is traditionally used for cooking [37].
There are large differences among WFs for wood. The study of Schyns et al. [14] calculated only a minor contribution of blue WFs compared to green WFs. However, Das et al. [37] found much larger contributions of blue WFs for wood from India. In general, different trees probably have different WFs and different strategies to capture water. WF differences depend on tree species and environmental conditions, e.g., groundwater depth, climate and soils. The different WFs generated by Schyns et al. [14] and Das et al. [37] show that probably WFs of trees also show large differences, like WFs of crops, and that more research is needed to make an inventory of WFs of trees.
Scenario studies showed the implications of possible use of renewables with large WFs, but traditional fuelwood use has always been excluded. Das et al. [37] for the first time included traditional firewood use in a developing country and showed the enormous impact on WFs that are even larger than WFs of food. Including developing countries in future research is relevant, because in these countries large changes will take place.

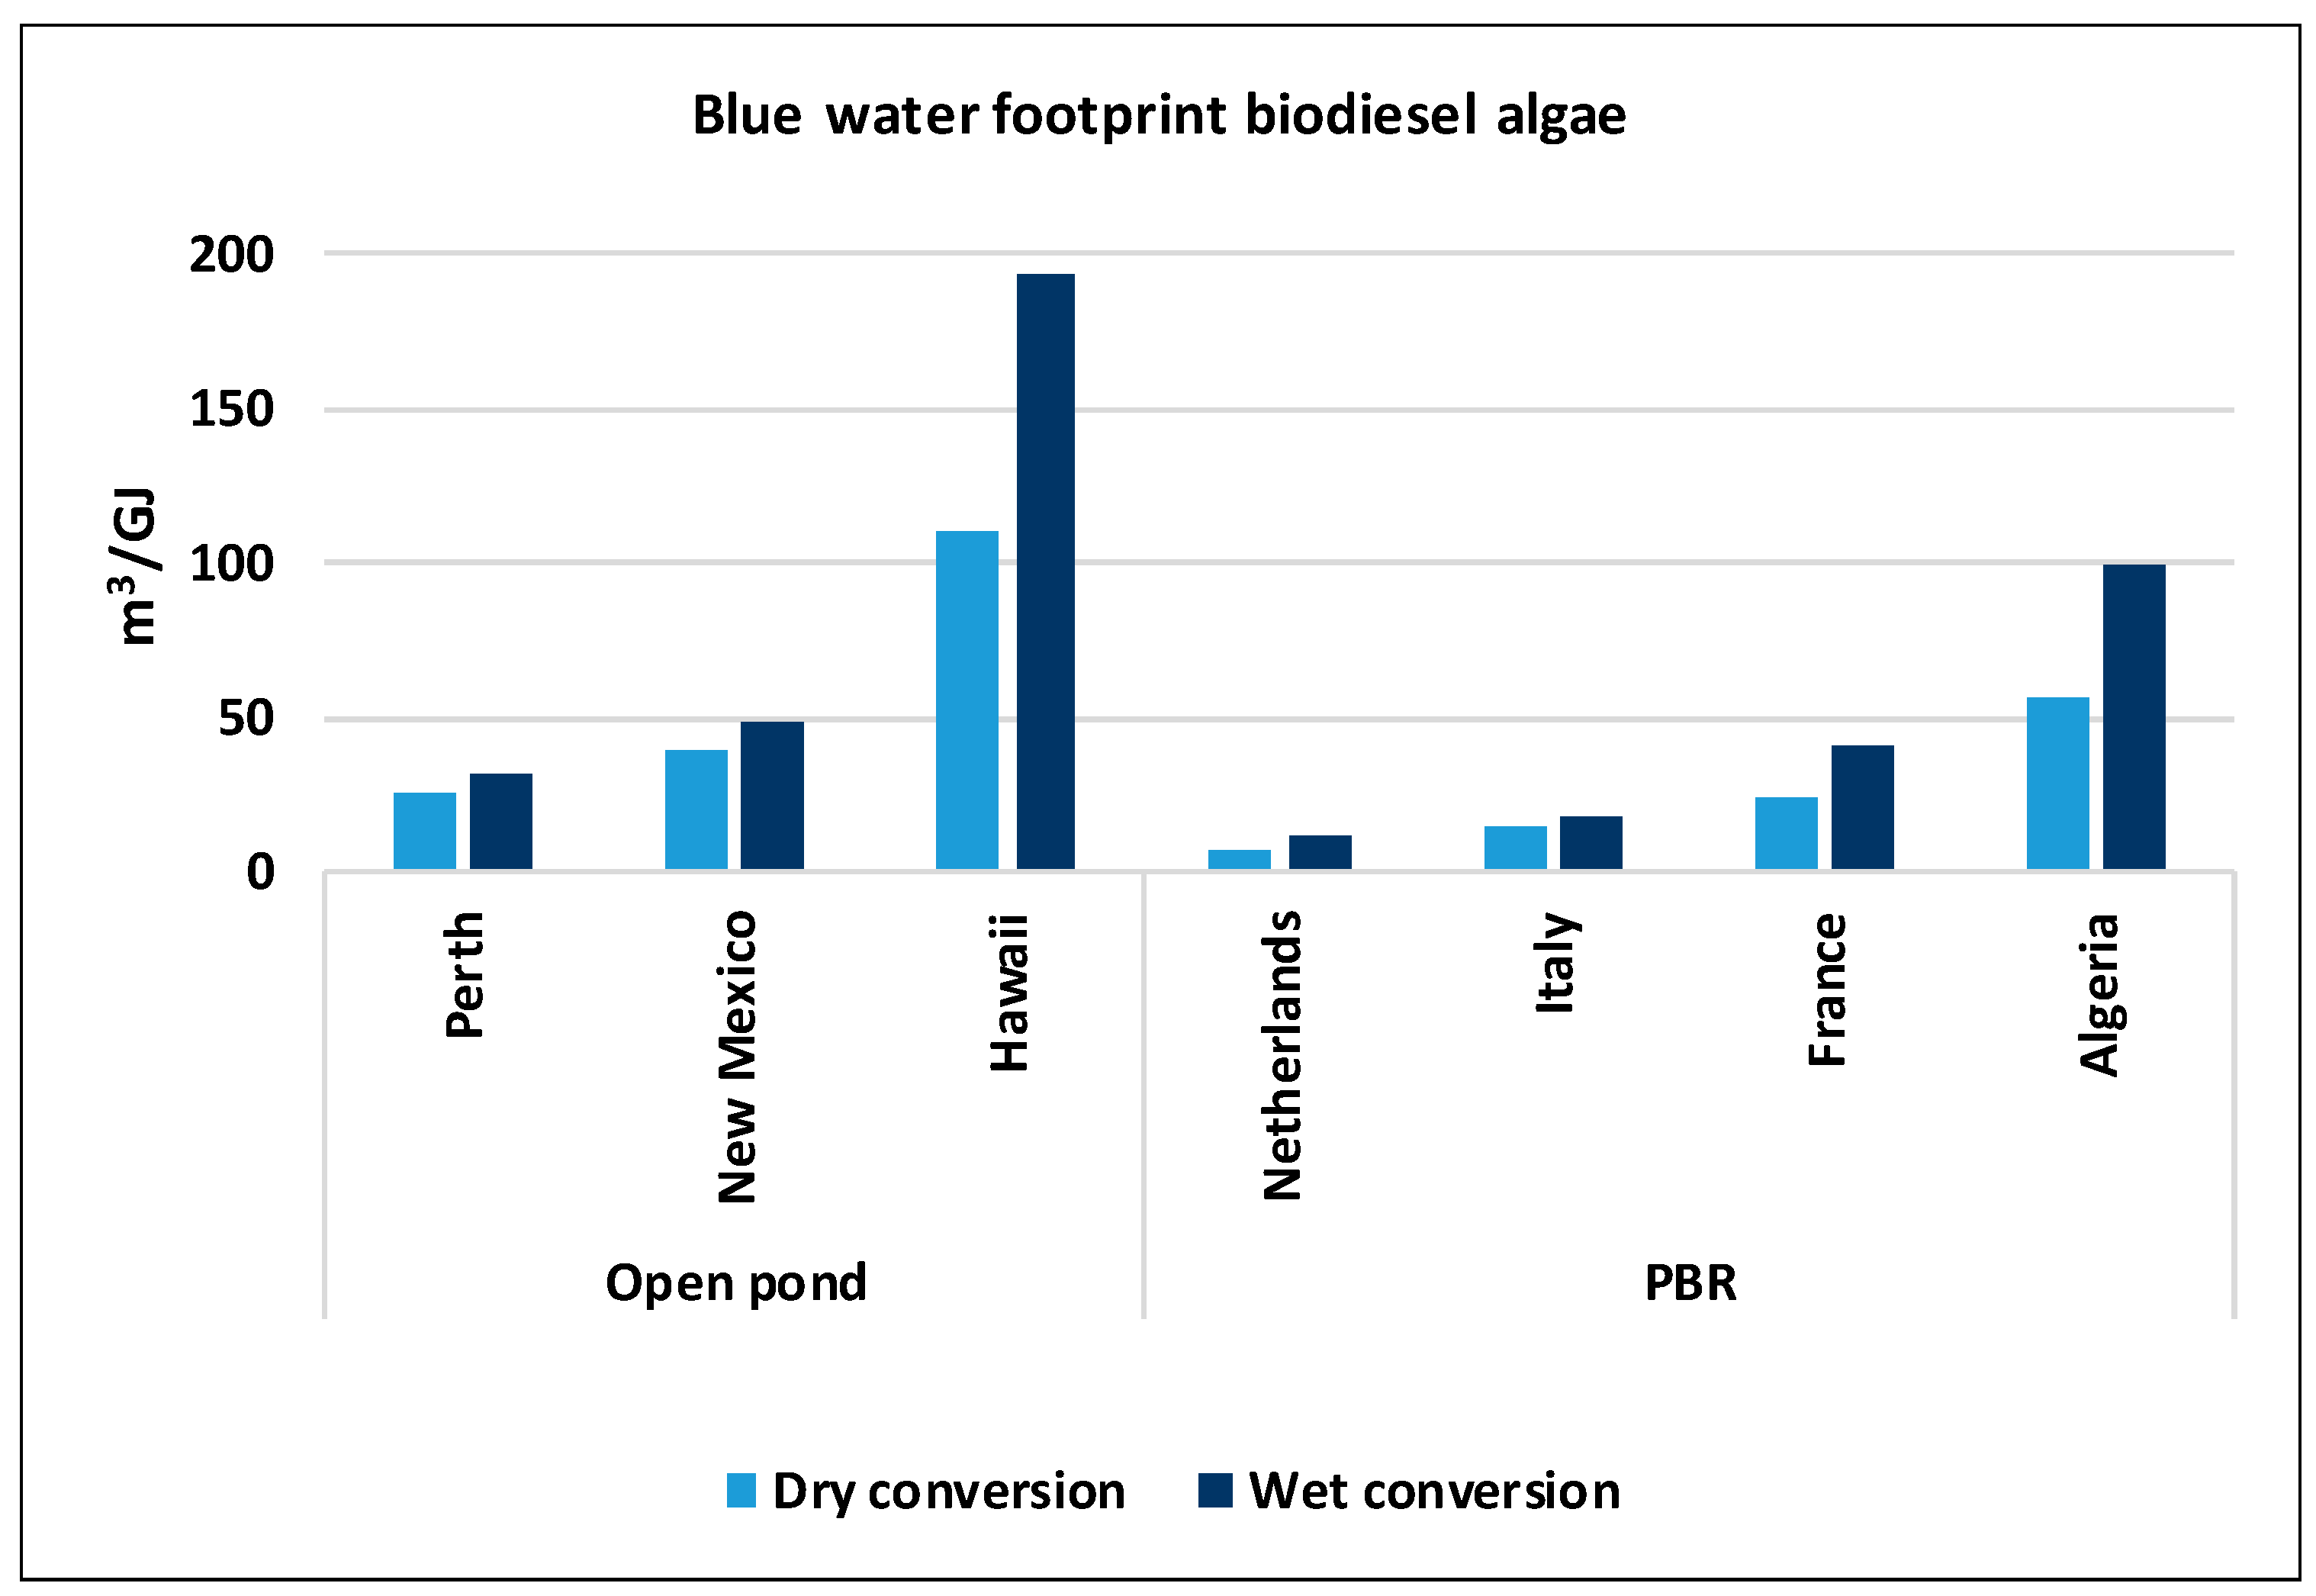
4.2.3. Water Footprints of Biofuels from Algae

In the search for new types of bioenergy that do not compete with food production interest was raised into microalgae. Microalgae contain oil that can be converted into a biofuel [38,39]. There are many different algae types, an important distinction is between salt and freshwater algae. However, for algae production, salt water algae are grown in freshwater with added salt to control water quality [13]. Figure 4 shows the blue WFs of biodiesel from algae from seven locations and two production technologies, dry and wet conversion [13]. In the wet conversion route, lipids are extracted from slurry and treated to produce biodiesel, while residues are converted using supercritical water gasification (SCWG) technology, producing hydrogen (H2), methane (CH4), ethane (C2H6), propane (C3H8) and carbon monoxide (CO). Dry conversion starts with the dry extraction of lipids, after which the lipids are converted to biodiesel and glycerol through a transesterification process. The residue (oil cake) is pyrolyzed to produce pyrolysis oil and biogas [13].
In general, blue WFs are larger for biodiesel produced in open ponds than in photo bioreactors, and for dry conversion. However, differences among countries are large.

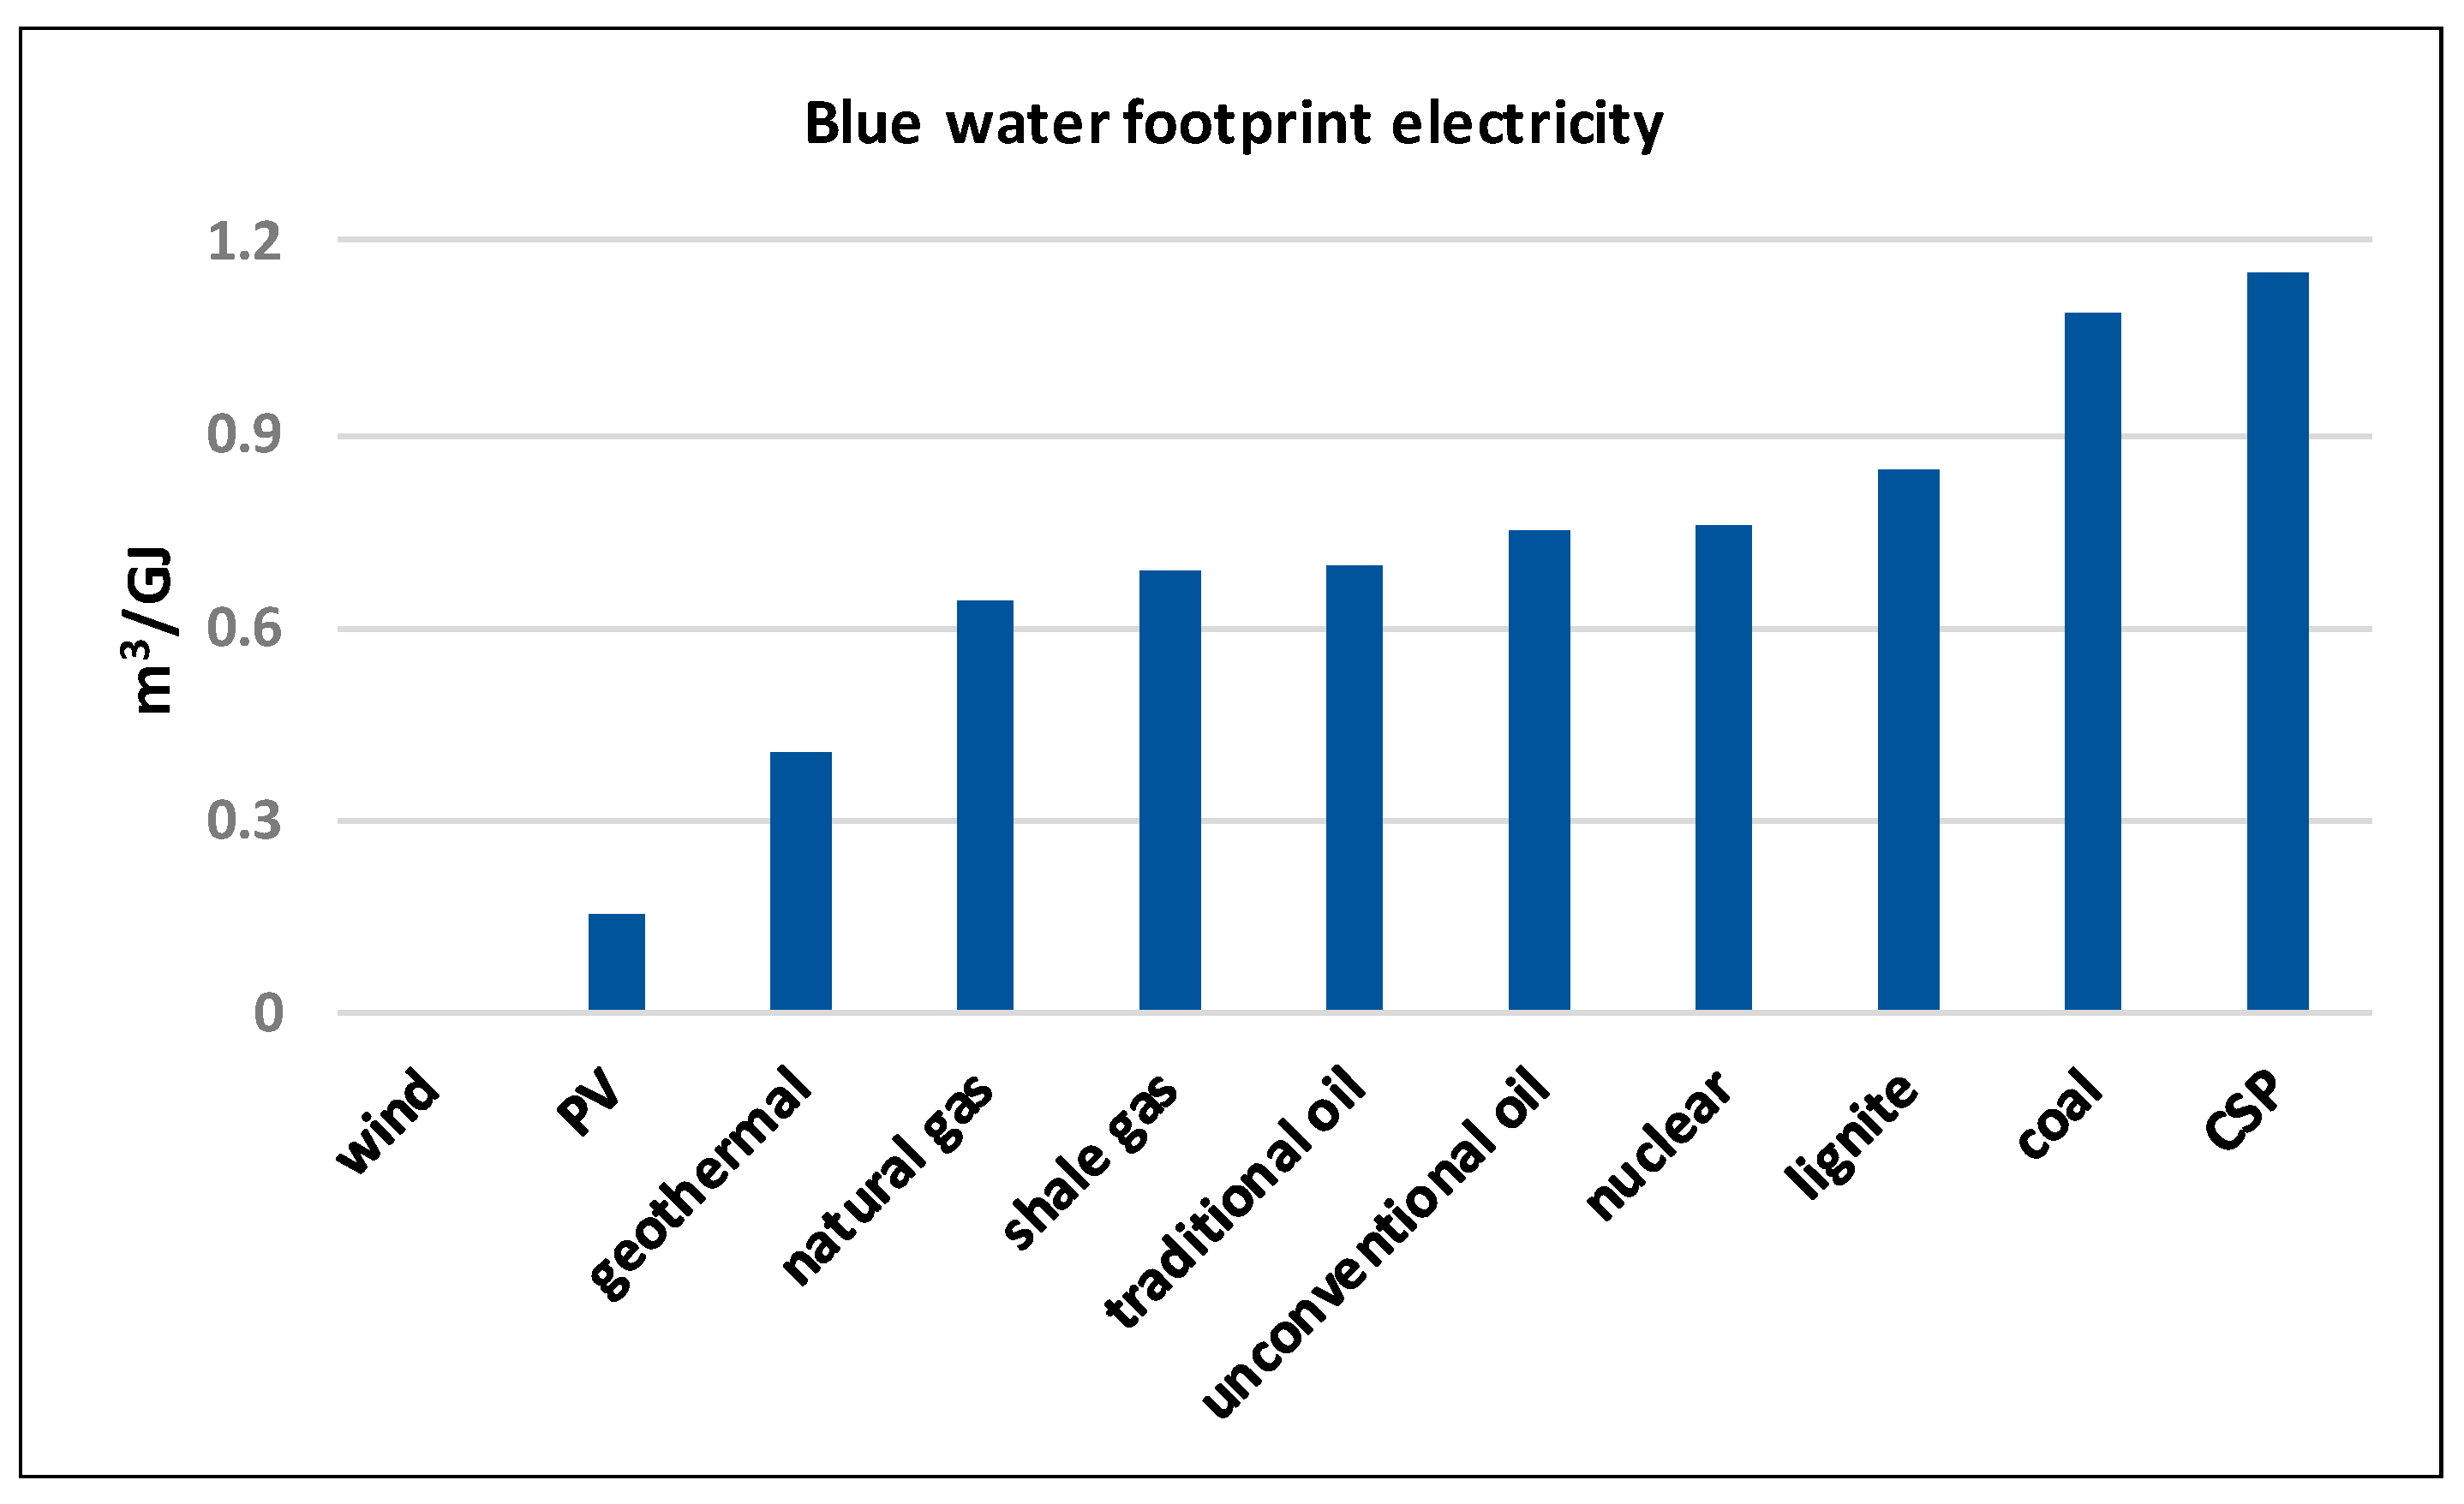
4.2.4. Water Footprints of Electricity

At present, most electricity is generated using thermal power plants and a fossil fuel, like coal, natural gas or traditional oil [8] (IEA, 2019). Water is needed for cooling and for the mining of the fuel. Renewables like wind energy, photovoltaics (PVs) and concentrated solar power (CSP) also need water for the production of the infrastructure and for CSP also for cooling and operation. Figure 5 shows the blue WFs of electricity form wind, PV, geothermal, natural gas, shale gas, traditional and unconventional oil, nuclear, lignite, coal and CSP from Mekonnen et al. [4]. The blue WFs of electricity from hydropower and wood are so large that they are discussed separately.
The blue WFs of electricity, without hydropower or biomass, were between 0.007 (0.002–0.012) m3/GJ for wind energy and 1.15 (0.1–2.2) m3/GJ for CSP. Electricity from fossil fuels and from PV, geothermal and nuclear energy fell in this range. For wood WFs were much larger. The green WF was 210–1100 m3 per m3, which translates into 19–100 m3 per GJ of heat and 48–500 m3 per GJ of electricity [4]. Much larger than the other electricity types.

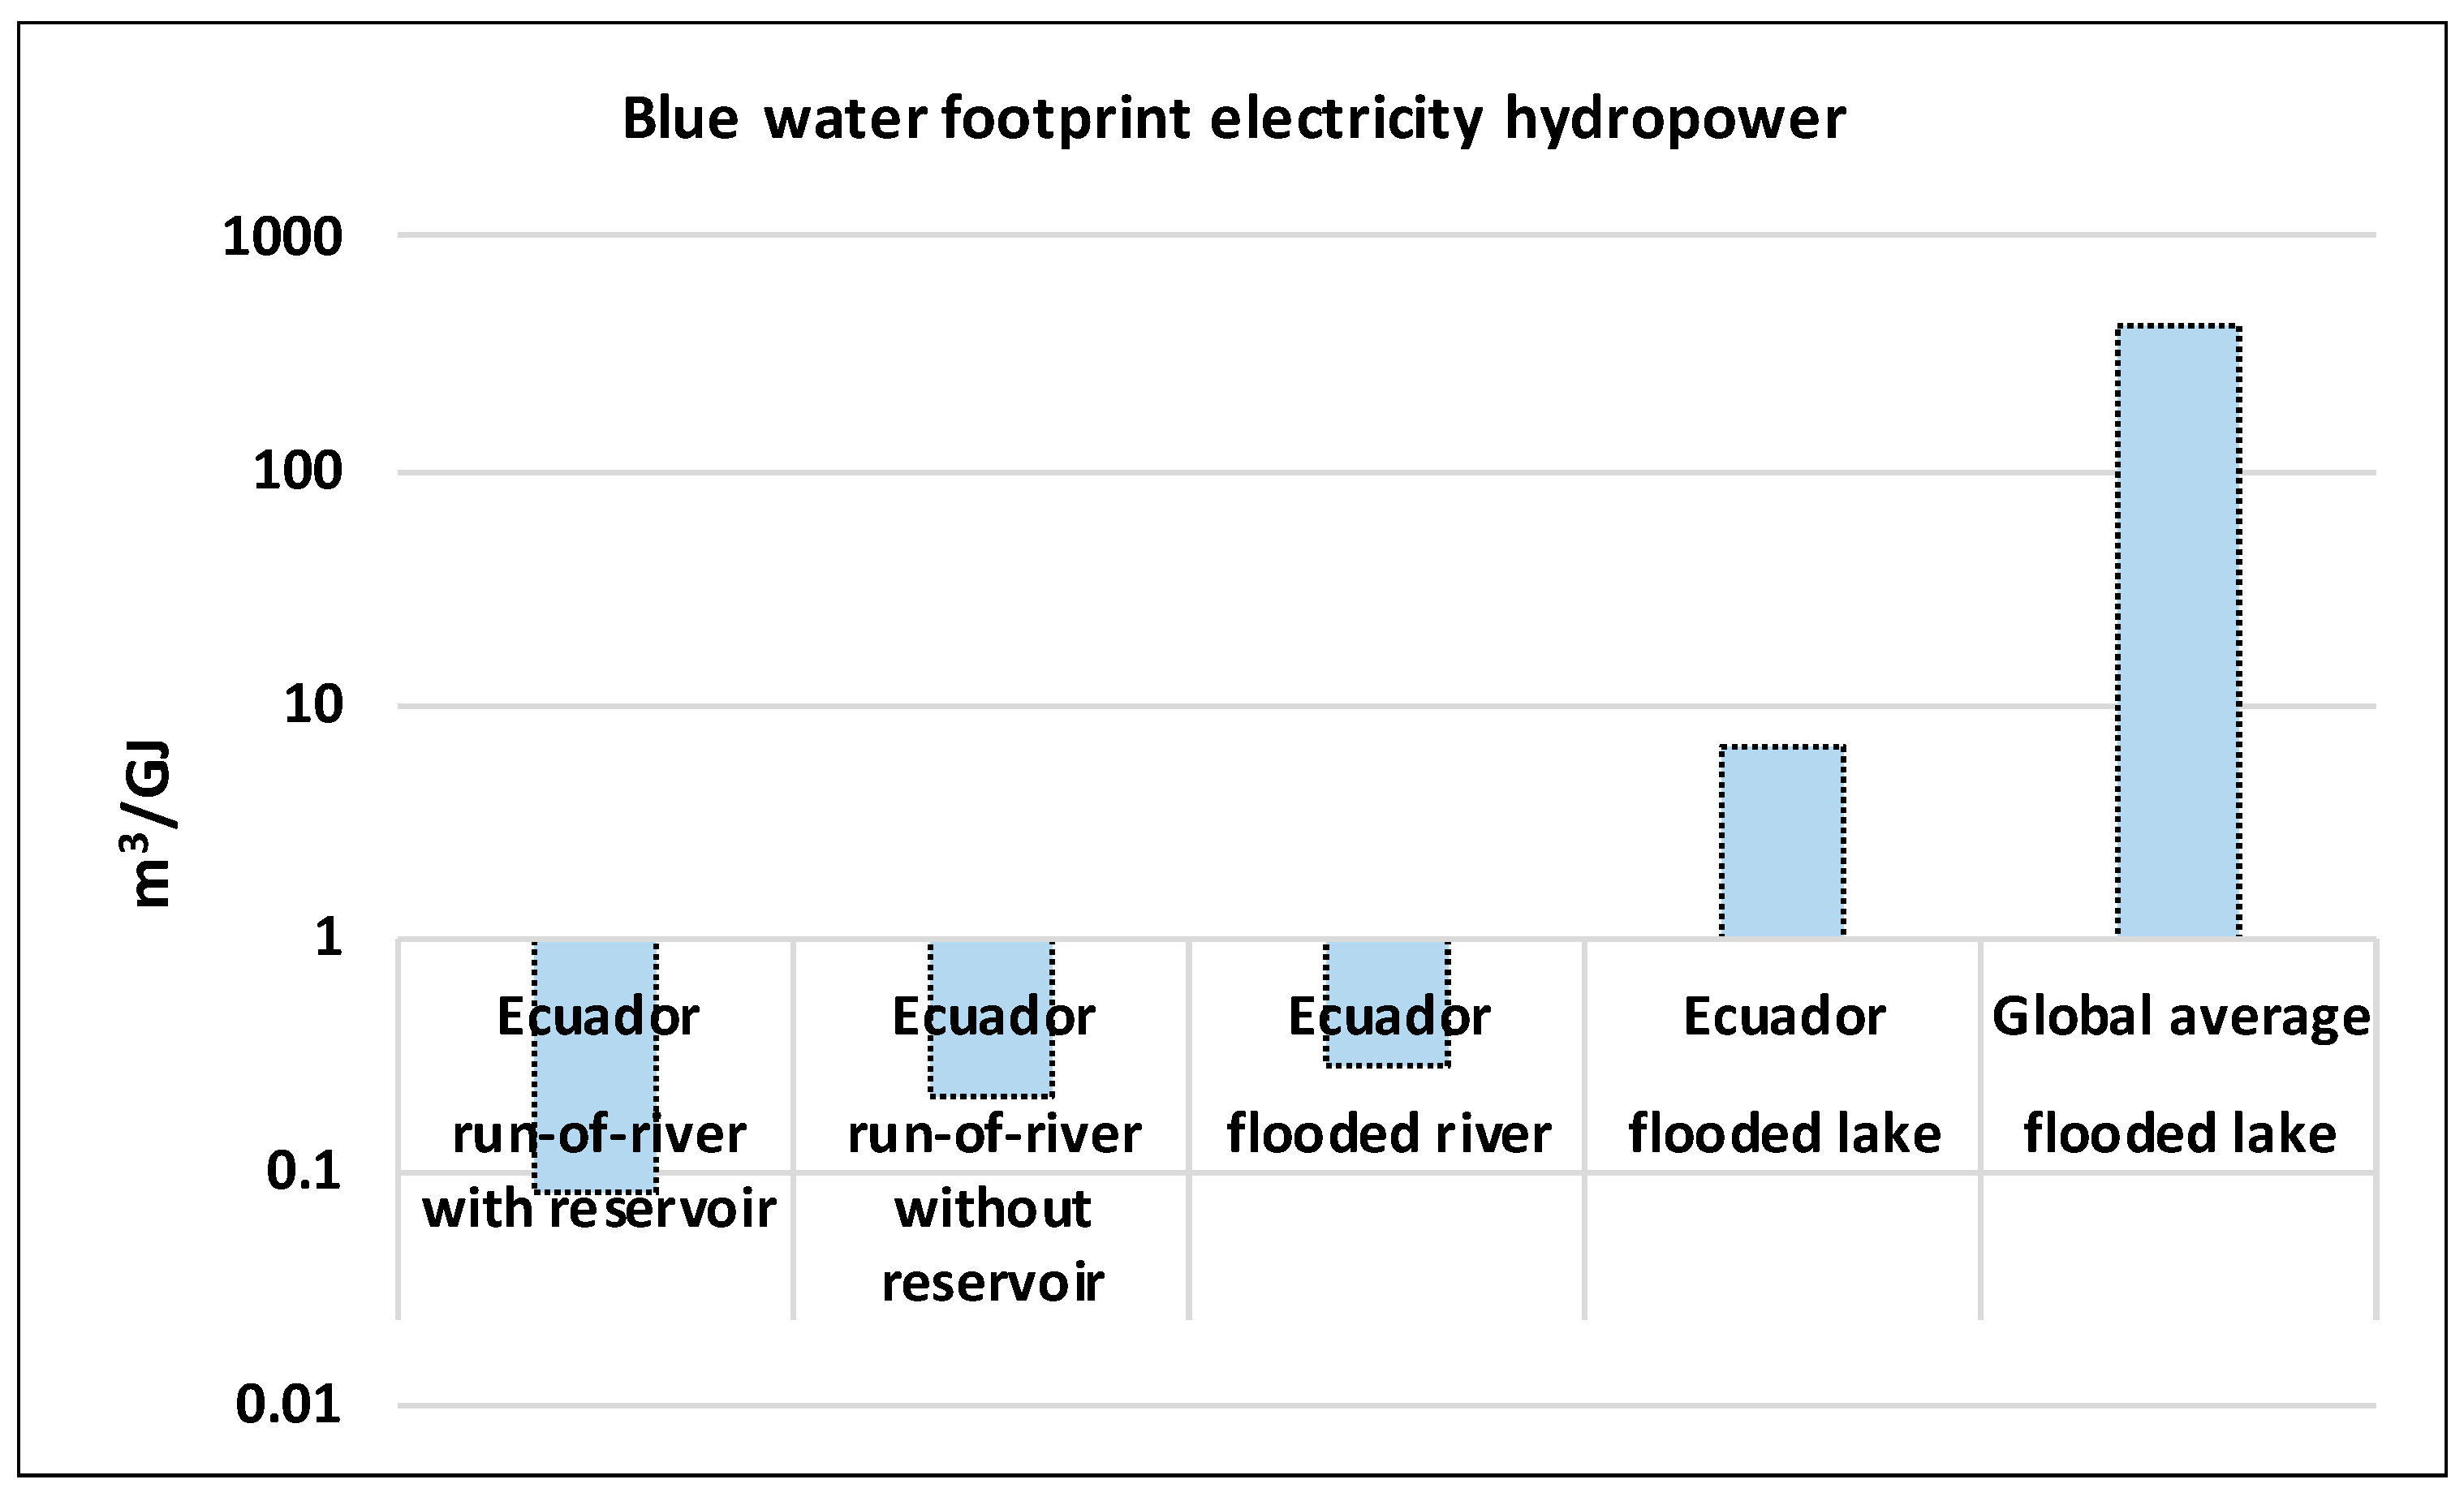
4.2.5. Water Footprints of Hydropower

Water footprints of hydropower are larger and have wider differences between power plants than other power generating technologies. Mekonnen and Hoekstra [40] estimated the blue WF of large dams around the globe and found that the WF of these hydropower plants range between 0.3 and 850 m3 per GJ of electricity. Similarly, Liu et al. [15] found a large variation between Chinese hydropower plants (0.001–4234 m3 per GJ of electricity). Differences are mainly due to climatic factors, artificial lake surface, which is based on the power plant infrastructure and geography [41], and electricity output. A more recent study also included small scale hydropower generation indicating that, on average, WFs can be much smaller than assumed before, if the infrastructure is wisely chosen [5] (Vaca-Jimenez, 2019). Figure 6 shows the blue WFs of hydropower for four hydropower types in Ecuador and the global average hydropower WFs indicating the wide differences.
In Ecuador hydropower from run-of-river and flooded river systems range between 0.08 and 0.28 m3 per GJ of electricity, smaller than the lowest value in the range of Mekonnen et al. [4]. For hydropower with flooded lakes and dams, WFs in Ecuador of 6.6 (0.02–13.1) m3 per GJ of electricity are much smaller than the global average of 425 m3 per GJ of electricity. This probably has to do with the specific climatic and physical circumstances in Ecuador, such as relatively small evaporation rates and deep artificial lakes with small surfaces, in combination with efficient electricity generation. The figure shows that wisely chosen hydropower systems do not necessarily have large blue WFs and might have a role in renewable energy mixes.
We stress that conditions in Ecuador can differ from those in other countries. Further research is required, given the high demand for hydro in developing countries as a mean to offset carbon emissions and bridge the energy and electricity gaps. The results for Ecuador show that different types of hydropower have different WFs. Before installing hydropower, policy should include the overall water implications of this electricity source and compare results with other alternatives before further development. This is of course also relevant if dams have other functions besides hydropower, e.g., irrigation or flood protection.
Currently, there still is a debate within the community on the methodology to estimate the WFs of hydropower. In the literature one can find four main approaches: the gross, the net, the water balance and the scarcity WF [41]. All of them have a few differences and they contribute to different types of research questions. However, they all agree that there is the need to estimate the evaporation from open water surfaces of hydropower to understand its consumption.

4.3. Applications of Quantitative Data for Energy Consumption Analysis

4.3.1. Water Footprints of Transport

In general, transport is considered as a CO2 emitter, not as a water user. For example, the European Union (EU) promotes the use of transport fuels from renewable sources in an attempt to decrease CO2 emissions in its member states [33]. This means that the replacement of fossil fuel-based transportation fuels to decrease CO2 emissions causes a trade-off, because biofuels need more water. The study of Gerbens-Leenes and Hoekstra [42] applied the WF data for transport fuels to show the different WFs related to transportation modes and fuel use. Especially the EU directive to replace fossil fuels by biofuels increases WFs. Even a replacement of only 10% of presently used transport fuels, using the most water efficient biofuels, causes a WF of 60 Gm3 or 10% of the present EU WF for food and cotton. The recent study of Gerbens-Leenes and Holtz [43] indicated that electricity or hydrogen are favorable to fuel transport, but this will depend on the source of the electricity system. If the electricity comes from large hydropower, the WF may not be so favorable.

4.3.2. Consequences of IEA Energy Scenarios for Water

The International Energy Agency (IEA) is an important organization on energy issues, providing annual reports, the world energy outlooks. The reports give information on present energy use and forecasts for the future, e.g., on expected CO2 emissions. In 2012, the IEA for the first time showed the implications of future energy use on water [44]. The study of Mekonnen et al. [45] made an analysis of the consequences of implementing IEA scenarios for water. The IEA scenario with the smallest CO2 emissions has the largest WF, which is dominated by WFs of firewood and hydropower. The study showed the importance of trade-offs. It is not only important to decrease CO2 emissions, but also to consider other natural resources like water. The trade-off could be shown because data on WFs of different fuel sources were available, especially WFs of energy sources with large WFs, i.e., firewood, biofuels and hydropower, that could be derived from earlier WF studies and combined with energy consumption data, so that the enormous WFs of some energy mixes with large renewable energy contributions became clear.

5. The Way Forward

WFs have a temporal and spatial dimension [26]. The spatial dimension is very well shown in the database available at the website of the water footprint network [7], indicating the WFs per crop per country at a provincial level. WFs were calculated though based on average weather data for the period 1996–2005. It would be interesting to assess whether there are large differences among years, or even between seasons, and between green and blue WF fractions among years. The impact of climate change on WFs is also relevant [46]. Crops are bound to their growing season, so there is limited flexibility with regard to their growing season. This would require climate modeling to assess future WFs.
A source with large flexibility is hydropower. If there is sufficient water, e.g., stored in an artificial lake, hydropower can be generated with continuous water consumption through evaporation. However, hydropower is a dynamic system with WFs that are highly flexible, not only depending on the specific technology applied, but also on the time of the year [47]. Future studies should include this dynamic aspect of hydropower to establish its role in a water wise electricity mix in a specific country or region. Moreover, studies like Zhao and Liu [48] or Hogeboom et al. [49] addressed the WF of hydropower based on the allocation of water evaporation to the different purposes of reservoirs, e.g., hydropower, irrigation, flood-control, etc. These studies were made based on an average annual basis. However, different purposes in a reservoir have a seasonality, e.g., a reservoir can only provide flood-control when the flood season happens, or irrigation during dry seasons, while hydropower and recreation may happen all year long. Therefore, allocating evaporating losses throughout the year to these purposes may be underestimating the WF of the year long purposes. Future studies may need to assess the water allocation considering seasonal fluctuations.
Many studies have assessed the green and blue WFs of products and consumption patterns, while most grey WF studies included nitrogen losses in agriculture assuming a nitrogen loss of 10% and a maximum concentration of 10 mg/liter of nitrate-nitrogen (NO3-N) while natural nitrogen concentrations were assumed zero [7]. Wöhler et al. [50] extended the grey WF study and assessed the grey WF of human and veterinary pharmaceuticals for the first time. Biofuels produced from agricultural crops not only cause grey WFs due to nitrogen application, but also due to the application of chemical substances like pesticides. Possibly these chemicals also increase grey WFs of energy derived from agriculture. Grey water footprints related to water pollution have not received as much attention as green and blue WFs. This could be relevant particularly for energy. Future studies should also take into account water pollution from mining, e.g., coal mining and mining of metals for solar panels, or shale gas production into account.
The WF of energy studies mentioned above showed the WFs of energy, including electricity, in the production chain. Information on blue WFs of energy sources, e.g., coal, relates mainly to data from grey literature. However, information on pollution related to mining generating a grey WF is not available. For electricity generation, information on blue WFs related to cooling is available. However, if cooling water returns to where it originated, water temperatures increase, creating a grey WF. Future studies on WFs of energy should also include these aspects.
The potential of agricultural residues as energy sources and their impact on WFs has been assessed by Mathioudakis et al. [12]. The study assumed that 10% of available residues had to be returned to the soil. An important question and a topic for future studies is whether the residues are actually available for energy or are already in use elsewhere, e.g., to improve soil quality.
An important aspect of the relationship between water and energy is the position of policy, which still needs to meet the goals for the reduction of carbon dioxide emissions, as well as maintaining energy supply. In our study on water implications of the energy scenarios of the International Energy Agency (IEA) for 2035, we showed that the scenario with the smallest carbon footprint had the largest WF, mainly due to large-scale use of hydropower and biomass [45]. In 2010, electricity from solar, wind and geothermal, with relatively small WFs, contributed 1.8% to total energy supply, but increased to 19.6% in the IEA’s ‘450 scenario’, contributing to the reduction in the WF. However, the growing use of firewood and hydropower in the energy mix completely dominates the WF. Policy should support solar, wind and geothermal energy because they have the smallest WFs. If other energy sources are also included in the mix, particular attention needs to be paid to water constraints, e.g., selection of cooling types of power plants or hydropower types with small WFs.

6. Conclusions

Water footprint (WF) studies have made a significant contribution to scientific knowledge on water for energy relationships, or the so termed water–energy nexus. The energy source categories for which WF studies have been conducted include: 1. biofuels from sugar, starch and oil crops; 2. cellulosic feedstocks; 3. biofuels from algae; 4. firewood; 5. hydro-electricity and 6. various sources of energy including electricity, heat and transport fuels. These studies have shown that especially 1, 3, 4, 5 and to a lesser extent 2 have relatively large WFs. This is because the energy source derives from agriculture or forestry, which has a large WF in their production (1,2,4), or has large evaporation from open water surfaces (3,4). Energy from agriculture has relatively large green WFs, when irrigation is applied also blue WFs and a grey WF related to fertilizer use. Energy from forestry not only has large green WFs, but sometimes also a blue WF, even if trees are not irrigated. Biofuels from algae and hydropower have only blue WFs. WFs for these categories can be calculated using the WF tool. Category 6 includes fossil fuels and renewables such as photovoltaics and wind energy and has relatively small blue WFs. However, information needs to be derived from industry. The WFs for energy are applied for different energy consumption applications, e.g., for transportation indicating options with small water footprints, or for energy scenario’s identifying trade-offs between carbon dioxide emissions and water use. Future studies could include temporal dimensions of WFs, grey WFs related to pesticides in agriculture, heat pollution, or pollution related to mining.

Author Contributions

Conceptualization, W.G.-L.; investigation, W.G.-L.; writing—original draft preparation, W.G.-L.; writing—review and editing, W.G.-L., S.V.-J., M.M.; visualization, W.G.-L. All authors have read and agreed to the published version of the manuscript.

Funding

This research received no external funding.

Acknowledgments

We dedicate this article to our esteemed friend Prof. Arjen Y. Hoekstra (1967–2019) who passed away suddenly in 2019.

Conflicts of Interest

The authors declare no conflict of interest.

Appendix A

Table A1. Overview of green, blue and grey water footprints for different energy types (m3/GJ).
Energy Type Green Water Footprint
(m3/GJ)
Blue Water Footprint
(m3/GJ)
Grey Water Footprint
(m3/GJ)
WFs of biofuels from sugar, starch and oil crops a
EthanolSugar caneGlobal average60256
Peru21265
Cuba154221
Pakistan389912
Sugar beetGlobal average311010
Belgium1905
Iran2113317
China57032
MaizeGlobal average94819
Germany44012
Egypt1410748
India218616
BiodieselRapeseedGlobal average1452029
Canada232030
China118042
India14112920
France100016
Germany86021
WFs of cellulosic feed stocks
HeatWoodGlobal coniferous b460.6
Global non coniferous b210.3
United Kingdom c12200
Denmark c626
India, Himachal Pradesh d1163
India, Madhya Pradesh d445604
Ethanol eSugar beet pulp 411
Cassava stalks 2300.5
Sugar cane bagasse 1251
Cotton stalks 35207
Miscanthus 850-
Pyrolysis oil eSugar beet pulp 522
Cassava stalks 700
Sugar cane bagasse 520.5
Cotton stalks 741
Miscanthus 6300
WFs of biofuels from algae
Biodiesel f Netherlands040
Hawaii, U.S.0520
ElectricityCoal g 0.08–2.1
Lignite g 0.09–1.6
Traditional oil g 0.2–1.2
Unconventional oil g 0.2–1.3
Natural gas g 0.08–1.2
Shale gas g 0.08–1.3
Nuclear g 0.02–1.5
Concentrated solar power g 0.1–2.2
Photovoltaic g 0.006–0.3
Wind g 0.002–0.012
Geothermal g 0.007–0.8
Pv g 0.32
Wind g 0.08
HydropowerGlobal average g 0.3–850
Flooded lake Ecuador h 0.019–13.085
Flooded river Ecuador h 0.28
Run-of-river Ecuador without reservoir h 0.08
Run-of-river Ecuador with reservoir h 0.21
a Mekonnen and Hoekstra [7]. b Schyns and Vanham [36]. c Schyns et al. [14] Distribution total WF over green and blue based on EU data from b. d Das et al. [37]. e Mathioudakis et al. [12]. f Gerbens-Leenes et al. [13]. g Mekonnen et al. [4]. h Vaca-Jiménez et al. [5].

References

  1. Hoekstra, A.Y. The Water Footprint of Modern Consumer Society; Routledge: Abingdon, UK, 2013. [Google Scholar]
  2. Williams, E.D.; Simmons, J.E. Water in the Energy Industry. An Introduction. British Petroleum (BP). Available online: https://www.bp.com/energysustainabilitychallenge (accessed on 15 July 2020).
  3. Gerbens-Leenes, P.W.; Hoekstra, A.Y.; Bosman, R. The blue and grey water footprint of construction materials: Steel, cement and glass. Water Resour. Ind. 2018, 19, 1–12. [Google Scholar] [CrossRef]
  4. Mekonnen, M.M.; Gerbens-Leenes, W.; Hoekstra, A.Y. The consumptive water footprint of electricity and heat: A global assessment. Environ. Sci. Water Res. Technol. 2015, 1, 285–297. [Google Scholar] [CrossRef]
  5. Vaca-Jiménez, S.; Gerbens-Leenes, P.W.; Nonhebel, S. The water footprint of electricity in Ecuador: Technology and fuel variation indicate pathways towards water-efficient electricity mixes. Water Resour. Ind. 2019, 22, 100112. [Google Scholar] [CrossRef]
  6. Gerbens-Leenes, W.; Hoekstra, A.Y.; Van der Meer, T.H. The water footprint of bioenergy. Proc. Natl. Acad. Sci. USA 2009, 106, 10219–10223. [Google Scholar] [CrossRef] [Green Version]
  7. Mekonnen, M.M.; Hoekstra, A.Y. The Green, Blue and Grey Water Footprint of Crops and Derived Crop Products, Value of Water Res. Report Series No. 47; UNESCO-IHE: Delft, The Netherlands, 2010; Available online: http://www.waterfootprint.org/Reports/Report47-WaterFootprintCrops-Vol1.pdf (accessed on 12 October 2020).
  8. International Energy Agency (IEA). World Energy Outlook 2019; IEA: Paris, France, 2019; ISBN 978-92-64-18134-2. [Google Scholar]
  9. Gleick, P.H. Water and energy. Annu. Rev. Energy Environ. 1994, 19, 267–299. [Google Scholar] [CrossRef]
  10. Hoekstra, A.Y.; Mekonnen, M.M. The water footprint of humanity. Proc. Natl. Acad. Sci. USA 2012, 109, 3232–3237. [Google Scholar] [CrossRef] [Green Version]
  11. Gerbens-Leenes, W.; Hoekstra, A.Y. The water footprint of sweeteners and bio-ethanol. Environ. Int. 2012, 40, 202–211. [Google Scholar] [CrossRef]
  12. Mathioudakis, V.; Gerbens-Leenes, P.W.; van der Meer, T.H.; Hoekstra, A.Y. The Water Footprint of second generation bioenergy: A comparison of biomass feedstocks and conversion techniques. J. Clean. Prod. 2017, 148, 571–582. [Google Scholar] [CrossRef]
  13. Gerbens-Leenes, P.W.; Xu, L.; De Vries, G.J.; Hoekstra, A.Y. The blue water footprint and land use of biofuels from algae. Water Resour. Res. 2014, 50, 8549–8563. [Google Scholar] [CrossRef]
  14. Schyns, J.F.; Booij, M.J.; Hoekstra, A.Y. The water footprint of wood for lumber, pulp, paper, fuel and firewood. Adv. Water Resour. 2017, 107, 490–501. [Google Scholar] [CrossRef]
  15. Liu, J.; Zhao, D.; Gerbens-Leenes, P.W.; Guan, D. China’s rising hydropower demand challenges water sector. Sci. Rep. 2015, 5, 11446. [Google Scholar] [CrossRef] [PubMed] [Green Version]
  16. Gleick, P.H. Environmental consequences of hydroelectric development: The role of facility size and type. Energy 1992, 17, 735–747. [Google Scholar] [CrossRef]
  17. Gleick, P.H. Water in Crisis: A Guide to the World’s Fresh Water Resource; Oxford University Press: New York, NY, USA, 1993; ISBN 9780195076271. [Google Scholar]
  18. Inhaber, H. Water Use in Renewable and Conventional Electricity Production. Energy Sources 2004, 26, 309–322. [Google Scholar] [CrossRef]
  19. DOE. Energy Demands on Water Resources: Report to Congress on the Interdependency of Energy and Water; DOE: Washington, DC, USA, 2006. [Google Scholar]
  20. Sovacool, B.K.; Sovacool, K.E. Identifying future electricity–water tradeoffs in the United States. Energy Policy 2009, 37, 2763–2773. [Google Scholar]
  21. Rio Carrillo, A.M.; Frei, C. Water: A key resource in energy production. Energy Policy 2009, 37, 4303–4312. [Google Scholar] [CrossRef]
  22. Wu, M.; Mintz, M.; Wang, M.; Arora, S. Water consumption in the production of ethanol and petroleum gasoline. Environ. Manag. 2009, 44, 981–997. [Google Scholar]
  23. Vassolo, S.; Döll, P. Global-scale gridded estimates of thermoelectric power and manufacturing water use. Water Resour. Res. 2005, 41. [Google Scholar] [CrossRef]
  24. Hoekstra, A.Y.; Hung, P.Q. Virtual Water Trade: A Quantification of Virtual Water Flows between Nations in Relation to International Crop Trade; Value of Water Research Report Series No.11; UNESCO-IHE: Delft, The Netherlands, 2002. [Google Scholar]
  25. Chapagain, A.K.; Hoekstra, A.Y. Water Footprints of Nations; Value of Water Research Report Series No. 16; UNESCO-IHE: Delft, The Netherlands, 2004. [Google Scholar]
  26. Hoekstra, A.Y.; Chapagain, A.K.; Aldaya, M.M.; Mekonnen, M.M. The Water Footprint Assessment Manual: Setting the Global Standard; Earthscan: London, UK, 2011. [Google Scholar]
  27. Macknick, J.; Newmark, R.; Heath, G.; Hallett, K.C. Operational water consumption and withdrawal factors for electricity generating technologies: A review of existing literature. Environ. Res. Lett. 2012, 7, 045802. [Google Scholar] [CrossRef]
  28. Meldrum, J.; Nettles-Anderson, S.; Heath, G.; Macknick, J. Life cycle water use for electricity generation: A review and harmonization of literature estimates. Environ. Res. Lett. 2013, 8, 015031. [Google Scholar] [CrossRef]
  29. Spang, E.S.; Moomaw, W.R.; Gallagher, K.S.; Kirshen, P.H.; Marks, D.H. The water consumption of energy production: An international comparison. Environ. Res. Lett. 2014, 9, 105002. [Google Scholar] [CrossRef]
  30. Hoekstra, A.Y. Personal Website. 2020. Available online: http://www.ayhoekstra.nl/ (accessed on 15 July 2020).
  31. Gerbens-Leenes, P.W.; Hoekstra, A.Y.; Van der Meer, T. The water footprint of energy from biomass: A quantitative assessment and consequences of an increasing share of bio-energy in energy supply. Ecol. Econ. 2009, 68, 1052–1060. [Google Scholar] [CrossRef]
  32. Hoekstra, A.Y.; Gerbens-Leenes, W.; Van der Meer, T.H. The water footprint of Jatropha curcas under poor growing conditions. Proc. Natl. Acad. Sci. USA 2009, 106, E119. [Google Scholar] [CrossRef] [PubMed] [Green Version]
  33. European Commission, 2020. Biofuels. Available online: https://ec.europa.eu/energy/topics/renewable-energy/biofuels/overview_en (accessed on 16 June 2020).
  34. Holmatov, B.; Hoekstra, A.Y.; Krol, M.S. Land, water and carbon footprints of circular bioenergy production systems. Renew. Sustain. Energy Rev. 2019, 111, 224–235. [Google Scholar] [CrossRef]
  35. Fischer, G.; Hizsnyik, E.; Prieler, S.; Shah, M.; Van Velthuizen, H. Biofuels and Food Security; International Institute for Applied Systems Analysis (IIASA): Laxenburg, Austria, 2009. [Google Scholar]
  36. Schyns, J.F.; Vanham, D. The Water Footprint of Wood for Energy Consumed in the European Union. Water 2019, 11, 206. [Google Scholar] [CrossRef] [Green Version]
  37. Das, K.; Gerbens-Leenes, P.W.; Nonhebel, S. The water footprint of food and cooking fuel in a developing country, The case study of self sufficient rural India. J. Clean. Prod. 2020. under review. [Google Scholar]
  38. Menetrez, M.Y. An overview of algae biofuel production potential and environmental impact. Environ. Sci. Technol. 2012, 46, 7073–7085. [Google Scholar]
  39. Singh, A.; Nigam, P.S.; Murphy, J.D. Renewable fuels from algae: An answer to debatable land based fuels. Bioresour. Technol. 2011, 102, 10–16. [Google Scholar]
  40. Mekonnen, M.M.; Hoekstra, A.Y. The blue water footprint of electricity from hydropower. Hydrol. Earth Syst. Sci. 2012, 16, 179–187. [Google Scholar] [CrossRef] [Green Version]
  41. Bakken, T.H.; Killingtveit, Å.; Engeland, K.; Alfredsen, K.; Harby, A. Water consumption from hydropower plants—Review of published estimates and an assessment of the concept. Hydrol. Earth Syst. Sci. 2013, 17, 3983–4000. [Google Scholar] [CrossRef] [Green Version]
  42. Gerbens-Leenes, W.; Hoekstra, A.Y. The water footprint of biofuel-based transport. Energy Environ. Sci. 2011, 4, 2658–2668. [Google Scholar] [CrossRef]
  43. Gerbens-Leenes, P.W.; Holtz, K. Consequences of transport low-carbon transitions and the carbon, land and water footprints of different fuel options in The Netherlands. Water 2020, 12, 1968. [Google Scholar] [CrossRef]
  44. International Energy Agency (IEA). World Energy Outlook 2012; IEA: Paris, France, 2012; ISBN 978-92-64-97300-8. Available online: https://www.iea.org/reports/world-energy-outlook-2012 (accessed on 12 October 2020).
  45. Mekonnen, M.M.; Gerbens-Leenes, P.W.; Hoekstra, A.Y. Future electricity: The challenge of reducing both carbon and water footprint. Sci. Total Environ. 2016. [Google Scholar] [CrossRef] [PubMed] [Green Version]
  46. Vermeulen, S.J.; Aggarwal, P.K.; Ainslie, A.; Angelone, C.; Campbell, B.M.; Challinor, A.J.; Hansen, J.W.; Ingram, J.S.I.; Jarvis, A.; Kristjanson, P.; et al. Options for support to agriculture and food security under climate change. Environ. Sci. Policy 2012, 15, 136–144. [Google Scholar] [CrossRef]
  47. Vaca-Jiménez, S.; Gerbens-Leenes, P.W.; Nonhebel, S. The monthly dynamics of blue water footprints and electricity generation of four types of hydropower plants in Ecuador. Sci. Total Environ. 2020, 713, 136579. [Google Scholar] [CrossRef] [PubMed]
  48. Zhao, D.; Liu, J. A new approach to assessing the water footprint of hydroelectric power based on allocation of water footprints among reservoir ecosystem services. Phys. Chem. Earth Parts A/B/C 2015, 79–82, 40–46. [Google Scholar] [CrossRef] [Green Version]
  49. Hogeboom, R.J.; Knook, L.; Hoekstra, A.Y. The blue water footprint of the world’s artificial reservoirs for hydroelectricity, irrigation, residential and industrial water supply, flood protection, fishing and recreation. Adv. Water Resour. 2018, 113, 285–294. [Google Scholar] [CrossRef]
  50. Wöhler, L.; Niebaum, G.; Krol, M.; Hoekstra, A.Y. The grey water footprint of human and veterinary pharmaceuticals. Water Res. X 2020, 7, 100044. [Google Scholar] [CrossRef]
Figure 1. Water footprints (WFs) of biofuels from the main sugar, starch and oil crops (sugar cane, sugar beet, maize and rapeseed) for a selection of countries with large WF differences. The figure also gives the global average WFs (Source [6,7]).
Water 12 02844 g001
Figure 2. WFs for ethanol and pyrolysis oil from some cellulosic feedstocks, including crop residues and Miscanthus (source: Mathioudakis et al. [12]).
Water 12 02844 g002
Figure 3. WFs of wood (source: Schyns et al. [14]; Das et al. [37]).
Water 12 02844 g003
Figure 4. Blue water footprints of biodiesel from algae from seven locations and two production technologies (source: Gerbens-Leenes et al. [13]; PBR is photo bioreactor).
Water 12 02844 g004
Figure 5. Blue water footprints of electricity form wind, photovoltaics (PVs), geothermal, natural gas, shale gas, traditional and unconventional oil, nuclear, lignite, coal and concentrated solar power (CSP; source: Mekonnen et al. [4]).
Water 12 02844 g005
Figure 6. Blue water footprints of hydropower for four hydropower types in Ecuador and the global average (source: Vaca-Jimenez et al. [5]; Mekonnen and Hoekstra [40]).
Water 12 02844 g006

