Optimal Energy Recovery from Water Distribution Systems Using Smart Operation Scheduling


Abstract
:1. Introduction
2. Materials and Methods
2.1. Hydrodynamic Simulation of Water Distribution System
2.2. Optimization Model
2.3. Smart Seeding of the Genetic Algorithm
3. Applications
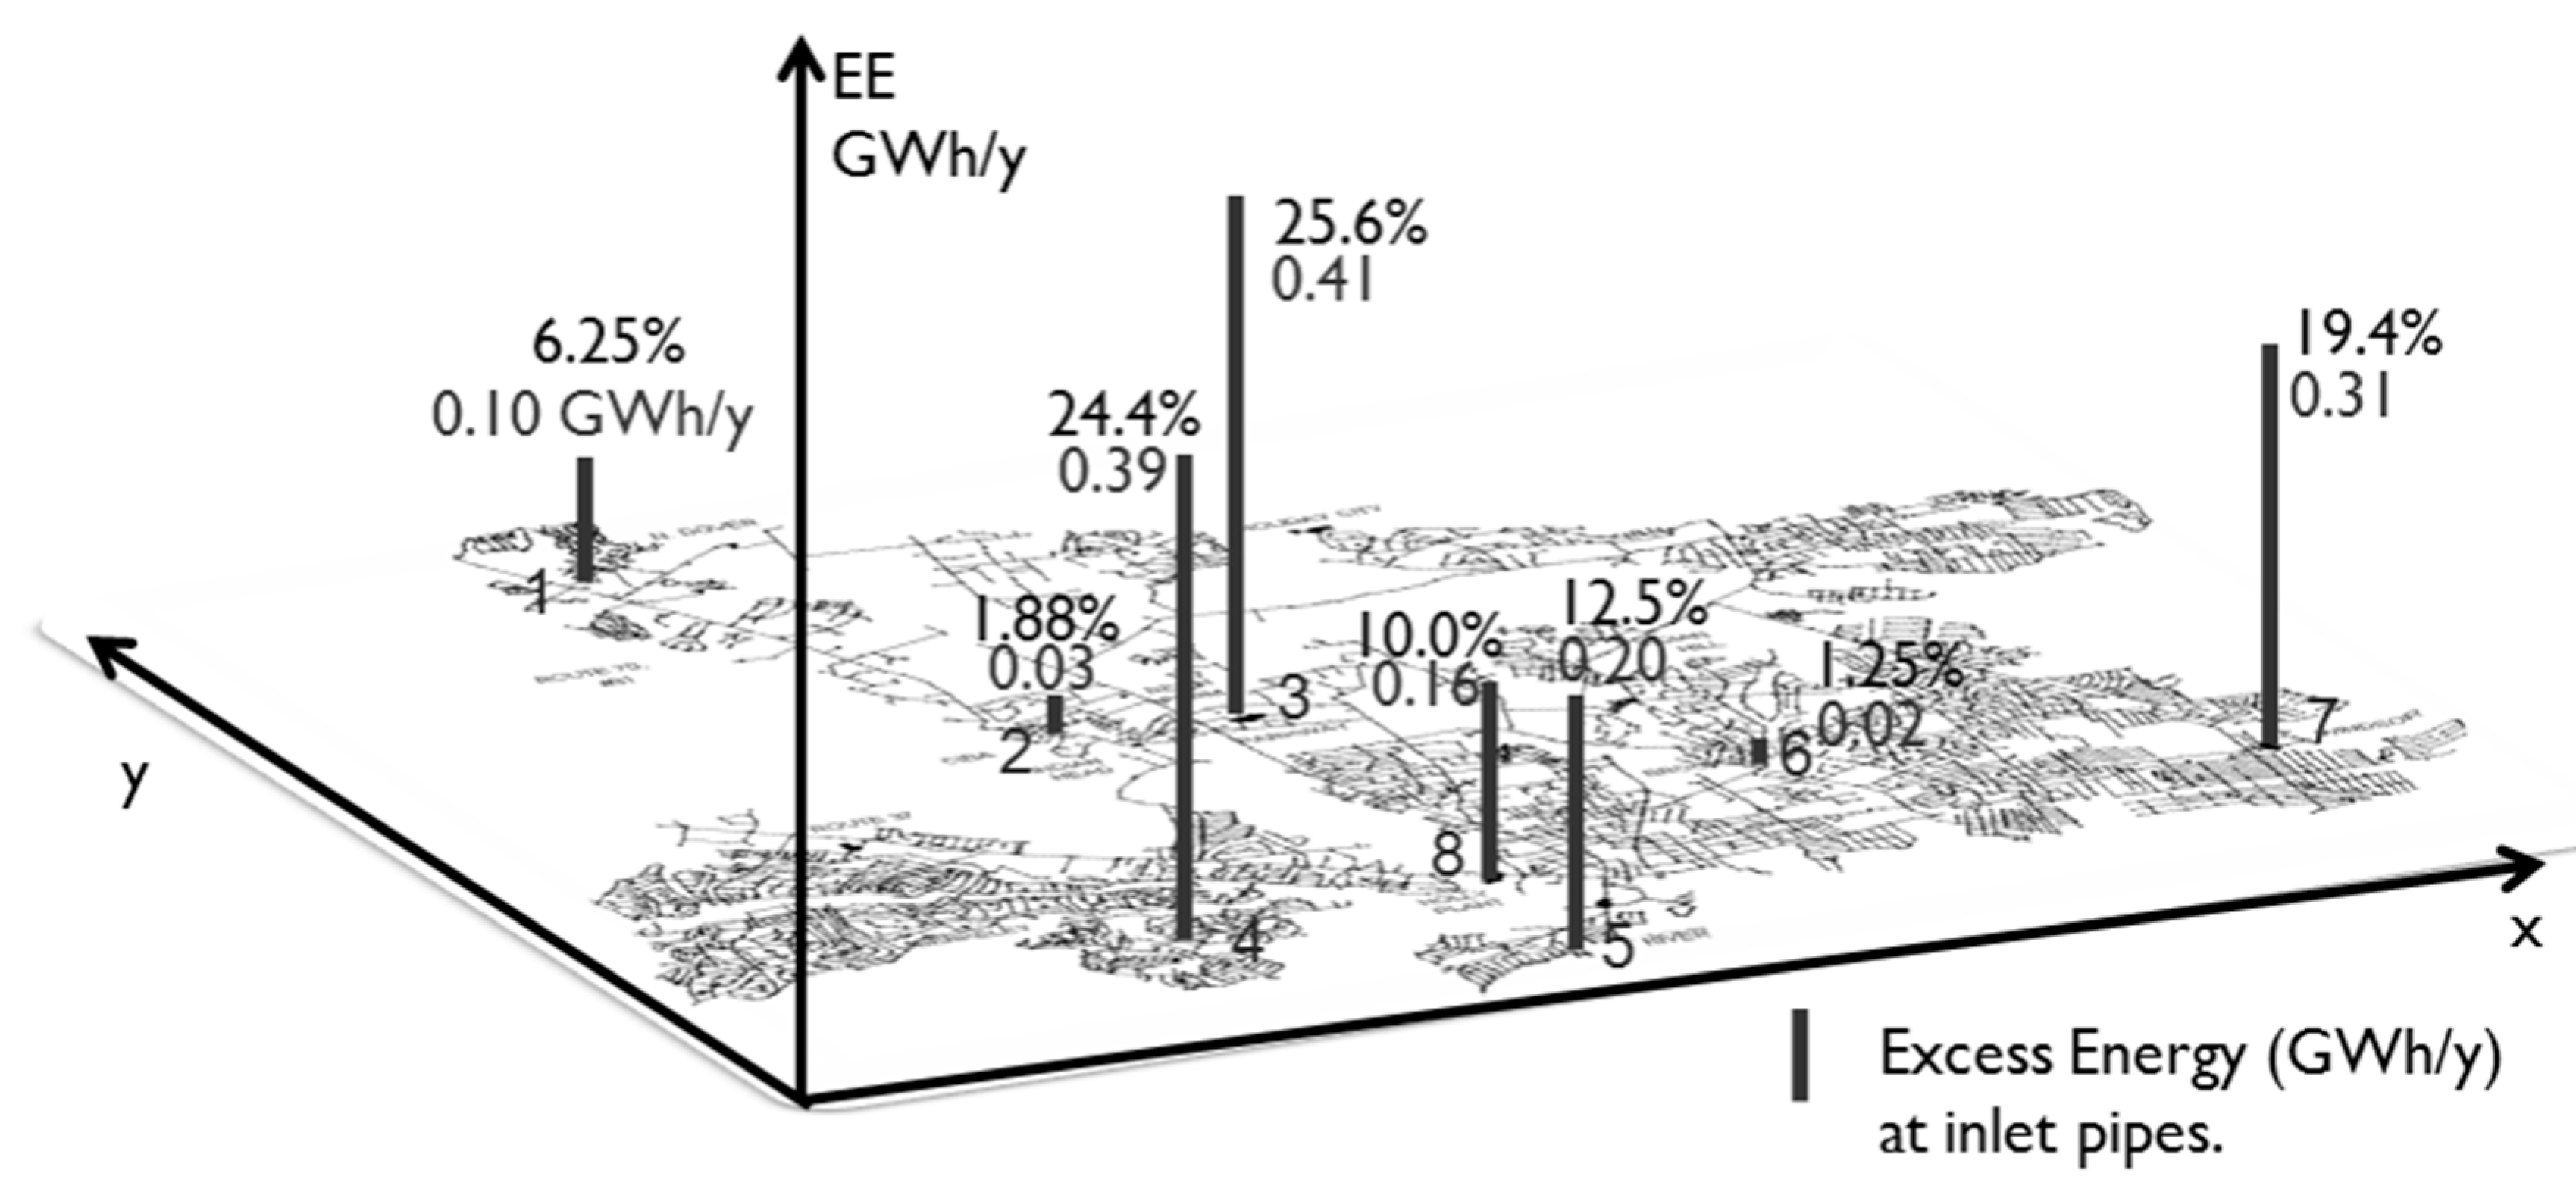
3.1. Study Area
3.2. Gravity-Driven Water Distribution System
4. Results
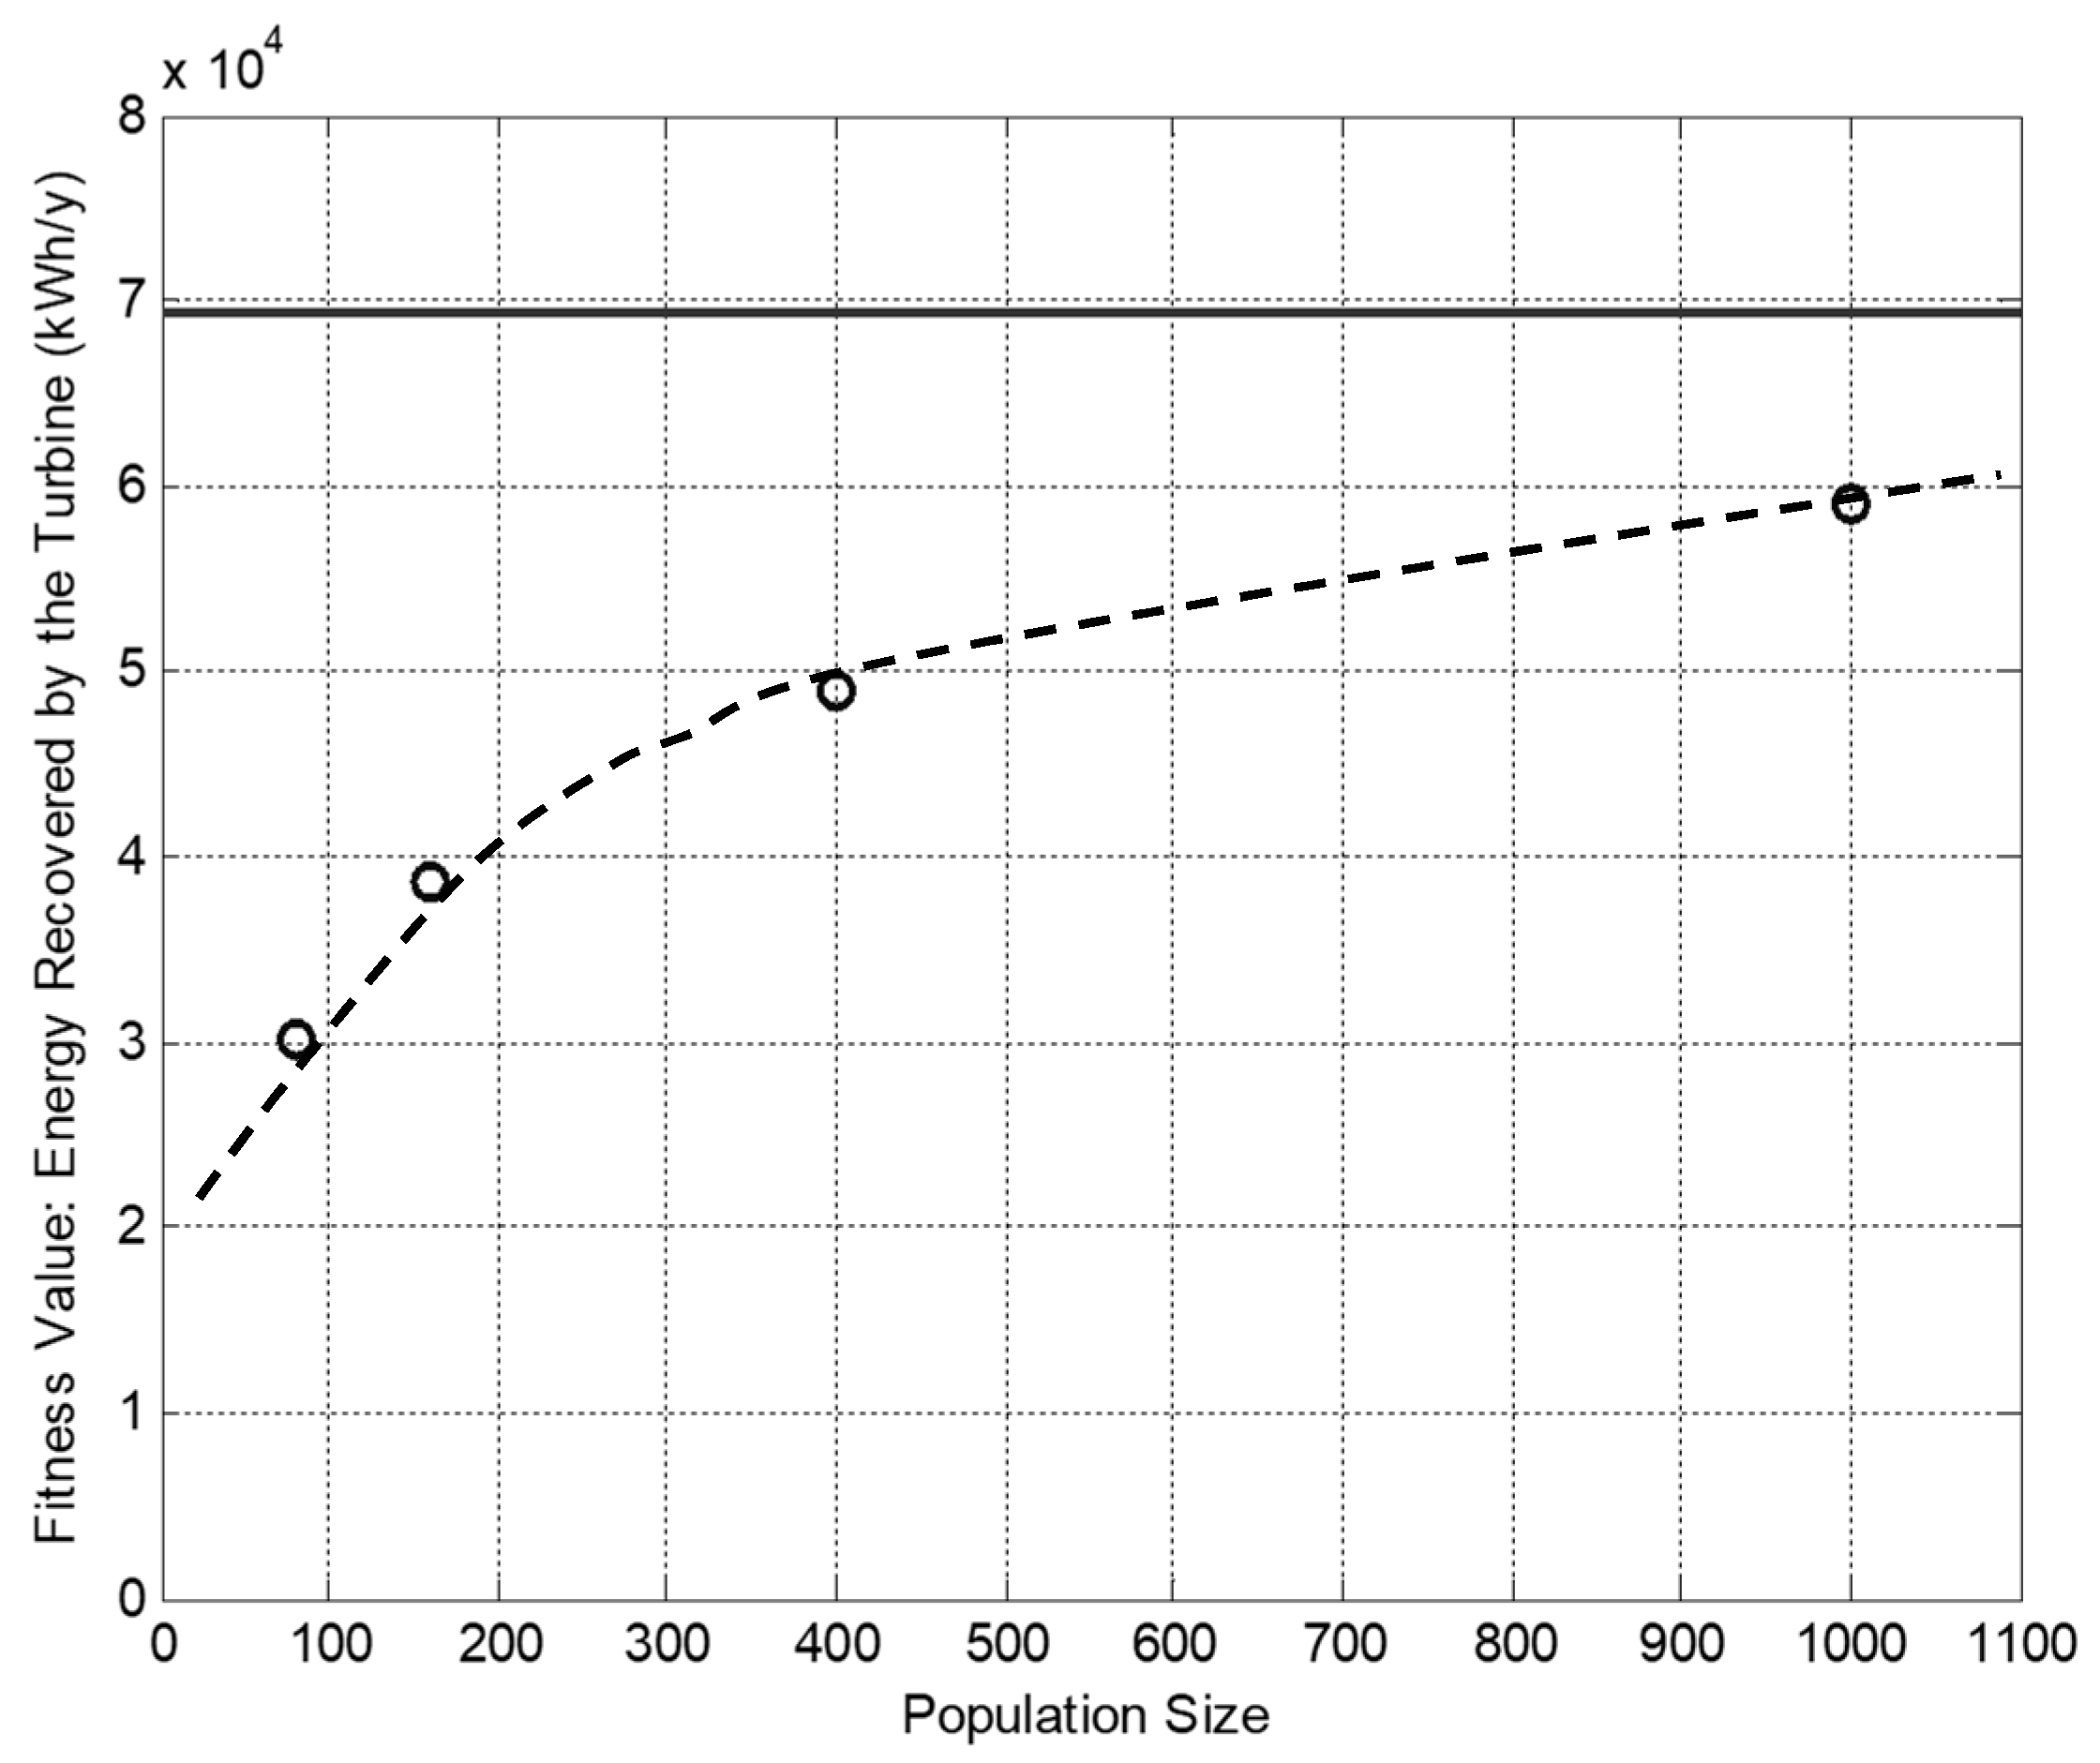
4.1. Smart Seed versus Non-Seeded GA Solutions and the Population Size
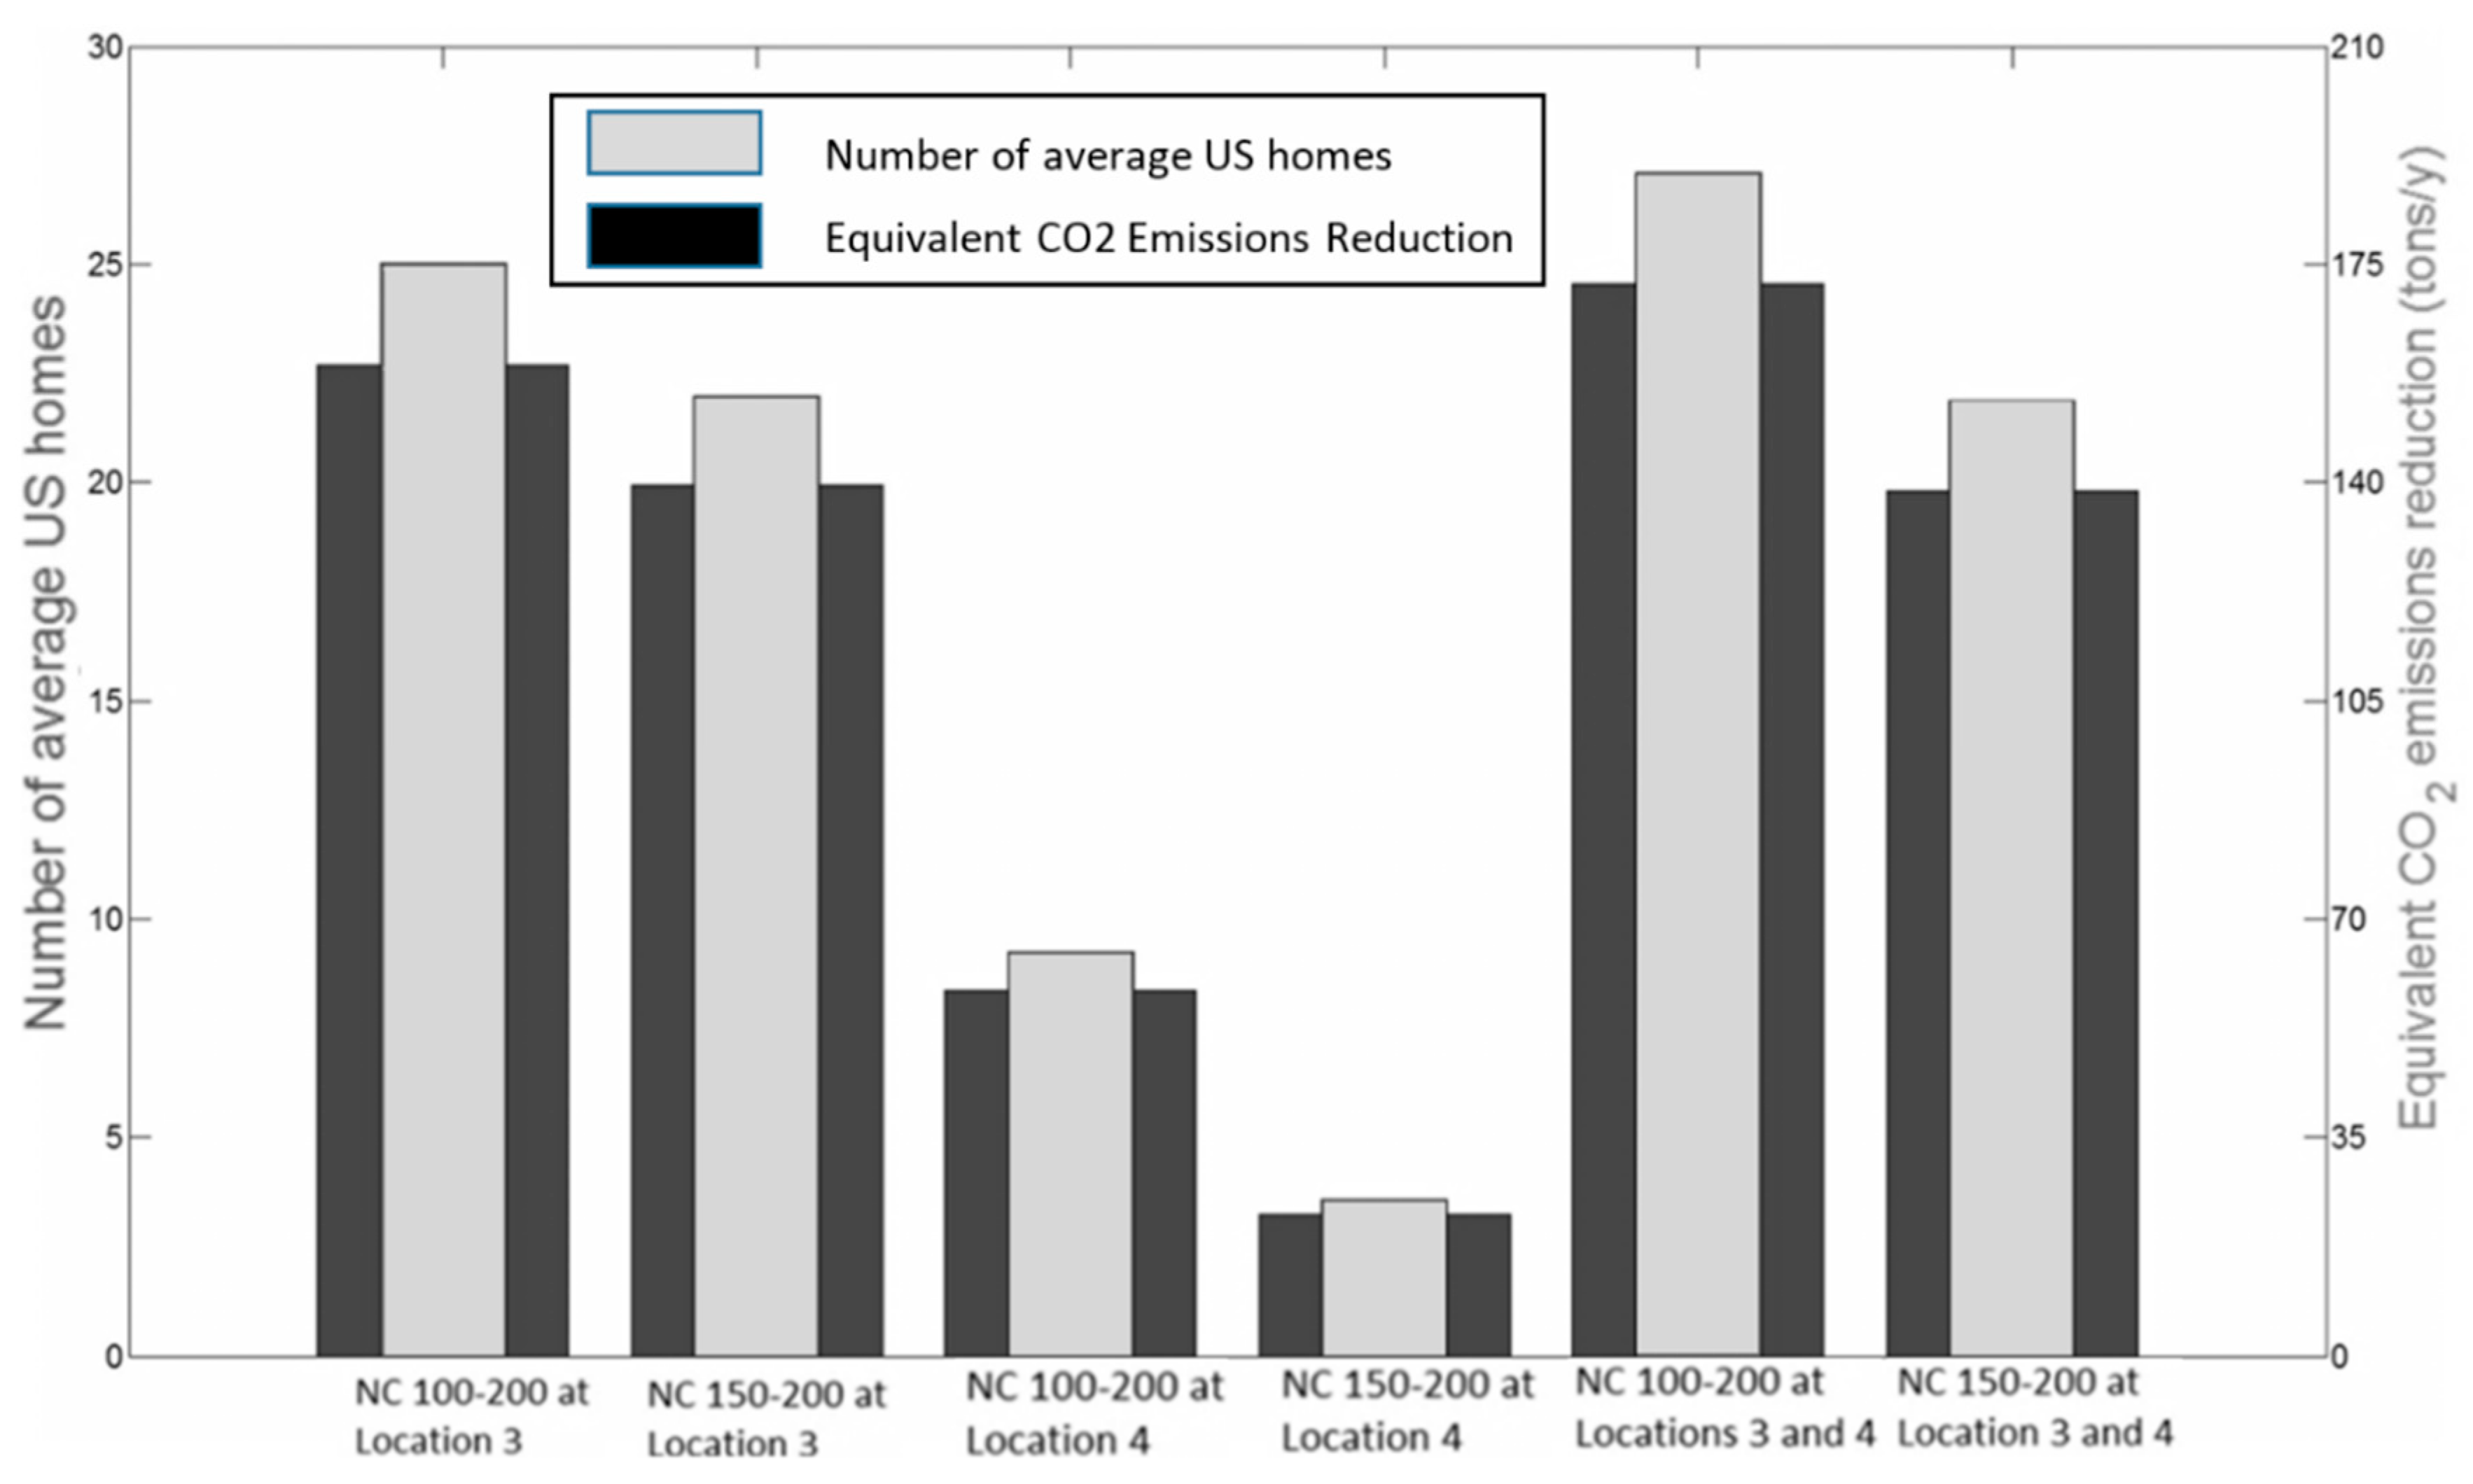
4.2. Pump-Driven Network
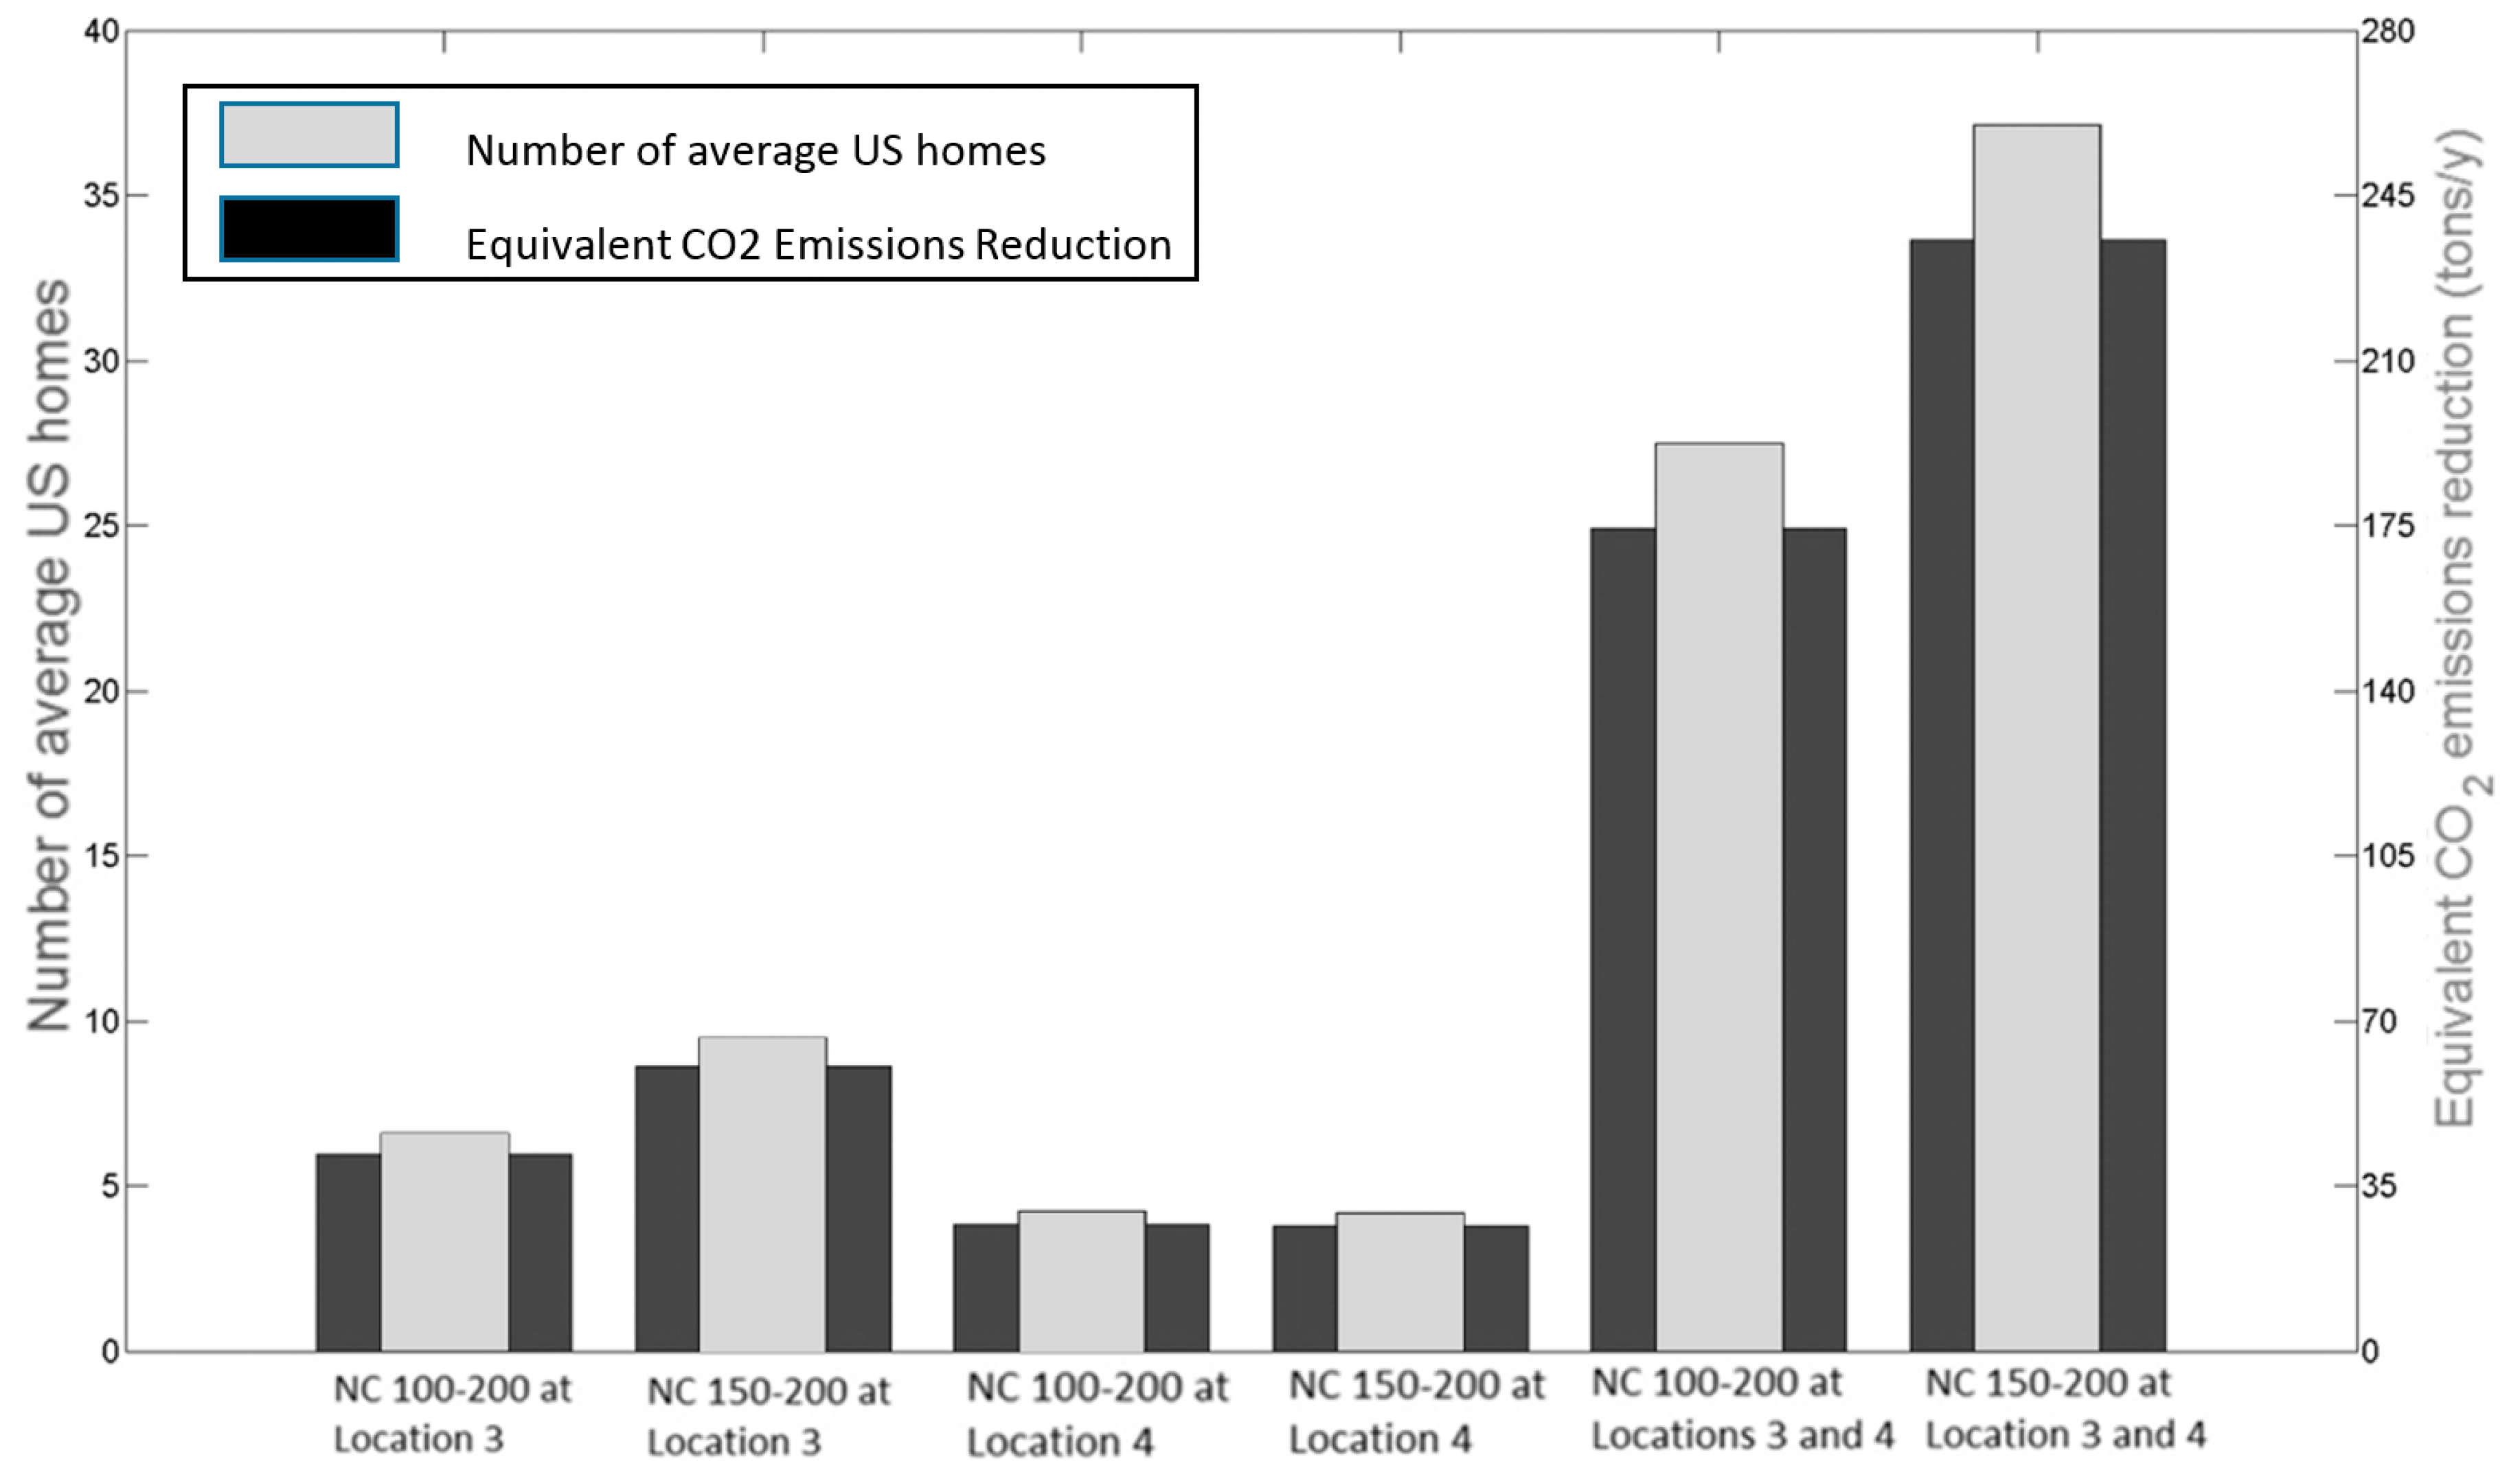
4.3. Gravity-Driven Network
5. Conclusions
Author Contributions
Funding
Conflicts of Interest
References
- Afshar, A.; Benjemaa, F.; Marino, M.A. Optimization of Hydropower Plant Integration in Water-Supply System. Water Resour. Plan. Manag. J. ASCE 1990, 116, 665–675. [Google Scholar] [CrossRef]
- Ramos, H.; Covas, D.; Araujo, L.; Mello, M. Available Energy Assessment in Water Supply Systems. In Proceedings of the XXXI IAHR Congress, Seoul, Korea, 11–16 September 2005. [Google Scholar]
- Giugni, M.; Fontan, N.; Portolano, D. Energy Saving Policy in Water Distribution Networks. In Proceedings of the International Conference on Renewable Energies and Power Quality (ICREPQ’09), Valencia, Spain, 15–17 April 2009. [Google Scholar]
- Bieri, M.; Boillat, J.-L.; Dubois, J. Economic Evaluation of Turbining Potential in Drinking Water Supply Networks. In Proceedings of the Hidroenergia 2010, Lausanne, Switzerland, 16–19 June 2010. [Google Scholar]
- Soffia, C.; Miotto, F.; Poggi, D.; Claps, P. Hydropower potential from the drinking water systems of the Piemonte region (Italy). In Proceedings of the 4th International Conference on Sustainable Energy & Environmental Protection, Bari, Italy, 29 June–2 July 2010. [Google Scholar]
- Pérez-Sánchez, M.; Sánchez-Romero, F.J.; Ramos, H.M.; López-Jiménez, P.A. Energy Recovery in Existing Water Networks: Towards Greater Sustainability. Water 2017, 9, 97. [Google Scholar] [CrossRef]
- Fontana, N.; Giugni, M.; Portolano, D. Losses Reduction and Energy Production in Water-Distribution Networks. J. Water Resour. Plan. Manag. 2012, 138, 237–244. [Google Scholar] [CrossRef]
- Colombo, A.; Kleiner, Y. Energy recovery in water distribution systems using microturbines. In Proceedings of the Probabilistic Methodologies in Water and Wastewater Engineering, Toronto, ON, Canada, 23–27 September 2011. [Google Scholar]
- Giugni, M.; Nicola, F.; Antonio, R. Optimal location of PRVs and turbines in water distribution systems. J. Water Resour. Plan. Manag. 2013, 140. [Google Scholar] [CrossRef]
- Telci Ilker, T. Optimal Water Quality Management in Surface Water Systems and Energy Recovery in Water Distribution Networks. Ph.D. Thesis, Georgia Institute of Technology, Atlanta, GA, USA, December 2008. [Google Scholar]
- McNabola, A.; Coughlan, P.; Corcoran, L.; Power, C.; Williams, A.P.; Harris, I.; Styles, D. Energy recovery in the water industry using micro-hydropower: An opportunity to improve sustainability. Water Policy 2014, 16, 168–183. [Google Scholar] [CrossRef]
- Vilanova, M.R.N.; Balestieri, J.A.P. Hydropower recovery in water supply systems: Models and case study. Energy Convers. Manag. 2014, 84, 414–426. [Google Scholar] [CrossRef]
- Corcoran, L.; Aonghus, M.; Paul, C. Optimization of water distribution networks for combined hydropower energy recovery and leakage reduction. J. Water Resour. Plan. Manag. 2015, 142, 142. [Google Scholar] [CrossRef]
- Fecarotta, O.; Aonghus, M. Optimal location of pump as turbines (PATs) in water distribution networks to recover energy and reduce leakage. Water Resour. Manag. 2017, 31, 31–5043. [Google Scholar] [CrossRef]
- Carravetta, A.; Fecarotta, O.; Ramos, H.M. A new low-cost installation scheme of PATs for pico-hydropower to recover energy in residential areas. Renew. Energy 2018, 125, 1003–1014. [Google Scholar] [CrossRef]
- Coelho, B.; Andrade-Campos, A. Energy Recovery in Water Networks: Numerical Decision Support Tool for Optimal Site and Selection of Micro Turbines. J. Water Resour. Plan. Manag. 2018, 144. [Google Scholar] [CrossRef]
- Rossman, L.A. EPANET 2 Users Manual; National Risk Management Research Laboratory, U.S. EPA: Cincinnati, OH, USA, 2000.
- Karci, A. Novelty in the generation of initial population for genetic algorithms. In Lecture Notes in Computer Science, Proceedings of the 8th International Conference on Knowledge-Based and Intelligent Information and Engineering Systems, Wellington, New Zealand, 20–25 September 2004; Negoita, M.G., Howlett, R.J., Jain, L.C., Eds.; Springer: Berlin, Germany, 2004; pp. 268–275. [Google Scholar]
- Maaranen, H.; Miettinen, K.; Makela, M.M. Quasi-random initial population for genetic algorithms. Comput. Math. Appl. 2004, 47, 1885–1895. [Google Scholar] [CrossRef]
- Maaranen, H.; Miettinen, K.; Penttinen, A. On initial populations of a genetic algorithm for continuous optimization problems. J. Glob. Optim. 2007, 37, 405–436. [Google Scholar] [CrossRef]
- Ponterosso, P.; Fox, D.S.J. Heuristically seeded Genetic Algorithms applied to truss optimisation. Eng. Comput. 1999, 15, 345–355. [Google Scholar] [CrossRef]
- Saavedra-Moreno, B.; Salcedo-Sanz, S.; Paniagua-Tineo, A.; Prieto, L.; Portilla-Figueras, A. Seeding evolutionary algorithms with heuristics for optimal wind turbines positioning in wind farms. Renew. Energy 2011, 36, 2838–2844. [Google Scholar] [CrossRef]
- Aral, M.M.; Guan, J.; Maslia, M.L.; Sautner, J.B.; Gillig, R.E.; Reyes, J.J.; Williams, R.C. Optimal reconstruction of historical water supply to a distribution system: A. Methodology. J. Water Health 2004, 2, 123–136. [Google Scholar] [CrossRef] [PubMed]
- Aral, M.M.; Guan, J.; Maslia, M.L.; Sautner, J.B.; Gillig, R.E.; Reyes, J.J.; Williams, R.C. Optimal reconstruction of historical water supply to a distribution system: B. Applications. J. Water Health 2004, 2, 137–156. [Google Scholar] [CrossRef] [PubMed]
- Maslia, M.L.; Sautner, J.B.; Aral, M.M.; Gilling, R.E.; Reyes, J.J.; Williams, R.C. Historical Reconstruction of the Water Distribution System Serving the Dover Township Area, New Jersey: January 1962–December 1996; Agency for Toxic Substances and Disease Registry: Atlanta, GA, USA, 2001.
- Maslia, M.L.; Sautner, J.B.; Aral, M.M.; Reyes, J.J.; Abraham, J.E.; Williams, R.C. Using water-distribution system modeling to assist epidemiologic investigations. Water Resour. Plan. Manag. J. ASCE 2000, 126, 180–198. [Google Scholar] [CrossRef]
- Derakhshan, S.; Nourbakhsh, A. Experimental study of characteristic curves of centrifugal pumps working as turbines in different specific speeds. Exp. Therm. Fluid Sci. 2008, 32, 800–807. [Google Scholar] [CrossRef]
- USEIA. How Much Electricity Does an American Home Use? 2012. Available online: http://www.eia.gov/tools/faqs/faq.cfm?id=97&t=3 (accessed on 26 April 2017).
- USEPA. Calculations and References. 2012. Available online: http://www.epa.gov/cleanenergy/energy-resources/refs.html (accessed on 26 April 2017).


| PAT | ||||
|---|---|---|---|---|
| NC 100–200 | 0.05 | 19.81 | 79 | 7.82 |
| NC 150–200 | 0.13 | 18.22 | 80 | 18.27 |
| Energy Recovery System Configuration | Energy Saving at the Pumps | Energy Recovered by the Micro Turbines | Net Energy Gain |
|---|---|---|---|
| NC 100–200 at location 3 | 223,869 | 30,061 | 253,930 |
| NC 150–200 at location 3 | 152,989 | 70,211 | 223,200 |
| NC 100–200 at location 4 | 13,080 | 80,744 | 93,824 |
| NC 150–200 at location 4 | −27,162 | 63,597 | 36,435 |
| NC 100–200 at locations 3 and 4 | 228,464 | 46,526 | 274,990 |
| NC 150–200 at locations 3 and 4 | 132,681 | 89,209 | 221,890 |
| Energy Recovery System Configuration | Net Energy Gain |
|---|---|
| NC 100–200 at Location 3 | 66,669 |
| NC 150–200 at Location 3 | 96,457 |
| NC 100–200 at Location 4 | 42,757 |
| NC 150–200 at Location 4 | 42,359 |
| NC 100–200 at Locations 3 and 4 | 278,870 |
| NC 150–200 at Locations 3 and 4 | 376,830 |
© 2018 by the authors. Licensee MDPI, Basel, Switzerland. This article is an open access article distributed under the terms and conditions of the Creative Commons Attribution (CC BY) license (http://creativecommons.org/licenses/by/4.0/).
Share and Cite
Telci, I.T.; Aral, M.M. Optimal Energy Recovery from Water Distribution Systems Using Smart Operation Scheduling. Water 2018, 10, 1464. https://doi.org/10.3390/w10101464
Telci IT, Aral MM. Optimal Energy Recovery from Water Distribution Systems Using Smart Operation Scheduling. Water. 2018; 10(10):1464. https://doi.org/10.3390/w10101464
Chicago/Turabian StyleTelci, Ilker T., and Mustafa M. Aral. 2018. "Optimal Energy Recovery from Water Distribution Systems Using Smart Operation Scheduling" Water 10, no. 10: 1464. https://doi.org/10.3390/w10101464